Introduction
Renal cell carcinoma (RCC) is the most common
malignancy arising in the adult kidney. Clear cell renal cell
carcinoma (ccRCC) represents the most frequent subtype (83%) of the
RCC (1). The most striking
phenotypic feature of the ccRCC is its clear cell morphology, which
has been linked to a lipid and glycogen accumulation. Early
diagnosis of ccRCC is associated with a favorable prognosis (5-year
survival rate, ~85%). Unfortunately, ccRCC is often asymptomatic,
with ~30% of patients diagnosed at the metastatic stage when the
prospects for cure are dismal (5-year survival rate, ~9%) (2).
The measurement of biomarkers in blood or tissue
specimens has become an integral component of translational cancer
research, with applications to studies on cancer etiology,
treatment and prognosis, including early cancer detection (3). Diagnosis of the ccRCC is not so
unambiguous, since there are no established serum biomarkers for
the accurate diagnosis of this type of tumors. Reliable diagnostic
biomarkers are urgently required. Accurate classification is
clinically important because kidney tumor subtypes are associated
with different malignant potential, prognosis and optimal therapies
(4).
Many alterations in the normal cellular hemostasis
and metabolism in ccRCC occur in response to a so-called pseudo
hypoxia (the activation of hypoxia-response pathways under normal
oxygen conditions). Clear cell RCC typically exhibits this
phenomenon because of specific molecular alterations. This type of
carcinoma is closely associated with inactivating mutations of the
von Hippel-Lindau tumor suppressor gene that lead to stabilization
of hypoxia inducible factors (HIF-1α and HIF-2α) in both sporadic
and familial forms. Unlike normal cells, cancer cells metabolize
glucose mostly via glycolysis, even in the presence of sufficient
oxygen (5). Malignant cells have
at least 20- to 30-fold higher rate of glycolysis than normal
cells. It is widely accepted that increased glycolytic potential is
one of the hallmarks of cancer (6).
While the Warburg effect may be related to energy,
it is also clear that accumulation of lactate maintains a presiding
influence over the acidic pericellular pH (pHe) circumscribing
aggressive tumors. In turn, the presence of lactate is known to
trigger aggressive forms of malignancy, augment metastases,
chemoresistance and correlate to low survival rates (7).
Since ccRCC is a glycolytic and lipogenic tumor, in
the present study, we focused on an identification of
differentially expressed genes coding for proteins that regulate pH
and drive energetic metabolism in collection of tumors and
patient-matched healthy kidney samples. We aimed to analyze the
common alterations in the ccRCC’s mRNA levels in energy-producing
processes related to the clear cell renal carcinoma and confirm the
important changes observed on mRNA levels by
immunohistochemistry.
Materials and methods
Patient information and tumor
samples
Tumors from kidney of 11 patients (7 males, 4
females) with an average age of 62.2±2.5 years were tested on
changes in the gene expression profile of the energy-producing
metabolism. Part of the unaffected kidney from the same patient was
taken as a corresponding healthy control for the gene profiling.
All samples were stored in RNA later. Of these patients, 9 patients
were suffering from clear cell renal cell carcinoma, 1 patient
suffered from renal oncocytoma and 1 from renal cell B-lymphoma.
From ccRCCs, 1 belongs to the nuclear grade I, 1 was nuclear grade
III and 1 was nuclear grade IV. All others belong to the nuclear
grade II. The ethics committee of the IMPG SAS approved the present
study and verbal consent was obtained from these participants prior
to surgery.
RNA isolation
Tumor and healthy tissues 1–1.5 cm2 in
size were removed from RNA later, cut into smaller pieces and
frozen in liquid nitrogen for 24 h. Tissue was mechanically
disrupted using mortar and pestle in liquid nitrogen. Total RNA was
extracted from homogenized tissues using GeneJET™ RNA Purification
kit (Thermo Fisher Scientific, Waltham, MA, USA) according to the
manufacturer’s instructions. RNA quality was evaluated using
Experion automated electrophoresis system for RNA analysis (Bio-Rad
Laboratories) and RNA quantity was measured using NanoDrop ND 2000
(NanoDrop Technologies, LLC, Wilmington, DE, USA). Total RNA
degradation/quality was determined based on 18S and 28S ratio. RNA
samples, where RQI number (calculated based on 18S/28S ratio) from
both, healthy and tumor tissues from the same patient was above
7.5, were selected for gene expression analysis.
Microarray assays
Total RNA (500 ng) was transcribed into cDNA, both
strands of cDNA were synthesized using (dT) T7-primer. Subsequently
labeling reaction was performed using Cy3-dCTP (healthy tissue
samples) and Cy5-dCTP (tumor samples) to obtained cRNA. For this
purpose, Quick Amp Labeling kit (Agilent Technologies, Santa Clara,
CA, USA) was used. After labeling, samples were purified using
GeneJE™ RNA Purification kit (Thermo Fisher Scientific) to remove
non-incorporated nucleotides. Yield of amplification process and
specific activity were determined and only samples with specific
activity above 8 proceeded to the hybridization step. A total of
300 ng of appropriate labeled healthy tissue samples and tumor
samples were mixed together and cRNA were fragmented by incubation
for 30 min at 60°C using components from Gene Expression
Hybridization kit (Agilent Technologies). Samples were immediately
applied onto SurePrint G3 Human Gene Expression 8×60K v2 Microarray
Slide (Agilent Technologies) and hybridized for 17 h at 65°C by
rotating slide at 10 rpm in Hybridization Oven (Agilent
Technologies). After hybridization two wash steps were performed
(Gene Expression Wash Buffer kit; Agilent Technologies) and slide
was scanned at 2 μm using NimbleGen MS 200 microarray scanner.
Image and data analysis
TIFF multiscan images from NimbleGen MS 200 scanner
were converted using Feature Extraction software 11.5 (Agilent
Technologies), the image processing was performed, and acquired
files with spot intensities for every microarray field
(corresponding to one patient) were imported into GeneSpring 12.6
GX software to analyze gene expression. Significant differences
(fold of expression change ≥2.0) in gene expression were evaluated
for each patient separately (non-averaged) as well as averaged from
all patients. Pathway analysis was performed to revealed molecular
pathways significantly altered in our experiment (P≤0.05). Cluster
analysis was performed using GeneSpring 12.6 GX for a selected set
of genes.
Immunohistochemistry
Dissected tissues were embedded in paraffin
according to the standard histological procedure. Sections (4 μm)
were placed on polylysine-coated slides, dewaxed and rehydrated.
For CA IX detection, the immunostaining procedure was performed on
an automated immunostainer (Dako Autostainer) using the
DakoCytomation EnVision®+ System-HRP (DAB) for use with
mouse primary antibodies according to the manufacturer’s
instructions: a) peroxidase and protein block (10 min each); b)
incubation for 1 h with primary antibody (M75 hybridoma medium
diluted 1:100 in antibody diluent) or PBS (negative control); c)
incubation for 30 min with secondary antibody. Staining was
visualized with DAB solution for 1 min with 3,3′-diaminobenzidine
as a chromogenic substrate. The slides were washed in PBS with 0.1%
Tween-20 for 10 min after step a, twice for 10 min after steps b
and c, and three times in distilled water after visualization with
DAB.
For HK2 and LDHA immunostaining, antigen retrieval
was carried out with citrate buffer, pH 6.0, for 5 min at 125°C
using Pascal pressure chamber (Dako). Deparaffinized sections were
stained with DakoCytomation EnVision®+ System-HRP (DAB)
for use with rabbit primary antibodies. Primary antibody specific
for HXII (1:50; Cell Signaling Technology, Inc., Beverly, MA, USA)
and LDHA (1:400; Cell Signaling Technology) was diluted in antibody
diluent and incubated overnight at 4°C. Staining was visualized
with DAB solution.
All incubations and washings were carried out at
room temperature. Finally, the sections were counterstained with
Mayer’s hematoxylin, washed for 5 min and were mounted in Aquamont
(Merck, Darmstadt, Germany). The stained sections were examined
with Leica DM4500 B microscope and photographed with Leica DFC480
camera.
Results and Discussion
The microarray analysis revealed significant changes
in a variety of metabolism-related pathways in tumors vs. healthy
kidney tissues, thus, suggesting a complex rearrangement of
metabolic processes during tumor development. In the present study,
we focused primarily on the glucose metabolism and its modulation.
Glycolytic pathway belongs to the most modified ones in tumor ccRCC
tissue, compared to the normal kidney tissue
(P=2.5×10⁻⁸; Table I).
Also, expression of the genes participating in the transport of
glucose and other sugars, metal ions and amine compounds was
significantly changed (P=1.4×10⁻⁷; Table I) as described in more detail
further below.
 | Table ISignificantly altered pathways of
energetic metabolism. |
Table I
Significantly altered pathways of
energetic metabolism.
| Pathway | P-value | Altered genes |
|---|
| Glycolysis and
gluconeogenesis | 2.5045212E-8 | SLC2A2, ENO2, G6PC,
PCK1, PC, FBP1, ENO3, PDHB, ALDOC, GOT2, ALDOB, SLC2A3, SLC2A1,
HK3, HK2, PFKP, PGAM1, PGAM2, PKM2, PKLR, LDHA, LDHB, MPC1 |
| Transport of
glucose and other sugars, metal ions and amine compounds | 1.3671912E-7 | GLUT9, SGLT2,
SMIT2, SMIT, NaS1, NaDC3, ZnT1, ZnT2, ZnT8, hZIP5, RHCG, RHBG,
SLC6A19, NAT1
Noradrenaline uptake transporter, SLC6A12,
Sodium dependent dopamine transporter, SLC6A18, URAT1, OCT1, OCT3,
ETT |
| Calcium
regulation |
1.0519273E-6 | PLN, ADCY7, ADCY1,
RGS20, YWHAH, PRKCB1, YWHAE, RGS19, PRKAR2A, ADCY8, PRKCE, PRKCZ,
ADCY9, PRKCA, RGS16, RGS11, RGS10, RGS5, RGS3, RGS1, RGS18, GNGT1,
GRK4, GNG11, CALM1, RYR3, ITPR2, ITPR3, CAMK2B, CAMK2G, SLC8A1,
ATP1A4, ATP1B2, FXYD2, CHRM1, CHRM3, CHRM2, ADRB1, GJA1, GJA3,
GJA5, GJA7, GJB1 |
| Transport of
inorganic cations-anions and amino acids-oligopeptides | 3.492807E-6 | SLC16A10, SLC38A4,
SLC43A1, SLC43A2, SLC6A12, SLC6A18, SLC36A2, SLC6A19, SLC7A1,
SLC1A4, Sodium/hydrogen exchanger 9, solute carrier family 12
member 3, sodium-dependent phosphate transport protein 2C, system N
amino acid transporter 1, sodium-dependent phosphate transport
protein 1 |
| Oxidative
stress |
3.241884E-4 | MAOA, GPX3, NQO1,
UGT1A6, CAT, TXNRD2, MT1X, FOS, SOD2, SOD3, XDH, NOX4 |
| Pyruvate metabolism
and citric acid (TCA) cycle | 4.0590137E-4 | L2HGDH, D2HGDH,
ADHFE1, aconitase 2 mitochondrial |
| Monoamine
transport |
9.3396695E-4 | AMPH, PVRL2,
SLC6A2, ITGB3, CDC25C, TDO2, AGT, SLC6A3, UNC13B, ADORA2A, IL1B,
SLC6A4 |
| Metabolism of
carbohydrates | 0.024873339 | PCK2, SLC25A10,
G6PC, phosphoenolpyruvate carboxykinase 1 (soluble), trehalase,
galactokinase |
Hypoxia and pH
Uncontrolled cell proliferation within a developing
tumor often outstrips its blood supply. Consequently, oxygen
availability declines, but this physiological constrain is not
sufficient to deprive cells of glucose. Prolonged hypoxic state
leads to the stabilization of the hypoxia-inducible transcription
factor 1 (HIF-1α), which helps cells to adapt to stressful
environment by transactivating a broad spectrum of hypoxia-related
proteins (8,9). The major molecular event leading to
the development of ccRCC is an inactivation or loss of the VHL gene
(10–12). VHL protein is part of the
E3-ubiquitin ligase complex that binds to the hypoxia-inducible
factor subunit α (HIF-α) under normoxic conditions and directs it
to proteasomal degradation. Increased levels of the HIF-1 resulting
in upregulation of its target proteins equip ccRCC cells with a
specific set of enzymatic machinery that favors aerobic glycolysis
over oxidative phosphorylation (13). These factors support a shift toward
a more glycolytic metabolism by stabilization of the HIF1α and
inhibition of prolyl hydroxylases. In order to distinguish, whether
tumors of our patients were hypoxic and/or pseudohypoxic, we
evaluated changes in the marker of hypoxia carbonic anhydrase IX
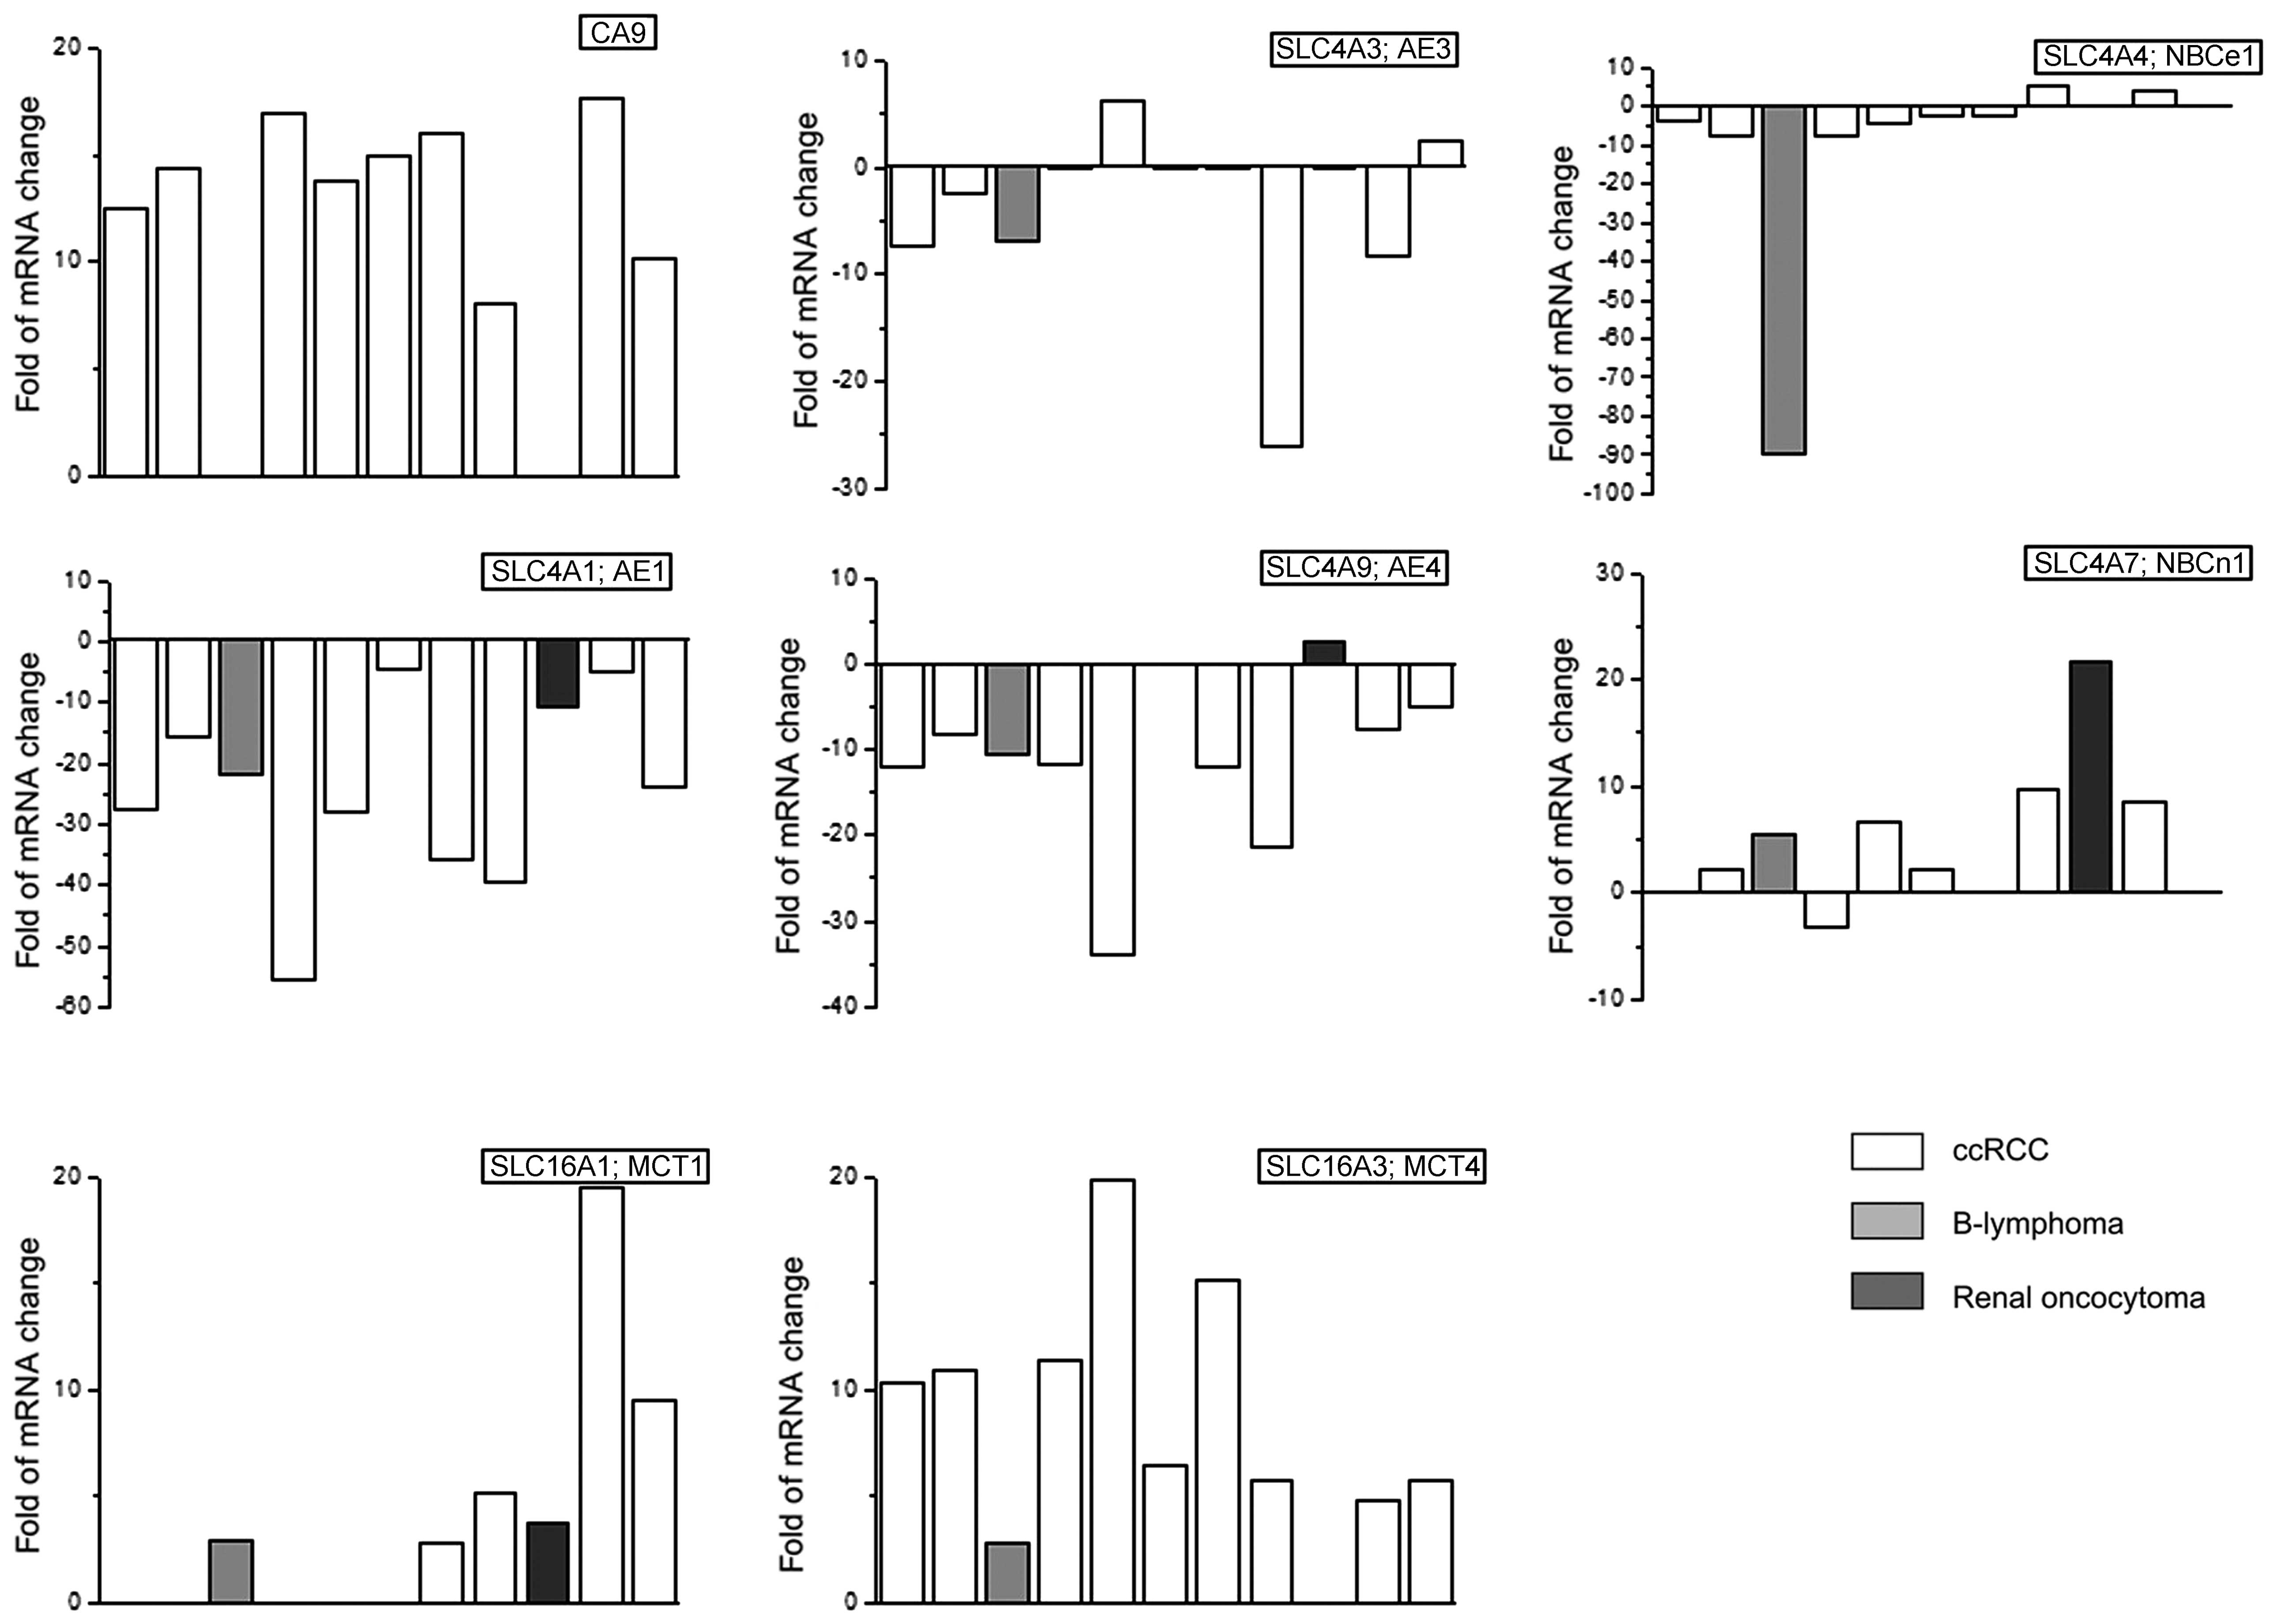
(CA IX) (14). Expression of the
CA IX coding gene was increased in 9 of 11 patients and the average
increase was 12.6±1.3-fold (Fig.
1). The 2 patients with no increase in CA IX expression
suffered from renal oncocytoma (dark gray column) and B-lymphoma
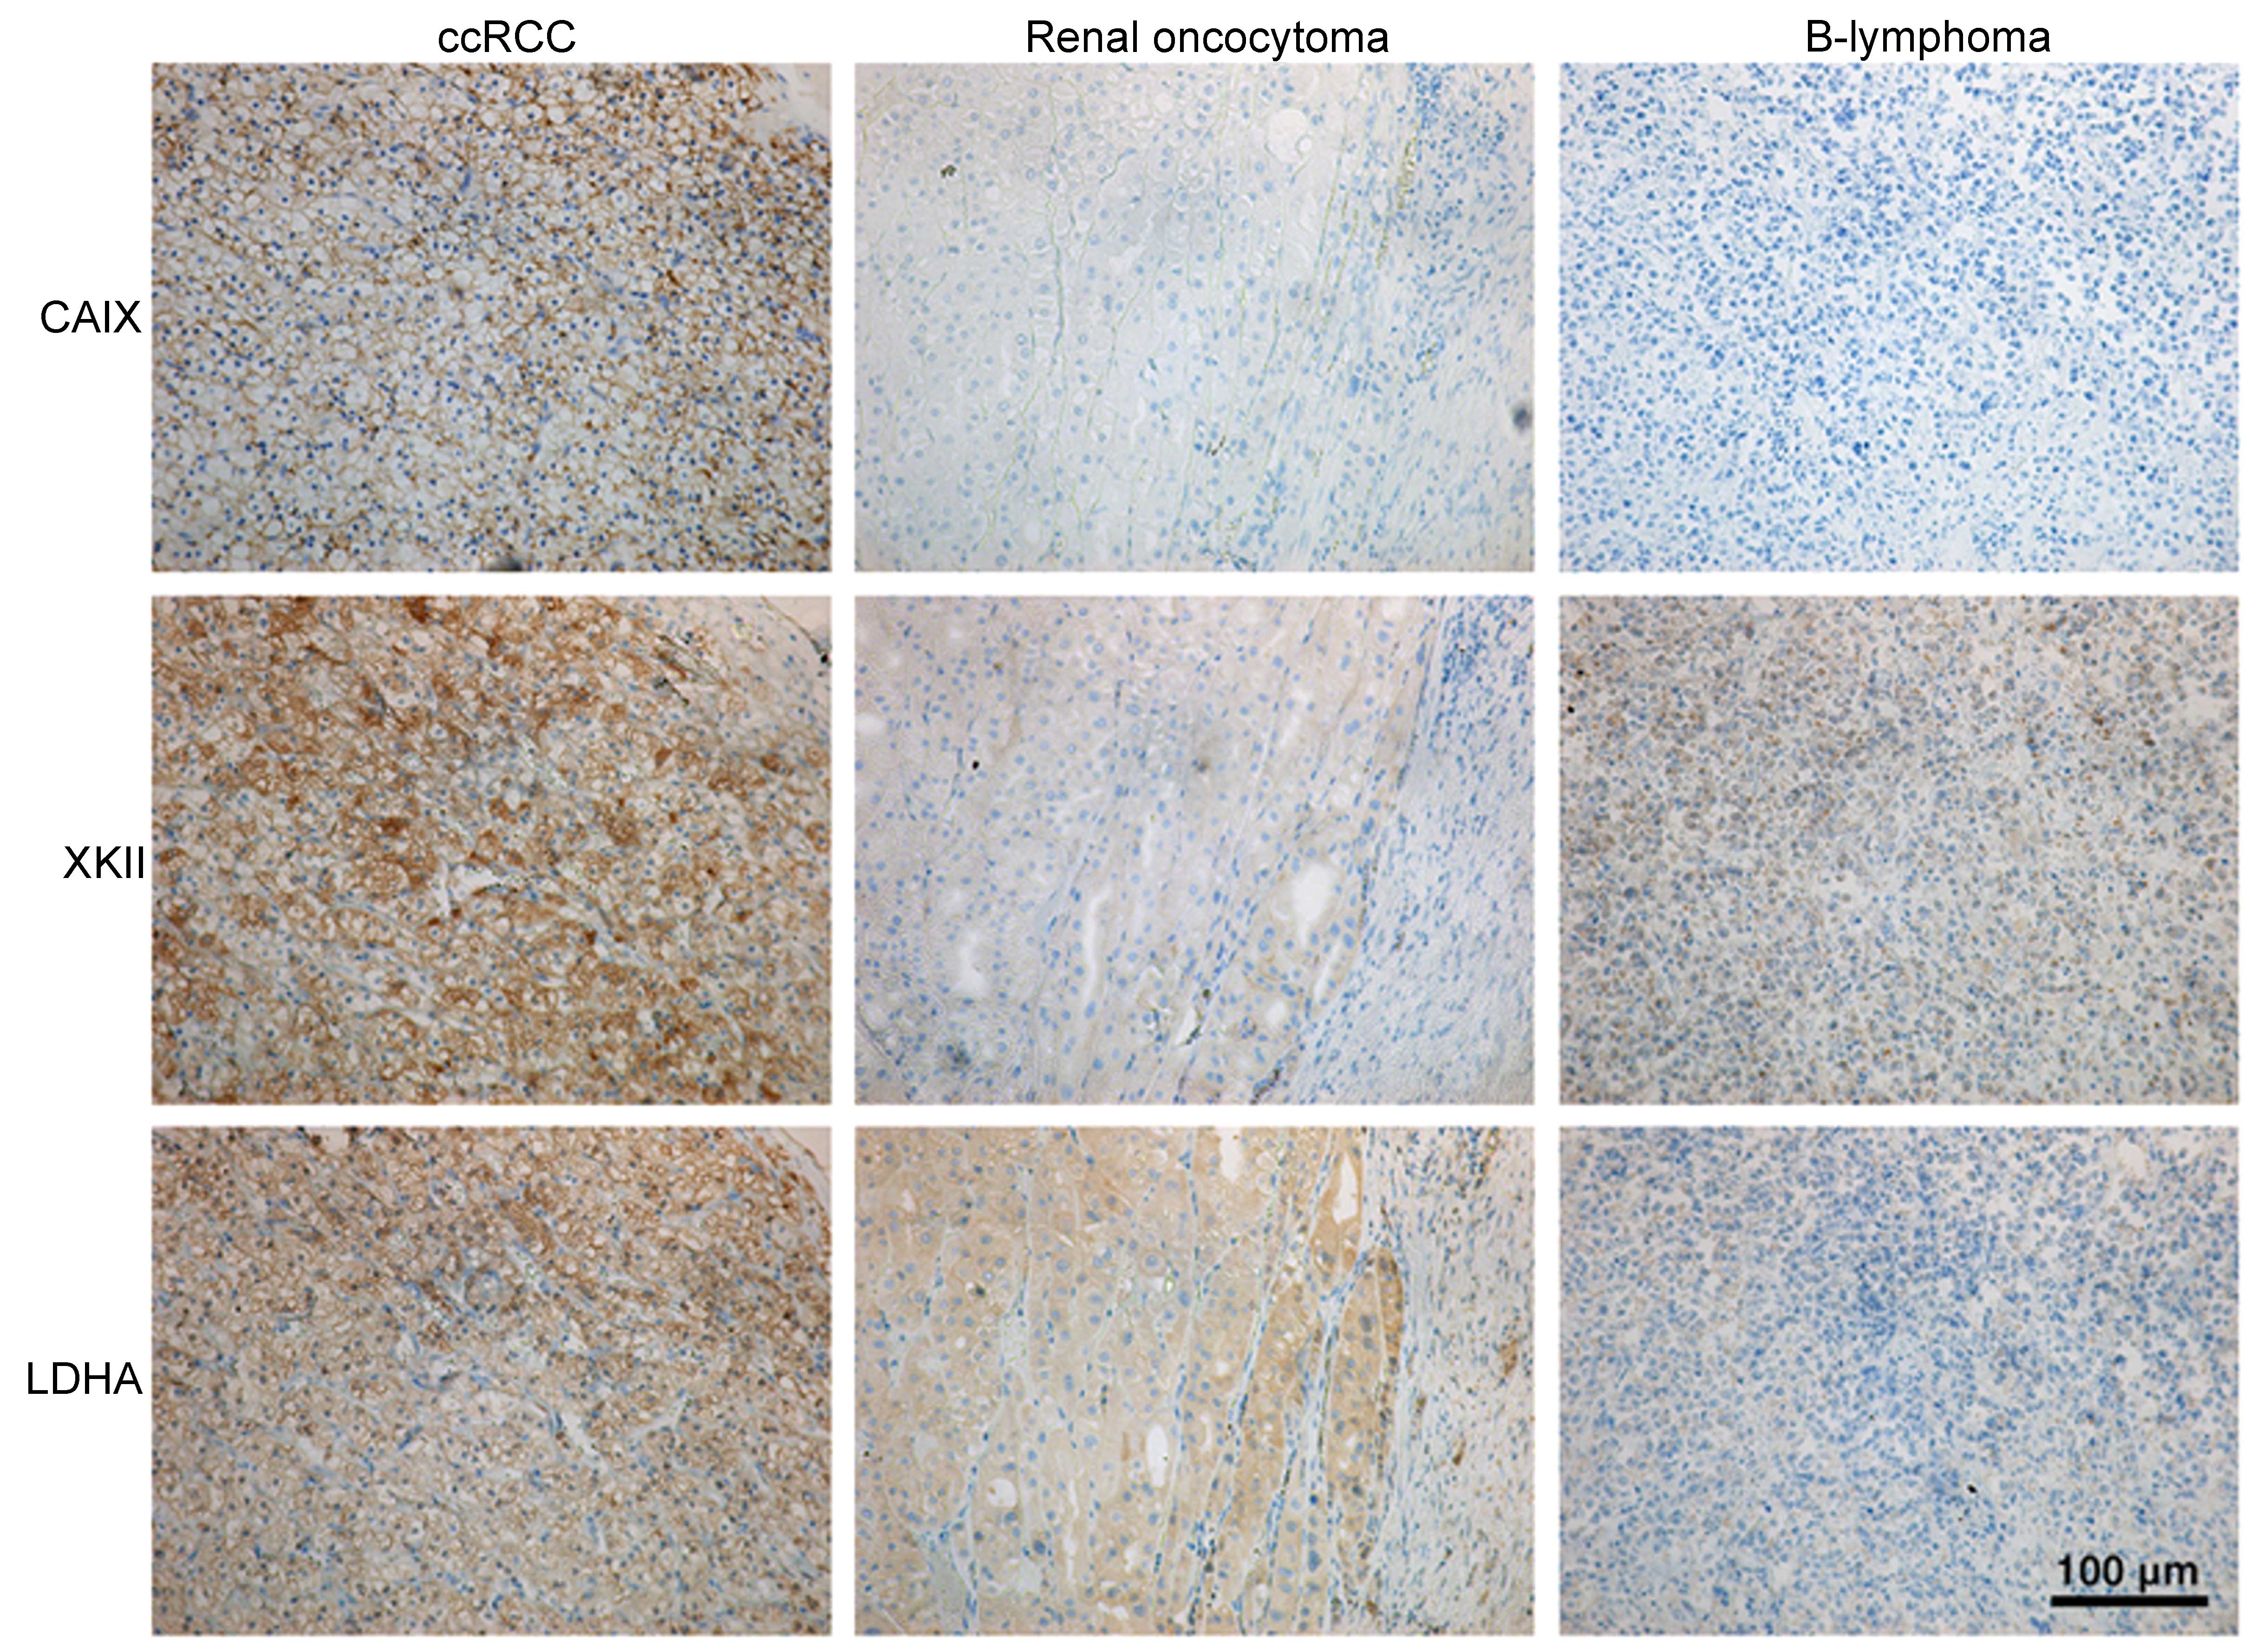
(light gray column), respectively. Moreover, immunohistochemistry
proved increased CAIX staining in ccRCC tumor and no signal in
renal oncocytoma and B-lymphoma (Fig.
3). Increased transcription of the gene coding for CA IX in
ccRCC tumors would suggest that HIF1α is stabilized and active.
Also, this observation is in a clear agreement with the work of
many other authors who suggested that CA IX is one of the best
available markers for the clear cell RCC (15,16).
It is well known that acidification of the tumor
microenvironment often develops due to hypoxia-triggered oncogenic
metabolism, which leads to the extensive production of lactate,
protons and carbon dioxide. Mechanisms of pH regulation in tumor
cells are very complex and intertwined with other cancer-related
processes (17). Acidosis in tumor
microenvironment is compensated by the alkalization of an
intracellular pH in cancer cells through the lactate and proton
export and the bicarbonate import (17). CA IX is a catalytic component of
the bicarbonate import arm, in which it cooperates with bicarbonate
transporters (mainly with sodium-bicarbonate cotransporter NBCe1)
and regulates pH in response to hypoxia or during cell
migration-invasion (18,19). Notably, ccRCC tumors displayed
considerable decrease in expression of the genes encoding
Cl−/HCO3− anion exchangers AE1,
AE3 and AE4, which are considered acid loaders (the most pronounced
decrease was observed in AE1 that is normally expressed in
intercalated cells of the renal collecting ducts (20). This is probably because cancer
cells prefer acid extrusion to acid loading in order to preserve
the accumulation of an intracellular acid). No significant change
was found in the expression of AE2, in contrast to findings of
Karumanchi et al (21), who
proposed AE2 as potential VHL target. Furthermore,
sodium-bicarbonate co-transporters revealed less marked changes.
Expression of NBCe1 was mostly decreased (and this is possibly
compensated by the strongly elevated CA IX), while levels of NBCe1
and NBCn1 were increased (the latter being previously associated
with breast cancer) (Fig. 1).
These data indicate existence of complicated crosstalk between the
components of the pH-regulating bicarbonate transport machinery,
which is clearly deregulated in ccRCC.
Besides bicarbonate import, intracellular and
extracellular pH is dependent on the lactate and proton export.
Lactate is transported from the cells by monocarboxylic acid
transporters (MCT; SLC16A), transmembrane proteins, which can
transport lactate anion across the plasma membrane of tumor cells
in association with proton (22).
MCT1 (SLC16A1) and MCT4 (SLC16A3) are two isoforms most relevant
for cancer physiology. From our cohort, all patients with diagnosed
ccRCCs have increased expression of the MCT4 (10.0±1.7-fold), but
only 4 of them possess increased MCT1 (Fig. 1). Expression of the MCT4 was
observed in many tumors, e.g. triple-negative breast (23), prostate cancer (24) and is always associated with poor
prognosis.
Glucose transporters
HIF1α is known to regulate expression of several
enzymes of the glycolytic pathway. To increase the glucose uptake
as a way to compensate low yield of ATP from glycolysis, HIF1α
promotes the overexpression of the glucose transporter of type 1
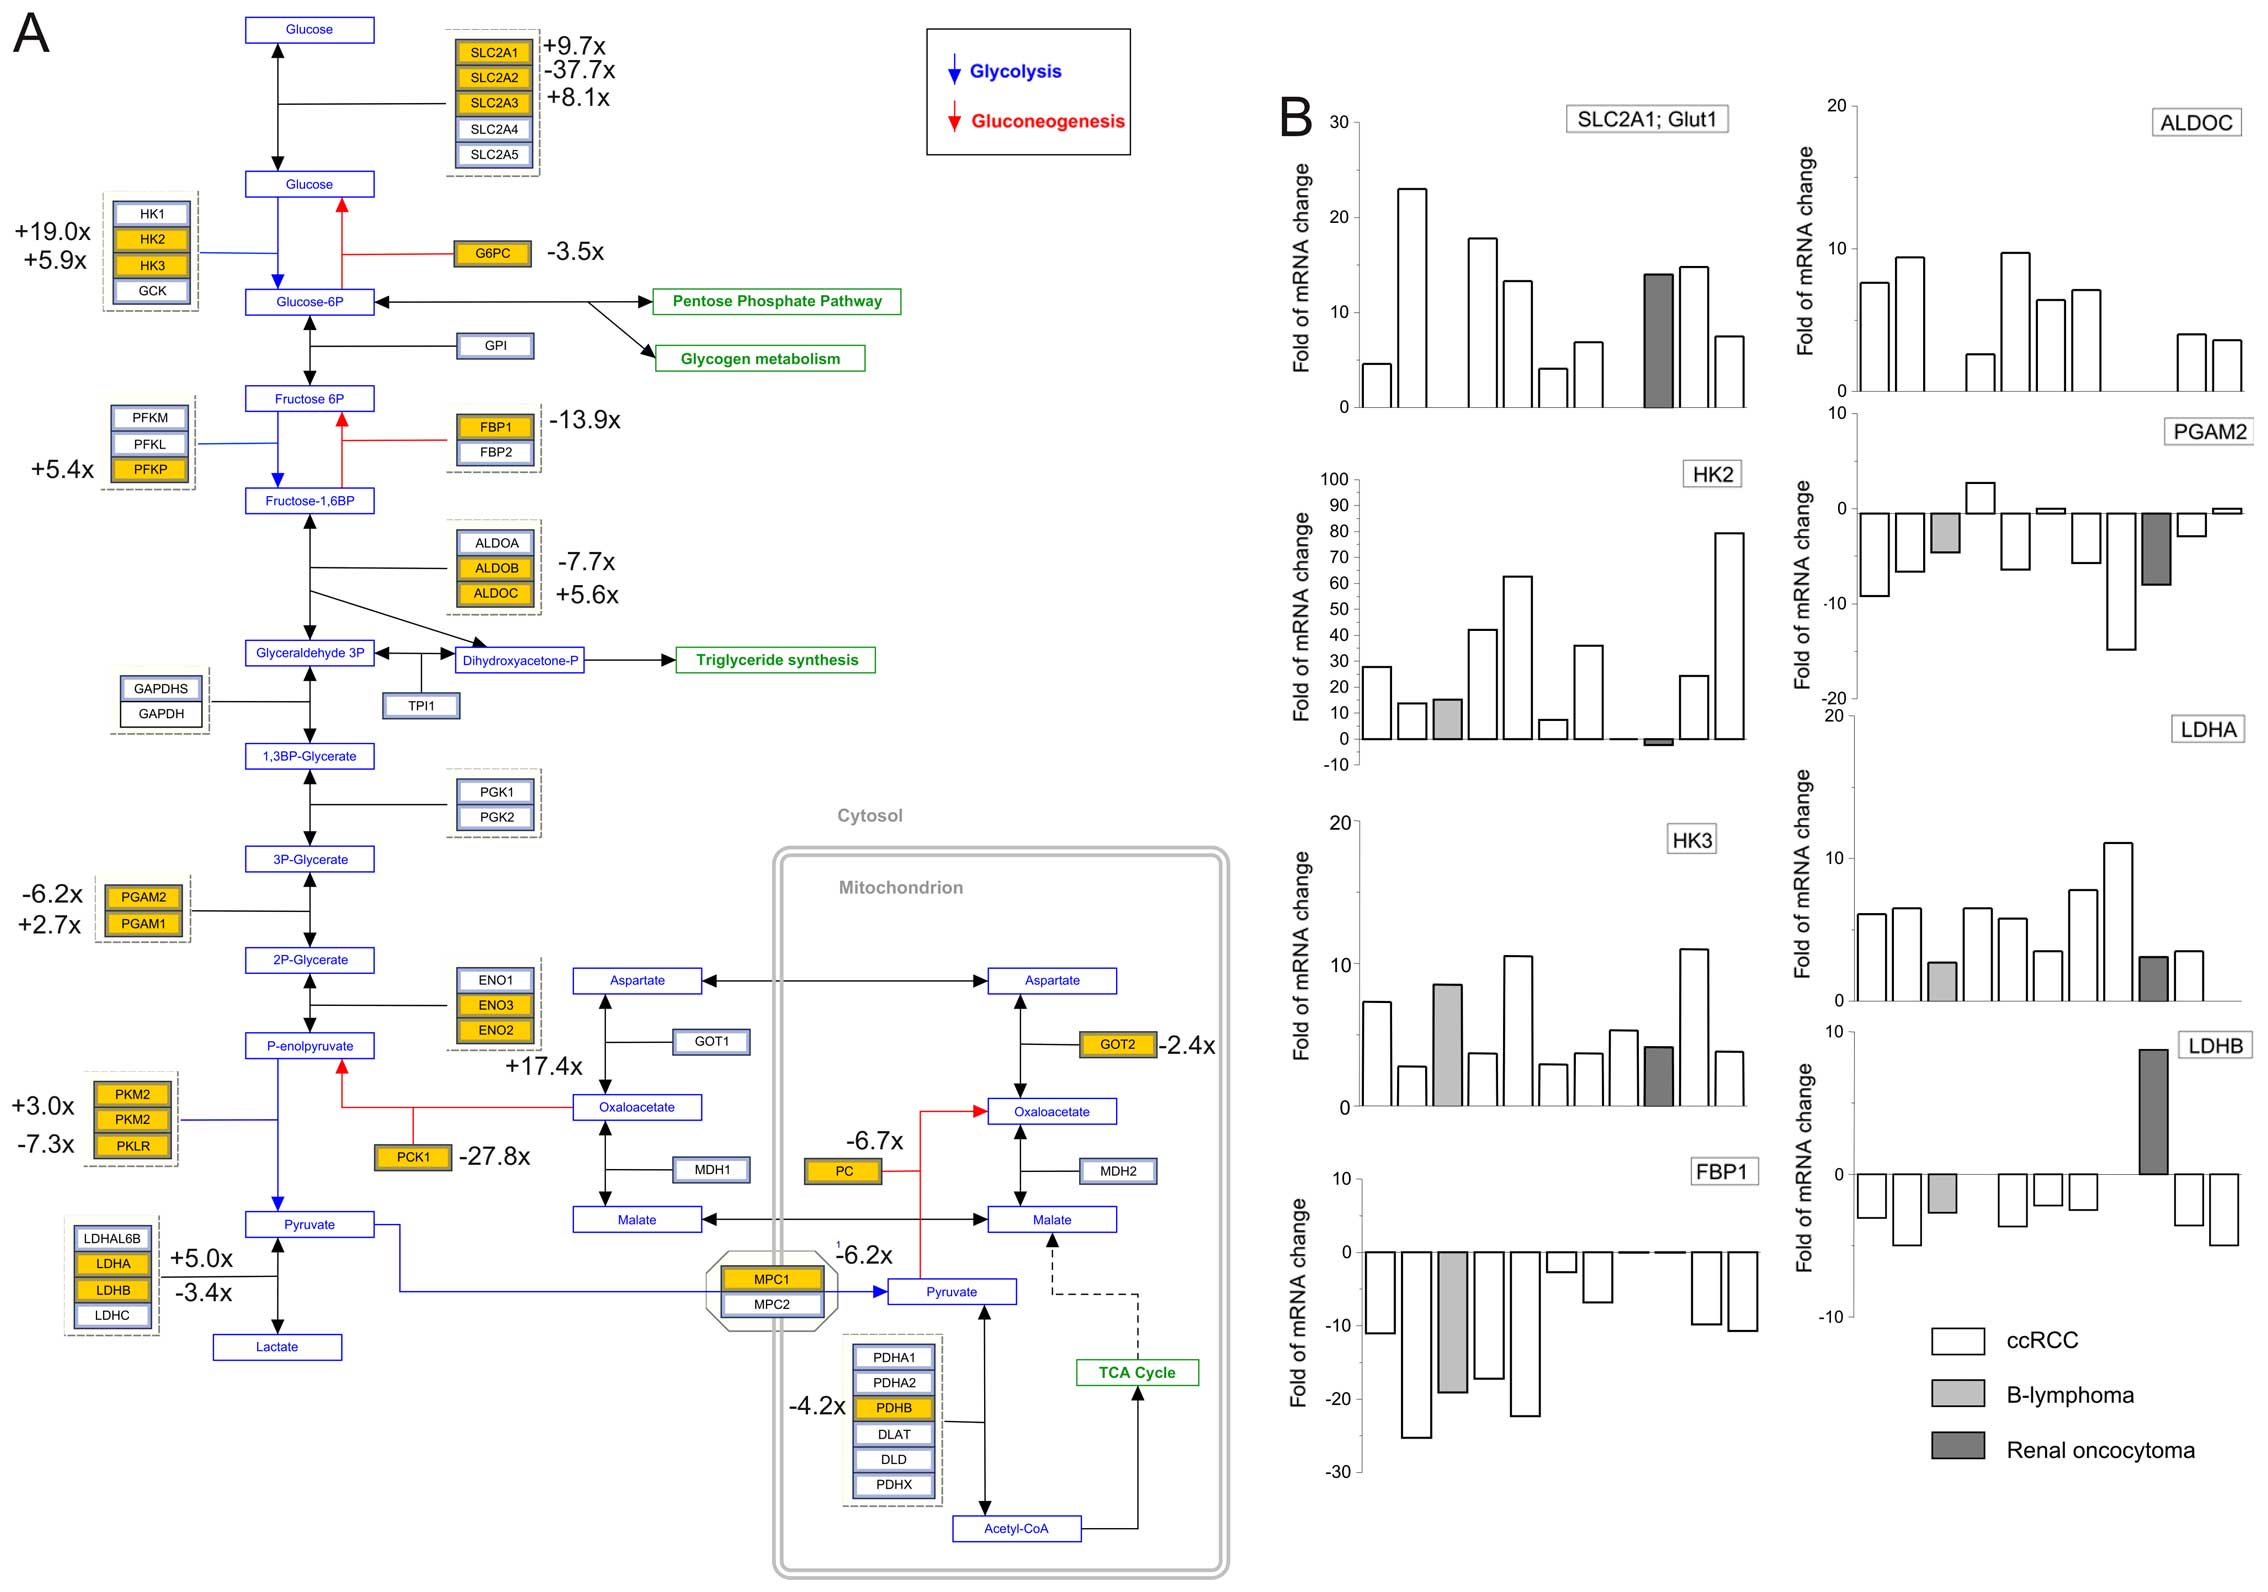
(Glut1; SLC2A1) and type 3 (Glut3; SLC2A3). In ccRCCs we observed
increase in Glut1 in 8 patients (12.7±2.2-times; Fig. 2) and no change in 1 patient. The
Glut1 mRNA was also upregulated in the patient with the renal
oncocytoma (Fig. 2, dark gray
column) but no change was observed in the patient suffering from
cell lymphoma. The Glut3 mRNA (SLC2A3) was also increased in ccRCCs
in 7 patients (fold of increase 8.0±1.5; Fig. 2); four tumors displayed no change
compared to healthy tissues. Both of these transporters are
associated with the tumorigenesis, however, the mechanism, as to
which transporter is preferred, and why, is not known.
Nevertheless, overexpression of the Glut1 and Glut3 in different
tumor types correlates with specific clinical pathological
characteristics, malignant potential and poor prognosis (25). Some authors have observed the most
prominent Glut1 expression around the necrotic areas or the hypoxic
regions of tumors (26,27). Although cancer glucose uptake is
thought to be primarily driven by Glut1, recently it was shown that
Glut3, but not Glut1, correlates with poor survival of patients
with brain tumors and other cancers (28). Notably, mRNA of some other glucose
transporters were changed in tumors of our patients, e.g. Glut2 was
markedly downregulated in 10 tumors (fold of decrease 9.0±1.5;
Fig. 2).
Glucose metabolism and electron transport
chain
Cancer cells metabolize glucose mostly via
glycolysis, even in the presence of sufficient oxygen (5). Therefore, in our patients we focused
primarily on pathways producing energy. We observed that glycolytic
pathway is affected very significantly in ccRCCs
(P=2.5×10⁸; Table I).
Hexokinase 2 (HK2) and 3 (HK3) were upregulated in ccRCCs. From 11
patients, gene expression of the HK2 in tumors was increased in 9
patients (fold of increase 34.2±7.5; Fig. 2), in the patient with renal
oncocytoma it was downregulated and in 1 ccRCC patient it was not
changed. Immunohistochemistry also proved the robust HK2 signal in
ccRCC tumors, weak signal in B-lymphoma and almost no signal in
renal oncocytoma (Fig. 3). HK3
mRNA was elevated in tumors from 10 patients (fold of increase
5.9±0.9; Fig. 2). HK2, a pivotal
glycolytic enzyme is often overexpressed in tumor cells and
contributes to glycolysis. Recently, it was found that HK2 protein
is increased in cancer-associated fibroblasts (29). Also, current studies demonstrated
that HK2 is overexpressed and promotes glycolysis in tumor cells,
but not in normal cells (30,31).
Moreover, HK2 overexpression is associated with a short
progression-free survival, which could be associated with
chemoresistance of the epithelial ovarian cancer (32). Conversion of the fructose
6-phosphate to fructose-1,6-bisphosphate is catalyzed by
phosphofructokinase (PFK). We observed significant increase in P
isoform of the PFK (PFKP), but not in L or M isoforms (Fig. 2). PFKP was shown to play a critical
role in cell proliferation in breast cancer cells. It is suggested
that a transcription factor KLF4 plays a role in the maintenance of
high glycolytic metabolism by transcriptional activation of the
PFKP gene in breast cancer cells (33). Phosphoglycerate mutase (PGAM) of
type 1 was >2-fold increased, but that of type 2 (PGAM2) was
decreased 7.2±1.3-fold in 7 out of 11 patients (Fig. 2). Recently, it was shown that
gluconeogenic enzyme fructose-1,6-bisphosphatase 1 (FBP1) was
uniformly depleted in over 600 ccRCC tumors examined (34). The human FBP1 locus resides on
chromosome 9q22, the loss of which is associated with poor
prognosis for ccRCC patients. In our patients, we observed strong
decrease of the FBP1 in the ccRCC tumors (13.9±2.5-fold in 9 from
11 patients), which is in line with the results of Li and
co-workers (34). While the
glycolytic pathway in these tumors is upregulated, gene expression
of proteins involved in the gluconeogenesis is suppressed, except
of aldolase C (ALDOC), which was significantly increased in 8 out
of 9 ccRCC patients (Fig. 2).
Pyruvate is the end product of cytosolic glycolysis and has a
variety of possible fates. In tumors, majority of the pyruvate is
converted to lactate by lactate dehydrogenase (LDH) of type A
(LDHA), which was increased 5.7±0.8-fold in 10 tumors.
Immunohistochemical staining revealed strong LDHA signal in ccRCC
tumor, weak signal in renal oncocytoma and no signal in B-lymphoma
(Fig. 3). LDHA upregulation was
observed also in the study of Girgis and co-workers (35) on the 170 ccRCC samples. Thus,
upregulation of the LDHA could be a predictor of poor prognosis in
clear cell renal cell carcinoma. On the other hand, gene expression
of the LDHB was significantly suppressed in 8 tumors compared to
corresponding healthy tissues (3.5±0.4-fold). Notably, the patient
with renal oncocytoma had significantly increased expression of
LDHB (Fig. 2, dark column). In
human cancers, overexpressed LDHA was associated with the increased
aggressiveness (36).
In healthy cells majority of the pyruvate is used
for the mitochondrial oxidation. One of the most consistent
hallmarks of cancer biology is the preference of tumor cells to
derive energy through glycolysis as opposed to the more efficient
process of oxidative phosphorylation (OXPHOS). By controlling the
mitochondrial flow of pyruvate, a cancer cell can tune its
physiology to meet the demands of rapid growth (37). Mitochondrial pyruvate carrier of
type 1 (MPC1), but not 2 (MPC2) was slightly decreased in tumors,
compared to the matched control tissue. Since pyruvate transport is
a rate-limiting step in pyruvate oxidation, downregulation of the
MPC1 can dampen its further utilization, e.g. electron transport
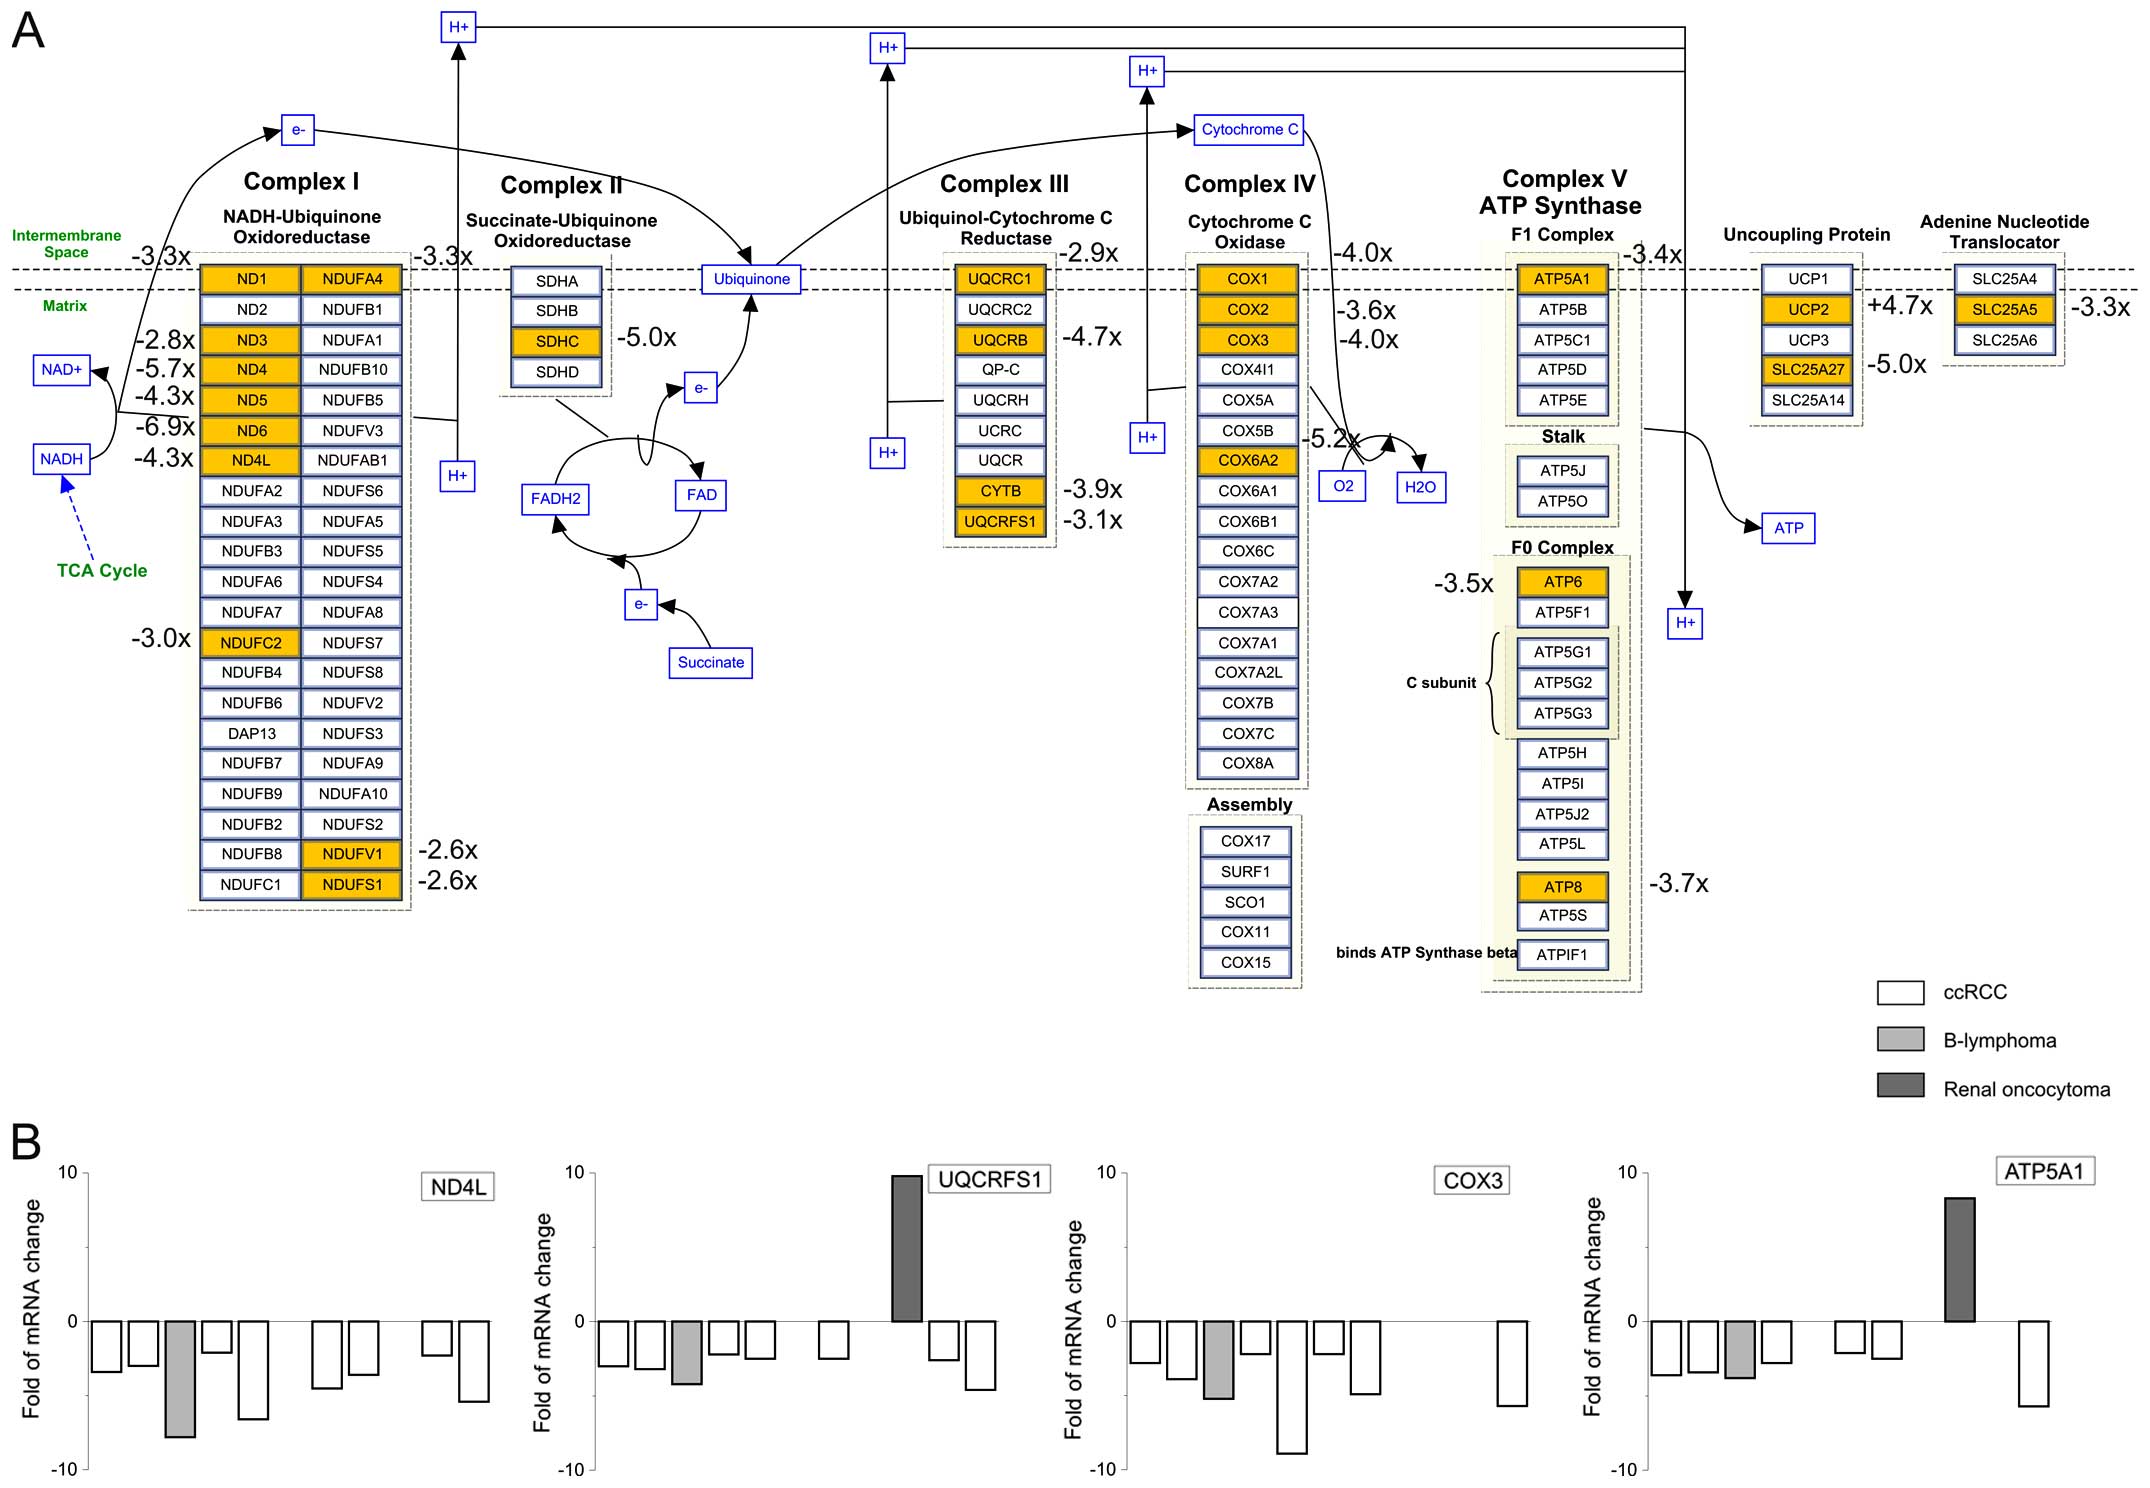
chain. Indeed, the gene expression of several proteins involved in
electron transport chain was significantly decreased (P<0.0044;
Table I).
In ccRCC tumors, we observed decrease in the gene
expression of proteins in complex I, II, III, IV and V (Fig. 4). Mayr et al (38) showed that loss of respiratory chain
complex I (NADH/ubiquinone oxidoreductase) is associated with renal
oncocytoma. In ccRCC tumors, we observed rapid decrease in NADH
dehydrogenase (ND) type 1, 3, 4, 5 and 4L mRNA compared to healthy
part of the tissue (Fig. 4).
Cytochrome c oxidase (COX) is a crucial enzyme of the
complex IV. We observed decrease in the mRNA levels of COX1, COX2
and COX3, with the highest decrease in the COX3 levels
(3.9±0.9-fold; n=7 ccRCC tumors; Fig.
4).
In complex V, ATP5A1 was significantly downregulated
in ccRCC tumors. This observation is in agreement with the work of
Yusenko and co-workers (39), who
observed downregulation of ATP5A1, the α subunit of complex V in
chromophobe RCCs. In majority of our patients with ccRCC, ATP5A1
was also significantly decreased (fold-decrease 2.5±0.7; n=6 ccRCC
patients; Fig. 4).
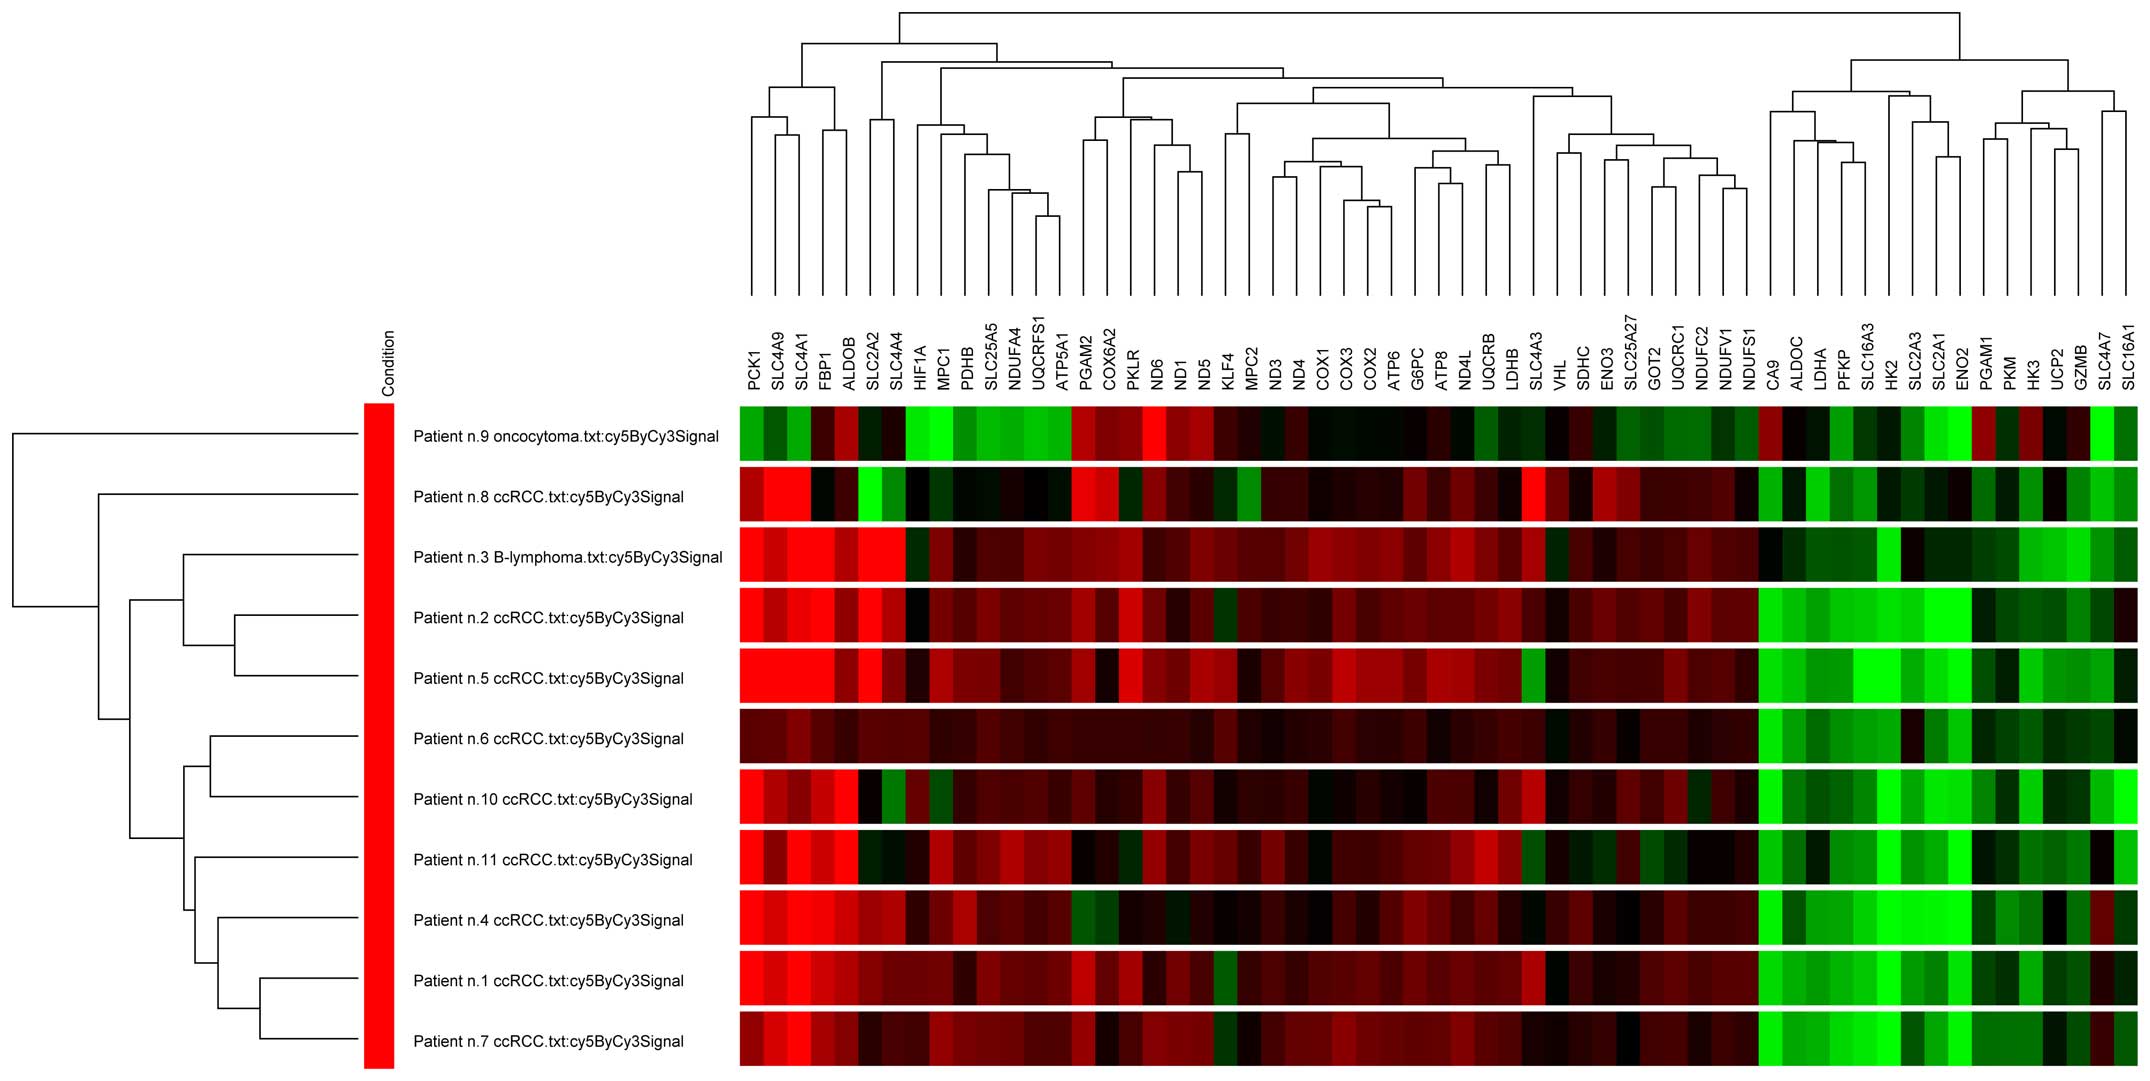
Cluster analysis
Cluster analysis based on the volume difference of
tumor/healthy tissue pairs was performed using selected set of
genes consisting of all significantly changed genes involved in
glycolysis and hypoxia-related metabolic pathways (Fig. 5). Most of the ccRCC samples were
clustered together with a highly similar gene expression pattern,
except one ccRCC sample, which was more variable. However,
oncocytoma sample differs from other samples forming a separate
subgroup in the cluster tree. Gene clustering into two main
subgroups is based on their upregulation or downregulation in
individual samples: all genes of the electron transport chain were
clustered together due to downregulation of the whole pathway.
Cancer cells reprogram their metabolism in order to
satisfy their bioenergetic and biosynthetic requirements. These
cells display reduced ability to use mitochondrial oxidation and
favor the conversion of pyruvate into lactate, despite the
availability of oxygen. Overproduction of the lactate activates pH
regulating transport systems, including CAIX as its catalytic
component. Beroukhim and co-workers (11) suggested that the assessment of
appropriate markers of the VHL pathway dysregulation (e.g.,
expression of gene coding for CA IX) may be more useful in
predicting response to therapy than assessment of the VHL
inactivation status.
To compensate the inefficient extraction of energy
from glucose and to maintain the biomass production, malignant
cells have an at least a 20- to 30-fold higher rate of glycolysis
than normal cells (25).
Mitochondrial impairment increases from the less aggressive to the
most aggressive RCCs, and correlates with a considerably decreased
content of OXPHOS complexes (complexes II, III, and IV of the
respiratory chain, and ATPase/ATP synthase) rather than to the
mitochondrial content (citrate synthase and mitochondrial (mt)DNA)
(40). The present study is among
the first showing complex changes in the glycolytic pathway and
mitochondrial respiration in tumors of patients suffering from
ccRCCs. Moreover, our results nicely correlate with other studies
showing strong upregulation of CAIX (41), Glut1 (42), LDHA (35,43)
and downregulation of AE1, FBP1 (34) and all complexes of the
mitochondrial respiratory chain in ccRCC. Also, these results
correlate with changes observed in animal studies and/or cell
cultures, e.g., distorted tubules in TRACK (transgenic model of
cancer of the kidney) mice exhibit higher levels of CA IX, Glut1,
and VEGF than tubules in non-transgenic control mice (44). Specific genes and signaling
molecules involved in the tumor-forced glycolysis and related
phenomena, such as pH regulation, may represent potential
therapeutic targets of agents that specifically interact with the
key factors of tumor phenotype. Although some groups (45,46),
dispute the role of CA IX as a prognostic marker of the ccRCC, we
believe that together with Glut1, Glut3, HK2, FBP1, ALDOC and LDHA,
CA IX is an important biomarker for ccRCC diagnosis. Moreover,
targeting these proteins might be of therapeutic importance.
Acknowledgements
The present study was supported by grants
APVV-0045-11, APVV-0108-10, VEGA 2/0074/13 and CEMAN.
Abbreviations:
|
AE1, AE3, AE4
|
anionic
Cl−/HCO3-exchangers
|
|
ALDOC
|
aldolase C
|
|
ATP5A1
|
ATP synthase, H+ transporting,
mitochondrial F1 complex, α subunit 1
|
|
CAIX
|
carbonic anhydrase IX
|
|
ccRCC
|
clear cell renal cell carcinoma
|
|
COX1, COX2, COX3
|
cytochrome oxidase 1, 2, 3
|
|
Glut1, Glut2, Glut3
|
glucose transporter of type 1, 2,
3
|
|
FBP1
|
fructose-1,6-bisphosphatase 1
|
|
HIF-1α, HIF-2α
|
hypoxia inducible factor 1α, 2α
|
|
HK2
|
hexokinase II
|
|
KLF4
|
Kruppel-like factor 4
|
|
LDHA, LDHB
|
lactate dehydrogenase A, B
|
|
MCT
|
monocarboxylic acid transporters
|
|
MPC1, MPC2
|
mitochondrial pyruvate carrier of type
1, 2
|
|
NBCe1, NBCn1
|
electrogenic sodium bicarbonate
cotransporters 1 of type e, n
|
|
ND
|
NADH dehydrogenase
|
|
OXPHOS
|
oxidative phosphorylation
|
|
PFK
|
phosphofructokinase
|
|
PGAM
|
phosphoglycerate mutase
|
|
RCC
|
renal cell carcinoma
|
|
VEGF
|
vascular endothelial growth factor
|
|
VHL
|
von Hippel-Lindau tumor suppressor
|
References
|
1
|
Cheville JC, Lohse CM, Zincke H, Weaver AL
and Blute ML: Comparisons of outcome and prognostic features among
histologic subtypes of renal cell carcinoma. Am J Surg Pathol.
27:612–624. 2003. View Article : Google Scholar : PubMed/NCBI
|
|
2
|
Weiss RH and Lin PY: Kidney cancer:
Identification of novel targets for therapy. Kidney Int.
69:224–232. 2006. View Article : Google Scholar : PubMed/NCBI
|
|
3
|
Bonassi S and Neri M: Genetic biomarkers
in human population studies. Handbook of Genomic Medicine. Willard
HF and Ginsburg GS: Elsevier; 2008
|
|
4
|
Beck SD, Patel MI, Snyder ME, Kattan MW,
Motzer RJ, Reuter VE and Russo P: Effect of papillary and
chromophobe cell type on disease-free survival after nephrectomy
for renal cell carcinoma. Ann Surg Oncol. 11:71–77. 2004.
View Article : Google Scholar
|
|
5
|
Warburg O: On respiratory impairment in
cancer cells. Science. 124:269–270. 1956.PubMed/NCBI
|
|
6
|
Matsumoto S, Hyodo F, Subramanian S,
Devasahayam N, Munasinghe J, Hyodo E, Gadisetti C, Cook JA,
Mitchell JB and Krishna MC: Low-field paramagnetic resonance
imaging of tumor oxygenation and glycolytic activity in mice. J
Clin Invest. 118:1965–1973. 2008.PubMed/NCBI
|
|
7
|
Vaupel P: Metabolic microenvironment of
tumor cells: A key factor in malignant progression. Exp Oncol.
32:125–127. 2010.
|
|
8
|
Wenger RH, Stiehl DP and Camenisch G:
Integration of oxygen signaling at the consensus HRE. Sci STKE.
2005:re122005.PubMed/NCBI
|
|
9
|
Trayhurn P, Wang B and Wood IS: Hypoxia
and the endocrine and signalling role of white adipose tissue. Arch
Physiol Biochem. 114:267–276. 2008. View Article : Google Scholar : PubMed/NCBI
|
|
10
|
Gnarra JR, Glenn GM, Latif F, Anglard P,
Lerman MI, Zbar B and Linehan WM: Molecular genetic studies of
sporadic and familial renal cell carcinoma. Urol Clin North Am.
20:207–216. 1993.PubMed/NCBI
|
|
11
|
Beroukhim R, Brunet JP, Di Napoli A, Mertz
KD, Seeley A, Pires MM, Linhart D, Worrell RA, Moch H, Rubin MA, et
al: Patterns of gene expression and copy-number alterations in Von
Hippel-Lindau disease-associated and sporadic clear cell carcinoma
of the kidney. Cancer Res. 69:4674–4681. 2009. View Article : Google Scholar : PubMed/NCBI
|
|
12
|
Baldewijns MM, van Vlodrop IJ, Vermeulen
PB, Soetekouw PM, van Engeland M and de Bruïne AP: VHL and HIF
signalling in renal cell carcinogenesis. J Pathol. 221:125–138.
2010. View Article : Google Scholar : PubMed/NCBI
|
|
13
|
Pinthus JH, Whelan KF, Gallino D, Lu JP
and Rothschild N: Metabolic features of clear-cell renal cell
carcinoma: Mechanisms and clinical implications. Can Urol Assoc J.
5:274–282. 2011. View Article : Google Scholar : PubMed/NCBI
|
|
14
|
Wykoff CC, Beasley NJ, Watson PH, Turner
KJ, Pastorek J, Sibtain A, Wilson GD, Turley H, Talks KL, Maxwell
PH, et al: Hypoxia-inducible expression of tumor-associated
carbonic anhydrases. Cancer Res. 60:7075–7083. 2000.
|
|
15
|
Bui MH, Seligson D, Han KR, Pantuck AJ,
Dorey FJ, Huang Y, Horvath S, Leibovich BC, Chopra S, Liao SY, et
al: Carbonic anhydrase IX is an independent predictor of survival
in advanced renal clear cell carcinoma: Implications for prognosis
and therapy. Clin Cancer Res. 9:802–811. 2003.PubMed/NCBI
|
|
16
|
Takacova M, Bartosova M, Skvarkova L,
Zatovicova M, Vidlickova I, Csaderova L, Barathova M, Breza J Jr,
Bujdak P, Pastorek J, et al: Carbonic anhydrase IX is a clinically
significant tissue and serum biomarker associated with renal cell
carcinoma. Oncol Lett. 5:191–197. 2013.
|
|
17
|
Sedlakova O, Svastova E, Takacova M,
Kopacek J, Pastorek J and Pastorekova S: Carbonic anhydrase IX, a
hypoxia-induced catalytic component of the pH regulating machinery
in tumors. Front Physiol. 4:4002014. View Article : Google Scholar : PubMed/NCBI
|
|
18
|
Ditte P, Dequiedt F, Svastova E, Hulikova
A, Ohradanova-Repic A, Zatovicova M, Csaderova L, Kopacek J,
Supuran CT, Pastorekova S, et al: Phosphorylation of carbonic
anhydrase IX controls its ability to mediate extracellular
acidification in hypoxic tumors. Cancer Res. 71:7558–7567. 2011.
View Article : Google Scholar : PubMed/NCBI
|
|
19
|
Svastova E, Witarski W, Csaderova L, Kosik
I, Skvarkova L, Hulikova A, Zatovicova M, Barathova M, Kopacek J,
Pastorek J, et al: Carbonic anhydrase IX interacts with bicarbonate
transporters in lamellipodia and increases cell migration via its
catalytic domain. J Biol Chem. 287:3392–3402. 2012. View Article : Google Scholar :
|
|
20
|
Gorbatenko A, Olesen CW, Boedtkjer E and
Pedersen SF: Regulation and roles of bicarbonate transporters in
cancer. Front Physiol. 16–April;2014. View Article : Google Scholar : PubMed/NCBI
|
|
21
|
Karumanchi SA, Jiang L, Knebelmann B,
Stuart-Tilley AK, Alper SL and Sukhatme VP: VHL tumor suppressor
regulates Cl−/HCO3− exchange and
Na+/H+ exchange activities in renal carcinoma
cells. Physiol Genomics. 5:119–128. 2001.PubMed/NCBI
|
|
22
|
Halestrap AP: The SLC16 gene family:
structure, role and regulation in health and disease. Mol Aspects
Med. 34:337–349. 2013. View Article : Google Scholar : PubMed/NCBI
|
|
23
|
Doyen J, Trastour C, Ettore F, Peyrottes
I, Toussant N, Gal J, Ilc K, Roux D, Parks SK, Ferrero JM, et al:
Expression of the hypoxia-inducible monocarboxylate transporter
MCT4 is increased in triple negative breast cancer and correlates
independently with clinical outcome. Biochem Biophys Res Commun.
451:54–61. 2014. View Article : Google Scholar : PubMed/NCBI
|
|
24
|
Pértega-Gomes N, Vizcaíno JR, Attig J,
Jurmeister S, Lopes C and Baltazar F: A lactate shuttle system
between tumour and stromal cells is associated with poor prognosis
in prostate cancer. BMC Cancer. 14:3522014. View Article : Google Scholar : PubMed/NCBI
|
|
25
|
Jóźwiak P, Krześlak A, Pomorski L and
Lipińska A: Expression of hypoxia-related glucose transporters
GLUT1 and GLUT3 in benign, malignant and non-neoplastic thyroid
lesions. Mol Med Rep. 6:601–606. 2012.
|
|
26
|
Brown RS, Goodman TM, Zasadny KR, Greenson
JK and Wahl RL: Expression of hexokinase II and Glut-1 in untreated
human breast cancer. Nucl Med Biol. 29:443–453. 2002. View Article : Google Scholar : PubMed/NCBI
|
|
27
|
Mori Y, Tsukinoki K, Yasuda M, Miyazawa M,
Kaneko A and Watanabe Y: Glucose transporter type 1 expression are
associated with poor prognosis in patients with salivary gland
tumors. Oral Oncol. 43:563–569. 2007. View Article : Google Scholar
|
|
28
|
Flavahan WA, Wu Q, Hitomi M, Rahim N, Kim
Y, Sloan AE, Weil RJ, Nakano I, Sarkaria JN, Stringer BW, et al:
Brain tumor initiating cells adapt to restricted nutrition through
preferential glucose uptake. Nat Neurosci. 16:1373–1382. 2013.
View Article : Google Scholar : PubMed/NCBI
|
|
29
|
Hu JW, Sun P, Zhang DX, Xiong WJ and Mi J:
Hexokinase 2 regulates G1/S checkpoint through CDK2 in
cancer-associated fibroblasts. Cell Signal. 26:2210–2216. 2014.
View Article : Google Scholar : PubMed/NCBI
|
|
30
|
Feliciano A, Castellvi J, Artero-Castro A,
Leal JA, Romagosa C, Hernández-Losa J, Peg V, Fabra A, Vidal F,
Kondoh HC, et al: miR-125b acts as a tumor suppressor in breast
tumorigenesis via its novel direct targets ENPEP, CK2-α, CCNJ, and
MEGF9. PLoS One. 8:e762472013. View Article : Google Scholar
|
|
31
|
Patra KC, Wang Q, Bhaskar PT, Miller L,
Wang Z, Wheaton W, Chandel N, Laakso M, Muller WJ, Allen EL, et al:
Hexokinase 2 is required for tumor initiation and maintenance and
its systemic deletion is therapeutic in mouse models of cancer.
Cancer Cell. 24:213–228. 2013. View Article : Google Scholar : PubMed/NCBI
|
|
32
|
Suh DH, Kim MA, Kim H, Kim MK, Kim HS,
Chung HH, Kim YB and Song YS: Association of overexpression of
hexokinase II with chemoresistance in epithelial ovarian cancer.
Clin Exp Med. 14:345–353. 2014. View Article : Google Scholar
|
|
33
|
Moon JS, Kim HE, Koh E, Park SH, Jin WJ,
Park BW, Park SW and Kim KS: Krüppel-like factor 4 (KLF4) activates
the transcription of the gene for the platelet isoform of
phosphofructokinase (PFKP) in breast cancer. J Biol Chem.
286:23808–23816. 2011. View Article : Google Scholar : PubMed/NCBI
|
|
34
|
Li B, Qiu B, Lee DS, Walton ZE, Ochocki
JD, Mathew LK, Mancuso A, Gade TP, Keith B, Nissim I, et al:
Fructose-1,6-bisphosphatase opposes renal carcinoma progression.
Nature. 13:251–255. 2014. View Article : Google Scholar
|
|
35
|
Girgis H, Masui O, White NM, Scorilas A,
Rotondo F, Seivwright A, Gabril M, Filter ER, Girgis AH, Bjarnason
GA, et al: Lactate dehydrogenase A is a potential prognostic marker
in clear cell renal cell carcinoma. Mol Cancer. 13:1012014.
View Article : Google Scholar : PubMed/NCBI
|
|
36
|
Xie H, Hanai J, Ren JG, Kats L, Burgess K,
Bhargava P, Signoretti S, Billiard J, Duffy KJ, Grant A, et al:
Targeting lactate dehydrogenase--a inhibits tumorigenesis and tumor
progression in mouse models of lung cancer and impacts
tumor-initiating cells. Cell Metab. 19:795–809. 2014. View Article : Google Scholar : PubMed/NCBI
|
|
37
|
Schell JC and Rutter J: The long and
winding road to the mitochondrial pyruvate carrier. Cancer Metab.
1:62013.PubMed/NCBI
|
|
38
|
Mayr JA, Meierhofer D, Zimmermann F,
Feichtinger R, Kögler C, Ratschek M, Schmeller N, Sperl W and
Kofler B: Loss of complex I due to mitochondrial DNA mutations in
renal oncocytoma. Clin Cancer Res. 14:2270–2275. 2008. View Article : Google Scholar : PubMed/NCBI
|
|
39
|
Yusenko MV, Ruppert T and Kovacs G:
Analysis of differentially expressed mitochondrial proteins in
chromophobe renal cell carcinomas and renal oncocytomas by 2-D gel
electrophoresis. Int J Biol Sci. 6:213–224. 2010. View Article : Google Scholar : PubMed/NCBI
|
|
40
|
Simonnet H, Alazard N, Pfeiffer K, Gallou
C, Béroud C, Demont J, Bouvier R, Schägger H and Godinot C: Low
mitochondrial respiratory chain content correlates with tumor
aggressiveness in renal cell carcinoma. Carcinogenesis. 23:759–768.
2002. View Article : Google Scholar : PubMed/NCBI
|
|
41
|
Choueiri TK, Cheng S, Qu AQ, Pastorek J,
Atkins MB and Signoretti S: Carbonic anhydrase IX as a potential
biomarker of efficacy in metastatic clear-cell renal cell carcinoma
patients receiving sorafenib or placebo: Analysis from the
treatment approaches in renal cancer global evaluation trial
(TARGET). Urol Oncol. 31:1788–1793. 2013. View Article : Google Scholar
|
|
42
|
Page T, Hodgkinson AD, Ollerenshaw M,
Hammonds JC and Demaine AG: Glucose transporter polymorphisms are
associated with clear-cell renal carcinoma. Cancer Genet Cytogenet.
163:151–155. 2005. View Article : Google Scholar : PubMed/NCBI
|
|
43
|
White EA, Kenny HA and Lengyel E:
Three-dimensional modeling of ovarian cancer. Adv Drug Deliv Rev.
79–80:184–192. 2014. View Article : Google Scholar
|
|
44
|
Fu L, Wang G, Shevchuk MM, Nanus DM and
Gudas LJ: Generation of a mouse model of Von Hippel-Lindau kidney
disease leading to renal cancers by expression of a constitutively
active mutant of HIF1α. Cancer Res. 71:6848–6856. 2011. View Article : Google Scholar : PubMed/NCBI
|
|
45
|
Leibovich BC, Sheinin Y, Lohse CM,
Thompson RH, Cheville JC, Zavada J and Kwon ED: Carbonic anhydrase
IX is not an independent predictor of outcome for patients with
clear cell renal cell carcinoma. J Clin Oncol. 25:4757–4764. 2007.
View Article : Google Scholar : PubMed/NCBI
|
|
46
|
Zhang BY, Thompson RH, Lohse CM, Dronca
RS, Cheville JC, Kwon ED and Leibovich BC: Carbonic anhydrase IX
(CAIX) is not an independent predictor of outcome in patients with
clear cell renal cell carcinoma (ccRCC) after long-term follow-up.
BJU Int. 111:1046–1053. 2013. View Article : Google Scholar : PubMed/NCBI
|