Introduction
Gastric cancer (GC) is the fifth most common cancer
in the world, following lung, breast, prostate and colorectal
cancers, with an estimated 952,000 newly reported cases and 723,000
related deaths in 2012. Of these new cases, more than 70% occurred
in less developed regions, with 50% occurring in Eastern Asia
(mainly in China) (1). The depth
of wall invasion, local lymph node and distal organ invasion, which
are found with tumor-metastasis in the clinical staging systems,
are evaluated for GC diagnosis and prognosis. A 5-year survival
rate of >90% has been observed for patients diagnosed with early
gastric cancer, whereas the survival rate is only 5% for those
diagnosed with GC with synchronous distant metastasis (2). The mechanism of metastasis is still
unknown. Therefore, investigating the molecular mechanism of
gastric cancer metastasis could provide insights to improve
diagnosis and therapeutic approaches.
In recent years, proteomics analysis has provided us
with a powerful, global tool to study and evaluate protein
expression. Two-dimensional gel electrophoresis (2-DE) was widely
used in proteomics-based approaches, which has been traditionally
performed in order to identify the cancer-related protein (3). However, 2-DE is a labor-intensive
method which is insensitive to the detection of low-abundance
protein and hydrophobic membrane proteins. Both limited sample
capacity and low linear visualization range are its disadvantages
(4). Nowadays, isotope-based
quantitative proteomics is widely used in the identification and
quantification of proteins, such as isobaric tags for relative and
absolute quantitation (iTRAQ) (5),
ICAT (6), 18O (7) and SILAC (8). Among these techniques, the iTRAQ
method is an MS/MS-based technique which enables both protein
identification and relative quantification in a multiplexed
experiment.
In the present study, we used the quantitation of
the proteomics method to analyze the differences of protein
expression levels between gastric cancer and normal gastric
tissues. Among these proteins, we focused on olfactomedin 4 (OLFM4)
because this protein has recently been shown to be aberrantly
expressed in malignancies. Furthermore, the study on the function
of OLFM4 in gastric cancer had not been previously reported. We
further studied the biological function of GC cells silencing OLFM4
expression, in an attempt to determine whether the overexpression
of this protein is relevant to the malignancy of gastric
cancer.
Materials and methods
Patients and cell lines
Fifteen patients with gastric cancer were included
in this study (Table I). In our
clinical patients, a majority of GC patients had neoplasms of
intermediate differentiation (stage III or IV). The patients were
selected from gastric cancer patients from the Second Affiliated
Hospital of Chongqing Medical University. Gastric cancer tissues
and adjacent non-cancer gastric tissue were used for iTRAQ-coupled
LC-MS/MS analyses. Non-cancer tissues were obtained from the distal
edge of the resection at least 10 cm from the tumor. The study was
approved by the Ethics Committee of Chongqing Medical University
and all patients signed written informed consent prior to
participation in the present study. Two human gastric cancer cell
lines (AGS and MKN28) from ATCC were grown in RPMI-1640 medium
supplanted with 10% fetal bovine serum (FBS; Gibco, San Diego, CA,
USA) and penicillin and incubated in an atmosphere of 5.0% carbon
dioxide at 37°C.
 | Table IThe clinical and pathological data of
gastric cancer patients (15 samples). |
Table I
The clinical and pathological data of
gastric cancer patients (15 samples).
| Sample no. | Gender | Age (years) | Tumor position | Pathology | Grade | Stage | TNM | Type |
|---|
| 1 | Female | 68 | Gastric antrum | Adenocarcinoma | 3 | IIIB | T4N2M0 | Malignant |
| 2 | Male | 59 | Gastric antrum | Adenocarcinoma | 3 | IIIA | T2N3M0 | Malignant |
| 3 | Female | 65 | Gastric fundus | Adenocarcinoma | 3 | II | T2N1M0 | Malignant |
| 4 | Male | 65 | Gastric body | Adenocarcinoma | 3 | IIIA | T4N1M0 | Malignant |
| 5 | Male | 60 | Gastric antrum | Adenocarcinoma | 3 | IIIB | T3N3M0 | Malignant |
| 6 | Female | 73 | Gastric antrum | Adenocarcinoma | 3 | IV | T3N2M1 | Malignant |
| 7 | Male | 47 | Gastric antrum | Adenocarcinoma | 3 | IIIA | T2N3M0 | Malignant |
| 8 | Female | 67 | Gastric body | Adenocarcinoma | 3 | IV | T3N3M1 | Malignant |
| 9 | Male | 77 | Gastric fundus | Adenocarcinoma | 3 | IV | T3N0M1 | Malignant |
| 10 | Female | 51 | Gastric antrum | Adenocarcinoma | 3 | IIIA | T3N2M0 | Malignant |
| 11 | Male | 55 | Gastric antrum | Adenocarcinoma | 3 | IV | T2N3M1 | Malignant |
| 12 | Male | 78 | Gastric body | Adenocarcinoma | 3 | IV | T3N3M1 | Malignant |
| 13 | Female | 56 | Gastric antrum | Adenocarcinoma | 3 | IIIA | T3N2M0 | Malignant |
| 14 | Male | 64 | Gastric antrum | Adenocarcinoma | 2 | II | T2N1M0 | Malignant |
| 15 | Female | 65 | Gastric fundus | Adenocarcinoma | 2 | II | T1N2M0 | Malignant |
Protein digestion and peptide iTRAQ
labeling
The 8-plex iTRAQ kits were obtained from Applied
Biosystems (Foster City, CA, USA). All the proteins were extracted
using a Sample Grinding kit obtained from Amersham Biosciences with
lysis buffer which contains 7 M urea, 1 mM PMSF, 1 mM
Na3VO4 and 1 mg/ml DNase I. After being
centrifuged at 15,000 rpm for 15 min at 4°C (9), the supernatant liquid was collected,
then the protein concentrations were quantified by the 2D
Quantification kit. Approximately 100 μg of protein from each
sample were further precipitated with ice-cold acetone at −20°C
overnight and dissolved with a denatured lysis buffer. According to
the manufacturer's instrument (Applied Biosystems, Framingham, MA,
USA), the cysteines were then blocked. Each sample was digested to
peptides using 20 μl of 0.1 μg/μl sequencing grade modified trypsin
(Promega) solution at 37°C overnight. Labeling was as follows with
different isobaric tags: i) gastric cancer tissues, 117 and 119
tags; and ii) normal gastric tissues, 118 and 121 tags. Prior to
fractionation of peptides, the labeled samples were placed at room
temperature for 1 h and combined.
Peptide fractionation
The pooled iTRAQ-labeled samples were solubilized in
300 μl of 1% Pharmalyte (Amersham Biosciences) and 8 M urea.
Samples were used to rehydrate 18 cm-long IPG gel strips (pH 3–10;
Amersham Biosciences) at 30 V for 14 h. Electrofocusing of the
peptides was carried out successively at 500 V for 1 h, 1000 V for
1 h, 3000 V for 1 h and 8000 V for 8.5 h to reach a final level of
68 kV•h. After focusing, the strips were withdrawn and sliced into
36 sections of 5 mm thickness. Peptides were extracted by
incubating the gel pieces in 100 μl of 2% acetonitrile, 0.1% formic
acid for 1 h (10). The pieces
were purified and concentrated on a C18 Discovery DSC-18 SPE column
(Sigma-Aldrich), then lyophilized and maintained at −20°C (10). Just prior to LC-MS/MS analysis, the
samples were resuspended in 20 μl of Buffer A (0.1% formic acid in
2% acetonitrile).
Mass spectrometry and database
search
The samples were analyzed using a QStar Elite mass
spectrometer (Applied Biosystems) coupled with an Dionex UltiMate
3000 liquid chromatography system (Amsterdam, The Netherlands)
(9,10). For each analysis, samples were
loaded onto a C18 PepMap column (Dionex) at a flow rate of 300
nl/min. A 125-min gradient was generated between Buffer A and
Buffer B (98% ACN, 0.1% FA), and consisted of 3 min of both 4%
Buffer B and 96% Buffer A, 7 min of 4–10% Buffer B, 55 min of
10–35% Buffer B, 25 min of 35–100% Buffer B, 15 min of 100% Buffer
B and a final 20 min of 96% Buffer A (10). The mass spectrometer was set to
perform data acquisition in the positive ion mode, with a selected
mass range of 300–1800 m/z. The two most abundant charged ions
which exceeded 20 counts were chosen for MS/MS and dynamically
excluded for 30 sec with a ±50 mDa mass tolerance (10).
ProteinPilot software (version 2.0; Applied
Biosystems, MDS-Sciex) was used for protein identification and
quantification. MS/MS data were searched against the International
Protein Index (IPI) human database v3.77. The database was searched
by setting a fixed modification of cysteine using MMTS. Other
parameters included oxidation of methionine, iTRAQ labeled-lysine,
N-terminal iTRAQ labeling, MS/MS tolerance: 0.5 Da, and a maximum
of one missed cleavage. The relative quantification of each peptide
in the case of iTRAQ was determined on the MS/MS scans using the
peak areas of 117, 118, 119 and 121 Da. The Paragon Algorithm
embedded in ProteinPilot V2.0 software was used for the statistical
calculation. In brief, protein identification was based on 3 or
more unique peptides, of >95% confidence, being assigned.
RNA extraction and quantitative
RT-PCR
Total RNA was extracted with a Trizol reagent
(Gibco-BRL, Gaithersburg, MD, USA) according to the manufacturer's
instructions. First-strand cDNA was synthesized from 2 μg of total
RNA, using A3500 Reverse transcription system (Promega). RT-PCR was
performed on an ABI 7900HT system using the Taq-Man Gene Expression
Assay kit and following primers for GAPDH (Hs00486019_CE), NAPSA
(Hs00188200_CE), KRT1 (Hs00459308_CE), BCAM (Hs00185951_CE), OLFM4
(Hs00447959_CE), LGALS7 (Hs00355547_CE), LGALS3BP (Hs00417610_CE),
IDH2 (Hs00475823_CE), GDI1 (Hs00401968_CE), EPX (Hs00169490_CE),
FKBP9 (Hs00405072_CE), HNRNPAB (Hs00269605_CE), LASP1
(Hs00348599_CE), FGB (Hs00255169_CE), CPVL (Hs00507250_CE), ACAT1
(Hs00111889_CE), CALD1 (Hs00372592_CE), ATP5L (Hs00334349_CE),
BASP1 (Hs00258102_CE), ATP5B (Hs00481655_CE), APCS (Hs00289738_CE),
VIL1 (Hs00206299_CE) and AZU1 (Hs00177715_CE). Relative expression
was calculated according to the 2−ΔΔCT quantification
method (11).
Immunoblot analysis
The cells/tissues were lysed for 30 min at 4°C in a
non-ionic detergent (NID) lysis buffer containing 1 mM, pH 8.0
EDTA, 0.5% IGEPAL, 50 mM, pH 7.5 Tris-HCl, 50 mM sodium fluoride,
150 mM NaCl, 1 mM sodium orthovanadate, 0.5% Triton-X and protease
inhibitors (11). Approximately 20
μg of the protein specimens were separated with the use of
SDS-polyacrylamide and transferred onto PVDF membranes (Amersham
Biosciences). After blocking with 5% non-fat powdered milk in TBS-T
buffer (pH 7.6, 0.5% Tween-20), the monoclonal antibodies against
Azurocidin 1 (AZU1), CPVL, OLFM4, Villin 1 (VIL1), transducer and
activator of transcription 3 (STAT3), phosphorylated STAT3
(pY705-STAT3), matrix metalloproteinase 9 (MMP9), matrix
metalloproteinase 2 (MMP2), and actin from Abcam (Cambridge, MA,
USA) were incubated at a dilution of 1:500–1:1,000 at normal
temperature for 2 h. A horseradish peroxidase-conjugated goat
anti-mouse IgG or goat anti-rabbit IgG (Amersham Biosciences) was
incubated at a dilution of 1:5,000 for 1 h at room temperature. All
of the blots were developed by the enhanced chemiluminescence (ECL)
system obtained from Amersham Biosciences (Uppsala, Sweden).
Immunohistochemistry (IHC) and tissue
microarrays (TMA)
The tissue microarrays (LV801a) obtained from US
Biomax Inc. (Rockville, MD, USA) contain formalin-fixed paraffin
embedded samples of 40 cases of gastric cancer and 40 matched or
unmatched cancer adjacent normal, single core tissues.
Immunohistochemistry of TMA was carried out as previously reported
(12). After dewaxing with xylene,
sections were rehydrated using an alcohol gradient (100, 95 and
70%) and finally washed in double-distilled H2O
(12). After quenching endogenous
peroxidase activity with 3% H2O2 for 10 min
and blocking with BSA for 30 min, the sections were incubated with
antibodies against AZU1, CPVL, OLFM4, and VIL1 (1:100) overnight at
4°C. Detection was achieved with the Envision/horseradish
peroxidase system (DakoCytomation, Glostrup, Denmark) (12). All slides were counterstained with
Gill's hematoxylin for 1 min, dehydrated and mounted for light
microscope analysis (10,12).
The stained TMA slides were evaluated and scored by
the same certified pathologist who was blinded to the clinical
data. The protein expression was assessed using a semi-quantitative
scoring consisting of an assessment of both staining intensity
(scale 0–3) and the percentage of positive cells (0–100%), which,
when multiplied, generate a score ranging from 0 to 300. The t-test
was performed at 95% confidence. All the statistical analyses were
performed using SPSS software for Windows, version 16.0 (SPSS,
Inc., Chicago, IL, USA).
OLFM4 siRNA transfection, wound-healing,
cell migration and invasion assays
AGS and MKN28 cells were transfected with negative
control siRNA (12935-400) or 100 nM of OLFM4 specific Stealth
Select RNAi™ siRNA (HSS116245, HSS116246 and HSS116247) using
Lipofectamine 2000 according to the manufacturer's protocol
(Invitrogen-Life Technologies, Carlsbad CA, USA). Two days
following transfection, wound-healing, cell migration and invasion
assays were conducted. The wound healing assay was performed in
6-well plates. When the cells had grown to confluence, a wound was
incised in the cell monolayer using a sterile p200 pipette tip.
Images of the scratches were captured at 0 and 24 h using a phase
contrast microscope. The rate of cell migration was determined by
the extent of gap closure. The transwell migration and invasion
assays were performed using a 24-well cell migration and invasion
assay kit (8 μm pore size, colorimetric format) obtained from Cell
Biolabs Inc. (San Diego, CA, USA) according to the manufacturer's
protocol. Briefly, after being transfected with OLFM4 or control
siRNA for 48 h and starved for 24 h, AGS and MKN cells were
harvested and resuspended in serum-free media. Approximately
3×10⁵ cells/300 μl media were loaded into the upper
chamber, and the lower chambers were filled with 500 μl media (1640
plus 10% FBS). Cells were allowed to migrate or invade for 12 or 24
h, respectively. The non-invasive cells on the top of the Transwell
membrane filter inserts were removed with cotton swabs, while the
migrating/invading cells on the bottom of the filters were stained,
fixed, extracted, and measured at OD 560 nm according to the
manufacturer's instructions. In each case, the silencing of protein
expression was verified by western blot analysis as described
above.
Cell proliferation assay
AGS and MKN28 cells were seeded onto 96-well plates
at a density of 1.5×10³ cells/well. Cells were cultured
in RPMI-1640 media with 10% FBS and transfected with OLFM4 siRNA or
control siRNA for 0, 24, 48, 72 and 96 h at 37°C. The MTT assay wad
performed as follows: cells were incubated with 20 μl MTT
(Sigma-Aldrich) at 37°C for 4 h. The MTT substrate was then
dissolved in 200 μl of DMSO (Sigma-Aldrich) for 5 min. Finally the
absorbance was measured at 570 nm.
Statistical analysis
All experiments were performed at least in
triplicate. The data were plotted as mean ± standard deviation (SD)
and performed with the Student's t-test between the two groups. A
P-value of <0.05 was considered statistically significant.
Results
Analysis of iTRAQ data of aberrantly
expressed proteins
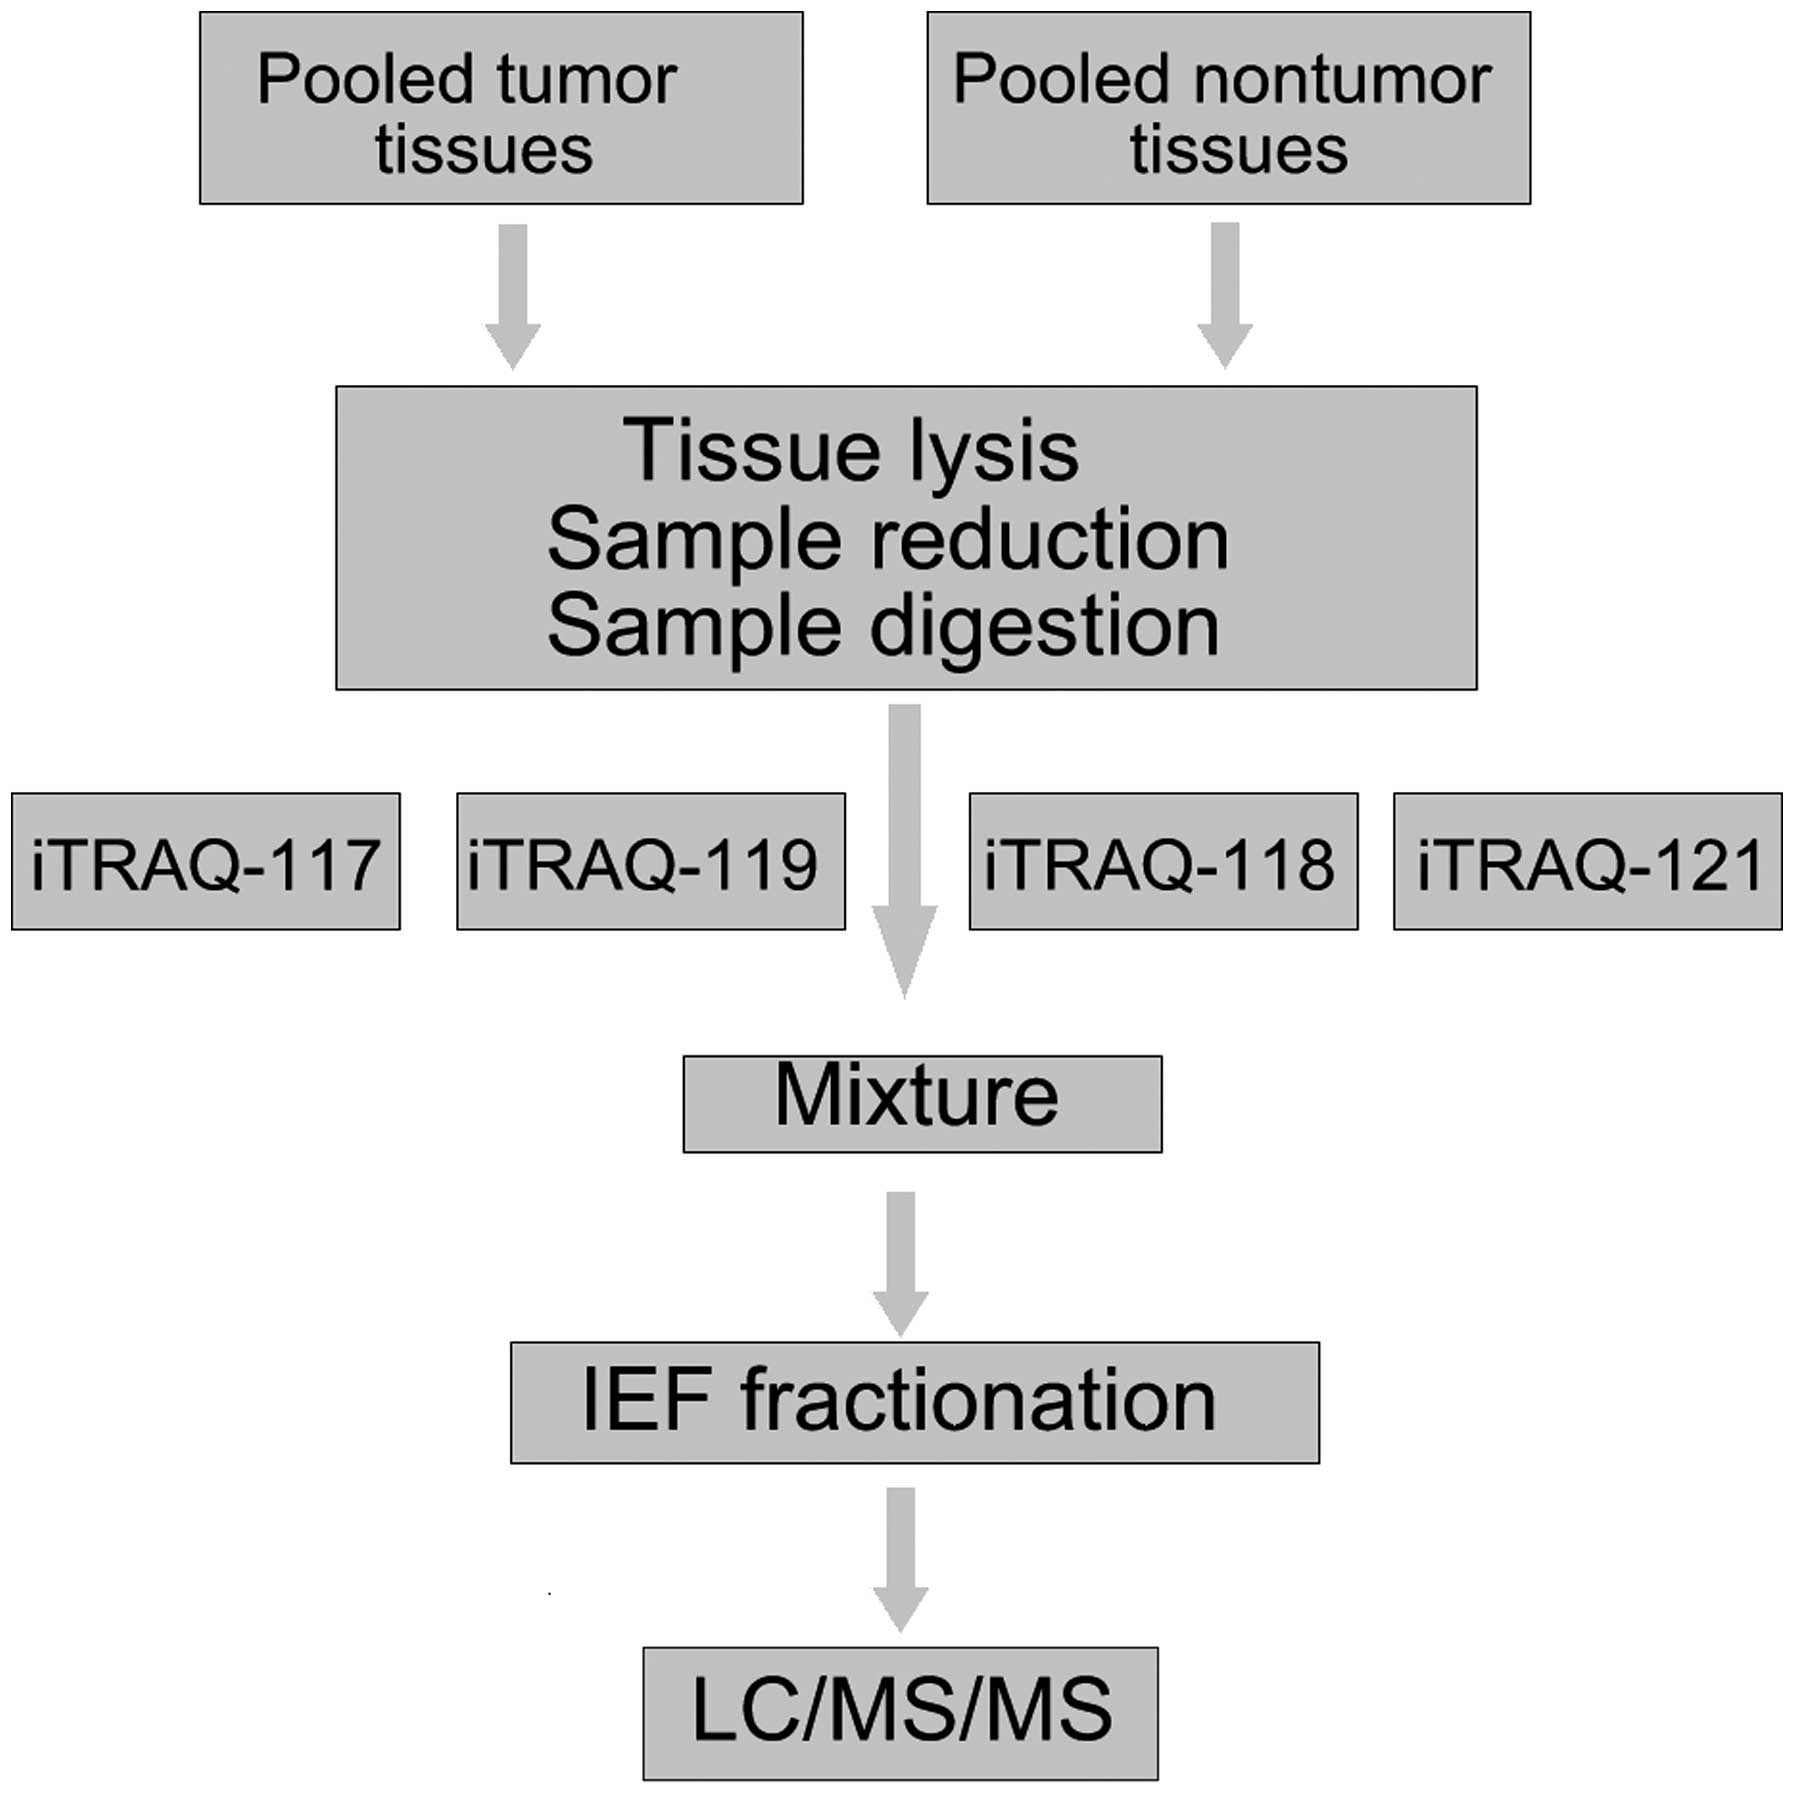
We used the iTRAQ quantification to investigate the
mechanism of GC. The ITRAQ assay was performed on pooled tumor
tissues and pooled non-tumor tissues. To improve the confidence and
enhance the range of protein identification, specimens were iTRAQ
labeled in duplicate. Fig. 1 shows
the flow chart of iTRAQ proteomics approach. The ratio of 117:118
and 119:121 expressed the relative protein expression in the GC
tissues compared to non-cancer tissues, which were used as a
control group.
For protein quantitation and identification, we used
ProteinPilot 2.0 software to identify hundreds of proteins. The
protein threshold was set to achieve 95% confidence at 5% FDR
(false discovery rate). To classify proteins as upregulated or
downregulated, we introduced an additional 1.3-fold cut-off for all
iTRAQ ratios (10,13–16).
Therefore, proteins with iTRAQ ratios <0.77 (1/1.3) or >1.3
(1.3/1)-fold cut-off (P<0.05) were considered to be
downregulated or upregulated, respectively (13,17).
The technical variation of data from duplicate experiments was
<30% (12,14,18–21).
A total of 753 unique proteins were identified with 95% confidence,
regardless of whether or not there was a significant P-value in the
iTRAQ ratios. A total of 134 proteins were expressed differently in
gastric cancer compared to non-cancer tissues (51 overexpressed and
83 downregulated proteins). Due to limitations of space, only the
top 30 downregulated and upregulated proteins in both pooled
non-cancer tissues and pooled cancer tissues are shown in Table II.
| Table IIPartial list of proteins found to be
expressed at different levels between gastric cancer and non-cancer
tissues by iTraq analysis.a |
Table II
Partial list of proteins found to be
expressed at different levels between gastric cancer and non-cancer
tissues by iTraq analysis.a
| N | Accession | Gene symbol | Protein name | Peptides (95%) | Pooled tumor
tissues: Pooled non-tumor tissues (117:118) | PVal 117:118 | Pooled tumor
tissues: Pooled non-tumor tissues (119:121) | PVal 119:121 |
|---|
| Top 30 proteins
downregulated in gastric cancer tissues |
| 1 |
IPI:IPI00736755.2 | PGA3 | Pepsin A
preproprotein | 23 | 0.0549541 | 2.97E-05 | 0.0751623 | 4.11E-05 |
| 2 |
IPI:IPI00978830.1 | LIPF | Gastric
triacylglycerol lipase isoform 1 | 28 | 0.0608135 | 4.36E-08 | 0.0642688 | 0.0483242 |
| 3 |
IPI:IPI00022213.1 | PGC | Gastricsin | 19 | 0.0685488 | 0.0063132 | 0.1066596 | 0.0139245 |
| 4 |
IPI:IPI00016421.1 | ATP4B |
Potassium-transporting ATPase subunit
β | 5 | 0.0887156 | 0.0361436 | 0.0625173 | 0.0337841 |
| 5 |
IPI:IPI01018979.1 | ADH1B | Highly similar to
alcohol dehydrogenase 1B | 33 | 0.1047129 | 0.0005454 | 0.2466039 | 0.0016409 |
| 6 |
IPI:IPI00218919.7 | ATP4A |
Potassium-transporting ATPase α chain
1 | 20 | 0.1056817 | 2.64E-06 | 0.0879023 | 0.0412746 |
| 7 |
IPI:IPI00022391.1 | APCS | Serum amyloid
P-component | 11 | 0.1076465 | 3.17E-05 | 0.1294196 | 0.0001172 |
| 8 |
IPI:IPI00011107.2 | IDH2 | Isocitrate
dehydrogenase [NADP], mitochondrial | 34 | 0.1106624 | 7.96E-12 | 0.1202264 | 4.19E-12 |
| 9 |
IPI:IPI00749381.2 | GKN1 | Gastrokine-1 | 20 | 0.1158777 | 0.0018602 | 0.1076465 | 0.0021484 |
| 10 |
IPI:IPI00845275.1 | PDIA2 | Protein disulfide
isomerase family A, member 2 variant | 10 | 0.1258925 | 1.24E-05 | 0.2511886 | 0.0006102 |
| 11 |
IPI:IPI00220327.4 | KRT1 | Keratin, type II
cytoskeletal 1 | 22 | 0.1270574 | 0.0052752 | 0.5011872 | 0.004303 |
| 12 |
IPI:IPI00003966.2 | CA9 | Carbonic anhydrase
9 | 7 | 0.1355189 | 0.000368 | 0.1330454 | 0.0006226 |
| 13 |
IPI:IPI00022200.4 | COL6A3 | Isoform 1 of
collagen α-3 (VI) chain | 262 | 0.1406047 | 0.0123379 | 0.3404082 | 0.0444323 |
| 14 |
IPI:IPI00303476.1 | ATP5B | ATP synthase
subunit β, mitochondrial | 80 | 0.144544 | 6.98E-05 | 0.2167704 | 0.0015567 |
| 15 |
IPI:IPI00030363.1 | ACAT1 | Acetyl-CoA
acetyltransferase, mitochondrial | 28 | 0.1485936 | 1.82E-07 | 0.1318257 | 1.08E-07 |
| 16 |
IPI:IPI00022977.1 | CKB | Creatine kinase
B-type | 35 | 0.1513561 | 0.0017889 | 0.1786488 | 0.00546 |
| 17 |
IPI:IPI00017510.3 | MT-CO2 | Cytochrome c
oxidase subunit 2 | 7 | 0.1737801 | 0.0018734 | 0.2108628 | 0.0368749 |
| 18 |
IPI:IPI00218414.5 | CA2 | Carbonic anhydrase
2 | 40 | 0.1803018 | 2.70E-06 | 0.1513561 | 9.11E-06 |
| 19 |
IPI:IPI00304840.4 | COL6A2 | Isoform 2C2 of
collagen α-2 (VI) chain | 63 | 0.1819701 | 3.60E-09 | 0.1499685 | 6.39E-09 |
| 20 |
IPI:IPI00010154.3 | GDI1 | GDP dissociation
inhibitor α | 19 | 0.1958845 | 0.0092199 | 0.1367729 | 0.0079184 |
| 21 |
IPI:IPI00005809.7 | SDPR | Serum
deprivation-response protein | 4 | 0.1958845 | 0.0236141 | 0.3019952 | 0.0298823 |
| 22 |
IPI:IPI00790739.1 | ACO2 | Uncharacterized
protein | 21 | 0.197697 | 5.68E-07 | 0.2108628 | 3.77E-07 |
| 23 |
IPI:IPI00100980.9 | EHD2 | EH
domain-containing protein 2 | 24 | 0.2128139 | 3.25E-07 | 0.237684 | 1.05E-06 |
| 24 |
IPI:IPI00980755.1 | PRELP | PRELP protein
(fragment) | 16 | 0.2128139 | 0.0001318 | 0.2070141 | 0.0002912 |
| 25 |
IPI:IPI00291136.4 | COL6A1 | Collagen α-1 (VI)
chain | 70 | 0.2228435 | 3.68E-11 | 0.2805434 | 4.15E-10 |
| 26 |
IPI:IPI00219446.5 | PEBP1 |
Phosphatidylethanolamine-binding protein
1 | 17 | 0.2269865 | 0.0024186 | 0.3981072 | 0.008973 |
| 27 |
IPI:IPI00947502.1 | PCCB | Uncharacterized
protein | 7 | 0.2333458 | 0.0007343 | 0.2964831 | 0.0121887 |
| 28 |
IPI:IPI00024990.6 | ALDH6A1 |
Methylmalonate-semialdehyde dehydrogenase
[acylating], mitochondrial | 11 | 0.2488857 | 0.0102212 | 0.2290868 | 0.0001452 |
| 29 |
IPI:IPI00105407.2 | AKR1B10 | Aldo-keto reductase
family 1 member B10 | 27 | 0.2511886 | 2.65E-05 | 0.2511886 | 0.000433 |
| 30 |
IPI:IPI00440493.2 | ATP5A1 | ATP synthase
subunit α, mitochondrial | 78 | 0.2535129 | 9.42E-10 | 0.3047895 | 5.82E-07 |
| Top 30 proteins
upregulated in gastric cancer tissues |
| 1 |
IPI:IPI00450768.7 | KRT17 | Type I cytoskeletal
17 | 33 | 33.11311 | 0.0052055 | 14.19058 | 0.0004071 |
| 2 |
IPI:IPI00009867.3 | KRT5 | Type II
cytoskeletal 5 | 33 | 24.888571 | 0.0007924 | 10 | 0.0053287 |
| 3 |
IPI:IPI00300725.7 | KRT6A | Type II
cytoskeletal 6A | 39 | 19.769699 | 0.0013697 | 7.0469308 | 0.0016057 |
| 4 |
IPI:IPI00021827.3 | DEFA3 | Neutrophil defensin
3 | 6 | 18.53532 | 0.0417279 | 8.7096357 | 0.0440994 |
| 5 |
IPI:IPI00027486.4 | CEACAM5 | Carcinoembryonic
antigen-related 5 cell adhesion molecule | 9 | 12.24616 | 0.0185231 | 3.7670381 | 0.0209548 |
| 6 |
IPI:IPI00916480.1 | MIR1244 | PTMA
uncharacterized protein | 14 | 10.28016 | 0.0166693 | 11.06624 | 0.0257446 |
| 7 |
IPI:IPI00022255.1 | OLFM4 | Olfactomedin-4 | 8 | 9.7274723 | 0.0016244 | 12.13389 | 0.0088202 |
| 8 |
IPI:IPI00022246.1 | AZU1 | Azurocidin | 5 | 6.5463619 | 0.0007553 | 4.9203949 | 0.0029804 |
| 9 |
IPI:IPI00218852.4 | VIL1 | Villin-1 | 17 | 6.1944108 | 9.14E-07 | 3.63078 | 0.0008961 |
| 10 |
IPI:IPI01021414.1 | KRT8 | KRT8 57 kDa
protein? | 180 | 5.8076439 | 1.25E-06 | 3.8018939 | 6.68E-08 |
| 11 |
IPI:IPI00007047.1 | S100A8 | Protein
S100-A8 | 10 | 5.0582471 | 0.0008862 | 4.4463129 | 0.0011074 |
| 12 |
IPI:IPI00032140.4 | SERPINH1 | Serpin H1 | 17 | 4.9659228 | 0.0007057 | 2.3550489 | 0.0239581 |
| 13 |
IPI:IPI00783625.2 | SERPINB5 | Isoform 1 of serpin
B5 | 9 | 4.405549 | 0.0192273 | 9.7274723 | 0.0080167 |
| 14 |
IPI:IPI00009750.1 | LGALS4 | Galectin-4 | 23 | 4.3251381 | 0.0005328 | 5.546257 | 1.48E-05 |
| 15 |
IPI:IPI00479145.3 | KRT19 | Type I cytoskeletal
19 | 116 | 4.168694 | 0.000821 | 2.9648311 | 0.0027496 |
| 16 |
IPI:IPI00554788.5 | KRT18 | Type I cytoskeletal
18 | 121 | 4.130475 | 1.00E-05 | 2.488857 | 0.0002817 |
| 17 |
IPI:IPI00299024.9 | BASP1 | Isoform 1 of brain
acid soluble protein 1 | 4 | 3.872576 | 0.0149005 | 3.7670381 | 0.002711 |
| 18 |
IPI:IPI00014516.2 | CALD1 | Isoform 1 of
caldesmon | 27 | 3.698282 | 0.0001292 | 3.2508731 | 0.0184579 |
| 19 |
IPI:IPI00013895.1 | S100A11 | Protein
S100-A11 | 14 | 3.664376 | 0.0196098 | 4.2072659 | 0.0168933 |
| 20 |
IPI:IPI00301395.4 | CPVL | Probable serine
carboxypeptidase | 4 | 3.5974929 | 0.0424279 | 4.3251381 | 0.0232384 |
| 21 |
IPI:IPI00465431.8 | LGALS3 | Galectin-3 | 18 | 3.3728731 | 0.0064229 | 2.9648311 | 0.0031662 |
| 22 |
IPI:IPI00027462.1 | S100A9 | Protein
S100-A9 | 12 | 3.2508731 | 0.0015637 | 3.4994521 | 0.000575 |
| 23 |
IPI:IPI00888280.3 | LOC100133944 | IgGFc-binding
protein-like | 54 | 3.2210691 | 1.23E-05 | 3.1622779 | 9.05E-08 |
| 24 |
IPI:IPI00011448.1 | MUC13 | Mucin-13 | 4 | 3.2210691 | 0.0320349 | 2.85759 | 0.0479055 |
| 25 |
IPI:IPI00298497.3 | FGB | Fibrinogen β
chain | 65 | 3.1622779 | 6.71E-07 | 2.290868 | 7.18E-06 |
| 26 |
IPI:IPI00607818.3 | MYH14 | Isoform 6 of
myosin-14 | 75 | 2.9648311 | 2.35E-05 | 2.3120649 | 0.0072173 |
| 27 |
IPI:IPI00000861.1 | LASP1 | Isoform 1 of LIM
and SH3 domain protein 1 | 9 | 2.910717 | 0.008068 | 3.4994521 | 0.0308382 |
| 28 |
IPI:IPI00018873.1 | NAMPT |
Nicotinamidephosphoribosyltransferase | 11 | 2.85759 | 2.41E-05 | 1.5417 | 0.0388431 |
| 29 |
IPI:IPI00465044.2 | RCC2 | Protein RCC2 | 9 | 2.805434 | 0.0334224 | 5.915617 | 0.0032714 |
| 30 |
IPI:IPI00219221.3 | LGALS7 | Galectin-7 | 4 | 2.7542291 | 0.0326254 | 1.923092 | 0.0436307 |
Cellular and molecular functional
characteristics of the proteins
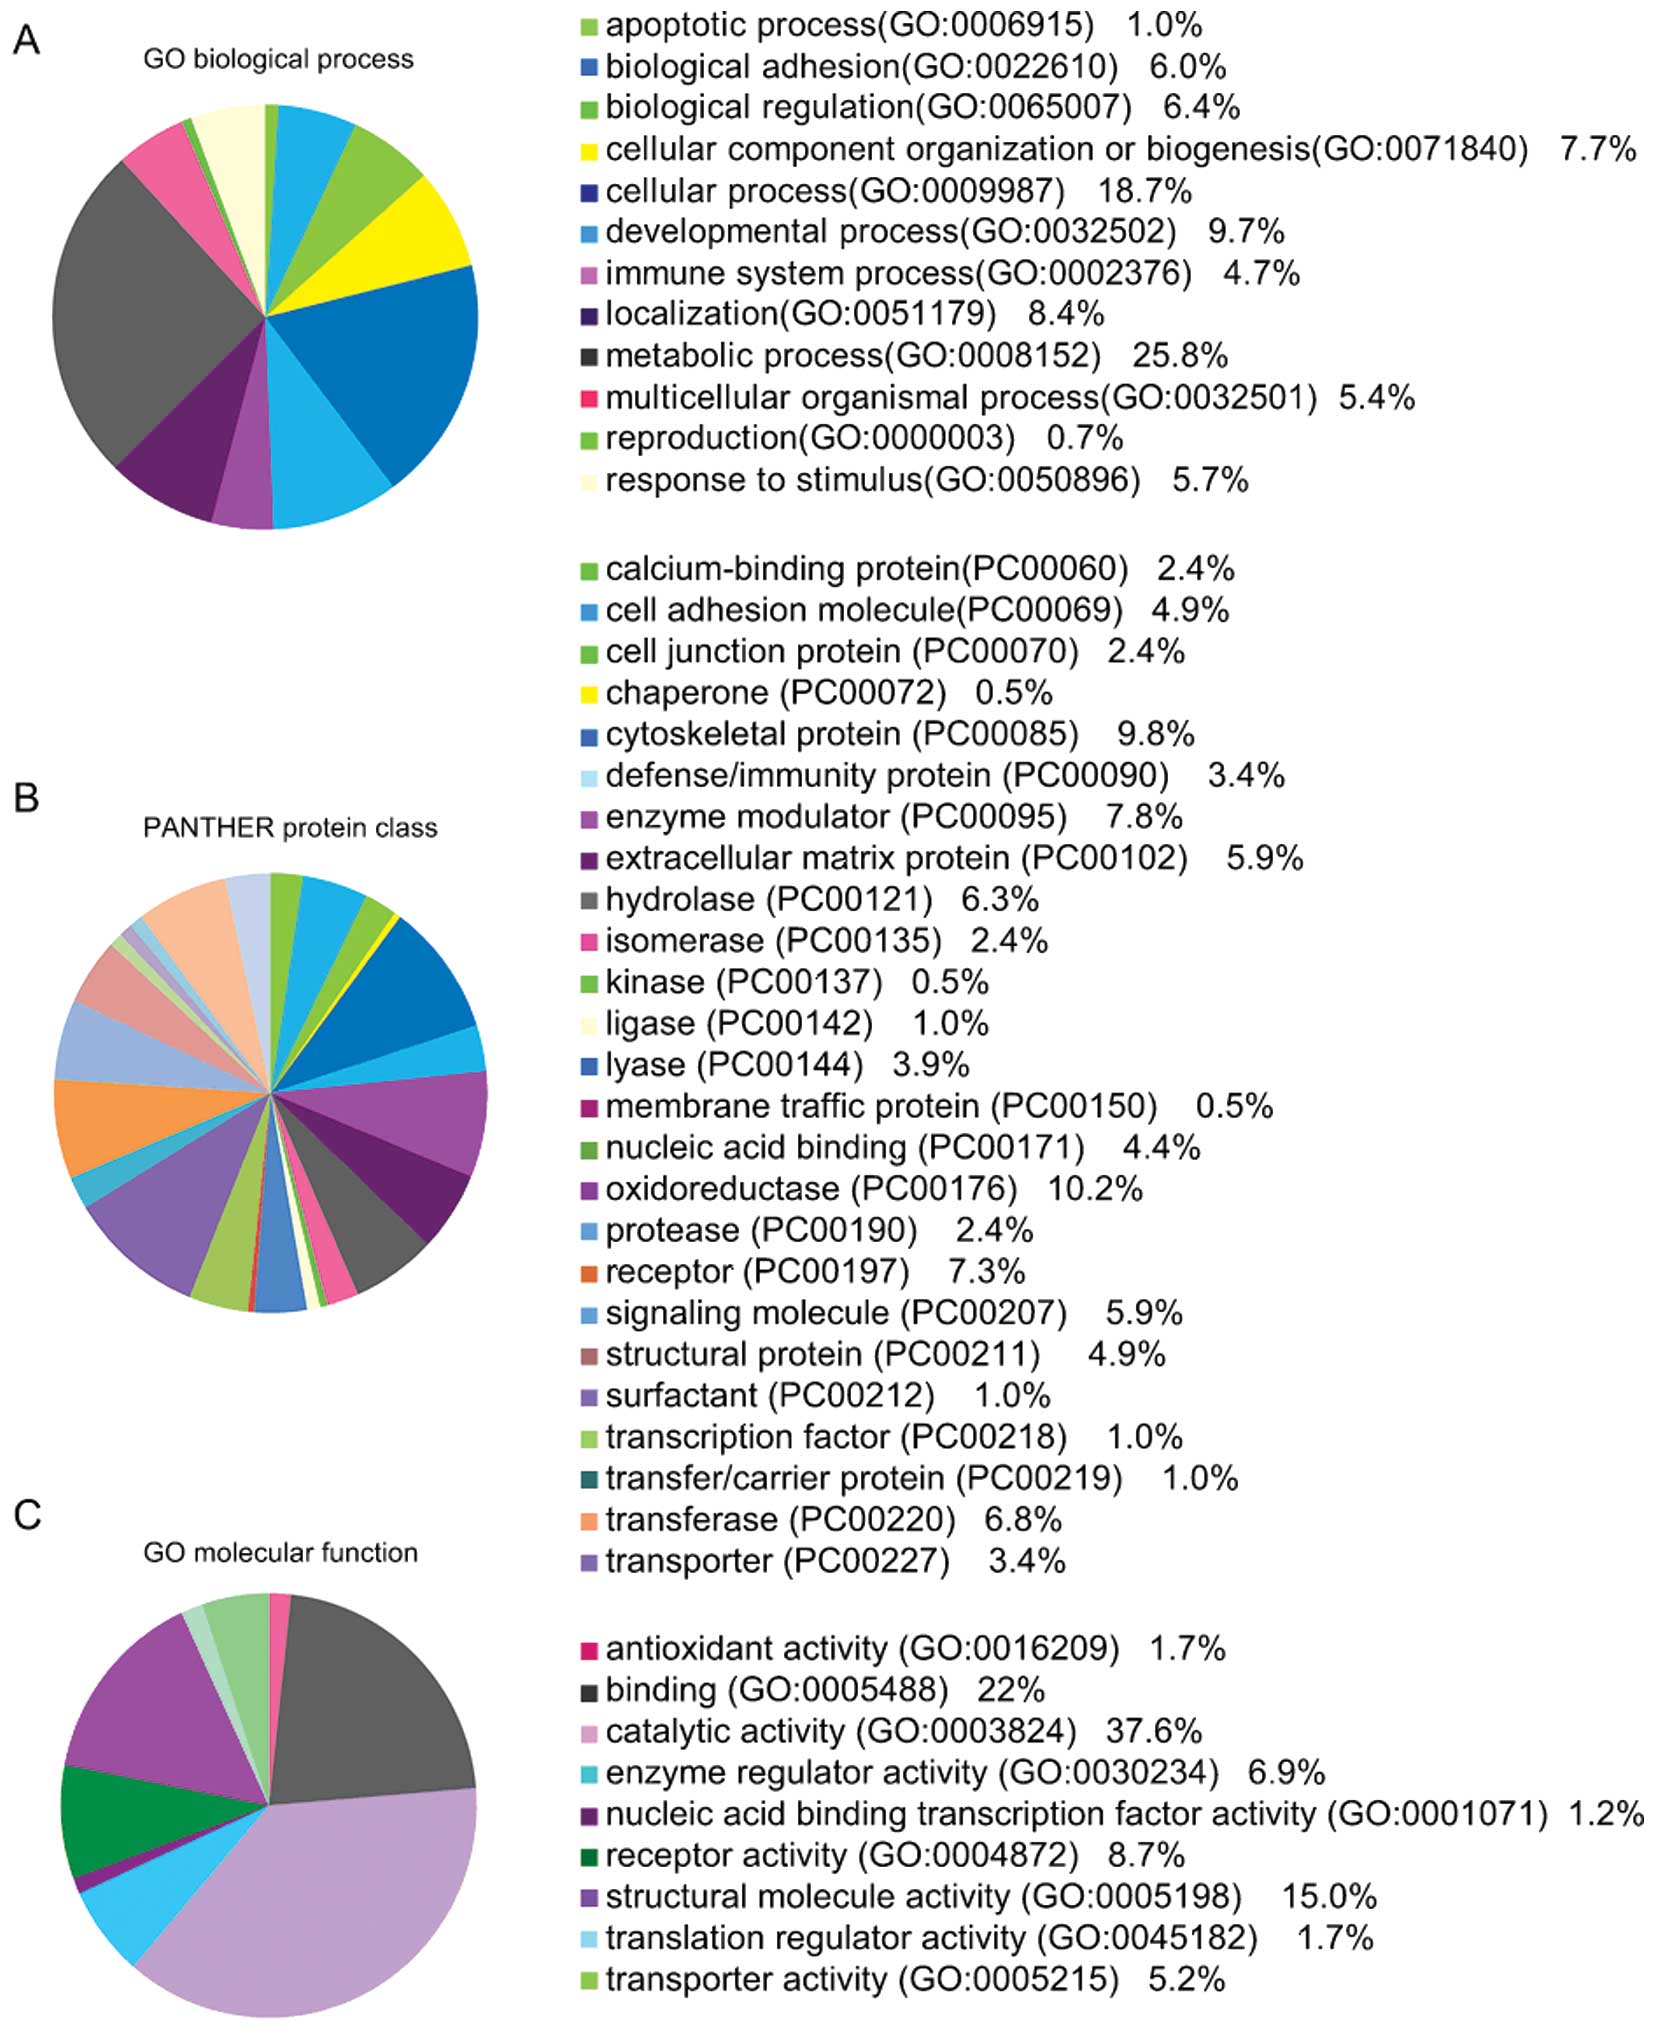
To better identify the functional characteristics,
the 134 aberrantly expressed proteins were uploaded into PANTHER
(www.pantherdb.org/) and grouped on the basis of their
reported biological processes and molecular functions.
The identities of a total of 134 proteins and their
molecular functions are shown in Fig.
2, which include 12 biological processes, 25 protein classes
and 9 molecular functions. Metabolic, cellular and developmental
processes were the most common biological processes reported.
Validation of iTRAQ identified candidate
proteins
To validate the observed protein changes, western
blotting and RT-PCR were performed with identical pooled cancer
samples and non-cancer samples used in the iTRAQ assay. Fig. 3A shows that AZU1, CPVL, OLFM4 and
VIL1 were obviously increased in the gastric cancer tissues,
compared with normal gastric tissues. Although each immunoblot had
its own control, only one representative actin blot is shown.
Fig. 3B shows the mRNA expression
levels of NAPSA, KRT1, BCAM, OLFM4, LGALS7, LGALS3BP, IDH2, GDI1,
EPX, FKBP9, HNRNPAB, LASP1, FGB, CPVL, ACAT1, CALD1, ATP5L, BASP1,
ATP5B, APCS, VIL1, AZU1 and HEXB as standardized to GADPH. As
expected, the mRNA levels of KRT1, OLFM4, LGALS7, LGALS3BP, EPX,
FKBP9, LASP1, FGB, CPVL, CALD1, VIL1, HEXB, BASP1, AZU1 and HNRNPAB
were found to be increased in gastric cancer tissues, whereas the
levels of NAPSA, BCAM, IDH2, GDI1, ACAT1, ATP5L, ATP5B and APCS
were decreased, compared to non-cancer tissues. These results
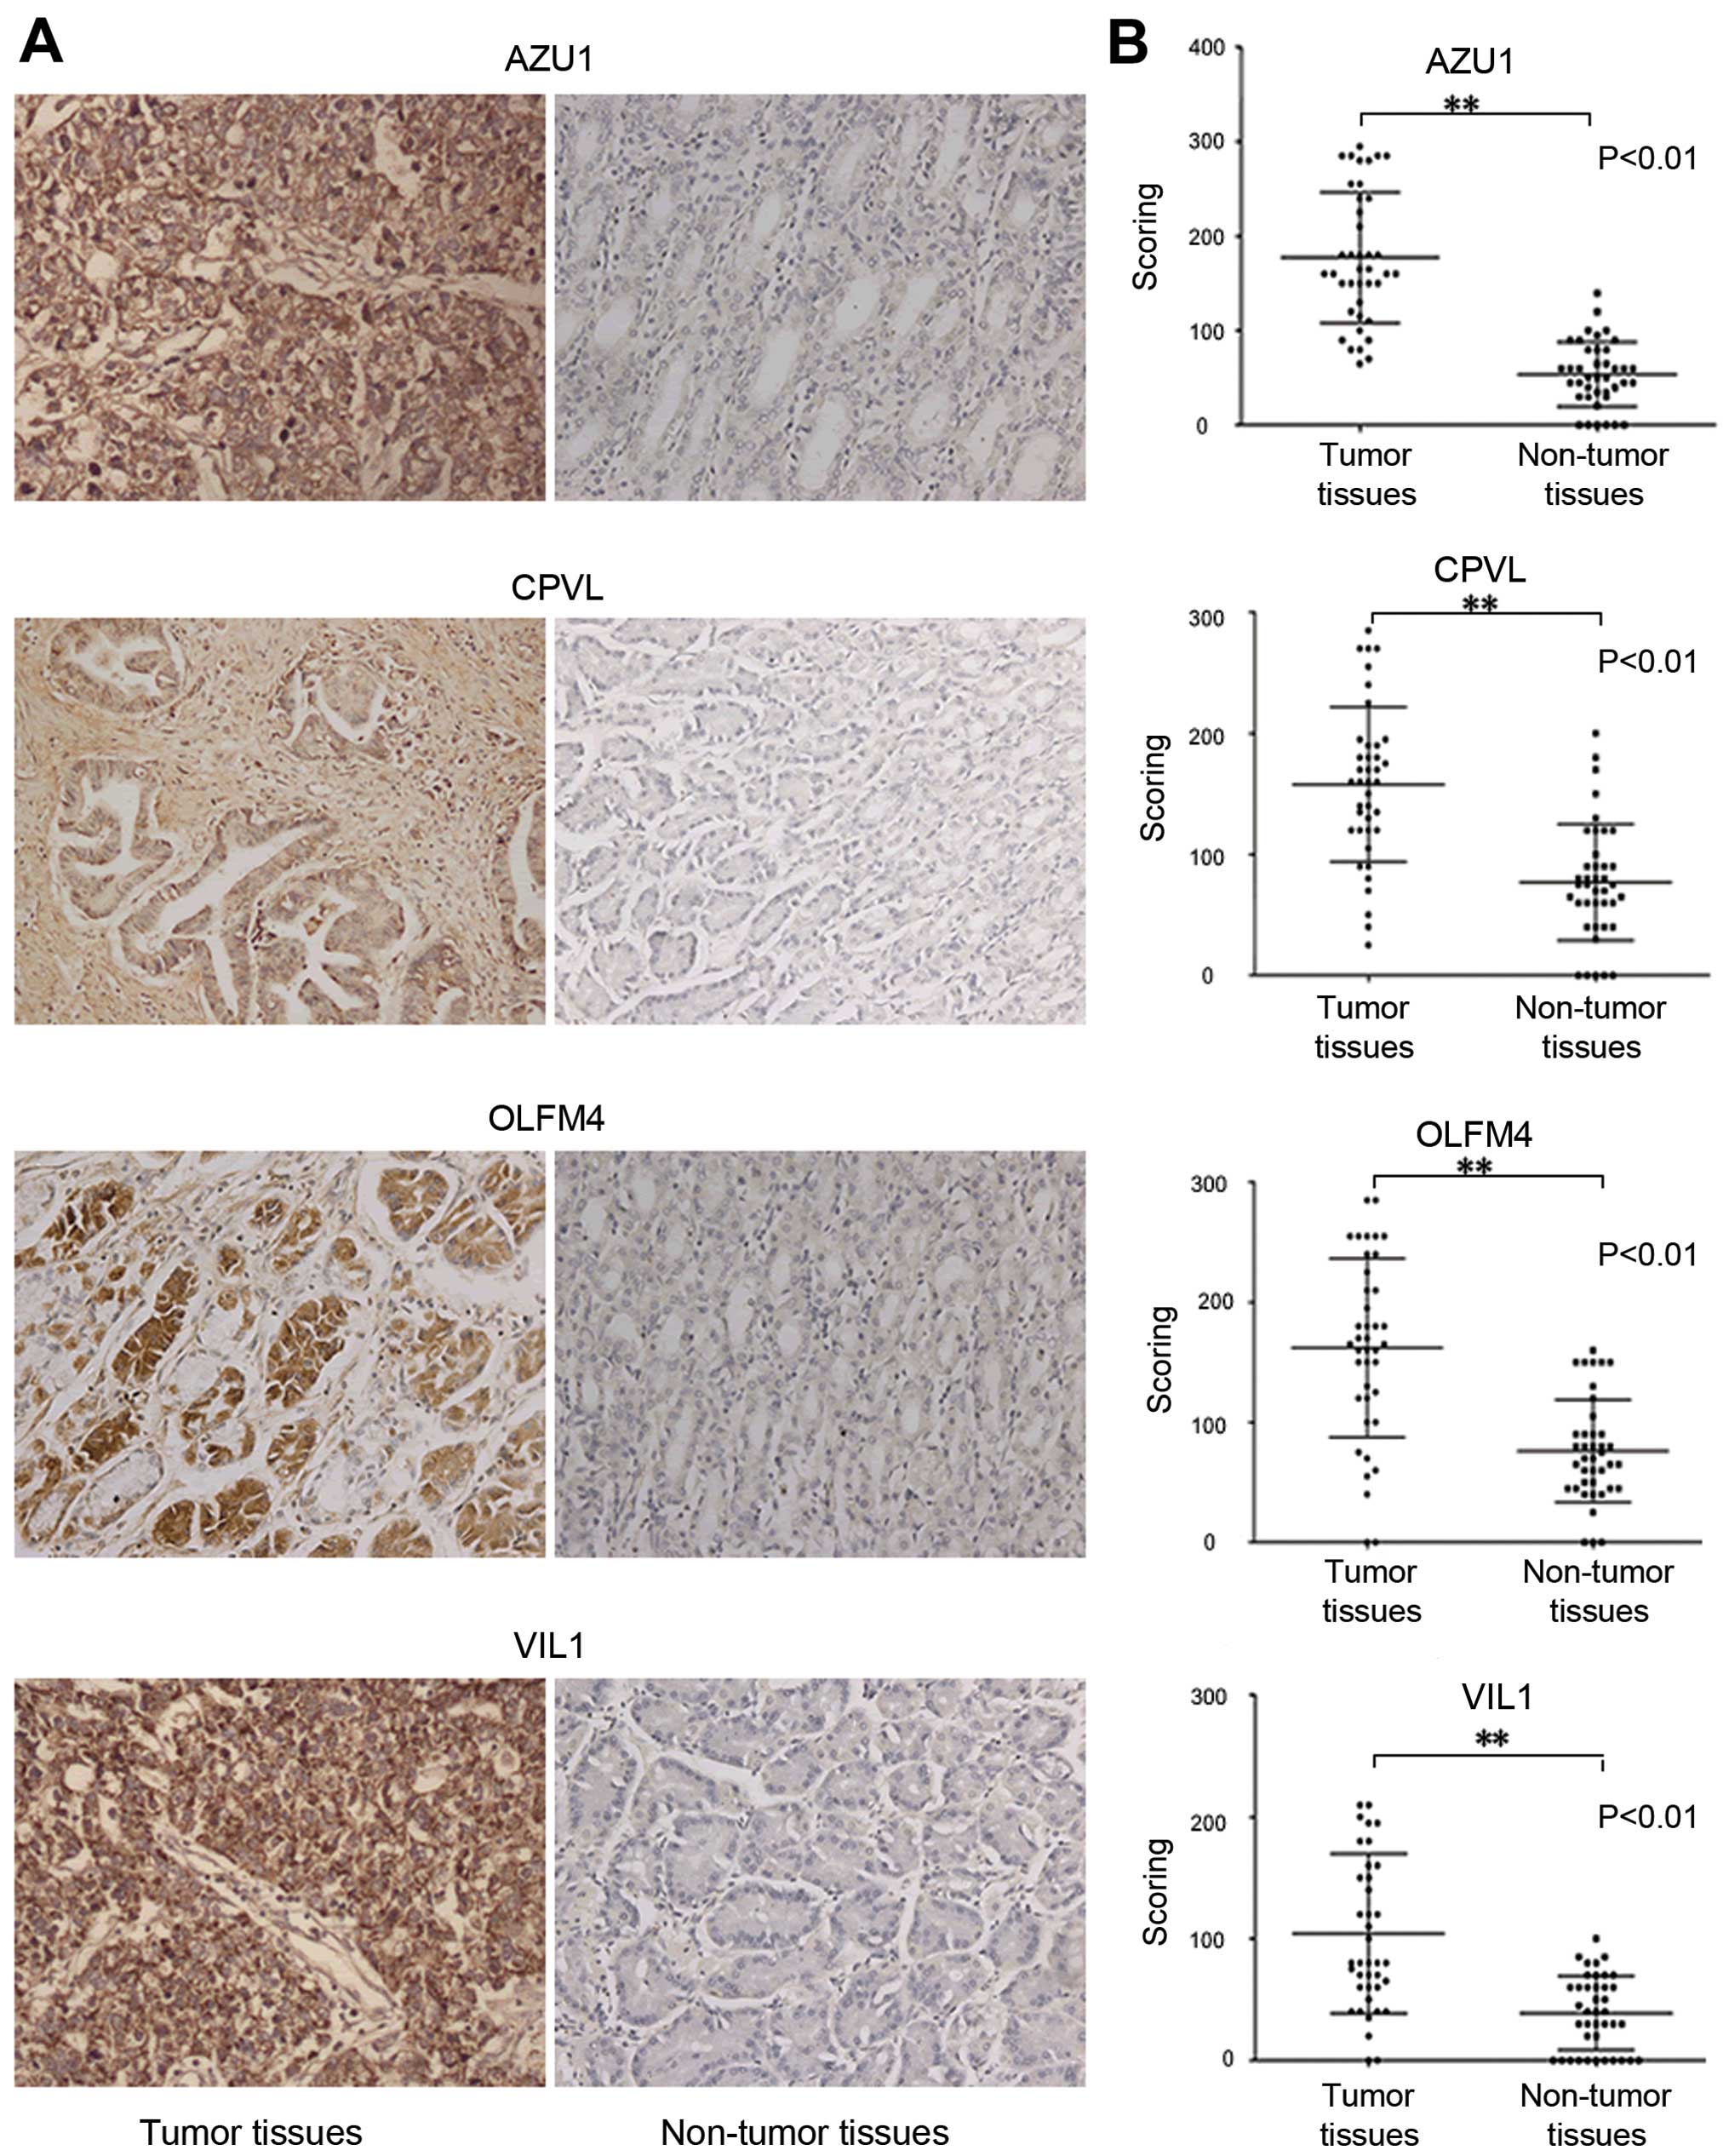
correspond with that revealed by iTRAQ. Similarly, IHC
(immunohistochemistry) in tissue microarrays of gastric cancer
tissues and non-cancerous tissues proved that gastric cancer
tissues expressed increased AZU1, CPVL, OLFM4 and VIL1
immunostaining compared to control tissues (Fig. 4).
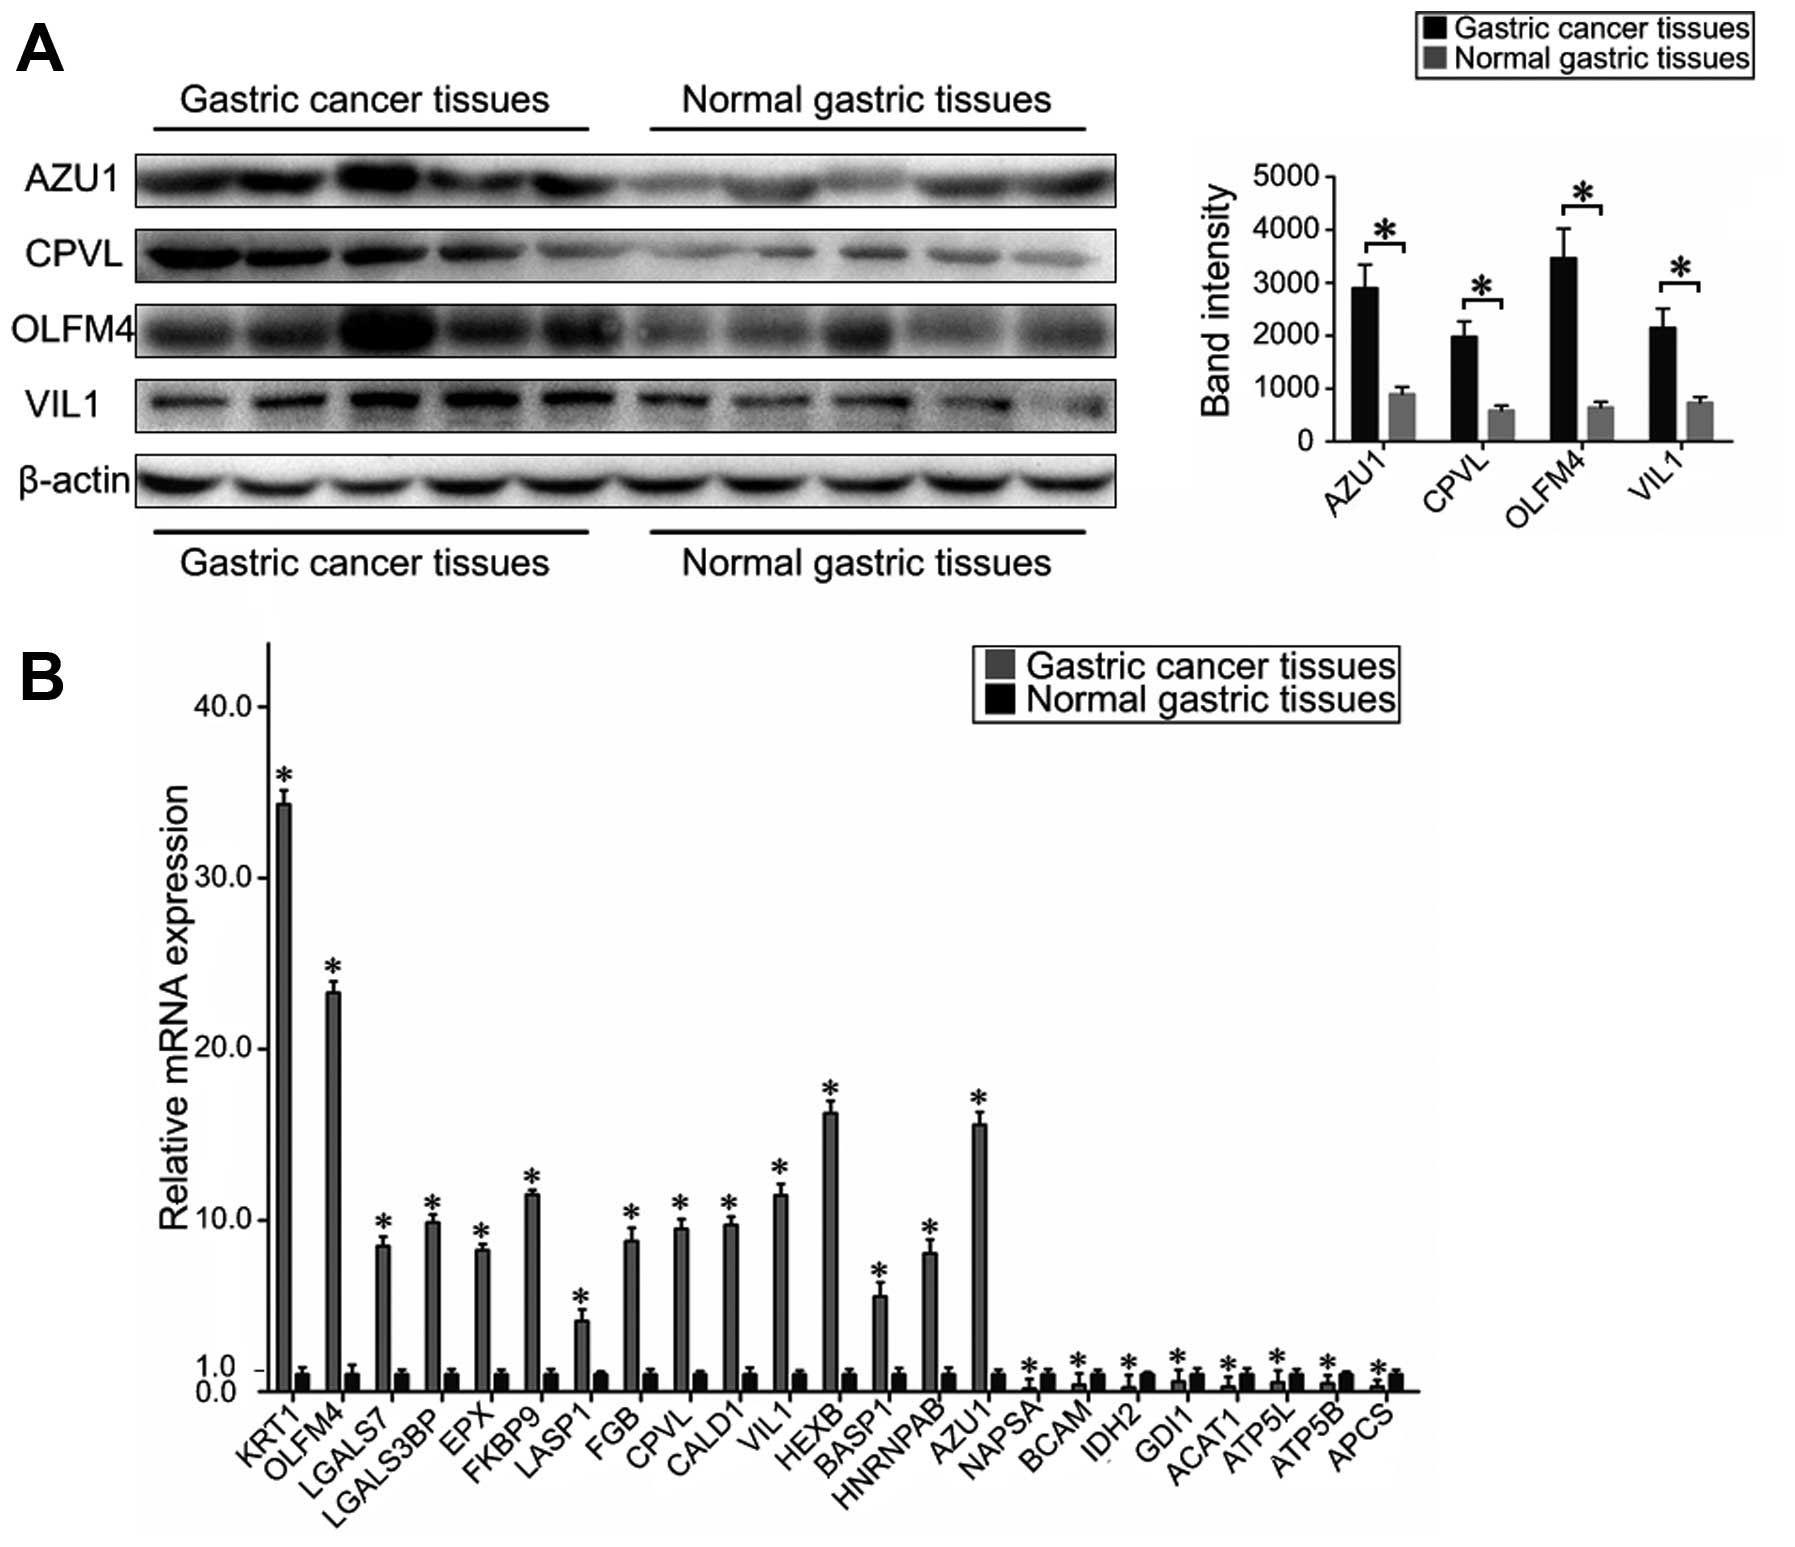 | Figure 3Evaluation of the differentially
expressed proteins in gastric cancer tissues and normal gastric
tissues. (A) A representative western blot analysis for AZU1, CPVL,
OLFM4 and VIL1 expression in gastric cancer tissues and normal
gastric tissues. The expression of proteins AZU1, CPVL, OLFM4 and
VIL1 was significantly increased in cancer tissues compared to
normal gastric tissues (bars indicate SD, *P<0.05).
Actin was used as the normalization standard. (B) Real-time RT-PCR
detected the relative mRNA expression levels of NAPSA, KRT1, BCAM,
OLFM4, LGALS7, LGALS3BP, IDH2, GDI1, EPX, FKBP9, HNRNPAB, LASP1,
FGB, CPVL, ACAT1, CALD1, ATP5L, BASP1, ATP5B, APCS, VIL1, AZU1 and
HEXB as normalized to GADPH (P<0.05). |
OLFM4 plays a role in GC cell invasion,
migration and wound healing and proliferation
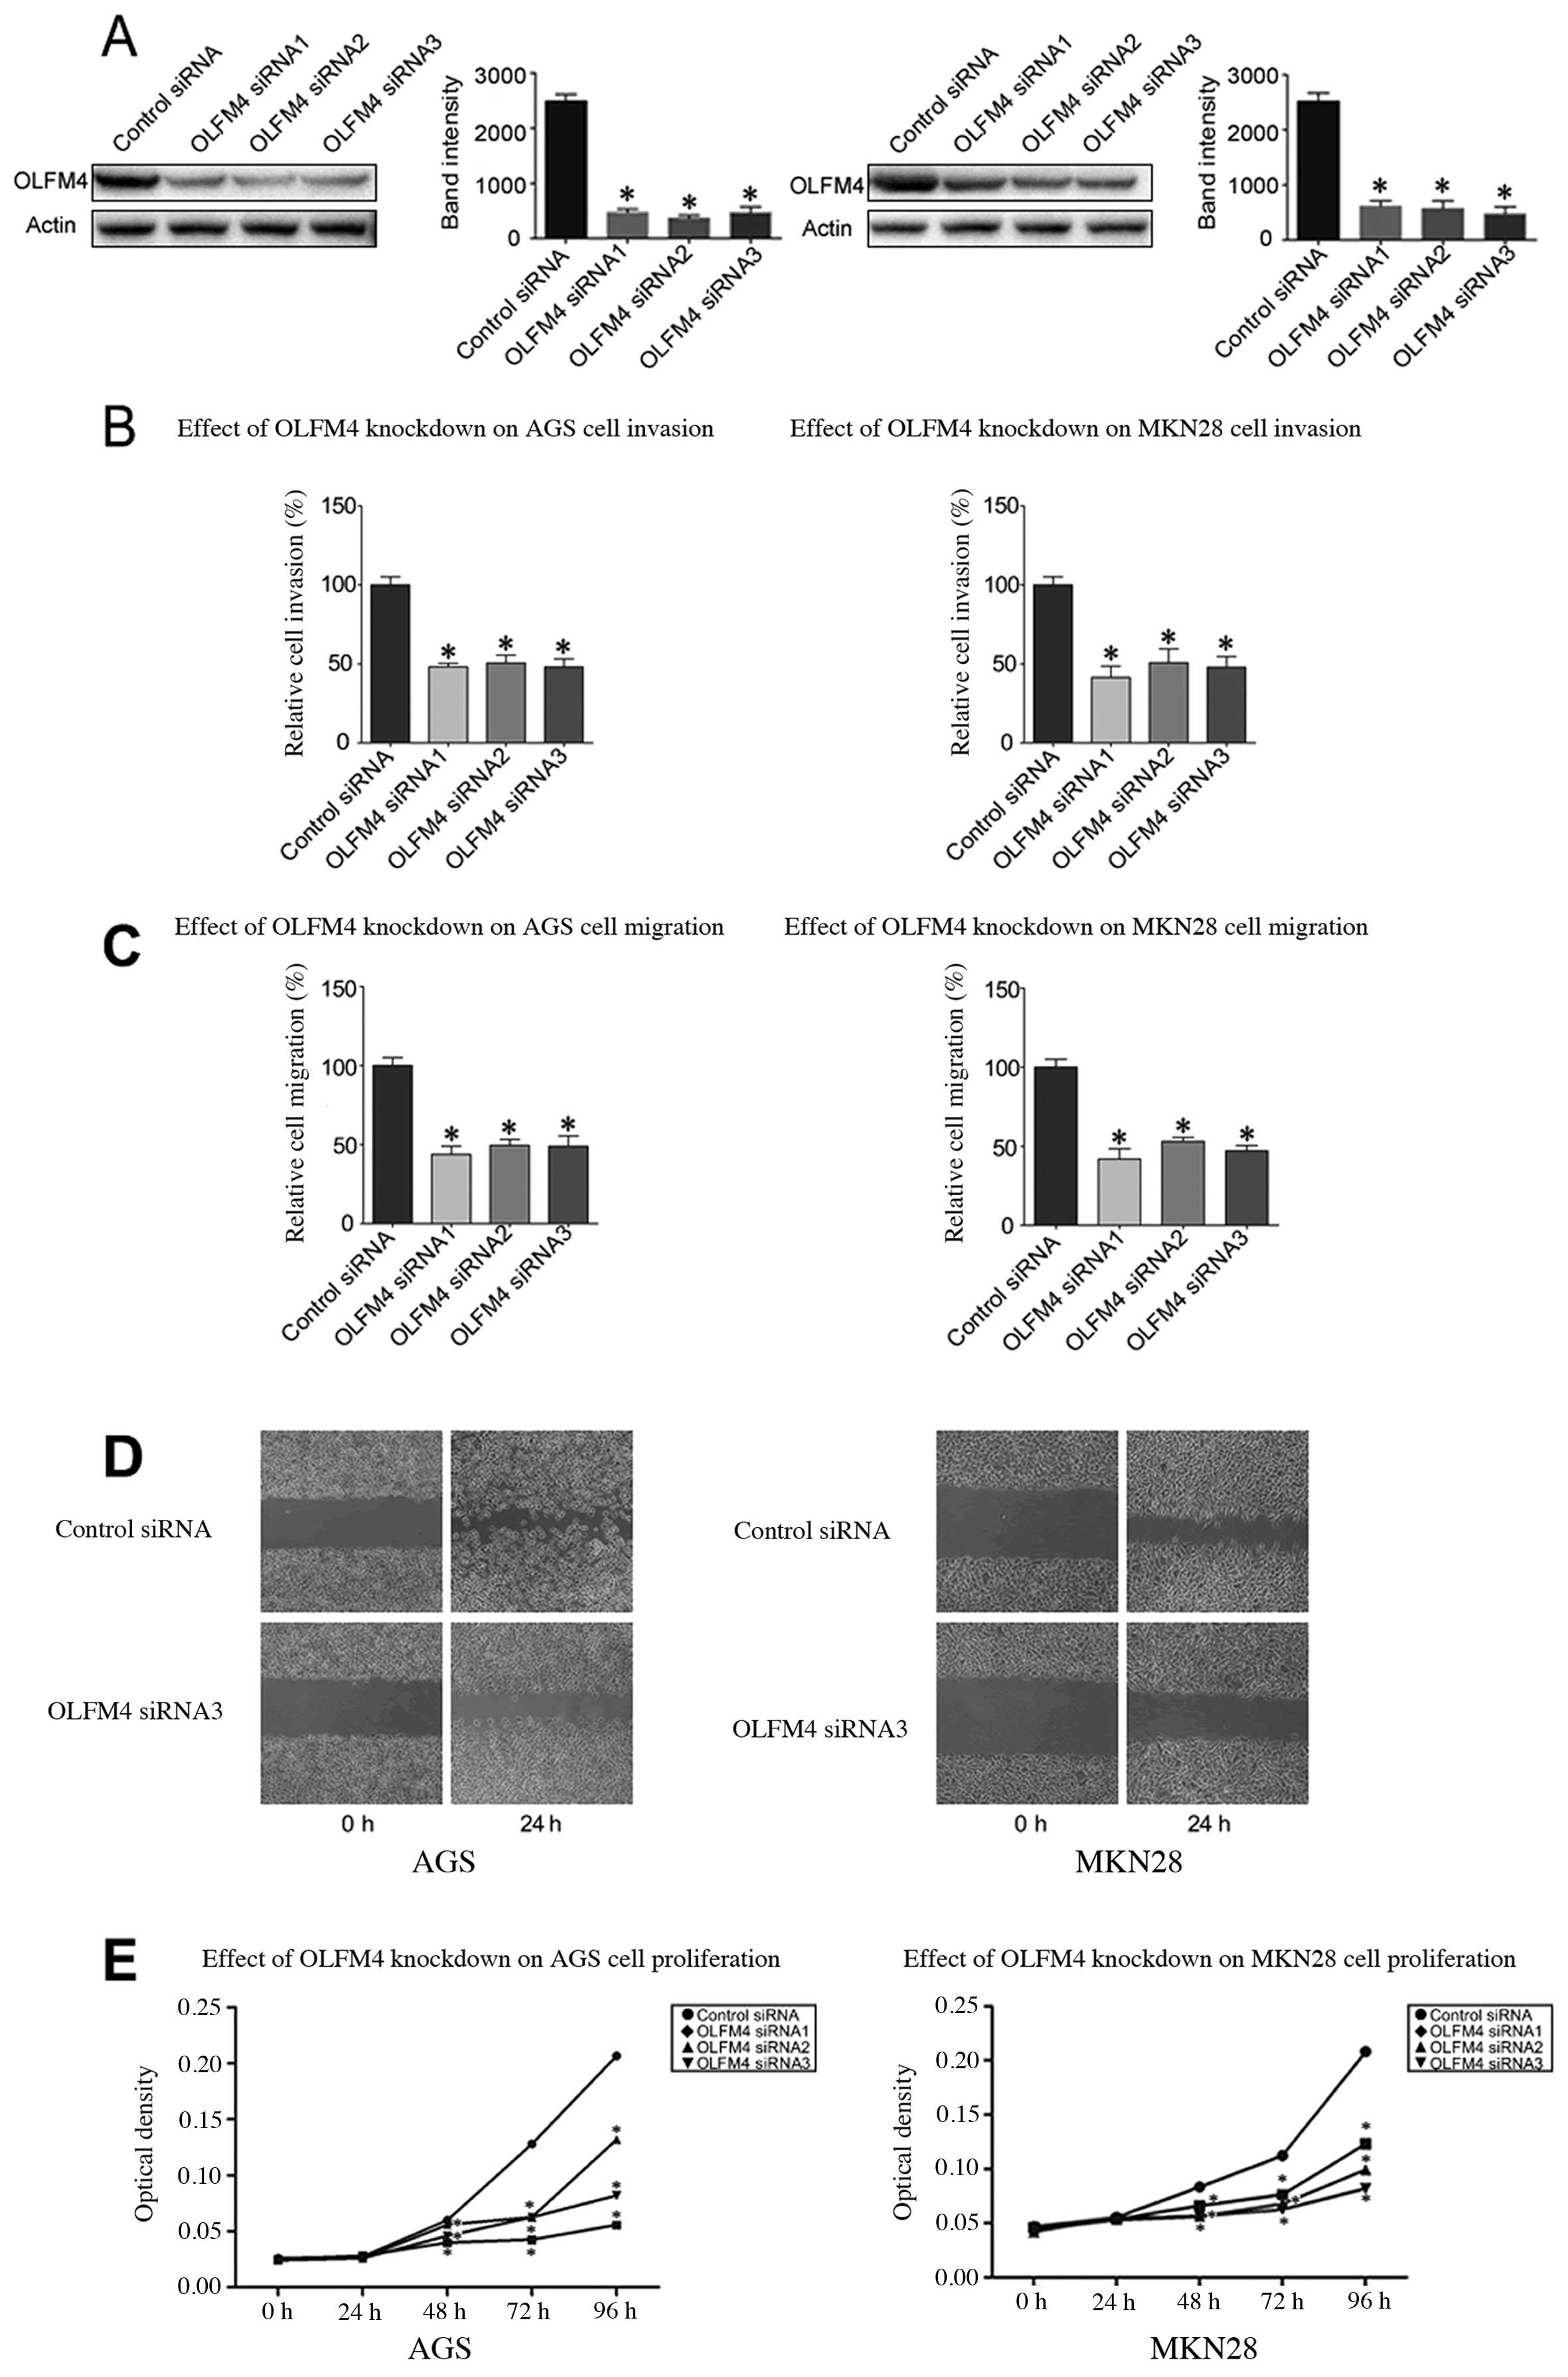
Since we observed that the upregulation of OLFM4 in
gastric cancer is a frequent event and closely associated with
gastric cancer metastasis, we postulated that overexpression of
OLFM4 in gastric cancer cells can promote cell migration and
invasion. Thus, we used siRNA technology to inhibit OLFM4
expression in gastric cancer cell lines. AGS cells and MKN28 cells
were transfected with OLFM4-specific siRNA sequences. According to
western blot analysis, efficient silencing of OLFM4 expression was
demonstrated by the OLFM4-specific siRNA sequences (Fig. 5A). Using RNA interference, we saw
that the downregulation of OLFM4 markedly inhibited the invasion of
AGS and MKN28 cells by 48–50 and 41–50%, respectively, compared to
the controls (P<0.05) (Fig.
5B). The migration assay proved that OLFM4-specific siRNAs
weakened the migration of AGS cells and MKN28 cells by 43–49 and
44–54%, respectively, in comparison with control siRNA (P<0.05)
(Fig. 5C). Similarly, the ability
to close scratch wounds was decreased in AGS and MKN28 cells
(Fig. 5D). We also used the MTS
assay to examine the proliferation of OLFM4-silenced vs. control
AGS cells and MKN28 cells. The proliferation of AGS cells and MKN28
cells was depressed compared to the control cells, indicating that
OLFM4 plays a crucial role in GC cell proliferation (Fig. 5E).
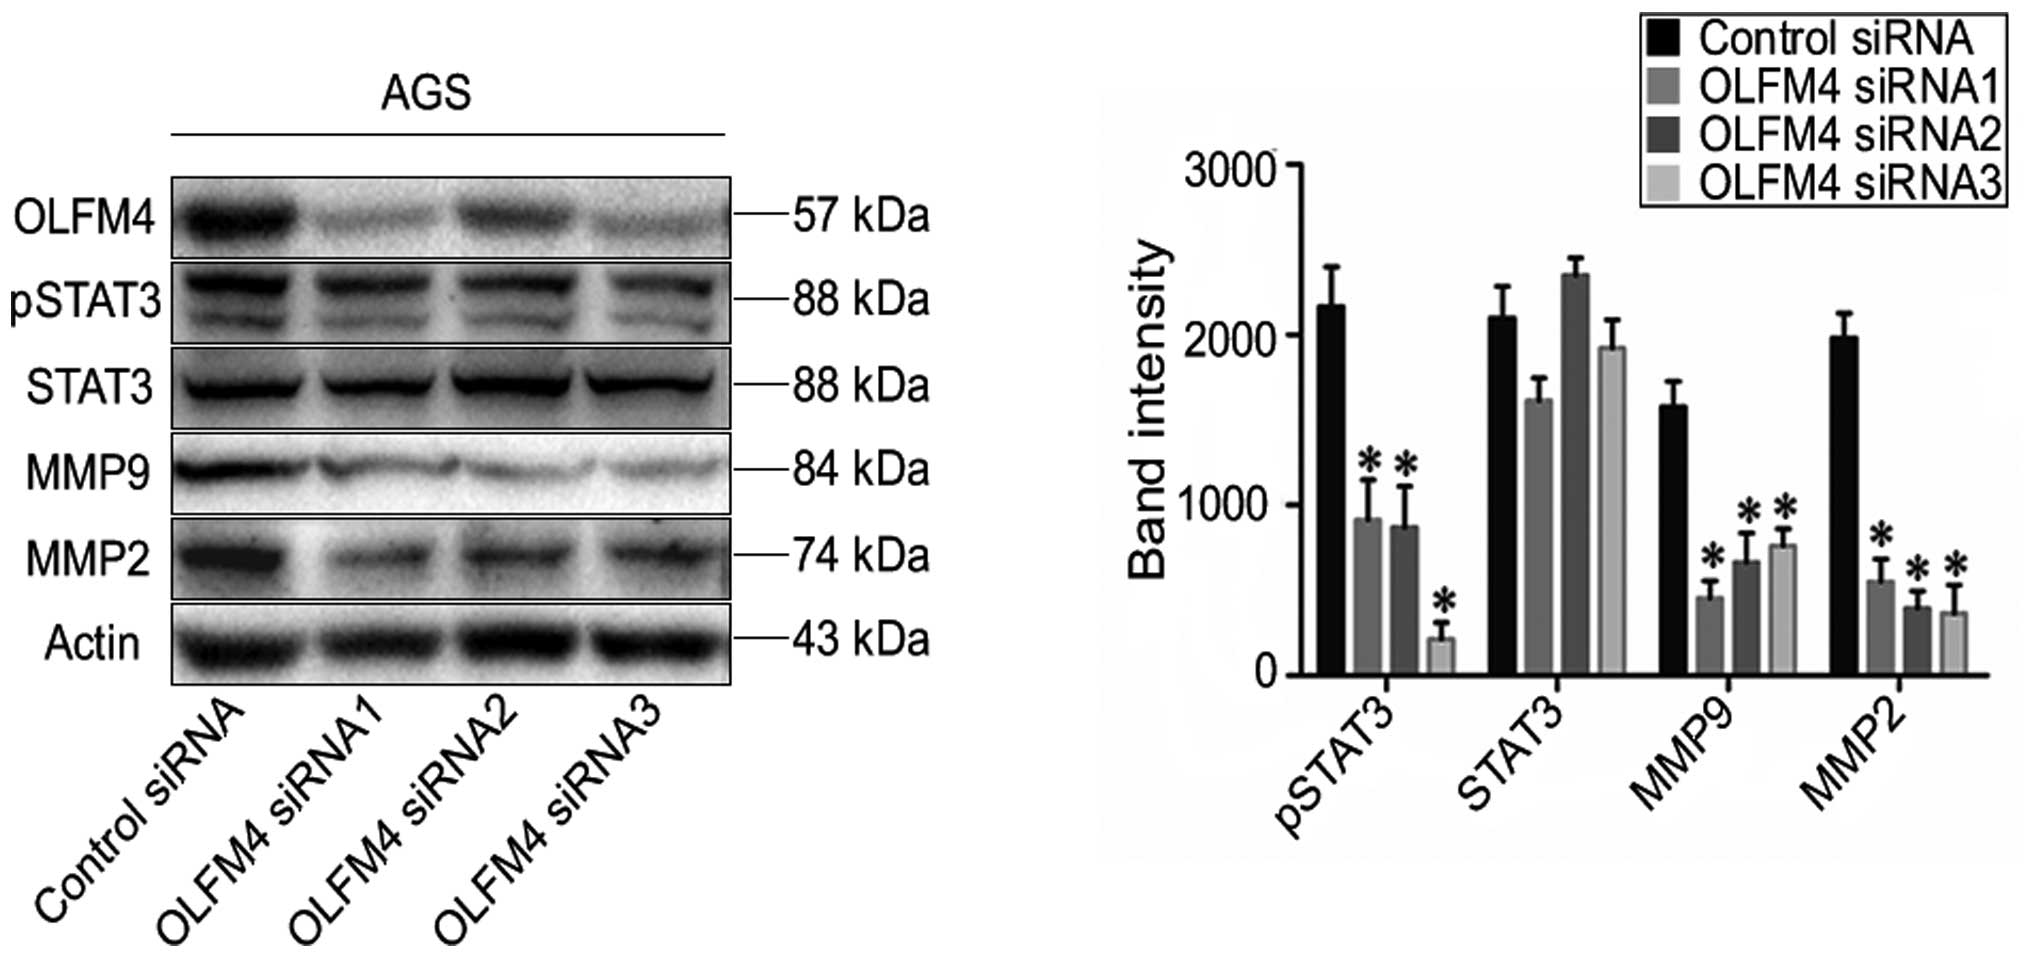
Knockdown of OLFM4 suppresses p-STAT3,
MMP9 and MMP2 protein expression
The expression of p-STAT3, STAT3, MMP9 and MMP2 are
known to participate in the pathogenic mechanism of tumor
metastasis (22–24). To inspect the role of differential
OLFM4 expression, the protein levels of STAT3, p-STAT3, MMP9 and
MMP2 were evaluated in GC cells following OLFM4 silencing. We
observed that the downregulation of OLFM4 inhibits p-STAT3, MMP9
and MMP2 expression at the protein level in AGS cells (P<0.05)
(Fig. 6). A consistent phenotype
was also observed in MKN28 cells after OLFM4 silencing (data not
shown).
Discussion
Gastric cancer is one of the most frequent malignant
tumors worldwide with a high mortality and morbidity. Surgery and
chemotherapy are the mainstream methods of treating this
malignancy, but vast majority of patients have already metastasis
by the time a diagnosis is made. The prognosis of these patients is
still very poor after operation and chemotherapy (25). The 5-year survival rate is
obviously decreased for patients with metastasis, compared to
patients diagnosed early (2).
Investigations into the molecular mechanisms involved in gastric
cancer progression are necessary and may provide insights leading
to improved diagnosis and therapeutic approaches.
The present study used the iTRAQ based proteomics
method to confirm proteins with differential expressions between
patient samples of gastric cancer tissues and non-cancerous
tissues. As a result, 134 aberrantly proteins were identified in
gastric cancer samples. Many of them, including AZU1, CPVL, OLFM4
and VIL1 were identified using western blot analyis, RT-PCR and
IHC. The data indicated that the iTRAQ labeling method is both
reliable and powerful for protein quantification. Moreover, OLFM4
has been proven to be associated with GC cell invasion, migration
and proliferation. The invasion and migration of tumor cells is an
important biological behavior of a tumor and is closely related to
the prognosis of the disease. Furthermore, suppression of OLFM4
expression may be a promising strategy in the development of novel
cancer therapeutic drugs. We discuss below several key proteins
identified in the present study.
Olfactomedin4 (also called as GW112) is an important
member of the family of olfactomedin (26). The protein sequences within OLF
domains are comprised of approximately 260 amino acids (27). They play a significant role in
maintaining the stability of various biological functions,
including neural occurrence, intercellular adhesion, cell cycle
regulation and apoptosis (28).
The unique functional structure and capability of OLFM4 suggests it
can promote the occurrence and developmental progress of malignant
tumors. Previous studies indicated that OLFM4 was overexpressed in
malignancies, including pancreatic carcinoma, lung carcinoma,
breast carcinoma and colorectal carcinoma (29–33).
For example, it was proven that OLFM4 mRNA was upregulated in
cancerous tissues of the colon, breast and lungs (32). In the secreted proteins of head and
neck squamous cells, OLFM4 was found to be present in higher
abundance (33). Zhang et
al (34) showed that forced
overexpression of OLFM4 in prostate cancer cells led to increased
oncogenesis and strongly suggested that OLFM4 is a significant
regulator of cell death, which plays significant roles in cancer
cell survival and cancer growth.
There have been few studies on the function of OLFM4
in gastric cancer cells. We discovered that OLFM4 was significantly
overexpressed in GC tissues compared to non-cancer tissues, and
also investigated the invasion and migration of gastric cancer
cells by silencing OLFM4. The present study revealed that
siRNA-mediated downregulation of OLFM4 significantly weakened the
invasive and migratory properties of AGS and MKN28 cells in
vitro. Previous studies proved that OLFM4 is an extra-cellular
matrix glycoprotein, which is mediated by endogenous cell surface
lectins and cadherin (35).
Alterations in migratory and adhesive capabilities allow cancer
cells to deviate from the structure of normal tissue and to advance
in their malignant progression. OLFM4 also interacts with GRIM-19,
a potent apoptotic inducer, and bound to lectins and cadherins
(33,36). Indeed, we obtained identical
results and showed that OLFM4 induces the proliferation of AGS and
MKN28 cells. Collectively, the evidence suggests that OLFM4 may be
involved in gastric cancer cell migration, invasion and
progression. These results suggest that the involvement of OLFM4 in
GC progression make it a feasible therapeutic and prognostic
tool.
It has been reported that activation of STAT3
signaling pathway is involved in the migration of cancer cells
(22,23). In the present study, we observed
that the upregulation of OLFM4 is closely associated with gastric
cancer metastasis. Thus, we speculate that OLFM4 is involved in the
STAT3 pathway on the basis of these observations. In line with
this, we found that the expression of MMP9, MMP2 and STAT3
activation was decreased after the silencing of OLFM4 in GC cell
lines. Yoon et al (37)
showed that STAT3 is activated by an inherent mechanism under the
stressful conditions of cancer cells, and it induced various
survival factors. In conclusion, the above suggests that OLFM4 may
contribute to the STAT3 signaling pathway in GC.
Apart from OLFM4, other proteins having associations
with gastric cancer were identified in the present study with
supporting literary evidence include VIL1, which was discovered to
be at differential levels in GC patients. VIL1 was selected for
confirmation analysis by western blotting, RT-PCR and IHC. Previous
studies have reported that VIL1 is an actin-modifying protein that
regulates the restructuring of microvillar actin filaments
(38,39). Osborn et al (40) proved that VIL1 was involved in
intestinal metaplasia and gastric carcinoma. VIL1 was useful for
distinguishing normally differentiated epithelial cells from the
simple epithelia lining the gastrointestinal tract (41). Upregulation of VIL1 was observed in
HCC tissues (42). VIL1 may be a
biomarker of metastatic adenocarcinomas.
Another candidate protein in the study found to be
markedly upregulated in GC tissues was AZU1 (also known as CAP37),
an antimicrobial protein. Interestingly, AZU1 is considered as a
chemoattractant for monocytes (43). Raff et al (44) used a model to predict that changes
in AZU1 action could affect cancer progression but were unlikely to
be the major cause of carcinoma. Considering these known functions
of AZU1, AZU1 may play an important role in GC.
CPVL was also confirmed in the present study as an
increased protein in GC tissues. CPVL may play an important role in
antigen presentation, including trimming of peptides, digesting
phagocytosed particles in the lysosome, and participating in an
inflammatory protease cascade (45). However, the link between CPVL and
gastric cancer requires further investigation.
In conclusion, we have performed a comparative
proteomic profile between gastric cancer tissues and adjacent
non-cancer tissues. The resulting datasets of GC proteins supplied
a useful resource for fundamental and translational study. In
addition, we observed that overexpression of OLFM4 may induce the
development and metastasis of gastric cancer. OLFM4 may play a new
role in the development of gastric cancer, and reveals its impact
in gastric cancer cell proliferation and cancer metastasis.
Furthermore, suppression of the OLFM4 expression may be a hopeful
strategy in developing new therapeutic drugs. These findings supply
insight into novel candidate proteins that represent critical
malignant mechanisms that may be accessible targets useful for GC
therapeutic strategies.
Acknowledgements
The present study was supported by the National
Natural Science Foundation of China (nos. 81171560, 30930082,
81171561, 30972584 and 81372399), the National Science and
Technology Major Project of China (2008ZX10002-006,
2012ZX1002007001, 2011ZX09302005, 2012ZX09303001-001 and
2012ZX10002003).
References
|
1
|
Loomis D, Huang W and Chen G: The
International Agency for Research on Cancer (IARC) evaluation of
the carcinogenicity of outdoor air pollution: Focus on China. Chin
J Cancer. 33:189–196. 2014. View Article : Google Scholar : PubMed/NCBI
|
|
2
|
Takeno S, Noguchi T, Kikuchi R, Sato T,
Uchida Y and Yokoyama S: Analysis of the survival period in
resectable stage IV gastric cancer. Ann Surg Oncol. 8:215–221.
2001. View Article : Google Scholar : PubMed/NCBI
|
|
3
|
Klose J and Kobalz U: Two-dimensional
electrophoresis of proteins: An updated protocol and implications
for a functional analysis of the genome. Electrophoresis.
16:1034–1059. 1995. View Article : Google Scholar : PubMed/NCBI
|
|
4
|
Görg A, Obermaier C, Boguth G, Harder A,
Scheibe B, Wildgruber R and Weiss W: The current state of
two-dimensional electrophoresis with immobilized pH gradients.
Electrophoresis. 21:1037–1053. 2000. View Article : Google Scholar : PubMed/NCBI
|
|
5
|
Ross PL, Huang YN, Marchese JN, Williamson
B, Parker K, Hattan S, Khainovski N, Pillai S, Dey S, Daniels S, et
al: Multiplexed protein quantitation in Saccharomyces cerevisiae
using amine-reactive isobaric tagging reagents. Mol Cell
Proteomics. 3:1154–1169. 2004. View Article : Google Scholar : PubMed/NCBI
|
|
6
|
Gygi SP, Rist B, Gerber SA, Turecek F,
Gelb MH and Aebersold R: Quantitative analysis of complex protein
mixtures using isotope-coded affinity tags. Nat Biotechnol.
17:994–999. 1999. View
Article : Google Scholar : PubMed/NCBI
|
|
7
|
Mirgorodskaya OA, Kozmin YP, Titov MI,
Körner R, Sönksen CP and Roepstorff P: Quantitation of peptides and
proteins by matrix-assisted laser desorption/ionization mass
spectrometry using (18)O-labeled internal standards. Rapid Commun
Mass Spectrom. 14:1226–1232. 2000. View Article : Google Scholar : PubMed/NCBI
|
|
8
|
Ong SE, Blagoev B, Kratchmarova I,
Kristensen DB, Steen H, Pandey A and Mann M: Stable isotope
labeling by amino acids in cell culture, SILAC, as a simple and
accurate approach to expression proteomics. Mol Cell Proteomics.
1:376–386. 2002. View Article : Google Scholar : PubMed/NCBI
|
|
9
|
Wang LN, Tong SW, Hu HD, Ye F, Li SL, Ren
H, Zhang DZ, Xiang R and Yang YX: Quantitative proteome analysis of
ovarian cancer tissues using a iTRAQ approach. J Cell Biochem.
113:3762–3772. 2012. View Article : Google Scholar : PubMed/NCBI
|
|
10
|
Yang Y, Toy W, Choong LY, Hou P, Ashktorab
H, Smoot DT, Yeoh KG and Lim YP: Discovery of SLC3A2 cell membrane
protein as a potential gastric cancer biomarker: Implications in
molecular imaging. J Proteome Res. 11:5736–5747. 2012.PubMed/NCBI
|
|
11
|
Livak KJ and Schmittgen TD: Analysis of
relative gene expression data using real-time quantitative PCR and
the 2(−ΔΔC(T)) method. Methods. 25:402–408. 2001. View Article : Google Scholar
|
|
12
|
Ho J, Kong JW, Choong LY, Loh MC, Toy W,
Chong PK, Wong CH, Wong CY, Shah N and Lim YP: Novel breast cancer
metastasis-associated proteins. J Proteome Res. 8:583–594. 2009.
View Article : Google Scholar
|
|
13
|
Gan CS, Chong PK, Pham TK and Wright PC:
Technical, experimental, and biological variations in isobaric tags
for relative and absolute quantitation (iTRAQ). J Proteome Res.
6:821–827. 2007. View Article : Google Scholar : PubMed/NCBI
|
|
14
|
Chen Y, Choong LY, Lin Q, Philp R, Wong
CH, Ang BK, Tan YL, Loh MC, Hew CL, Shah N, et al: Differential
expression of novel tyrosine kinase substrates during breast cancer
development. Mol Cell Proteomics. 6:2072–2087. 2007. View Article : Google Scholar : PubMed/NCBI
|
|
15
|
Chong PK, Lee H, Zhou J, Liu SC, Loh MC,
So JB, Lim KH, Yeoh KG and Lim YP: Reduced plasma APOA1 level is
associated with gastric tumor growth in MKN45 mouse xenograft
model. J Proteomics. 73:1632–1640. 2010. View Article : Google Scholar : PubMed/NCBI
|
|
16
|
Pierce A, Unwin RD, Evans CA, Griffiths S,
Carney L, Zhang L, Jaworska E, Lee CF, Blinco D, Okoniewski MJ, et
al: Eight-channel iTRAQ enables comparison of the activity of six
leukemogenic tyrosine kinases. Mol Cell Proteomics. 7:853–863.
2008. View Article : Google Scholar
|
|
17
|
Zhou C, Simpson KL, Lancashire LJ, Walker
MJ, Dawson MJ, Unwin RD, Rembielak A, Price P, West C, Dive C, et
al: Statistical considerations of optimal study design for human
plasma proteomics and biomarker discovery. J Proteome Res.
11:2103–2113. 2012. View Article : Google Scholar : PubMed/NCBI
|
|
18
|
Chong PK, Lee H, Loh MC, Choong LY, Lin Q,
So JB, Lim KH, Soo RA, Yong WP, Chan SP, et al: Upregulation of
plasma C9 protein in gastric cancer patients. Proteomics.
10:3210–3221. 2010. View Article : Google Scholar : PubMed/NCBI
|
|
19
|
Lim S, Choong LY, Kuan CP, Yunhao C and
Lim YP: Regulation of macrophage inhibitory factor (MIF) by
epidermal growth factor receptor (EGFR) in the MCF10AT model of
breast cancer progression. J Proteome Res. 8:4062–4076. 2009.
View Article : Google Scholar : PubMed/NCBI
|
|
20
|
Yang Y, Lim SK, Choong LY, Lee H, Chen Y,
Chong PK, Ashktorab H, Wang TT, Salto-Tellez M, Yeoh KG, et al:
Cathepsin S mediates gastric cancer cell migration and invasion via
a putative network of metastasis-associated proteins. J Proteome
Res. 9:4767–4778. 2010. View Article : Google Scholar : PubMed/NCBI
|
|
21
|
Choong LY, Lim S, Chong PK, Wong CY, Shah
N and Lim YP: Proteome-wide profiling of the MCF10AT breast cancer
progression model. PLoS One. 5:e110302010. View Article : Google Scholar : PubMed/NCBI
|
|
22
|
Xie TX, Wei D, Liu M, Gao AC, Ali-Osman F,
Sawaya R and Huang S: Stat3 activation regulates the expression of
matrix metalloproteinase-2 and tumor invasion and metastasis.
Oncogene. 23:3550–3560. 2004. View Article : Google Scholar : PubMed/NCBI
|
|
23
|
Yu H, Pardoll D and Jove R: STATs in
cancer inflammation and immunity: A leading role for STAT3. Nat Rev
Cancer. 9:798–809. 2009. View
Article : Google Scholar : PubMed/NCBI
|
|
24
|
Huang Y, Yang M, Yang H and Zeng Z:
Upregulation of the GRIM-19 gene suppresses invasion and metastasis
of human gastric cancer SGC-7901 cell line. Exp Cell Res.
316:2061–2070. 2010. View Article : Google Scholar : PubMed/NCBI
|
|
25
|
Li C, Yan M, Chen J, Xiang M, Zhu ZG, Yin
HR and Lin YZ: Survival benefit of non-curative gastrectomy for
gastric cancer patients with synchronous distant metastasis. J
Gastrointest Surg. 14:282–288. 2010. View Article : Google Scholar
|
|
26
|
Yu L, Wang L and Chen S: Olfactomedin 4, a
novel marker for the differentiation and progression of
gastrointestinal cancers. Neoplasma. 58:9–13. 2011. View Article : Google Scholar
|
|
27
|
Zeng LC, Han ZG and Ma WJ: Elucidation of
subfamily segregation and intramolecular coevolution of the
olfactomedin-like proteins by comprehensive phylogenetic analysis
and gene expression pattern assessment. FEBS Lett. 579:5443–5453.
2005. View Article : Google Scholar : PubMed/NCBI
|
|
28
|
Tomarev SI and Nakaya N: Olfactomedin
domain-containing proteins: Possible mechanisms of action and
functions in normal development and pathology. Mol Neurobiol.
40:122–138. 2009. View Article : Google Scholar : PubMed/NCBI
|
|
29
|
Liu W, Zhu J, Cao L and Rodgers GP:
Expression of hGC-1 is correlated with differentiation of gastric
carcinoma. Histopathology. 51:157–165. 2007. View Article : Google Scholar : PubMed/NCBI
|
|
30
|
Besson D1, Pavageau AH, Valo I, Bourreau
A, Bélanger A, Eymerit-Morin C, Moulière A, Chassevent A,
Boisdron-Celle M, Morel A, et al: A quantitative proteomic approach
of the different stages of colorectal cancer establishes OLFM4 as a
new nonmetastatic tumor marker. Mol Cell Proteomics.
10:M111.0097122011. View Article : Google Scholar : PubMed/NCBI
|
|
31
|
Kobayashi D, Koshida S, Moriai R, Tsuji N
and Watanabe N: Olfactomedin 4 promotes S-phase transition in
proliferation of pancreatic cancer cells. Cancer Sci. 98:334–340.
2007. View Article : Google Scholar : PubMed/NCBI
|
|
32
|
Koshida S, Kobayashi D, Moriai R, Tsuji N
and Watanabe N: Specific overexpression of OLFM4(GW112/HGC-1) mRNA
in colon, breast and lung cancer tissues detected using
quantitative analysis. Cancer Sci. 98:315–320. 2007. View Article : Google Scholar : PubMed/NCBI
|
|
33
|
Marimuthu A, Chavan S, Sathe G,
Sahasrabuddhe NA, Srikanth SM, Renuse S, Ahmad S, Radhakrishnan A,
Barbhuiya MA, Kumar RV, et al: Identification of head and neck
squamous cell carcinoma biomarker candidates through proteomic
analysis of cancer cell secretome. Biochim Biophys Acta.
1834:2308–2316. 2013. View Article : Google Scholar : PubMed/NCBI
|
|
34
|
Zhang X, Huang Q, Yang Z, Li Y and Li CY:
GW112, a novel antiapoptotic protein that promotes tumor growth.
Cancer Res. 64:2474–2481. 2004. View Article : Google Scholar : PubMed/NCBI
|
|
35
|
Liu W, Chen L, Zhu J and Rodgers GP: The
glycoprotein hGC-1 binds to cadherin and lectins. Exp Cell Res.
312:1785–1797. 2006. View Article : Google Scholar : PubMed/NCBI
|
|
36
|
van der Flier LG, Haegebarth A, Stange DE,
van de Wetering M and Clevers H: OLFM4 is a robust marker for stem
cells in human intestine and marks a subset of colorectal cancer
cells. Gastroenterology. 137:15–17. 2009. View Article : Google Scholar : PubMed/NCBI
|
|
37
|
Yoon S, Woo SU, Kang JH, Kim K, Shin HJ,
Gwak HS, Park S and Chwae YJ: NF-κB and STAT3 cooperatively induce
IL6 in starved cancer cells. Oncogene. 31:3467–3481. 2012.
View Article : Google Scholar
|
|
38
|
Rousseau-Merck MF, Simon-Chazottes D,
Arpin M, Pringault E, Louvard D, Guénet JL and Berger R:
Localization of the villin gene on human chromosome 2q35-q36 and on
mouse chromosome 1. Hum Genet. 78:130–133. 1988. View Article : Google Scholar : PubMed/NCBI
|
|
39
|
Yokota E, Tominaga M, Mabuchi I, Tsuji Y,
Staiger CJ, Oiwa K and Shimmen T: Plant villin, lily P-135-ABP,
possesses G-actin binding activity and accelerates the
polymerization and depolymerization of actin in a
Ca2+-sensitive manner. Plant Cell Physiol. 46:1690–1703.
2005. View Article : Google Scholar : PubMed/NCBI
|
|
40
|
Osborn M, Mazzoleni G, Santini D, Marrano
D, Martinelli G and Weber K: Villin, intestinal brush border
hydrolases and keratin polypeptides in intestinal metaplasia and
gastric cancer; an immunohistologic study emphasizing the different
degrees of intestinal and gastric differentiation in signet ring
cell carcinomas. Virchows Arch A Pathol Anat Histopathol.
413:303–312. 1988. View Article : Google Scholar : PubMed/NCBI
|
|
41
|
Robine S, Huet C, Moll R,
Sahuquillo-Merino C, Coudrier E, Zweibaum A and Louvard D: Can
villin be used to identify malignant and undifferentiated normal
digestive epithelial cells? Proc Natl Acad Sci USA. 82:8488–8492.
1985. View Article : Google Scholar : PubMed/NCBI
|
|
42
|
Xieraili M, Yasen M, Mogushi K, Obulhasim
G, Mayinuer A, Aihara A, Tanaka S, Mizushima H, Tanaka H and Arii
S: Villin 1 is a predictive factor for the recurrence of high serum
alpha-fetoprotein-associated hepatocellular carcinoma after
hepatectomy. Cancer Sci. 103:1493–1501. 2012. View Article : Google Scholar : PubMed/NCBI
|
|
43
|
Pereira HA, Shafer WM, Pohl J, Martin LE
and Spitznagel JK: CAP37, a human neutrophil-derived chemotactic
factor with monocyte specific activity. J Clin Invest.
85:1468–1476. 1990. View Article : Google Scholar : PubMed/NCBI
|
|
44
|
Raff JW: Centrosomes and cancer: Lessons
from a TACC. Trends Cell Biol. 12:222–225. 2002. View Article : Google Scholar : PubMed/NCBI
|
|
45
|
Mahoney JA, Ntolosi B, DaSilva RP, Gordon
S and McKnight AJ: Cloning and characterization of CPVL, a novel
serine carboxypeptidase, from human macrophages. Genomics.
72:243–251. 2001. View Article : Google Scholar : PubMed/NCBI
|