Introduction
The MYC oncogene, which encodes a transcription
factor, is directly involved in several processes that regulate
cell fate. Therefore, MYC is expected to be functionally
deregulated in several human neoplasias as a result of genetic and
epigenetic alterations (1). As one of
the first genes found to be amplified in a significant proportion
(8–37%) of breast cancer cases, MYC is considered to promote cell
survival, proliferation, apoptosis, differentiation inhibition and
progression in breast cancer, all of which may indirectly
contribute to metastasis (2,3).
There is a general consensus that MYC amplification
is a characteristic of aggressive breast cancer and a recent study
reported that MYC regulates the expression of 13 different poor
outcome cancer signatures (4). Since
lymph node status is an important factor in breast cancer staging
and therapeutic options, the MYC status in compromised lymph nodes
may represent a potential decision-making variable. MYC
amplification and immunohistochemical staining were reported as
being independent predictors of lymph node metastasis, but other
studies did not report such a correlation (5–7).
Although detailed biomarker profiles of the
metastatic lesions of breast carcinomas are scarce in the
literature, certain studies report a high incidence of MYC
overexpression/amplification in the distant metastases of invasive
ductal carcinoma (6,8,9). However,
whether the MYC status may change in lymph node metastases compared
to that in the corresponding primary breast tumor has not been
clearly determined.
Accumulating evidence suggests that peritumoral
microenvironment and tumor interactions play a critical role in
breast cancer growth and dissemination. Specifically activated
fibroblasts [cancer-associated fibroblasts (CAFs)] that are
recruited into cancer tissue, are potential promoters of tumor
progression (10). However, the MYC
status in the stromal cells of the breast tumor microenvironment,
namely the CAFs, as well in corresponding nodal metastases, has not
been extensively investigated.
The aim of the present study was to assess the
expression of MYC in CAFs and epithelial tumor cells in samples of
primary infiltrative breast carcinomas and paired compromised lymph
nodes represented on tissue microarrays (TMAs). These data were
correlated with clinical parameters and also with the expression of
other markers associated with breast cancer proliferation, such as
Ki67, phospho-mammalian target of rapamycin (p-mTOR), phospho-AKT
(p-AKT), p53, epidermal growth factor receptor (EGFR), as well as
classic predictive markers, such as estrogen receptor (ER),
progesterone receptor (PR) and human epidermal growth factor
receptor 2 (HER2) receptor. We also aimed to assess whether the
expression of these biological markers, either in CAFs or in tumor
epithelial cells, may change in the nodal metastases compared to
the corresponding primary breast cancer.
Patients and methods
Patients
We retrospectively analyzed 80 cases of patients
with primary invasive breast ductal carcinoma not otherwise
specified, who underwent surgery at the Hospital Samuel Libânio
(Pouso Alegre, MG, Brazil) between 1997 and 2005. The mean age of
the patients was 57 years (range, 23–88 years). All the cases were
reviewed in relation to demographic and clinicopathological data.
This study was approved by the Institutional Ethics Committee of
the Hospital Samuel Libânio. The 80 suitable samples from selected
cases were submitted to immunohistochemical reactions and analysis
through the technique of TMA. The characteristics of the study
population are summarized in Table
I.
 | Table I.Clinicopathological parameters of
breast cancer patients (n=80). |
Table I.
Clinicopathological parameters of
breast cancer patients (n=80).
| Characteristics | No. (%) |
|---|
| Age, years [median
(range)] | 57 (23–88) |
| Hormonal status |
|
|
Premenopausal | 21 (26.2) |
|
Postmenopausal | 59 (73.8) |
| Clinical stage |
|
| I | 20 (25.0) |
| II | 32 (40.0) |
| III | 28 (35.0) |
| Mastectomy |
|
| No | 33 (41.3) |
|
Yes | 46 (57.5) |
|
Missing | 1 (1.2) |
| Involved
margins |
|
|
Absent | 15 (18.8) |
|
Present | 65 (81.2) |
| Necrosis |
|
|
Absent | 37 (46.2) |
|
Present | 43 (53.8) |
| Desmoplasia |
|
|
Yes | 80 (100.0) |
| Lymph node
status |
|
|
pN0 | 37 (46.2) |
|
pN+ | 43 (53.8) |
| Histological
grade |
|
| I | 18 (22.5) |
| II | 29 (36.3) |
|
III | 33 (41.2) |
| Nuclear grade |
|
| 1 | 6 (7.5) |
| 2 | 38 (47.5) |
| 3 | 36 (45.0) |
| Tubular
differentiation |
|
| 1 | 3 (3.8) |
| 2 | 26 (32.5) |
| 3 | 51 (63.7) |
| Tumor size |
|
| T1 | 36 (45.0) |
| T2 | 34 (42.5) |
| T3 | 6 (7.5) |
|
Missing | 4 (5.0) |
| Mitoses |
|
|
0–5 | 32 (40.0) |
|
>5 | 48 (60.0) |
The inclusion criteria were as follows: Patients
with available clinical data and with paraffin blocks and
histological slides suitable for immunohistochemical reevaluation.
Cases with inaccessible information were excluded. The inability to
obtain information involved different stages, such as medical
record not retrieved, insufficient clinical data, women who
received any treatment prior to surgery for breast cancer, paraffin
block not retrieved, deteriorated sample, lack of material
representative of the tumor pathology and cases with carcinoma
in situ and other malignancies of the breast.
Construction of TMA
Samples from each tumor were allocated in three
distinct sets of TMAs. The first exclusively contained areas of
epithelial tumor component. The second TMA was built with samples
of the stromal component of the tumor, in order to enable the
assessment of stromal cells within the desmoplastic contingent of
the carcinomas. The third TMA involved 43 cases with lymph node
metastasis, with samples selected from the metastastic lesion of
the major compromised lymph node.
Following preparation of the TMA blocks, 3-mm
sections were collected on slides with special adhesives
(Instrumedics, Inc., San Diego, CA, USA). The TMA was constructed
using the Manual Tissue Arrayer I (Beecher Instruments, Inc., Sun
Prairie, WI, USA).
Immunohistochemistry
Two slides from each TMA block, with sections on two
levels and ~40 sections between the two, were submitted to
immunohistochemical reactions. The immunohistochemical reactions
were performed using the technique of third-generation polymer
(NovoLink Polymer Detection System; Leica Biosystems Newcastle
Ltd., Newcastle upon Tyne, UK). Following deparaffinization of the
tissue sections, antigen retrieval was performed using a pressure
cooker in citrate buffer (pH 6.0), followed by blocking endogenous
peroxidase with 3% hydrogen peroxide solution. The sections were
incubated with the following primary antibodies: IgG2a, κ mouse
polyclonal MYC (1:50, 9E10.3, MS139, Neomarkers, Thermo Fisher
Scientific Inc., Fremont, CA, USA), IgG, rabbit polyclonal c-erbB-2
(1:2,000, A0485; DakoCytomation), IgG1 mouse monoclonal EGFR
(1:400, ERGFR.25 clone, NCL-EGFR-384; Novocastra, Newcastle, UK),
IgG1, κ mouse monoclonal Ki67 (1:200, MIB-1, M7240;
DakoCytomation), IgG, rabbit monoclonal ER (1:500, SP1 clone,
RM9101; NeoMarkers, Fremont, CA, USA),IgG1, kappa mouse monoclonal
PR (1:400, PgR636 clone, M3569; DakoCytomation), IgG rabbit
monoclonal p-mTOR (Ser2448) (1:50, 49F9 clone, 2976; Cell Signaling
Technology, Inc., Beverly, MA, USA), IgG2b, monoclonal p-AkT
(Ser473) (1:800, 587F11 clone, 4051; Cell Signaling Technology
Inc.) and IgG2b, κ monoclonal mouse p53 (1:100, DO7 clone, M7001;
DakoCytomation). Subsequently, the slides were incubated with Post
Primary Block, followed by incubation with NovoLink Polymer HRP
(RE7140-K; Leica Microsystems Newcastle Ltd., Newcastle upon Tyne,
UK). The reactions were visualized with diaminobenzidine (liquid
DAB + substrate kit, K3468; DakoCytomation) and counterstained with
Harris's hematoxylin (Merck KGaA, Darmstadt, Germany).
All the reactions were assessed and described
separately by two independent observers who were blinded to the
clinical data. Disparities between the two pathologists (AFLW and
FGLM) were resolved by consensus. Results from the epithelial and
stromal components were reported separately for primary carcinomas
and lymph node samples. MYC expression was independently assessed
in the nucleus and the cytoplasm and was considered to be positive
when >10% of the cells were stained. EGFR and HER2 were assessed
by the HercepTest™ (DakoCytomation) system considering membranous
staining (11). ER, PR and Ki67 were
separately assessed in the nucleus of neoplastic epithelial cells
and in the stromal cell populations in the primary tumors and lymph
node metastases, according to the Allred and Elledge (12) system. p53, p-Akt and p-mTOR, were
considered to be positive when the percentage of stained cells was
≥10%.
Statistical methods
The correlations between categorical antigen
expression and other clinicopathological parameters were assessed
with the Fisher's exact test or the Chi-square test, as
appropriate. The Spearman's rank correlation coefficient was
calculated to assess categorical antigen expression. All the
statistical tests were two-sided and significance was set at
P<0.05. The analyses were performed using SSPS v. 10.0 software
for Windows (SPSS, Inc., Chicago, IL, USA).
Results
Immunohistochemical analysis
results
Taking into consideration that MYC immunostaining
may be present within the nuclei or in the cytoplasm and the
localization of MYC may affect prognosis in primary breast cancer,
cytoplasmatic and nuclear MYC were scored independently, as
previously described (8).
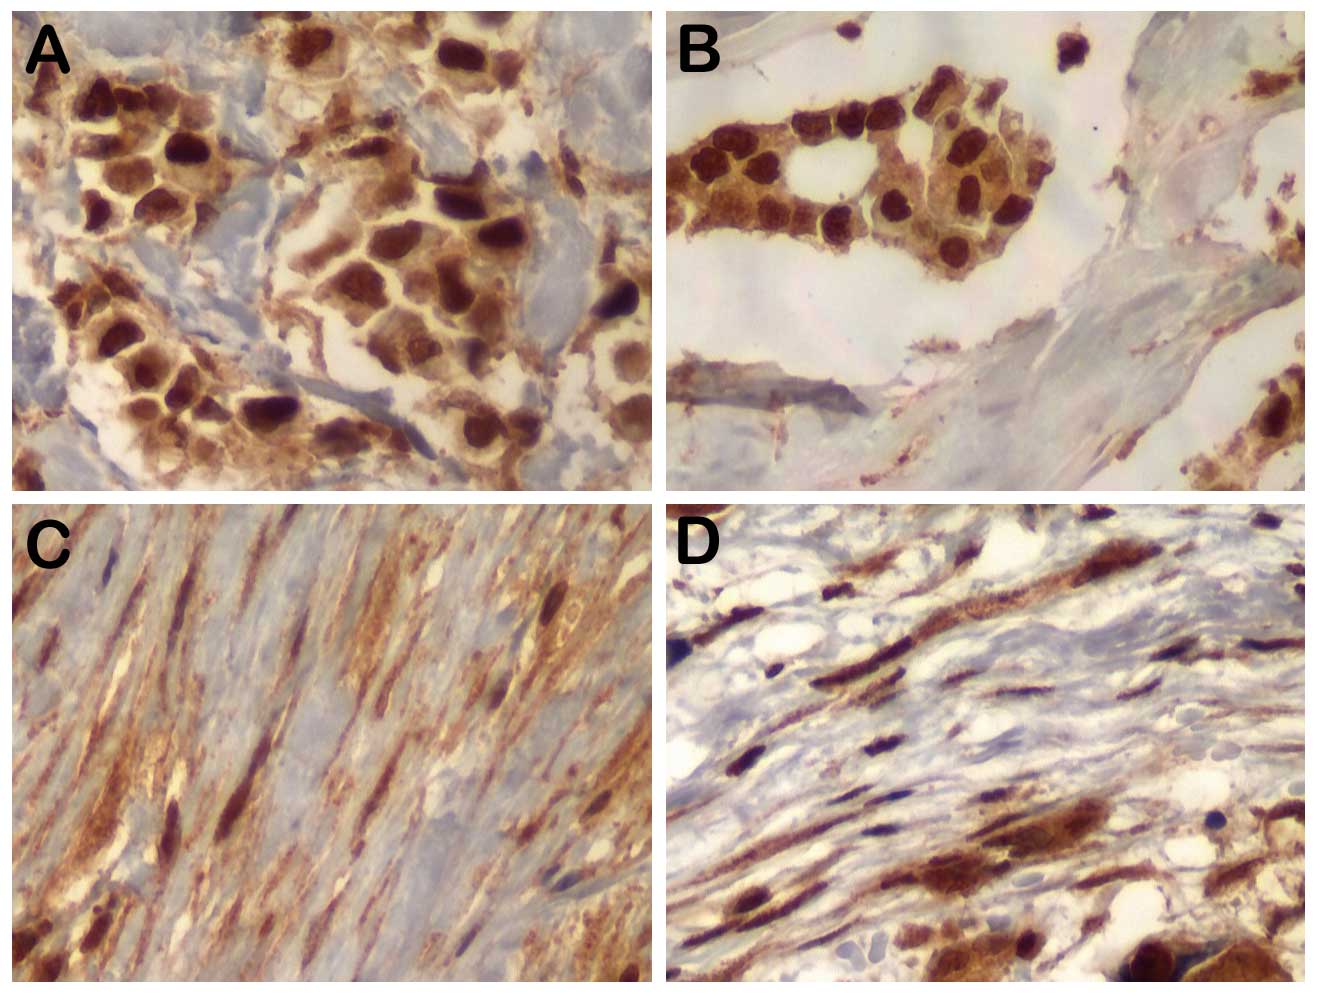
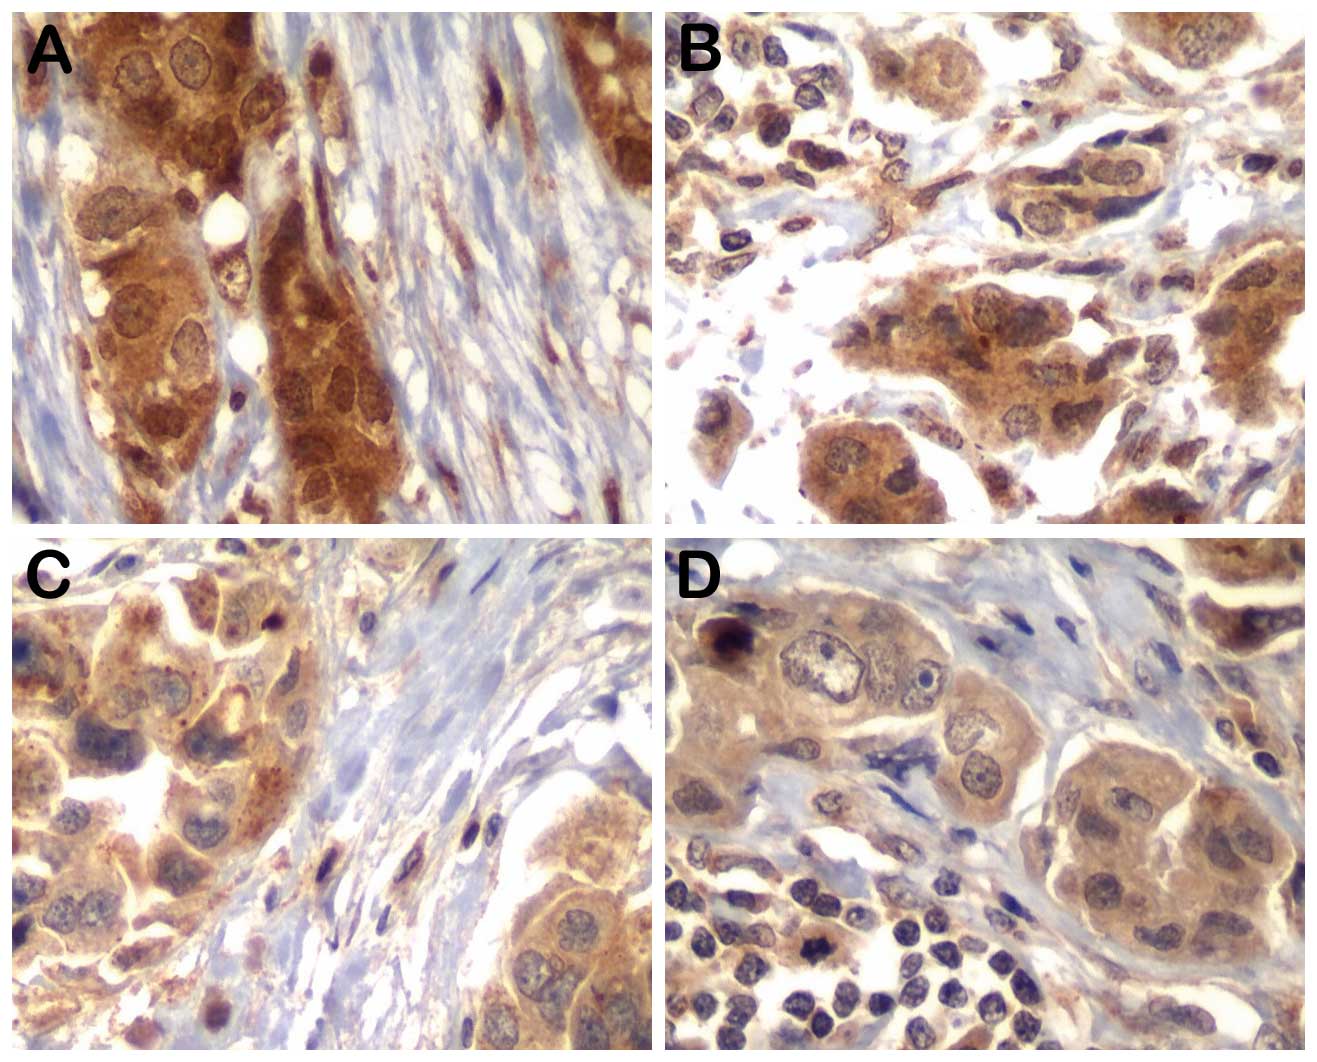
Representative results for MYC, p-AKT and p-mTOR for
tumor epithelial cells and associated fibroblasts in primary tumors
and nodal disease are shown in Figs.
1 and 2. The results regarding
MYC and other biological marker staining frequency as determined by
immunohistochemistry in both components of primary tumors are
summarized in Table II. After
excluding cases with missing data, MYC protein expression (nuclear
or cytoplasmic) was present in epithelial and stromal cells of the
primary tumors at similar frequencies. Other biological markers
were also determined in the epithelial and stromal component of the
primary tumors; 42.5% of the epithelial cells were found to be
ER-positive, 36.3% were PR-positive (13 of the 26 ER-positive cases
were PR-negative), 21.3% were HER2-positive and 31.2% were
p53-positive, while only 3.8% were EGFR-positive. The stromal cells
were uniformly negative for ER, PR, HER2, p53 and EGFR in the
primary tumors. The MIB-1 labeling rate of fibroblasts was always
<10% and, thus, they were considered as Ki67-negative. Similar
frequencies of p-mTOR and p-AKT positivity were displayed by the
epithelial and stromal component of the primary tumors.
| Table II.Frequencies of c-MYC and other
biomarkers in the primary tumor components (n=80). |
Table II.
Frequencies of c-MYC and other
biomarkers in the primary tumor components (n=80).
|
| Primary tumor, no.
(%) |
|---|
|
|
|
|---|
| Markers | Epithelium | Stroma |
|---|
| c-MYC (cyt) |
|
|
|
Negative | 2 (2.5) | 3 (3.8) |
|
Positive | 77 (96.3) | 77 (96.2) |
|
Missing | 1 (1.2) | 0 (0.0) |
| c-MYC (nuc) |
|
|
|
Negative | 10 (12.5) | 5 (6.3) |
|
Positive | 69 (86.3) | 75 (93.7) |
|
Missing | 1 (1.2) | 0 (0.0) |
| ER |
|
|
|
Negative | 44 (55.0) | 71 (88.8) |
|
Positive | 34 (42.5) | 0 (0.0) |
|
Missing | 2 (2.5) | 9 (11.2) |
| PR |
|
|
|
Negative | 41 (51.2) | 77 (96.2) |
|
Positive | 29 (36.3) | 0 (0.0) |
|
Missing | 10 (12.5) | 3 (3.8) |
| HER2 |
|
|
|
Negative | 61 (76.2) | 76 (95.0) |
|
Positive | 17 (21.3) | 0 (0.0) |
|
Missing | 2 (2.5) | 4 (5.0) |
| EGFR |
|
|
|
Negative | 75 (93.7) | 78 (97.5) |
|
Positive | 3 (3.8) | 0 (0.0) |
|
Missing | 2 (2.5) | 2 (2.5) |
| p53 |
|
|
|
Negative | 49 (61.3) | 75 (93.7) |
|
Positive | 25 (31.2) | 0 (0.0) |
|
Missing | 6 (7.5) | 5 (6.3) |
| Ki67 |
|
|
|
Negative | 57 (71.3) | 76 (95.0) |
|
Positive | 17 (21.3) | 0 (0.0) |
|
Missing | 6 (7.4) | 4 (5.0) |
| mTOR |
|
|
|
Negative | 41 (51.3) | 45 (56.2) |
|
Positive | 38 (47.5) | 35 (43.8) |
|
Missing | 1 (1.2) | 0 (0.0) |
| p-AKT |
|
|
|
Negative | 17 (21.3) | 24 (30.0) |
|
Positive | 63 (78.7) | 56 (70.0) |
|
Missing | 0 (0.0) | 0 (0.0) |
To determine whether the biological markers of
proliferation were relevant to breast cancer progression, we
compared the expression of these proteins in primary tumors and
paired metastatic lymph nodes (n=43). In Table III, the detection frequency of
biological markers in the primary tumors was compared to their
detection in the paired lymph node metastasis, independently
analyzing epithelia and stroma. The pattern of nuclear MYC
reflected a trend to lower frequency of positive expression in
lymph node epithelia compared to that in primary tumors (P=0.08).
The majority of the primary tumors retained their original status
regarding the standard markers in the epithelial component of the
nodal metastasis. The comparison between the stromal component of
the primary tumors and respective lymph nodes revealed a trend for
a lower frequency of cytoplasmic MYC (P=0.09) and p-mTOR (P=0.09)
expression in the lymph nodes, while the decrease in frequency of
nuclear MYC in the nodal stroma was statistically significant
(P=0.003).
| Table III.Correlation of the proportion of
positive expression of biological markers in the primary tumor and
corresponding lymph node metastases (n=43a). |
Table III.
Correlation of the proportion of
positive expression of biological markers in the primary tumor and
corresponding lymph node metastases (n=43a).
| Markers | Primary tumor
epithelium, no. (%) | Lymph node
metastasis epithelium, no. (%) | Primary tumor
stroma, no. (%) | Lymph node
metastasis stroma, no. (%) |
|---|
| c-MYC (cyt) |
|
|
Negative | 0 (0.0) | 0 (0.0) | 2 (4.7) | 8 (18.6) |
|
Positive | 43 (100.0) | 41 (100.0) | 41 (95.3) | 35 (81.4) |
|
P-value | NS | 0.09 |
| c-MYC (nuc) |
|
|
Negative | 4 (9.3) | 10 (24.4) | 2 (4.7) | 13 (30.2) |
|
Positive | 39 (90.7) | 31 (75.6) | 41 (95.3) | 30 (69.8) |
|
P-value | 0.08 | 0.003 |
| p-mTOR |
|
|
Negative | 21 (50.0) | 9 (47.4) | 24 (55.8) | 16 (80.0) |
|
Positive | 21 (50.0) | 10 (52.6) | 19 (44.2) | 4 (20.0) |
|
P-value | 1.00 | 0.09 |
| p-AKT |
|
|
Negative | 12 (27.9) | 2 (10.5) | 15 (34.9) | 6 (30.0) |
|
Positive | 31 (72.1) | 17 (89.5) | 28 (65.1) | 14 (70.0) |
|
P-value | 0.19 | 0.78 |
| ER |
|
|
Negative | 22 (53.7) | 19 (46.3) | 43 (100.0) | 43 (100.0) |
|
Positive | 19 (46.3) | 22 (53.7) | 0 (0.0) | 0 (0.0) |
|
P-value | 0.66 |
|
| PR |
|
|
Negative | 24 (64.9) | 27 (73.0) | 43 (100.0) | 43 (100.0) |
|
Positive | 13 (35.1) | 10 (27.0) | 0 (0.0) | 0 (0.0) |
|
P-value | 0.23 |
|
| HER2 |
|
|
Negative | 33 (78.6) | 32 (76.2) | 43 (100.0) | 43 (100.0) |
|
Positive | 9 (21.4) | 10 (23.8) | 0 (0.0) | 0 (0.0) |
|
P-value | 1.00 |
|
| p53 |
|
|
Negative | 30 (73.2) | 29 (69.0) | 43 (100.0) | 43 (100.0) |
|
Positive | 11 (26.8) | 13 (31.0) | 0 (0.0) | 0 (0.0) |
|
P-value | 0.81 |
|
| Ki67 |
|
|
Negative | 32 (78.0) | 28 (66.7) | 43 (100.0) | 43 (100.0) |
|
Positive | 9 (22.0) | 14 (33.3) | 0 (0.0) | 0 (0.0) |
|
P-value | 0.33 |
|
We next evaluated whether proliferation markers in
the epithelial tissue of primary tumors correlated with prognostic
factors and found that Ki67 was statistically associated with high
histological grade (P=0.02), number of mitoses (P=0.01) and
infiltrative margins (P=0.05), while p-AKT expression in the
epithelial cells was associated with advanced disease stage
(P=0.04, Table IV). Of note, the
p-AKT positivity rate in stromal fibroblasts was also associated
with advanced stage (data not shown, P=0.01).
| Table IV.Correlation between biomarker
expression in the epithelial component of the primary tumor and
prognostic factors. |
Table IV.
Correlation between biomarker
expression in the epithelial component of the primary tumor and
prognostic factors.
|
| c-MYC (cyt) | c-MYC (nuc) | Ki67 | p-mTOR | p-AKT |
|---|
|
|
|
|
|
|
|
|---|
|
Clinico-pathological data | Negative | Positive | Negative | Positive | Negative | Positive | Negative | Positive | Negative | Positive |
|---|
| HG |
|
| 1 | 1 (50.0) | 16 (20.8) | 3 (30.0) | 14 (20.3) | 15 (26.3) | 0 (0.0) | 7 (17.0) | 10 (26.3) | 2 (11.8) | 16 (25.4) |
|
2,3 | 1 (50.0) | 61 (79.2) | 7 (70.0) | 55 (79.7) | 42 (73.7) | 17 (100.0) | 34 (83.0) | 28 (73.7) | 15 (88.2) | 47 (74.6) |
|
P-value | 0.38 | 0.44 | 0.02 | 0.41 | 0.33 |
| LN status |
|
|
Negative | 2 (100.0) | 34 (44.2) | 6 (60.0) | 30 (43.5) | 25 (43.9) | 8 (47.1) | 20 (48.8) | 17 (44.7) | 5 (29.4) | 32 (50.8) |
|
Positive | 0 (0.0) | 43 (55.8) | 4 (40.0) | 39 (56.5) | 32 (56.1) | 9 (52.9) | 21 (51.2) | 21 (55.3) | 12 (70.6) | 31 (49.2) |
|
P-value | 0.20 | 0.50 | 1.0 | 0.82 | 0.17 |
| Stage |
|
| I | 1 (50.0) | 18 (23.3) | 4 (40.0) | 15 (21.7) | 14 (24.6) | 4 (23.6) | 14 (34.1) | 6 (15.8) | 1 (5.9) | 19 (30.2) |
| II | 1 (50.0) | 31 (40.3) | 2 (20.0) | 30 (43.5) | 21 (36.8) | 8 (47.0) | 17 (41.4) | 15 (39.5) | 11 (64.7) | 21 (33.3) |
|
III | 0 (0) | 28 (36.4) | 4 (40.0) | 24 (34.8) | 22 (38.6) | 5 (29.4) | 10 (24.4) | 17 (44.7) | 5 (29.4) | 23 (36.5) |
|
P-value | 0.51 | 0.29 | 0.72 | 0.08 | 0.04 |
| Mitoses |
|
|
0–5 | 1 (50.0) | 30 (39.0) | 3 (30.0) | 28 (40.6) | 27 (47.3) | 2 (11.8) | 14 (34.1) | 17 (43.6) | 3 (17.6) | 29 (46.0) |
|
>5 | 1 (50.0) | 47 (61.0) | 7 (70.0) | 41 (59.4) | 30 (52.7) | 15 (88.2) | 27 (65.9) | 21 (56.4) | 14 (82.4) | 34 (54.0) |
|
P-value | 1.00 | 0.73 | 0.01 | 0.37 | 0.05 |
| Necrosis |
|
|
Absent | 1 (50.0) | 35 (45.5) | 2 (20.0) | 34 (49.3) | 27 (47.4) | 8 (47.1) | 18 (43.9) | 19 (50.0) | 7 (41.2) | 30 (47.6) |
|
Present | 1 (50.0) | 42 (54.5) | 8 (80.0) | 35 (50.7) | 30 (52.6) | 9 (52.9) | 23 (56.1) | 19 (50.0) | 10 (58.8) | 33 (52.4) |
|
P-value | 1.00 | 0.10 | 1.00 | 0.66 | 0.79 |
| Margins |
|
|
Expansive | 0 (0.0) | 36 (46.8) | 4 (40.0) | 32 (46.4) | 23 (40.4) | 12 (70.6) | 17 (41.5) | 19 (50.0) | 6 (35.3) | 30 (47.6) |
|
Infiltrative | 2 (100.0) | 41 (53.2) | 6 (60.0) | 37 (53.6) | 34 (59.6) | 5 (29.4) | 24 (58.5) | 19 (50.0) | 11 (64.7) | 33 (52.4) |
|
P-value | 0.50 | 0.75 | 0.05 | 0.50 | 0.42 |
| ER |
|
|
Positive | 1 (100.0) | 42 (55.3) | 6 (75.0) | 37 (53.6) | 32 (56.1) | 9 (52.9) | 22 (55.0) | 22 (57.9) | 12 (70.6) | 32 (52.5) |
|
Negative | 0 (0.0) | 34 (44.7) | 2 (25.0) | 32 (46.4) | 25 (43.9) | 8 (47.1) | 18 (45.0) | 16 (42.1) | 5 (29.4) | 29 (47.5) |
|
P-value | 1.00 | 0.29 | 1.00 | 0.82 | 0.27 |
| PR |
|
|
Positive | 2 (100.0) | 39 (57.4) | 4 (66.7) | 37 (57.8) | 29 (55.8) | 11 (68.8) | 22 (64.7) | 19 (52.8) | 9 (64.3) | 32 (57.1) |
|
Negative | 0 (0.0) | 29 (42.6) | 2 (33.3) | 27 (42.2) | 23 (44.2) | 5 (31.2) | 12 (35.3) | 17 (47.2) | 5 (35.7) | 24 (42.9) |
|
P-value | 0.51 | 1.00 | 0.40 | 0.34 | 0.76 |
| HER2 |
|
|
Positive | 2 (100.0) | 58 (77.3) | 8 (100.0) | 52 (75.4) | 44 (78.6) | 13 (76.5) | 31 (77.5) | 30 (78.9) | 13 (76.5) | 48 (78.7) |
|
Negative | 0 (0.0) | 17 (22.7) | 0 (0.0) | 17 (24.6) | 12 (21.4) | 4 (23.5) | 9 (22.5) | 8 (21.1) | 4 (23.5) | 13 (21.3) |
|
P-value | 1.00 | 0.18 | 1.00 | 1.00 | 1.00 |
In order to investigate the association between
proliferation markers and molecular subtypes, a surrogate
immunohistochemistry-based classifier was used (13,14).
Molecular subtypes were defined as luminal A (ER+ or
PR+, HER2− and Ki67 <10%); luminal B
(ER+ or PR+, HER2+ and Ki67 ≥10%)
and triple-negative (ER−, PR− and
HER2−). A total of 29 tumors were classified as luminal
A, 13 (18.8%) as luminal B, 12 as HER2-enriched and 15 as
triple-negative. Luminal A tumors exhibited a trend for positivity
of MYC (nuclear), as compared to other subgroups (P=0.13). Ki67
expression frequency was statistically significantly associated
with the others groups (Table V).
| Table V.Distribution of protein expression
pattern in the tumor epithelium according to molecular groups of
invasive ductal carcinoma. |
Table V.
Distribution of protein expression
pattern in the tumor epithelium according to molecular groups of
invasive ductal carcinoma.
| Variables | Luminal A
(HER2−/ER+ or PR+) no. (%) | Luminal B
(HER2+/ER+ or PR+) no. (%) |
HER2+/ER− and
PR− no. (%) | Triple-negative no.
(%) | P-value |
|---|
| c-MYC (cyt) |
|
|
|
| 0.30 |
|
Positive | 29 (42.7) | 13 (19.1) | 12 (17.6) | 14 (20.6) |
|
Negative | 0 (0.0) | 0 (0.0) | 0 (0.0) | 1 (100.0) |
| c-MYC (nuc) |
|
|
|
| 0.13 |
|
Positive | 27 (42.1) | 13 (20.3) | 12 (18.8) | 12 (18.8) |
|
Negative | 2 (40.0) | 0 (0.0) | 0 (0.0) | 3 (60.0) |
| p53 |
|
|
|
| 0.53 |
|
Positive | 7 (31.8) | 4 (18.2) | 6 (27.3) | 5 (22.7) |
|
Negative | 20 (44.5) | 9 (20.0) | 6 (13.3) | 10 (22.2) |
| Ki67 |
|
|
|
| 0.001 |
|
Positive | 0 (0.0) | 10 (62.4) | 3 (18.8) | 3 (18.8) |
|
Negative | 28 (53.8) | 3 (5.8) | 9 (17.3) | 12 (23.1) |
| p-mTOR |
|
|
|
| 0.16 |
|
Positive | 14 (38.9) | 10 (27.8) | 4 (11.1) | 8 (22.2) |
|
Negative | 15 (45.5) | 3 (9.1) | 8 (24.2) | 7 (21.2) |
| p-AKT |
|
|
|
| 0.44 |
|
Positive | 25 (45.5) | 11 (20.0) | 8 (14.5) | 11 (20.0) |
|
Negative | 4 (28.6) | 2 (14.2) | 4 (28.6) | 4 (28.6) |
|
When analyzing the possible correlations among all
the proliferation markers (Table VI)
in the epithelial tissues of breast carcinoma, we verified that
nuclear MYC was associated with p53 (p=0.048), which in turn was
associated with Ki67 (P=0.045). ER was positively associated with
PR (P=0.006) and inversely associated with HER2 (P=0.002). PR was
also inversely associated with HER2 (P=0.036). There were no
significant correlations among the remaining markers.
| Table VI.Association between primary tumor
marker expression in the epithelial component of invasive ductal
breast carcinoma. |
Table VI.
Association between primary tumor
marker expression in the epithelial component of invasive ductal
breast carcinoma.
| Variables | c-MYC (nuc) | mTOR | p-AKT | p53 | ER | PR | HER2 | Ki67 |
|---|
| c-MYC (cyt) |
|
| R | 0.181 | 0.158 | 0.112 | 0.084 | 0.102 | 0.144 | 0.087 | 0.064 |
|
P-value | 0.110 | 0.167 | 0.327 | 0.479 | 0.377 | 0.234 | 0.452 | 0.588 |
| c-MYC (nuc) |
|
| R |
| 0.111 | −0.107 | 0.231 | 0.131 | 0.050 | 0.181 | 0.067 |
|
P-value |
| 0.333 | 0.349 | 0.048 | 0.255 | 0.679 | 0.115 | 0.572 |
| mTOR |
|
| R |
|
| 0.134 | −0.029 | −0.029 | 0.121 | −0.018 | 0.175 |
|
P-value |
|
| 0.238 | 0.809 | 0.800 | 0.318 | 0.879 | 0.135 |
| p-AKT |
|
| R |
|
|
| −0.041 | 0.151 | 0.058 | −0.022 | 0.053 |
|
P-value |
|
|
| 0.727 | 0.187 | 0.633 | 0.847 | 0.655 |
| p53 |
|
| R |
|
|
|
| −0.047 | −0.077 | 0.080 | 0.235 |
|
P-value |
|
|
|
| 0.692 | 0.536 | 0.499 | 0.045 |
| ER |
|
| R |
|
|
|
|
| 0.327 | −0.347 | 0.027 |
|
P-value |
|
|
|
|
| 0.006 | 0.002 | 0.819 |
| PR |
|
| R |
|
|
|
|
|
| −0.251 | −0.112 |
|
P-value |
|
|
|
|
|
| 0.036 | 0.364 |
| HER2 |
|
| R |
|
|
|
|
|
|
| 0.021 |
|
P-value |
|
|
|
|
|
|
| 0.857 |
Discussion
Metastatic spread to the lymph nodes is one of the
predominant routes of breast cancer spread and is often the first
indication of propensity for metastatic dissemination (15,16).
Progressive tumor growth requires active proliferation of migrating
tumor cells at the lymph nodes to develop into an established
metastatic tumor (17). Therefore,
the elucidation of the mechanism through which cancer cells
permanently colonize the lymph nodes is crucial for the development
of more effective treatment strategies.
Previous investigators suggested a mechanism of
dissemination of breast cancer cells from the primary tumor
dictated by molecular changes that occur early during the course of
tumorigenesis, which may be regulated by increased MYC expression,
which indirectly affects the metastatic propensity of cancer cells
through promoting proliferation and survival (3,18). Stromal
fibroblasts are designed to create an environment that promotes
tumor progression (19). Moreover,
there has been evidence that the proliferative activity and soluble
factors secreted by stromal fibroblasts are closely associated with
lymph node metastasis (20). In
addition, a clear increase of MYC expression at the RNA and protein
level was detected in human telomerase-immortalized fibroblasts
that gradually underwent neoplastic transformation (21). However, to the best of our knowledge,
an assessment of MYC expression in CAFs located either in the
primary tumor or in matched node metastasis in human breast cancer
has not yet been performed.
In this study, we detected a high frequency of MYC
expression (nuclear or cytoplasmic) in the epithelial and stromal
components of either the primary tumors (the majority of which were
high-grade) or the metastatic nodes harvested at initial surgery.
Our results are in line with those of previous studies
investigating MYC gene amplification or protein overexpression in
the epithelial component of breast cancer (6–9,22–24).
However, we were unable to identify any correlation between MYC
expression and axillary lymph node positivity in our series,
confirming the results of previous studies (5,6,25). Although MYC stimulates cell
proliferation, which is generally associated with more aggressive
cancer phenotypes, playing an important role in cancer progression
(3), in our analysis, MYC was not
found to be associated with either Ki67 or number of mitoses in the
epithelial cells of the primary tumors. MYC was also not found to
be associated with proliferation markers, such as p-AKT and p-mTOR.
As regards other markers, nuclear MYC was found to be associated
with p53 (P=0.048), which in turn was found to be associated with
Ki67 (P=0.045). The combination of non-functional p53 and increased
MYC expression may be responsible for the increased proliferation
of the epithelial cells of the primary tumors (26).
A number of laboratory studies have demonstrated an
estrogen-dependent expression of MYC in cell models of
ER+ breast cancer (8) and
prior reports have identified a significant overlap in estrogen-
and MYC-responsive genes, the majority of which are actively
involved in cell growth (27). In
accordance, published literature suggests that MYC protein
expression in carcinomas may be predictive of resistance to hormone
therapy (28). Todorović-Raković
et al (6) described an
association between MYC amplification and positive ER expression,
which our data of MYC expression did not confirm. However, our
study demonstrated that, despite MYC expression spanning accross
all the intrinsic subtypes of breast cancer determined in our
primary and metastatic samples, there was a tendency toward a
higher MYC positivity rate in the luminal subtype, as compared to
the other subtypes, although this tendency was not statistically
significant (P=0.13). This result contradicts those of other
studies demonstrating a clear association between MYC amplification
and ER-negative or basal breast cancers (9,29–31). It is possible that, in luminal A
tumors displaying low Ki67 scores, MYC expression reflects
biological characteristics of the tumor cell population other than
its proliferative state. Evidence has been provided supporting that
MYC may be required for the post-transcriptional accumulation of
hypoxia-inducible factor α protein in MCF7 (ER+) breast
cancer cells, leading to metabolic advantages regarding cancer cell
survival (32).
Our results have documented MYC expression, as well
as mTOR and p-AKT expression, not only in tumor epithelial cells,
but also in the fibroblasts associated with the primary breast
tumors and nodal metastases. Baudino et al (33) previously demonstrated in mouse models
that MYC is a key regulator of several cytokines involved in
lymphangiogenesis, such as vascular endothelial growth factor
(VEGF)-C and VEGF-D, suggesting that increased expression of MYC
may provide a selective advantage for the development of nodal
metastases. Fibroblasts expressing MYC may act locally at the
metastatic site to facilitate colonization via the establishment of
a lymphangiogenic microenvironment to support cancer survival.
Moreover, a number of glucose metabolism-related genes were found
to be directly regulated by MYC (34)
and fibroblasts were reported to exhibit increased expression of
glycolytic enzymes that may be utilized by adjacent cancer cells to
facilitate growth and angiogenesis (35).
Several studies have addressed the differences in
the expression of individual breast cancer markers, including ER,
PR, HER2, p53 and Ki67, as well as other markers, between primary
breast tumors and metastases derived from the same patient;
however, the discordant rates varied widely accross studies
(8,36,37). In
line with previous publications, we did not identify statistically
significant discordant expression for any of the classical
biomarkers analyzed (ER, PR, p53, Ki67 and HER2), or for the
proliferative markers p-mTOR and p-AKT.
However, in nodal metastases, we observed a trend
for reduced frequency of nuclear MYC expression in epithelial cells
as compared to those of the primary tumors (P=0.08). In the lymph
node stroma, of the 43 matched pairs, 25.5% had discordant
immunohistochemical results and this decrease was statistically
significant (P=0.003). There is currently no explanation regarding
the significance of this finding. We may hypothesize that the
reduced MYC expression frequency between primary tumors and nodal
metastases in both components may reflect an adaptation to a
different environment in the lymph node tissue.
In conclusion, MYC is frequently expressed in breast
cancer and its expression is maintained in lymph node metastasis.
Tumor stromal cells actively express MYC, either in the primary or
the metastatic tumor sites. Furthermore, epithelial and stromal
cells in nodal metastases exhibit similar but discretely distinct
MYC expression patterns.
In conclusion, MYC expression, although highly
prevalent, was not found to be correlated with breast cancer
proliferation markers, such as Ki67, p-mTOR, p-AKT, p53 and EGFR,
classical predictive markers, such as ER, PR and HER2, or molecular
subtypes, suggesting that MYC may be involved in other pathways.
Fibroblasts expressing MYC may act at the primary or metastatic
site by establishing a lymphangiogenic microenvironment to optimize
cancer cell survival. Our results, indicating subtle differences
among the biomarkers analyzed between primary tumors and matched
nodal metastases, suggest that the development of nodal metastasis
may be a gradual process.
Acknowledgements
This study was supported by FAPESP (grant no.
09/10088-7).
References
|
1
|
Albihn A, Johnsen JI and Henriksson MA:
MYC in oncogenesis and as a target for cancer therapies. Adv Cancer
Res. 107:163–224. 2010.PubMed/NCBI
|
|
2
|
Chen Y and Olopade OI: MYC in breast tumor
progression. Expert Rev Anticancer Ther. 8:1689–1698. 2008.
View Article : Google Scholar : PubMed/NCBI
|
|
3
|
Wolfer A and Ramaswamy S: MYC and
metastasis. Cancer Res. 71:2034–2037. 2011. View Article : Google Scholar : PubMed/NCBI
|
|
4
|
Wolfer A, Wittner BS, Irimia D, et al: MYC
regulation of a ‘poor-prognosis’ metastatic cancer cell state. Proc
Natl Acad Sci USA. 107:3698–3703. 2010. View Article : Google Scholar : PubMed/NCBI
|
|
5
|
Rodriguez-Pinilla SM, Jones RL, Lambros
MB, et al: MYC amplification in breast cancer: a chromogenic in
situ hybridisation study. J Clin Pathol. 60:1017–1023. 2007.
View Article : Google Scholar : PubMed/NCBI
|
|
6
|
Todorović-Raković N,
Nešković-Konstantinović Z and Nikolić-Vukosavljević D: C-myc as a
predictive marker for chemotherapy in metastatic breast cancer.
Clin Exp Med. 12:217–223. 2012. View Article : Google Scholar : PubMed/NCBI
|
|
7
|
Joensuu K, Hagström J, Leidenius M,
Haglund C, Andersson LC, Sariola H and Heikkilӓ P: Bmi-1, c-myc,
and Snail expression in primary breast cancers and their metastases
- elevated Bmi-1 expression in late breast cancer relapses.
Virchows Arch. 459:31–39. 2011. View Article : Google Scholar : PubMed/NCBI
|
|
8
|
Planas-Silva MD, Bruggeman RD, Grenko RT
and Smith JS: Overexpression of c-Myc and Bcl-2 during progression
and distant metastasis of hormone-treated breast cancer. Exp Mol
Pathol. 82:85–90. 2007. View Article : Google Scholar : PubMed/NCBI
|
|
9
|
Singhi AD, Cimino-Mathews A, Jenkins RB,
et al: MYC gene amplification is often acquired in lethal distant
breast cancer metastases of unamplified primary tumors. Mod Pathol.
25:378–387. 2012. View Article : Google Scholar : PubMed/NCBI
|
|
10
|
Kalluri R and Zeisberg M: Fibroblasts in
cancer. Nat Rev Cancer. 6:392–401. 2006. View Article : Google Scholar : PubMed/NCBI
|
|
11
|
Gouvêa AP, Milanezi F, Olson SJ, Leitao D,
Schmitt FC and Gobbi H: Selecting antibodies to detect HER2
overexpression by immunohistochemistry in invasive mammary
carcinomas. Appl Immunohistochem Mol Morphol. 14:103–108. 2006.
View Article : Google Scholar : PubMed/NCBI
|
|
12
|
Allred DC and Elledge RM: Caution
concerning micrometastatic breast carcinoma in sentinel lymph
nodes. Cancer. 86:905–907. 1999. View Article : Google Scholar : PubMed/NCBI
|
|
13
|
Nielsen TO, Hsu FD, Jensen K, et al:
Immunohistochemical and clinical characterization of the basal-like
subtype of invasive breast carcinoma. Clin Cancer Res.
10:5367–5374. 2004. View Article : Google Scholar : PubMed/NCBI
|
|
14
|
Carey LA, Perou CM, Livasy CA, et al:
Race, breast cancer subtypes, and survival in the Carolina Breast
Cancer Study. JAMA. 295:2492–2502. 2006. View Article : Google Scholar : PubMed/NCBI
|
|
15
|
Tobler NE and Detmar M: Tumor and lymph
node lymphangiogenesis - impact on cancer metastasis. J Leukoc
Biol. 80:691–696. 2006. View Article : Google Scholar : PubMed/NCBI
|
|
16
|
Cao Y: Opinion: emerging mechanisms of
tumour lymphangiogenesis and lymphatic metastasis. Nat Rev Cancer.
5:735–743. 2005. View
Article : Google Scholar : PubMed/NCBI
|
|
17
|
Chambers AF, Groom AC and MacDonald IC:
Dissemination and growth of cancer cells in metastatic sites. Nat
Rev Cancer. 2:563–572. 2002. View
Article : Google Scholar : PubMed/NCBI
|
|
18
|
Ellsworth RE, Ellsworth DL, Patney HL,
Deyarmin B, Hooke JA, Love B and Shriver CD: Genomic alterations
associated with early stages of breast tumor metastasis. Ann Surg
Oncol. 15:1989–1995. 2008. View Article : Google Scholar : PubMed/NCBI
|
|
19
|
O'Connell JT, Sugimoto H, Cooke VG, et al:
VEGF-A and tenascin-C produced by S100A4+ stromal cells are
important for metastatic colonization. Proc Natl Acad Sci USA.
108:16002–16007. 2011. View Article : Google Scholar : PubMed/NCBI
|
|
20
|
Hasebe T, Sasaki S, Imoto S and Ochiai A:
Proliferative activity of intratumoral fibroblasts is closely
correlated with lymph node and distant organ metastases of invasive
ductal carcinoma of the breast. Am J Pathol. 156:1701–1710. 2000.
View Article : Google Scholar : PubMed/NCBI
|
|
21
|
Ostano P, Bione S, Belgiovine C, et al:
Cross-analysis of gene and miRNA genome-wide expression profiles in
human fibroblasts at different stages of transformation. OMICS.
16:24–36. 2012. View Article : Google Scholar : PubMed/NCBI
|
|
22
|
Chrzan P, Skokowski J, Karmolinski A and
Pawelczyk T: Amplification of c-myc gene and overexpression of
c-Myc protein in breast cancer and adjacent non-neoplastic tissue.
Clin Biochem. 34:557–562. 2001. View Article : Google Scholar : PubMed/NCBI
|
|
23
|
Blancato J, Singh B, Liu A, Liao DJ and
Dickson RB: Correlation of amplification and overexpression of the
c-myc oncogene in high-grade breast cancer: FISH, in situ
hybridisation and immunohistochemical analyses. Br J Cancer.
90:1612–1619. 2004. View Article : Google Scholar : PubMed/NCBI
|
|
24
|
Naidu R, Wahab NA, Yadav M and Kutty MK:
Protein expression and molecular analysis of c-myc gene in primary
breast carcinomas using immunohistochemistry and differential
polymerase chain reaction. Int J Mol Med. 9:189–196.
2002.PubMed/NCBI
|
|
25
|
Spandidos DA, Yiagnisis M, Papadimitriou K
and Field JK: ras, c-myc and c-erbB-2 oncoproteins in human breast
cancer. Anticancer Res. 9:1385–1393. 1989.PubMed/NCBI
|
|
26
|
Zongaro S, de Stanchina E, Colombo T,
D'Incalci M, Giulotto E and Mondello C: Stepwise neoplastic
transformation of a telomerase immortalized fibroblast cell line.
Cancer Res. 65:11411–11418. 2005. View Article : Google Scholar : PubMed/NCBI
|
|
27
|
Musgrove EA, Sergio CM, Loi S, et al:
Identification of functional networks of estrogen- and
c-Myc-responsive genes and their relationship to response to
tamoxifen therapy in breast cancer. PLoS One. 3:e29872008.
View Article : Google Scholar : PubMed/NCBI
|
|
28
|
Miller TW, Balko JM, Ghazoui Z, et al: A
gene expression signature from human breast cancer cells with
acquired hormone independence identifies MYC as a mediator of
antiestrogen resistance. Clin Cancer Res. 17:2024–2034. 2011.
View Article : Google Scholar : PubMed/NCBI
|
|
29
|
Chandriani S, Frengen E, Cowling VH,
Pendergrass SA, Perou CM, Whitfield ML and Cole MD: A core MYC gene
expression signature is prominent in basal-like breast cancer but
only partially overlaps the core serum response. PLoS One.
4:e66932009. View Article : Google Scholar : PubMed/NCBI
|
|
30
|
Yasojima H, Shimomura A, Naoi Y, et al:
Association between c-myc amplification and pathological complete
response to neoadjuvant chemotherapy in breast cancer. Eur J
Cancer. 47:1779–1788. 2011. View Article : Google Scholar : PubMed/NCBI
|
|
31
|
Alles MC, Gardiner-Garden M, Nott DJ, et
al: Meta-analysis and gene set enrichment relative to ER status
reveal elevated activity of MYC and E2F in the ‘basal’ breast
cancer subgroup. PLoS One. 4:e47102009. View Article : Google Scholar : PubMed/NCBI
|
|
32
|
Doe MR, Ascano JM, Kaur M and Cole MD: Myc
posttranscriptionally induces HIF1 protein and target gene
expression in normal and cancer cells. Cancer Res. 72:949–957.
2012. View Article : Google Scholar : PubMed/NCBI
|
|
33
|
Baudino TA, McKay C, Pendeville-Samain H,
et al: c-Myc is essential for vasculogenesis and angiogenesis
during development and tumor progression. Genes Dev. 16:2530–2543.
2002. View Article : Google Scholar : PubMed/NCBI
|
|
34
|
Dang CV, Le A and Gao P: MYC-induced
cancer cell energy metabolism and therapeutic opportunities. Clin
Cancer Res. 15:6479–6483. 2009. View Article : Google Scholar : PubMed/NCBI
|
|
35
|
Pavlides S, Whitaker-Menezes D,
Castello-Cros R, et al: The reverse Warburg effect: aerobic
glycolysis in cancer associated fibroblasts and the tumor stroma.
Cell Cycle. 8:3984–4001. 2009. View Article : Google Scholar : PubMed/NCBI
|
|
36
|
Falck AK, Fernö M, Bendahl PO and Rydén L:
Does analysis of biomarkers in tumor cells in lymph node metastases
give additional prognostic information in primary breast cancer?
World J Surg. 34:1434–1441. 2010. View Article : Google Scholar : PubMed/NCBI
|
|
37
|
Aitken SJ, Thomas JS, Langdon SP, Harrison
DJ and Faratian D: Quantitative analysis of changes in ER, PR and
HER2 expression in primary breast cancer and paired nodal
metastases. Ann Oncol. 21:1254–1261. 2010. View Article : Google Scholar : PubMed/NCBI
|