Introduction
Neutrophil gelatinase-associated lipocalin (NGAL),
also termed lipocalin2, is a member of the lipocalin superfamily,
which includes >20 members (1).
NGAL is secreted extracellularly and forms a heterodimer with
matrix metalloproteinase-9 (MMP-9) through disulfide bonds
protecting against degradation (2). NGAL tightly binds to the bacterial
siderophore, possibly serving as a potent bacteriostatic agent by
sequestering iron as well as regulating innate immunity and
inflammation (3). Overexpression
of NGAL has also been observed in various types of human
cancer, including breast, colorectal, pancreatic, ovarian, gastric,
thyroid, ovarian, bladder and kidney cancer (4). Previous studies have shown that
NGAL is upregulated in esophageal squamous cell carcinoma
(ESCC) and is an independent prognostic factor; this upregulation
was significantly correlated with cell differentiation and tumor
invasion (5,6).
However, controversial results have been observed
regarding the functional role of NGAL in various types of cancer
cell. For example, NGAL was able to facilitate gastrointestinal
mucosal regeneration by promoting cell motility and invasion and to
reduce E-cadherin mediated cell-cell adhesion in colon cancer
(7). NGAL was demonstrated to be
highly expressed in human thyroid carcinomas, and NGAL knockdown
inhibited cancer cell growth in soft agar and the formation of
tumors in nude mice (8).
Conversely, in pancreatic cancer cells, NGAL reduced
adhesion/invasion partly through suppressing focal adhesion kinase
activation and inhibited angiogenesis partly by blocking vascular
endothelial growth factor production (9).
In the present study, to examine the biological role
of NGAL in ESCC, NGAL was overexpressed in the EC109 ESCC
cell line. An mRNA microarray was performed using the Agilent whole
genome oligo microarray to identify differentially expressed genes
(DEGs) in NGAL overexpressing cells compared with control
cells (10). Multiple
bioinformatics analyses were performed on these DEGs in order to
gain a comprehensive understanding of the role of NGAL
overexpression in ESCC.
Materials and methods
Differentially expressed genes
The raw data were analyzed using normalization and
log transformation (10).
Differentially expressed genes were identified using a two-fold
change threshold.
Gene ontology (GO) enrichment and
functional annotation
The Database for Annotation, Visualization and
Integrated Discovery bioinformatics tool (DAVID; http://david.abcc.ncifcrf.gov/) was applied for
GO enrichment, using category classes including Biological process,
Cellular component and Molecular function. GO is one of the most
useful methods for functional annotation and classification of
genes. In addition, DAVID bioinformatics provides a functional
annotation chart to identify over-represented biological terms from
a particular gene list (11). Thus
far, the functional annotation chart provides >40 category
enrichments, including GO terms, sequence features, disease
associations, protein functional domains, protein-protein
interactions, pathways, homology, gene functional summaries and
literature. The enriched terms from the functional annotation chart
with P<0.05 were visualized by the Enrichment Map plugin for the
Cytoscape network visualization software (12).
Kyoto Encyclopedia of Genes and Genomes
(KEGG) pathway and subpathway analysis
The bioconductor SubpathwayMiner package was applied
to the DEG-enriched KEGG pathways identified (12). In addition to traditional entire
pathway enrichment, SubpathwayMiner is able to detect subpathways,
local regions of entire pathways, which aids in gaining more
detailed information regarding the relevant genes in localized
areas of a specific pathway (13).
SubpathwayMiner extracts multiple subpathways from an entire KEGG
pathway by the k-clique method. The distance between any two nodes
(a node indicates a gene in the pathway) in a subpathway is not
larger than k; k was set as 4 in the present study.
Promoter sequence patterns and potential
transcription factor analysis
The 2,000-bp promoter sequences of the 20 genes
exhibiting the greatest down- and upregulation, respectively, were
retrieved from the UCSC genome database (http://genome.ucsc.edu/). The sequence patterns
over-represented or under-represented in these two promoter
sequence sets were analyzed by the POCO program (http://ekhidna.biocenter.helsinki.fi/poxo/poco/poco).
POCO identifies motifs that are over-represented in one dataset
compared with a background set, but under-represented in another
dataset compared with the same background set. For the parameters
in the present study, the background organism was set as
homo_sapiens_clean and the longest pattern length was set as 8.
Subsequently, significant sequence patterns were screened in the
JASPAR transcription factor database (http://jaspar.binf.ku.dk) to identify recognized
transcription factors (similarity index >0.70) (14).
Results
GO enrichment and functional
annotation
A total of >200 DEGs in the NGAL
overexpressing cells were obtained using a two-fold change as the
threshold, including 167 upregulated genes and 96 downregulated
genes (Table I). To determine the
functional classification of the various gene clusters, GO
annotation was conducted using DAVID, which constructs
statistically significant functional profiles from a set of genes.
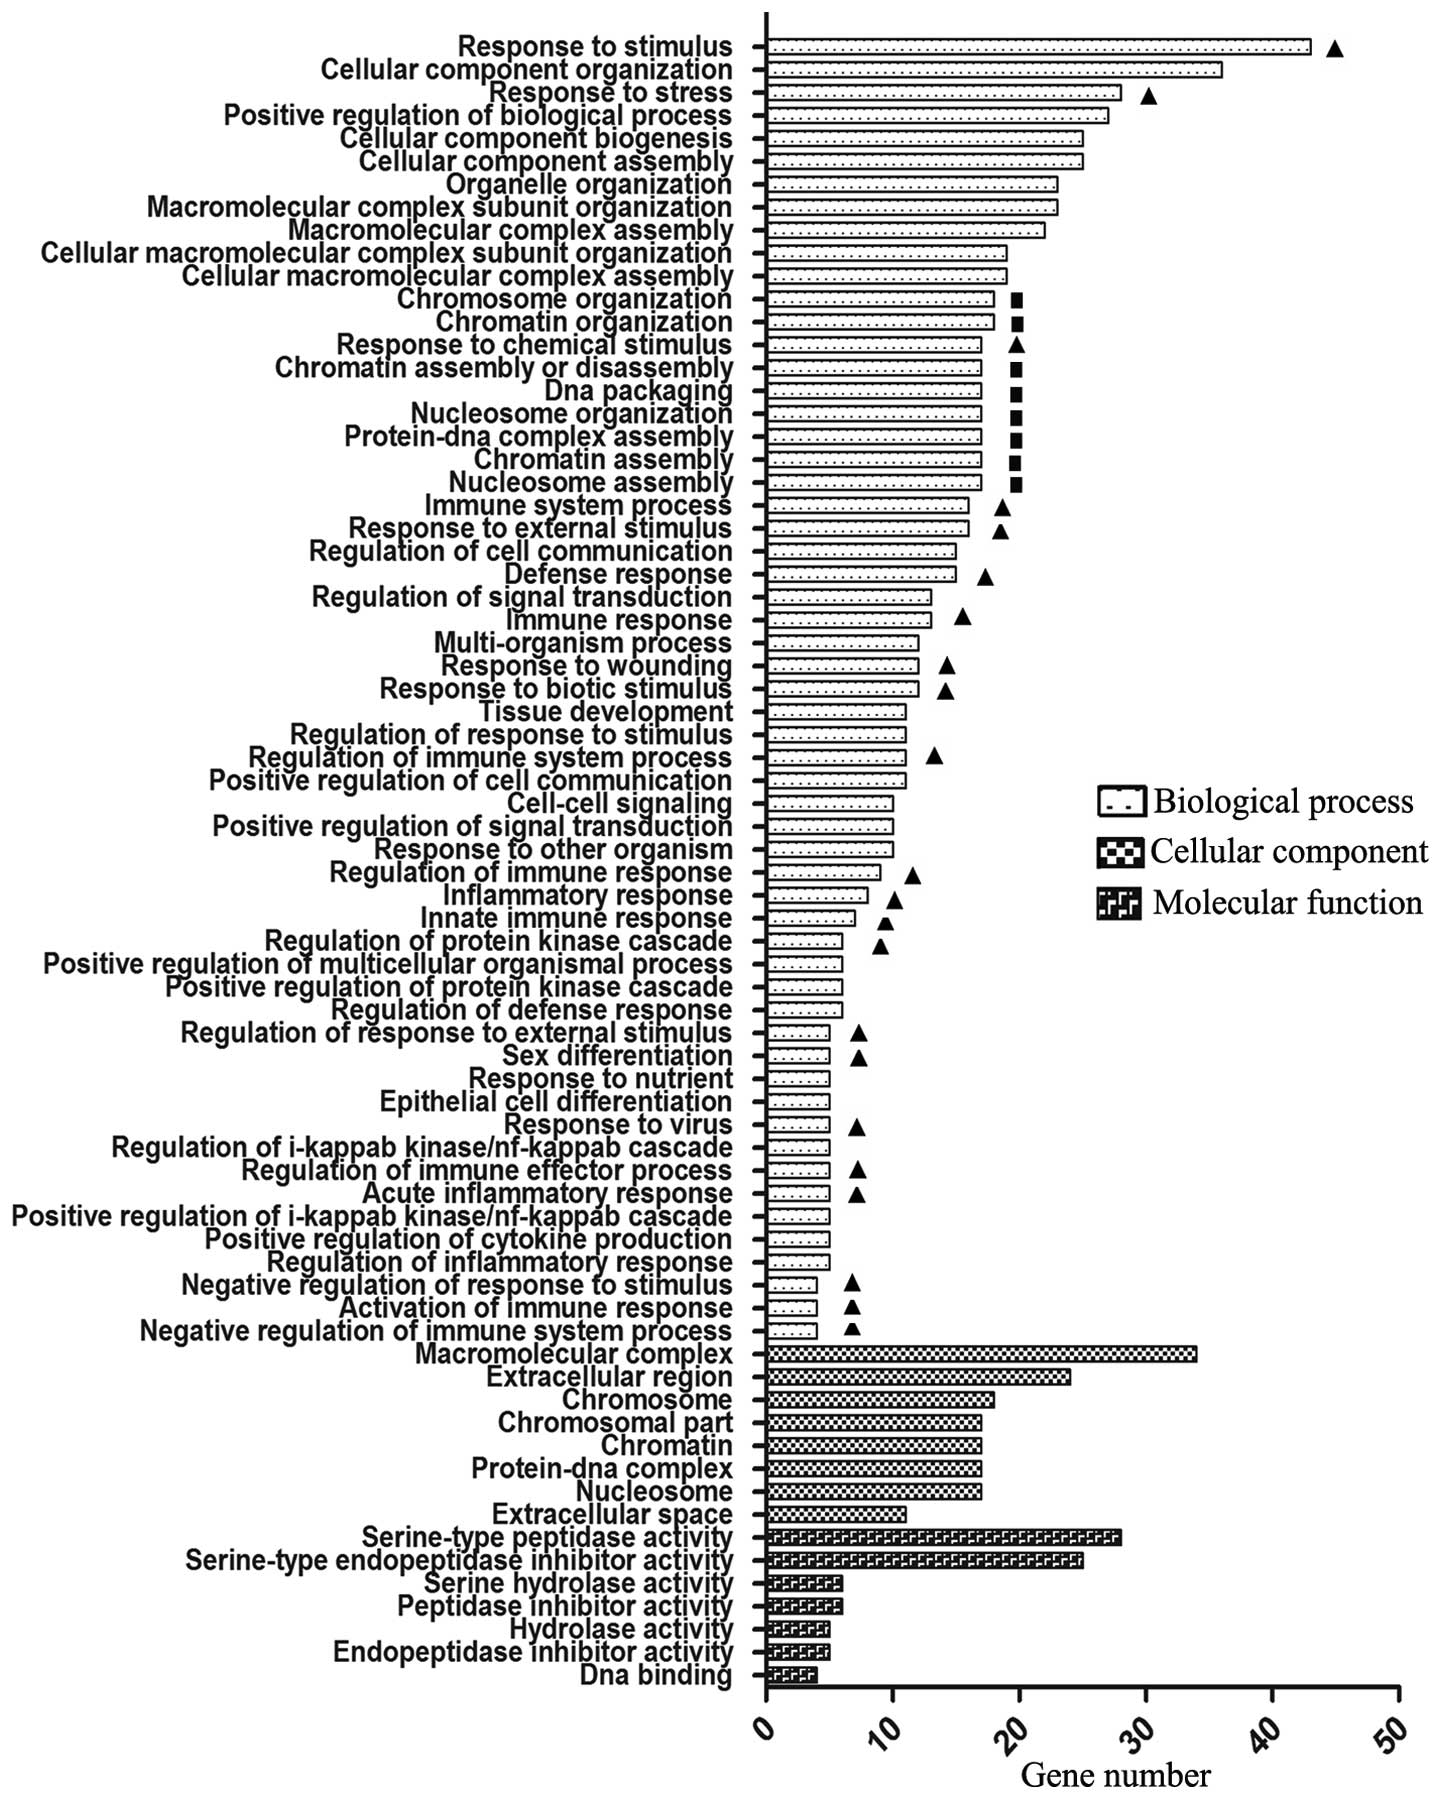
A total of 75, 8 and 7 significantly enriched GO terms were
identified for these DEGs in the Biological process, Cellular
component and Molecular function categories, respectively
(P<0.05; Fig. 1). Notably, two
predominant Biological process term groups were identified. One
group comprised 21 immune-associated terms, including response to
stress, defense response and regulation of immune response. The
other group consisted of 8 terms regarding chromatin structure and
gene transcription, including nucleosome assembly, chromatin
assembly and protein-DNA complex assembly. These 8 terms contained
the same 17 DEGs: HIST1H2AC, HIST2H2AA3,
HIST1H2BB, HIST1H2BC, HIST1H1E,
HIST1H2BD, HIST1H1C, HIST1H2BE,
HIST1H2AG, HIST1H2BF, HIST1H2BG,
HIST1H2AD, HIST1H2BH, HIST1H2BO,
HIST1H2BM, H2BFS, HIST1H2BK, HIST1H2BL,
HIST1H2BI, HIST2H2AC, HIST1H3D and
HIST3H2BB. The most significant function in the Molecular
function category was DNA-binding; in addition to 17
histone-associated genes, this contained ZMAT1,
IFIH1, LMO2, TFCP2L1, SOX2,
TP63, DACH1, FOXN4, TAF11 and
OASL. In the Cellular component category, a total of 23
genes associated with the extracellular region were identified:
SECTM1, RBP4, A2M, C3, CFB,
PLBD1, LGALS8, SPINK5, APOL3,
CGREF1, SLC1A3, ISG15, SAA1,
SERPINA5, AGT, C1RL, KLK10,
IGFL2, AGRN, SEPP1, AREG, CASP1
and DEFB1.
 | Table IDifferentially expressed genes in
neutrophil gelatinase-associated lipocalin overexpressing EC109
esophageal squamous cell carcinoma cells, compared with control
cells. |
Table I
Differentially expressed genes in
neutrophil gelatinase-associated lipocalin overexpressing EC109
esophageal squamous cell carcinoma cells, compared with control
cells.
| A, Upregulated
genes |
|---|
|
|---|
| Gene symbol | Fold change |
|---|
| LCN2 | 75.450 |
|
BC034319 | 12.960 |
| CGREF1 | 8.069 |
| SLC1A3 | 7.525 |
| CLGN | 5.594 |
| SECTM1 | 5.505 |
| POPDC3 | 5.469 |
| FNDC6 | 5.215 |
| FXYD3 | 5.102 |
| KLK10 | 4.260 |
| CHST2 | 4.142 |
| UBD | 4.122 |
| LGALS8 | 4.084 |
| DEFB1 | 3.971 |
| PLEKHA4 | 3.910 |
| CSAG1 | 3.817 |
| LGALS8 | 3.719 |
| SPINK5 | 3.665 |
| C1orf38 | 3.520 |
| RPSAP10 | 3.464 |
| PCDHB5 | 3.436 |
| DUSP26 | 3.416 |
| DDX58 | 3.376 |
| LMO2 | 3.368 |
| CFB | 3.352 |
| FOXN4 | 3.336 |
| BTN3A3 | 3.279 |
|
BF514799 | 3.245 |
| AGRN | 3.240 |
|
KIAA0657 | 3.177 |
| GLRX | 3.074 |
| NAALAD2 | 3.067 |
|
LOC389772 | 3.046 |
| DACH1 | 3.044 |
| TP73L | 3.026 |
| TCEAL2 | 3.016 |
| PADI1 | 2.991 |
| DYSF | 2.987 |
| METTL7A | 2.977 |
|
SERPINA5 | 2.956 |
| POF1B | 2.934 |
| SAMD9L | 2.913 |
|
MGC16075 | 2.908 |
|
RASGEF1A | 2.904 |
| RBP4 | 2.895 |
| IPO13 | 2.894 |
| TTTY22 | 2.888 |
|
HIST1H1C | 2.781 |
|
C15orf59 | 2.777 |
| HERC6 | 2.774 |
| PLK2 | 2.761 |
| CSAG3A | 2.752 |
| IFI27 | 2.734 |
| DOCK11 | 2.729 |
| BLOC1S1 | 2.723 |
| SLC22A4 | 2.704 |
| IFIH1 | 2.696 |
| C3 | 2.647 |
| ABCA1 | 2.627 |
| OASL | 2.608 |
| ZMAT1 | 2.607 |
| UNC5B | 2.572 |
| FBP1 | 2.560 |
|
HIST1H2BK | 2.560 |
|
CAMSAP1L1 | 2.559 |
| PFTK1 | 2.553 |
|
HIST1H1E | 2.550 |
| IFIT2 | 2.544 |
| KYNU | 2.530 |
| RADIL | 2.495 |
| KYNU | 2.492 |
| IFIT1 | 2.490 |
| PPAPDC3 | 2.484 |
|
HIST1H2BC | 2.480 |
| ABCA1 | 2.480 |
| CA8 | 2.468 |
| AREG | 2.467 |
| ADD3 | 2.455 |
|
AF264621 | 2.451 |
| TDRD9 | 2.445 |
|
LOC375010 | 2.433 |
|
BX115350 | 2.433 |
| GRAMD1C | 2.430 |
| SEPP1 | 2.427 |
| ALPPL2 | 2.416 |
| SMIM1 | 2.408 |
|
LOC391566 | 2.406 |
| SAA1 | 2.390 |
| AKR1C3 | 2.379 |
|
HIST2H2AA | 2.370 |
| IFI44 | 2.366 |
| REEP6 | 2.361 |
| PREX1 | 2.357 |
| S100A3 | 2.355 |
| SOX2 | 2.348 |
| C9orf9 | 2.341 |
| H2BFS | 2.340 |
| RIMS4 | 2.330 |
|
HIST1H2BH | 2.316 |
|
HIST1H2BF | 2.310 |
| PSMB9 | 2.307 |
|
LOC375010 | 2.290 |
|
HIST1H2BE | 2.286 |
|
FLJ20035 | 2.285 |
| CSTA | 2.283 |
|
HIST1H2BB | 2.281 |
| DIO3OS | 2.270 |
|
HIST1H2BM | 2.268 |
| NID67 | 2.260 |
| FAM31C | 2.257 |
| HKDC1 | 2.253 |
| ZMAT1 | 2.246 |
|
HIST1H2BL | 2.237 |
| PLSCR4 | 2.233 |
|
HIST1H2BD | 2.223 |
|
HIST1H2BI | 2.217 |
| RAD9B | 2.215 |
| C9orf9 | 2.211 |
| BTN3A1 | 2.211 |
|
HIST1H3D | 2.210 |
| HERC5 | 2.205 |
| TSGA2 | 2.204 |
|
BC021677 | 2.204 |
|
HIST1H2BG | 2.203 |
| GPNMB | 2.200 |
| PLBD1 | 2.187 |
| PAG1 | 2.177 |
| G1P2 | 2.175 |
| TPO | 2.172 |
|
HIST1H2BN | 2.163 |
| A2M | 2.161 |
| CACNA1D | 2.156 |
| AGT | 2.148 |
| NANOS1 | 2.147 |
| SLC5A10 | 2.138 |
| CASP1 | 2.138 |
| FAM26F | 2.126 |
| PSD3 | 2.116 |
| KARCA1 | 2.112 |
|
CR596233 | 2.099 |
|
HIST1H2BO | 2.094 |
| PLEKHA4 | 2.094 |
| APOL3 | 2.084 |
|
BC043357 | 2.076 |
| CXorf48 | 2.076 |
|
HIST2H2AC | 2.076 |
|
AF074986 | 2.074 |
|
HIST1H2AD | 2.074 |
|
MGC16075 | 2.068 |
| IGFL2 | 2.064 |
| C1RL | 2.060 |
| TAF11 | 2.048 |
| PHEX | 2.048 |
|
MGC45474 | 2.047 |
| ABCG2 | 2.046 |
| ADPRHL1 | 2.043 |
|
HIST1H2AG | 2.043 |
| OSTbeta | 2.042 |
| POPDC2 | 2.042 |
| RHBDL4 | 2.040 |
| GPR126 | 2.037 |
| TFCP2L1 | 2.036 |
| PJA1 | 2.035 |
| BBS5 | 2.035 |
| HRASLS | 2.035 |
|
C18orf56 | 2.028 |
| PLCG2 | 2.017 |
| MIB2 | 2.014 |
| KRAS | 2.004 |
|
| B, Downregulated
genes |
|
| Gene symbol | Fold change |
|
| CHST6 | 0.0931 |
| ZNF521 | 0.110 |
| IFI16 | 0.155 |
| IFI16 | 0.173 |
| DIAPH2 | 0.173 |
| SEMA5A | 0.204 |
| CENTA2 | 0.205 |
| CENTA2 | 0.212 |
| CPM | 0.216 |
| KAL1 | 0.228 |
| DCN | 0.237 |
| CXXC4 | 0.250 |
| FOXQ1 | 0.252 |
| FOS | 0.268 |
| COL4A3 | 0.287 |
| TMEPAI | 0.294 |
| GUCY1A2 | 0.300 |
| CLU | 0.312 |
| LEPREL2 | 0.316 |
| LYPDC1 | 0.323 |
| RASGRP3 | 0.323 |
| TMEM46 | 0.342 |
| OLFML2A | 0.344 |
| RGS5 | 0.359 |
| PLAT | 0.360 |
| MASK | 0.363 |
| TMEPAI | 0.367 |
| SCARA3 | 0.368 |
| DISC1 | 0.369 |
| SPFH2 | 0.370 |
| FOXP1 | 0.370 |
| FOXP1 | 0.381 |
| FSTL4 | 0.383 |
| NPTX1 | 0.383 |
| CDK6 | 0.387 |
| FAM211B | 0.391 |
| GPR56 | 0.394 |
| OR51B4 | 0.400 |
|
SERPINE2 | 0.400 |
| ATP9B | 0.400 |
| FZD10 | 0.402 |
| NPTX1 | 0.404 |
|
CR597240 | 0.410 |
| NFKBIZ | 0.410 |
| CRLF1 | 0.426 |
| GPR56 | 0.426 |
| ALPL | 0.428 |
| SQLE | 0.429 |
| NALP1 | 0.432 |
| TGFBR1 | 0.434 |
| MGC4294 | 0.434 |
| COL4A4 | 0.435 |
| KLK1 | 0.435 |
| FAM101B | 0.437 |
| SLC7A13 | 0.439 |
| PGCP | 0.441 |
|
LOC155060 | 0.451 |
| MCTP2 | 0.452 |
| SGK | 0.452 |
| FN1 | 0.455 |
| EGR1 | 0.455 |
| ANKH | 0.456 |
| SDC2 | 0.457 |
| RDH10 | 0.458 |
| XYLT1 | 0.458 |
| TGFBI | 0.458 |
| FRY | 0.459 |
| BAPX1 | 0.460 |
| TGFB1 | 0.460 |
| HBG1 | 0.462 |
| EDIL3 | 0.462 |
| SLC38A5 | 0.464 |
| TRPM4 | 0.468 |
| PMP22 | 0.468 |
|
FLJ21986 | 0.470 |
| NR4A1 | 0.470 |
| CPM | 0.471 |
| ADAMTS5 | 0.475 |
| HBG1 | 0.476 |
| XAGE2 | 0.478 |
| TSHZ2 | 0.479 |
| INSIG1 | 0.479 |
| RGS22 | 0.484 |
| KCNQ1 | 0.485 |
| HMGCS1 | 0.490 |
| MYO1A | 0.490 |
| HMGCS1 | 0.490 |
|
LOC284542 | 0.494 |
| PTPRB | 0.496 |
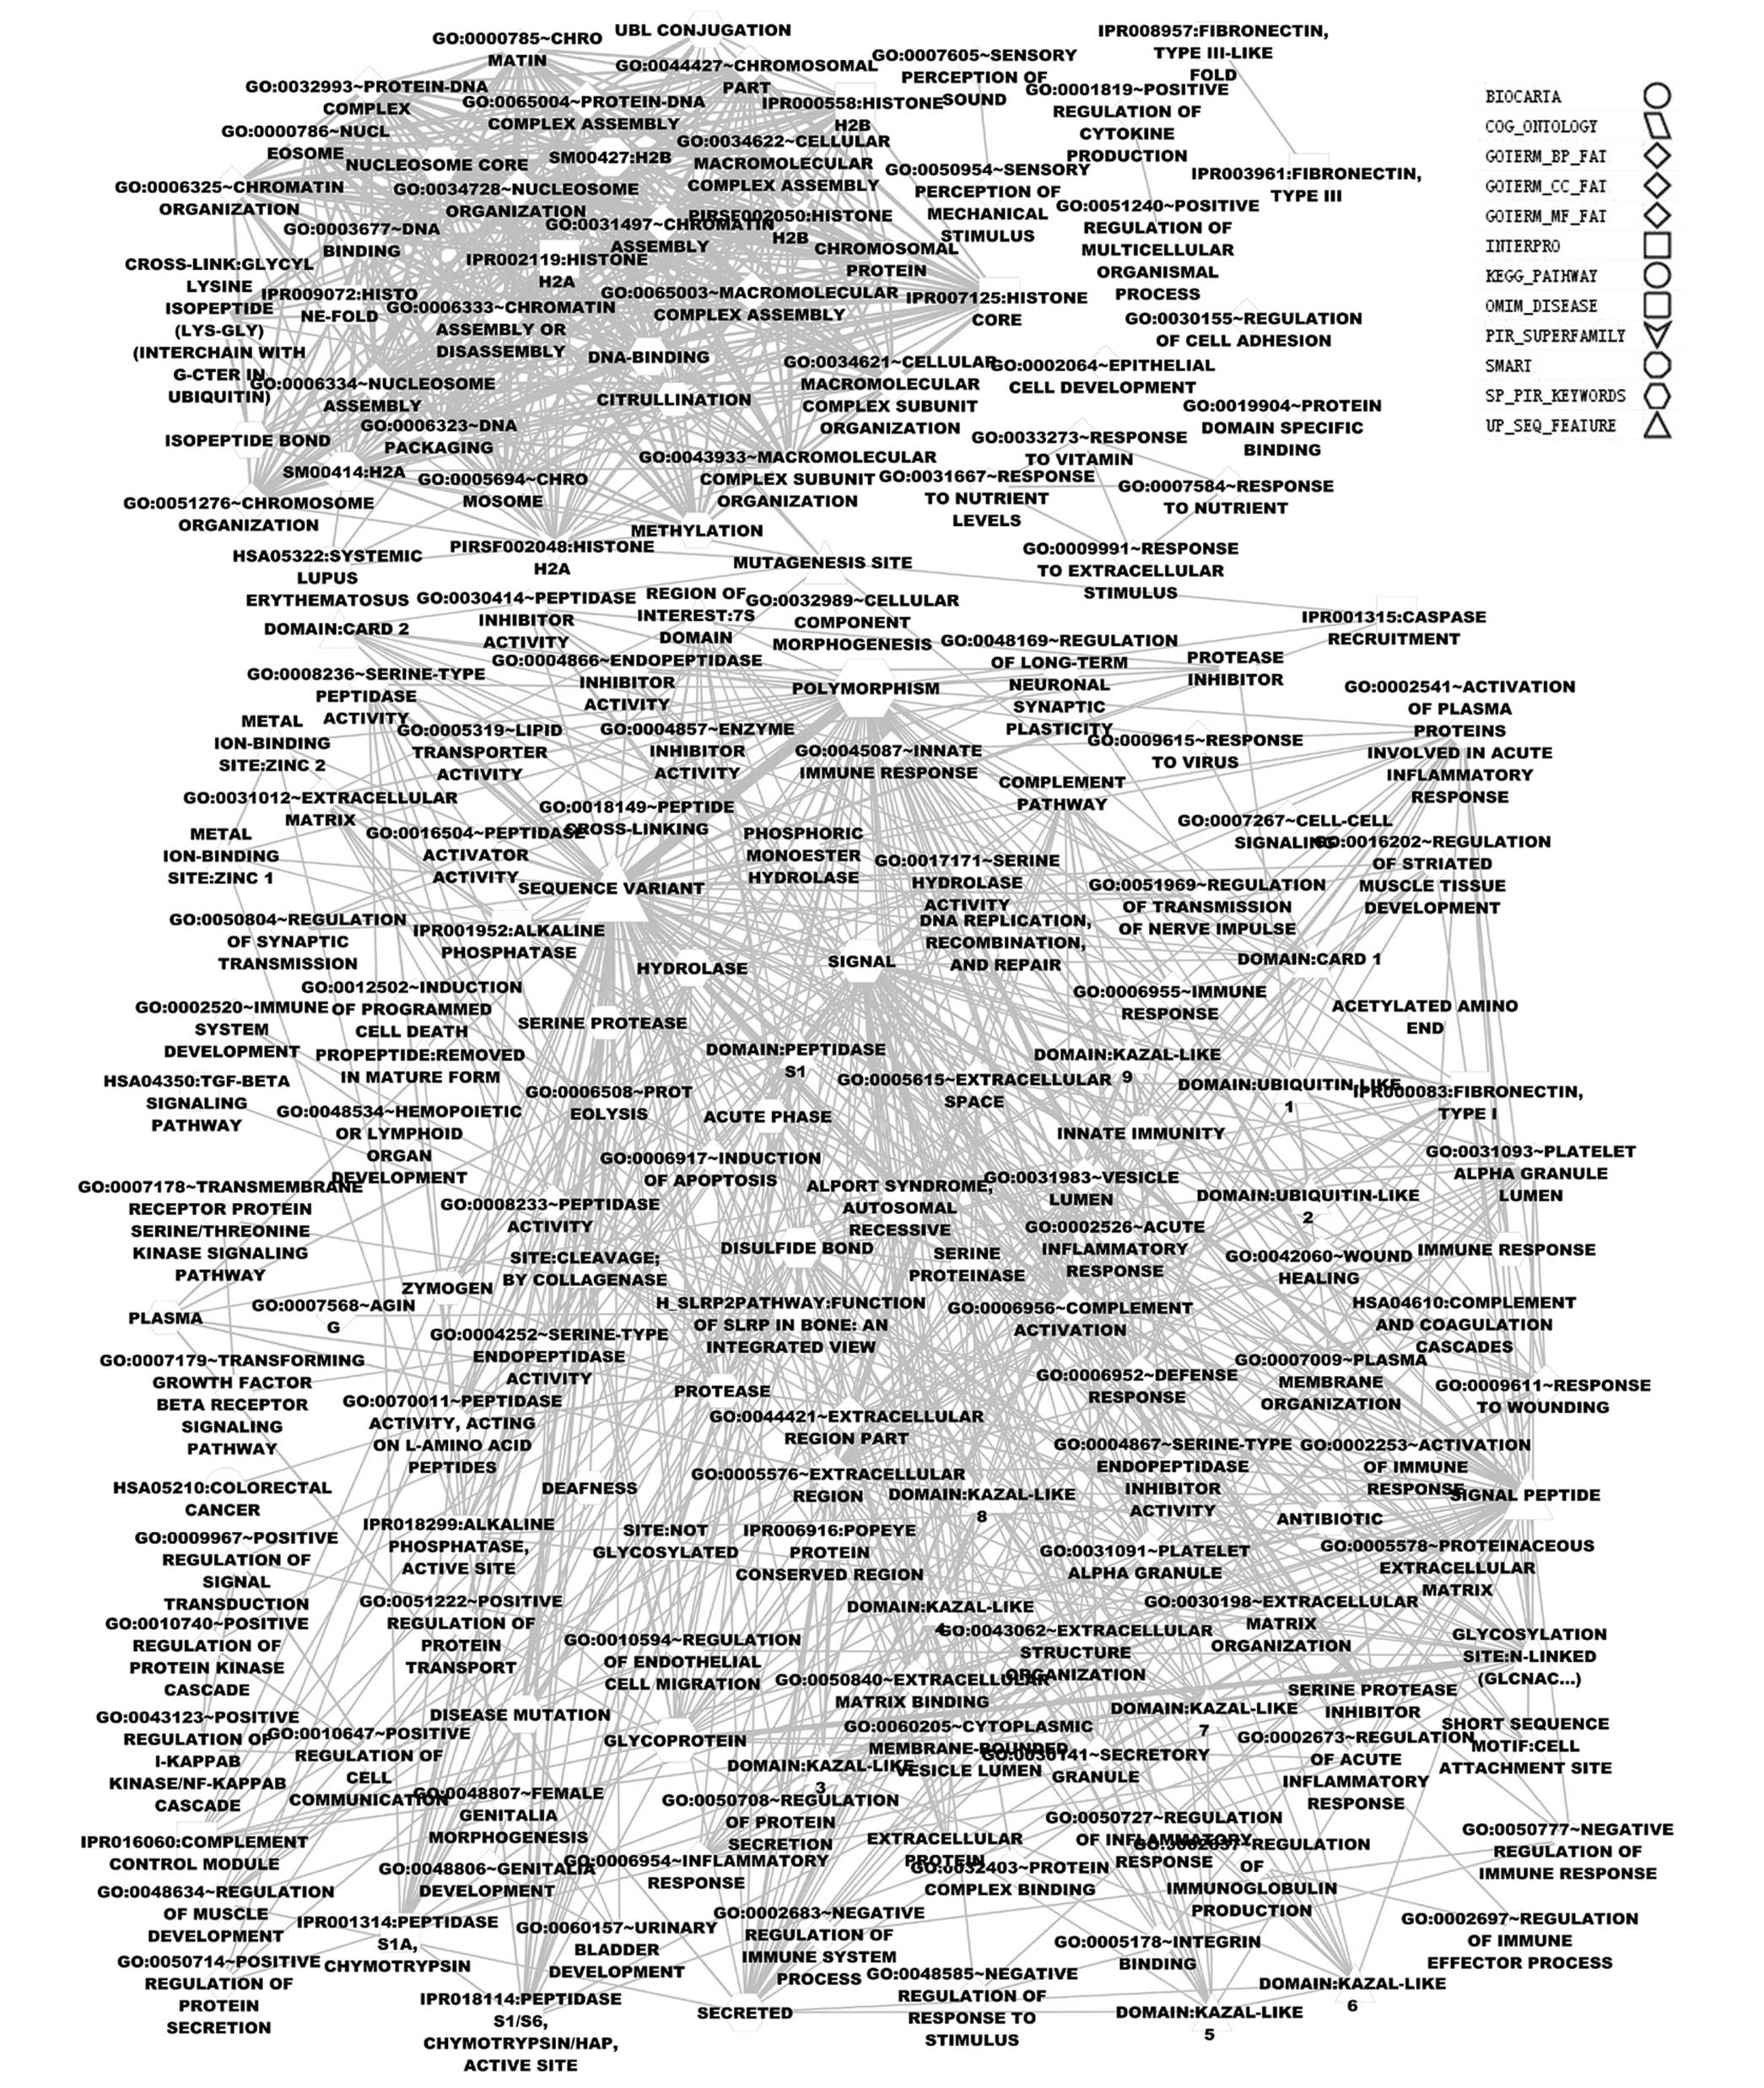
The DEGs were also clustered using the Functional
annotation chart in DAVID and the enrichment was visualized by the
Enrichment Map plugin for the Cytoscape software. In Fig. 2, a node signifies one functional
category and node size corresponds to the number of enriched genes.
The color depth corresponds to the significance (P-value) of the
terms. Nodes from the same functional category are presented as the
same shape. Edges between nodes were depicted when overlapping
genes existed between these two nodes. The widths of the lines
indicate the number of overlapping genes between the functional
groups, which are bigger and the wider with greater numbers. In the
180 total Functional annotation chart enrichments identified, in
addition to 101 terms from the three GO categories, 78 terms from
the following annotation categories were included: 14 from
INTERPRO, 2 from SMART, 30 from SP_PIR_KEYWORDS, 24 from
UP_SEQ_FEATURE, 1 from COG_ONTOLOGY, 2 from PIR_SUPERFAMILY, 1 from
OMIM_DISEASE and 4 from KEGG_PATHWAY. These results provided a
wider overview of the biological impact of NGAL
overexpression in ESCC than traditional GO enrichment. Five DEGs
were identified in the Homo sapiens (hsa)04350:TGF-beta
signaling pathway term, including SMAD9, ACVRL1,
TGFBR1, DCN and TGFB1. The autosomal recessive
Alport syndrome is a genetic condition characterized by kidney
disease, hearing loss and eye abnormalities. The majority of
affected individuals experience progressive loss of kidney
function, usually resulting in end-stage kidney disease. This
disease was detected in the OMIM_DISEASE category containing two
risk genes, COL4A4 and COL4A3 (15). In the SP_PIR_KEYWORDS category, 67
genes were enriched when using the Signal term. In addition, 35
genes were observed to be enriched using the Secreted term in
SP_PIR_KEYWORDS. Four genes (C3, SAA1, CFB and
FN1) were enriched in the acute phase term in
SP_PIR_KEYWORDS. The ubl conjugation term in SP_PIR_KEYWORDS
contained 27 genes; in addition to 15 histone-associated genes,
this also included another 12 genes: TSHZ2, SOX2,
TP63, FOS, H2BFS, INSIG1,
COL4A3, SGK1, DDX58, PJA1, MIB2
and ADD3. The only enrichment term in COG_ONTOLOGY was DNA
replication, recombination and repair, which contained four genes
(DDX58, IFIT1, IFIH1 and DDX60).
Pathway and subpathway enrichment
The DEGs were mapped to KEGG pathways to identify
the cell signaling pathways influenced by the downstream effectors
of NGAL. The DEGs were enriched in only four pathways
(Table II).
| Table IIEnriched Kyoto Encyclopedia of Genes
and Genomes DEG pathways. |
Table II
Enriched Kyoto Encyclopedia of Genes
and Genomes DEG pathways.
| Pathway ID | Pathway | annMolecule
Ratioa | P-value |
|---|
| 05322 | Systemic lupus
erythematosus | 20/268 | 0.0000 |
| 04610 | Complement and
coagulation cascades | 5/268 | 0.0016 |
| 05210 | Colorectal
cancer | 4/268 | 0.0075 |
| 00790 | Folate
biosynthesis | 2/268 | 0.0077 |
The local area of an entire pathway was able to be
defined by multiple subpathways using the node distance k, which
aids in understanding how the indicated genes affect the pathway
locally. The DEGs were found to be significantly enriched in 60
subpathways corresponding to 27 entire pathways using the
SubpathwayMiner package (Table
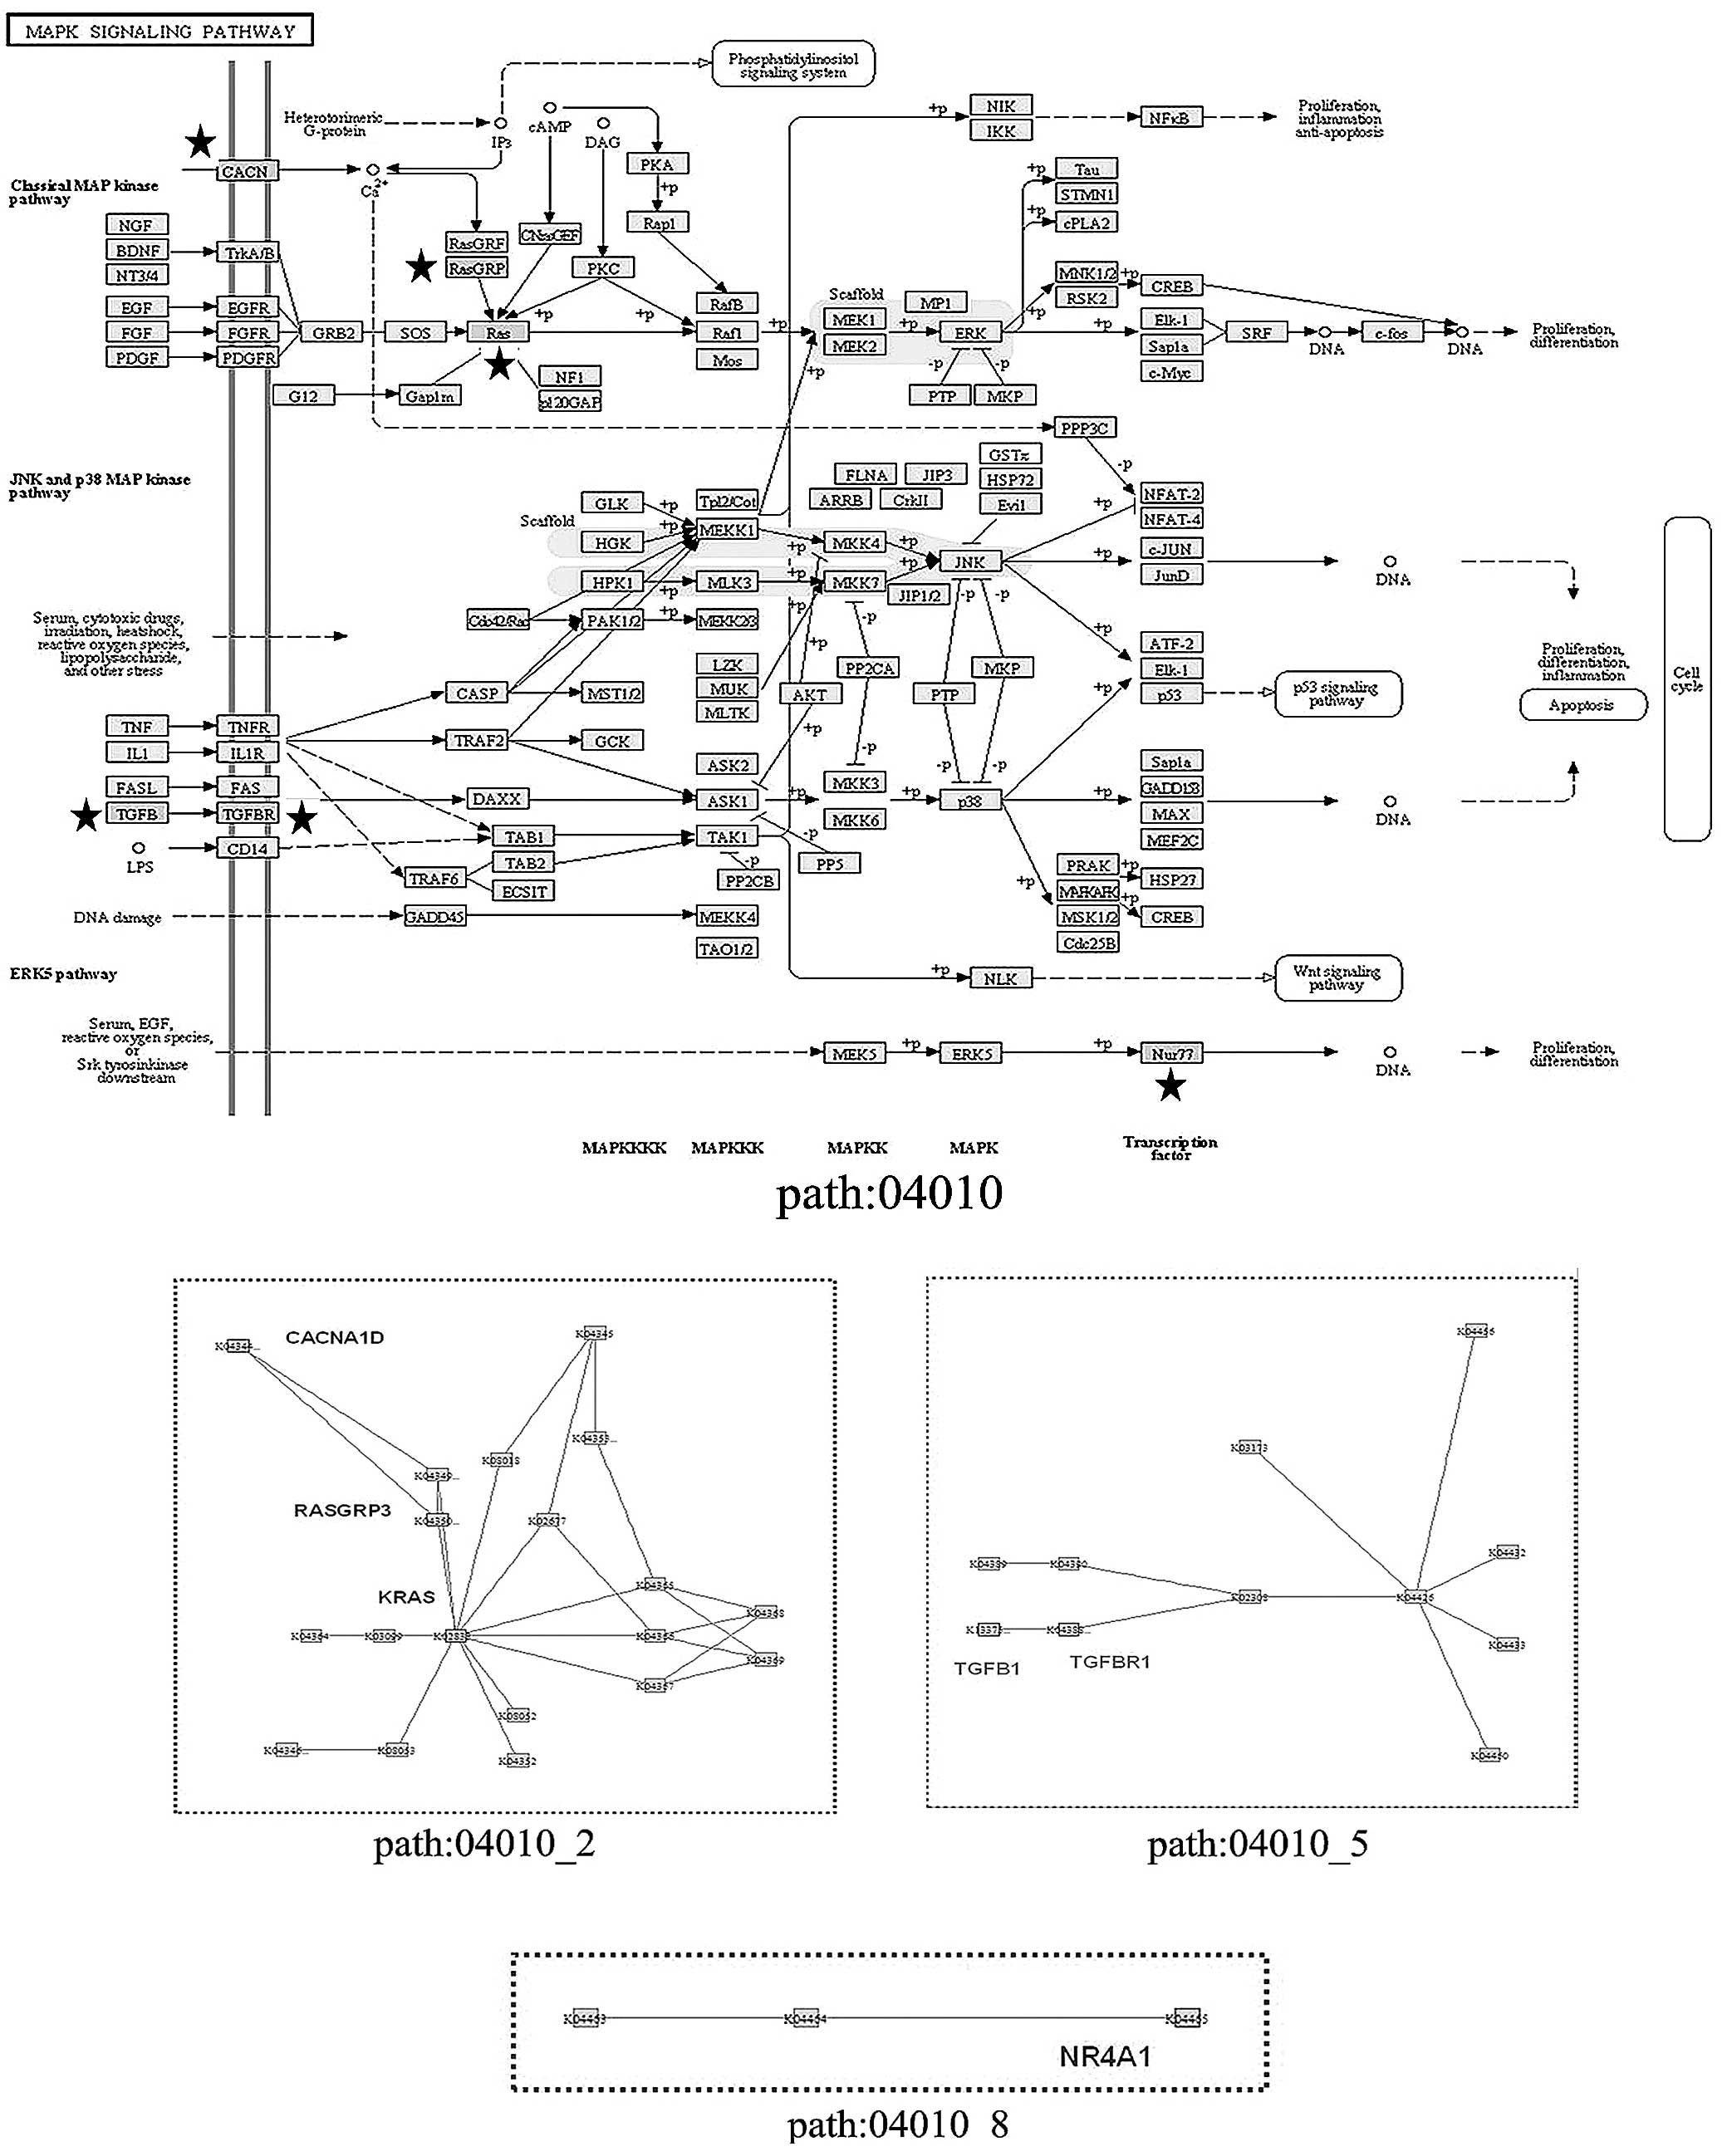
III). Of note, the mitogen-activated protein kinase (MAPK)
signaling pathway (has: 04010) was not detected by the entire
pathway enrichment, but was found to be significant in the
subpathway analysis, with three subpathways derived from three
local areas of this signaling pathway (Fig. 3). The subpathway path:04010_2
contained three DEGs: RASGRP3, KRAS and
CACNA1D; path:04010_5 contained TGFB1 and
TGFBR1, while path:04010_8 only contained NR4A1.
Another pathway detected using this analysis was the TGF-beta
signaling pathway (has:04350), which was not identified by entire
KEGG pathway enrichment, but four subpathways were detected.
Path:04350_6 contained DCN, TGFB1 and TGFBR1.
Path:04350_4 and path:04350_7 contained DCN and
TGFB1, while path:04350_1 and path:04350_8 contained
SMAD9 and TGFBR1.
| Table IIIEnriched Kyoto Encyclopedia of Genes
and Genomes subpathways of differentially expressed genes in
neutrophil gelatinase-associated lipocalin overexpressing EC109
esophageal squamous cell carcinoma cells. |
Table III
Enriched Kyoto Encyclopedia of Genes
and Genomes subpathways of differentially expressed genes in
neutrophil gelatinase-associated lipocalin overexpressing EC109
esophageal squamous cell carcinoma cells.
| Entire pathway
ID | Entire pathway | Subpathway ID | P-value |
|---|
| Path:04960 |
Aldosterone-regulated sodium
reabsorption | path:04960_3 | 0.0161 |
| | path:04960_2 | 0.0462 |
| Path:05146 | Amoebiasis | path:05146_8 | 0.0124 |
| Path:04662 | B cell receptor
signaling pathway | path:04662_9 | 0.0002 |
| | path:04662_4 | 0.0005 |
| Path:05142 | Chagas disease | path:05142_7 | 0.0483 |
| Path:05220 | Chronic myeloid
leukemia | path:05220_5 | 0.0015 |
| Path:05210 | Colorectal
cancer | path:05210_7 | 0.0077 |
| Path:04610 | Complement and
coagulation cascades | path:04610_7 | 0.0008 |
| | path:04610_1 | 0.0043 |
| | path:04610_6 | 0.0043 |
| | path:04610_4 | 0.0375 |
| | path:04610_2 | 0.0403 |
| | path:04610_3 | 0.0403 |
| | path:04610_5 | 0.0432 |
| Path:04060 | Cytokine-cytokine
receptor interaction | path:04060_22 | 0.0015 |
| | path:04060_44 | 0.0244 |
| Path:04623 | Cytosolic
DNA-sensing pathway | path:04623_1 | 0.0364 |
| Path:04512 | ECM-receptor
interaction | path:04512_12 | 0.0064 |
| | path:04512_21 | 0.0364 |
| | path:04512_23 | 0.0364 |
| | path:04512_24 | 0.0483 |
| Path:04012 | ErbB signaling
pathway | path:04012_9 | 0.0168 |
| Path:00790 | Folate
biosynthesis | path:00790_1 | 0.0022 |
| | path:00790_4 | 0.0022 |
| | path:00790_5 | 0.0030 |
| | path:00790_2 | 0.0040 |
| Path:05160 | Hepatitis C | path:05160_8 | 0.0364 |
| Path:04730 | Long-term
depression | path:04730_5 | 0.0271 |
| Path:04010 | MAPK signaling
pathway | path:04010_5 | 0.0161 |
| | path:04010_8 | 0.0364 |
| | path:04010_2 | 0.0393 |
| Path:05218 | Melanoma | path:05218_6 | 0.0322 |
| | path:05218_3 | 0.0492 |
| Path:04621 | NOD-like receptor
signaling pathway | path:04621_4 | 0.0009 |
| | path:04621_7 | 0.0364 |
| | path:04621_6 | 0.0483 |
| Path:05223 | Non-small cell lung
cancer | path:05223_4 | 0.0432 |
| Path:05212 | Pancreatic
cancer | path:05212_9 | 0.0040 |
| Path:05200 | Pathways in
cancer | path:05200_25 | 0.0040 |
| | path:05200_18 | 0.0224 |
| | path:05200_3 | 0.0248 |
| Path:04145 | Phagosome | path:04145_2 | 0.0483 |
| Path:04622 | RIG-I-like receptor
signaling pathway | path:04622_1 | 0.0027 |
| | path:04622_7 | 0.0202 |
| | path:04622_3 | 0.0296 |
| Path:05150 | Staphylococcus
aureus infection | path:05150_1 | 0.0224 |
| | path:05150_2 | 0.0224 |
| | path:05150_7 | 0.0348 |
| | path:05150_4 | 0.0483 |
| Path:00140 | Steroid hormone
biosynthesis | path:00140_14 | 0.0483 |
| Path:04660 | T cell receptor
signaling pathway | path:04660_6 | 0.0064 |
| | path:04660_7 | 0.0107 |
| Path:04350 | TGF-beta signaling
pathway | path:04350_6 | 0.0035 |
| | path:04350_4 | 0.0142 |
| | path:04350_7 | 0.0296 |
| | path:04350_1 | 0.0403 |
| | path:04350_8 | 0.0462 |
| Path:04270 | Vascular smooth
muscle contraction | path:04270_13 | 0.0483 |
Promoter sequence patterns and potential
transcription factors in upregulated and downregulated genes
The spatial distribution and abundance of promoter
cis-elements affects gene expression. The co-expression of
upregulated and downregulated genes in NGAL overpressing
ECO109 cells was considered to be regulated by specific
transcription factors at the transcriptional level. POCO is a
software program that is able to identify over-represented and
under-represented regulatory patterns among promoter sequence sets
of upregulated and downregulated genes. In the present study, a
total of 52 significant sequence patterns were identified to be
over-represented in the downregulated genes but comparatively
under-represented in the upregulated genes, of which the top 20
patterns are presented in Table
IV. Conversely, 75 patterns were observed to be
over-represented in the upregulated genes and simultaneously
under-represented in the downregulated genes; the top 20 patterns
are shown in Table V. The
identified patterns were 5–8 bp long, containing the four known
nucleotides, A, C, G and T, while the rest of the places in a
pattern, marked as N, may be any of these (which are variable).
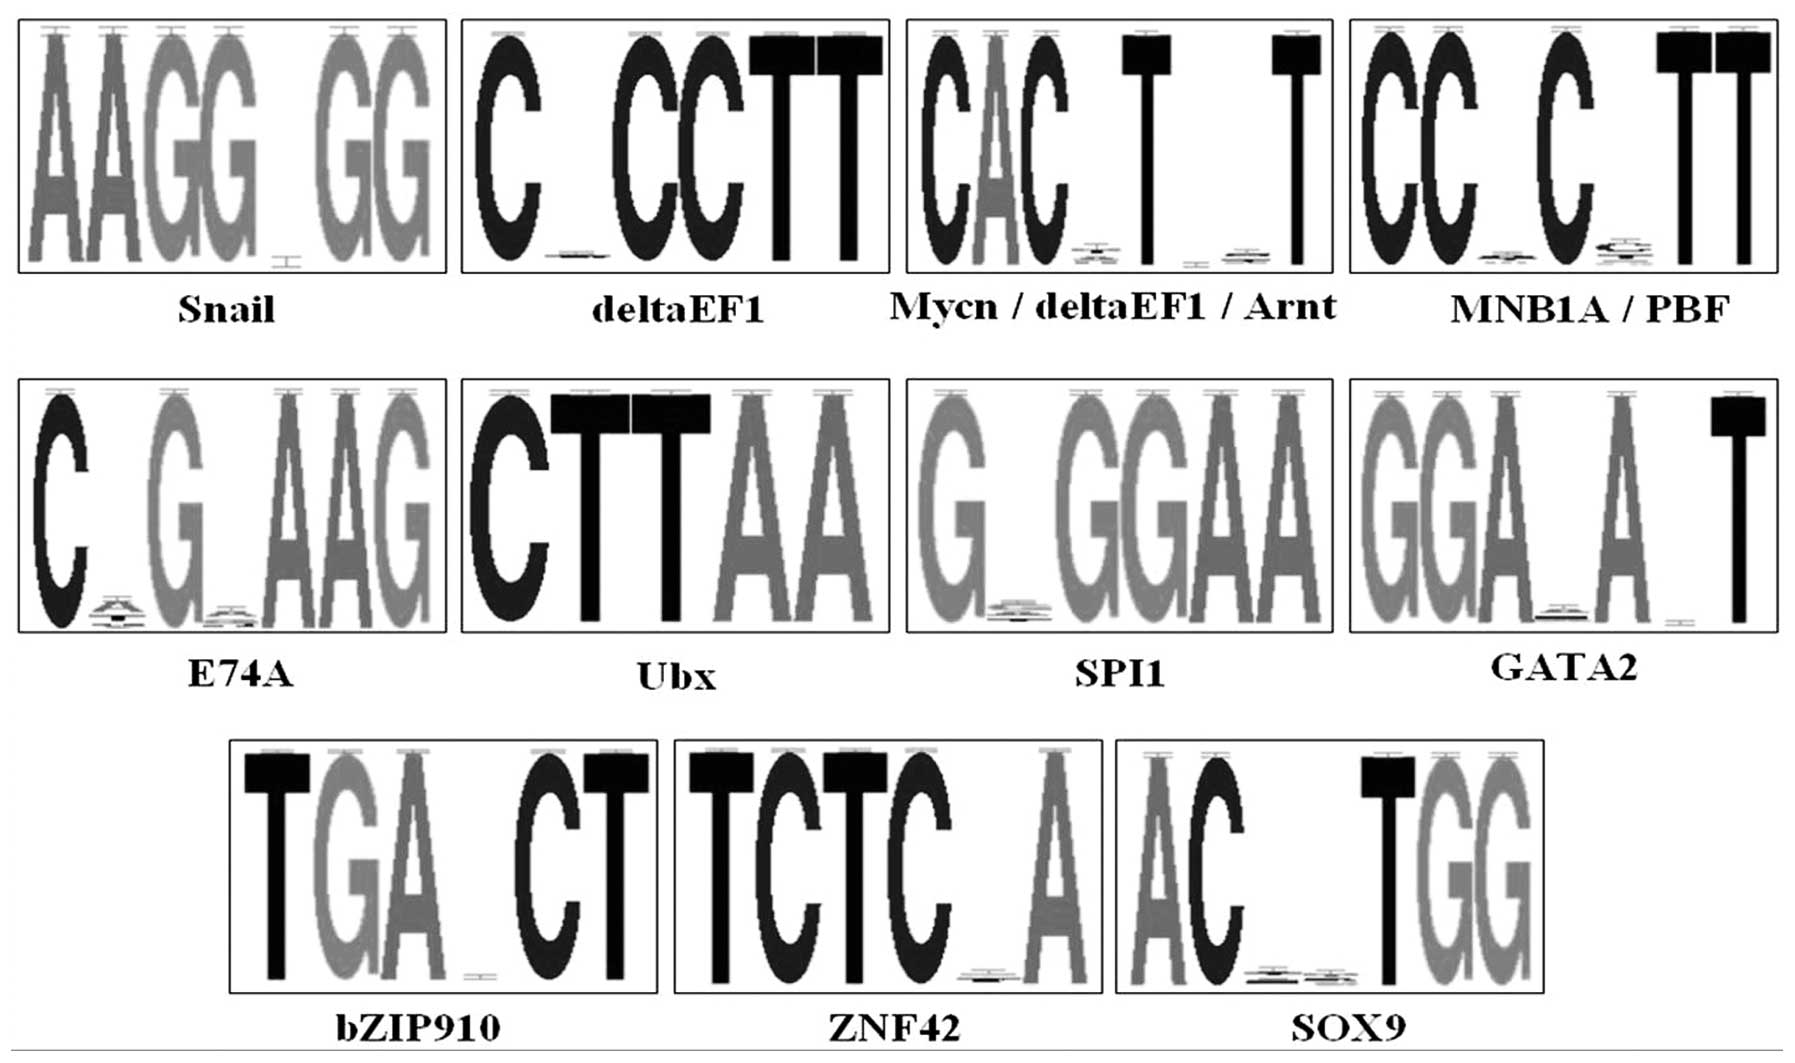
Subsequently, all significant patterns were screened with the
JASPAR transcription factor database to identify potential
transcription factors. A total of 11 patterns corresponding to 14
unique transcription factors were detected (Fig. 4). Of these potential transcription
factors, Snail, deltaEF1, Mycn, Arnt,
MNB1A, PBF, E74A, Ubx, SPI1 and
GATA2 were unique for the downregulated DEG promoters, while
bZIP910, ZNF42 and SOX9 were unique for the
upregulated DEG promoters. These results indicated that these
transcription factors may be associated with specific
transcriptional regulation in the downregulated and upregulated
DEGs. Although a number of sequence patterns did not correspond to
known transcription factors, the possibility and importance in the
regulation of DEGs subsequent to NGAL overexpression was not
discounted.
| Table IVSequence patterns over-represented in
the downregulated genes, but under-represented in the upregulated
genes. |
Table IV
Sequence patterns over-represented in
the downregulated genes, but under-represented in the upregulated
genes.
| Pattern | OCC1
(#PRO/#TOT) | OCC2
(#PRO/#TOT) | F-score | P-value |
|---|
| TGNGGNAA | 42 (19/20) | 14 (11/18) | 3803.53 | 3.33E-04 |
| CTNNGCTT | 36 (19/20) | 12 (10/18) | 3370.77 | 9.24E-04 |
| CACNNNTT | 116 (20/20) | 58 (18/18) | 3160.89 | 1.52E-03 |
| TTAANG | 107 (20/20) | 42 (13/18) | 3118.93 | 1.67E-03 |
| CTTCNCNC | 43 (19/20) | 13 (9/18) | 3107.02 | 1.72E-03 |
| AAGGNG | 140 (20/20) | 65 (18/18) | 3000.42 | 2.21E-03 |
| CCNCCTT | 54 (20/20) | 19 (10/18) | 2823.35 | 3.36E-03 |
| TTAANGNA | 48 (19/20) | 14 (9/18) | 2771.02 | 3.80E-03 |
| CTNNCNTA | 71 (20/20) | 35 (15/18) | 2702.61 | 4.47E-03 |
| AANGNGNG | 106 (20/20) | 54 (17/18) | 2665.29 | 4.88E-03 |
| GACANNT | 84 (20/20) | 40 (15/18) | 2637.85 | 5.21E-03 |
| AANNNGNG | 372 (20/20) | 265 (18/18) | 2629.26 | 5.32E-03 |
| GNNAAGA | 146 (20/20) | 84 (17/18) | 2585.59 | 5.90E-03 |
| CANNCNTT | 104 (20/20) | 50 (16/18) | 2579.94 | 5.97E-03 |
| TNTCCNC | 149 (20/20) | 86 (18/18) | 2575.13 | 6.04E-03 |
| GTGGNNAG | 43 (19/20) | 15 (10/18) | 2562.63 | 6.22E-03 |
| GAAAGNC | 35 (18/20) | 13 (10/18) | 2530.94 | 6.71E-03 |
| CACNCNTT | 31 (19/20) | 10 (8/18) | 2452.32 | 8.08E-03 |
| ACANNTNC | 108 (20/20) | 56 (15/18) | 2447.07 | 8.18E-03 |
| GNANNANG | 402 (20/20) | 277 (18/18) | 2380.87 | 9.57E-03 |
| Table VSequence patterns over-represented in
the upregulated genes, but under-represented in the downregulated
genes. |
Table V
Sequence patterns over-represented in
the upregulated genes, but under-represented in the downregulated
genes.
| Pattern | OCC1
(#PRO/#TOT) | OCC2
(#PRO/#TOT) | F-Score | P-value |
|---|
| CTCNA | 276 (20/20) | 355 (18/18) | 5070.50 | 9.19E-04 |
| ACNNCANT | 55 (19/20) | 97 (18/18) | 4985.61 | 1.05E-03 |
| CTCA | 331 (20/20) | 476 (18/18) | 4740.31 | 1.54E-03 |
| TNNAGTCC | 10 (10/20) | 31 (18/18) | 4712.78 | 1.61E-03 |
| CAANCT | 56 (19/20) | 109 (18/18) | 4363.70 | 2.77E-03 |
| TNCTNAC | 60 (19/20) | 103 (18/18) | 4182.29 | 3.68E-03 |
| TCTCA | 80 (20/20) | 124 (18/18) | 4112.35 | 4.10E-03 |
| TNNTNGAG | 66 (20/20) | 111 (18/18) | 4083.41 | 4.29E-03 |
| GGNNTCAA | 15 (12/20) | 42 (18/18) | 3998.49 | 4.90E-03 |
| CTCANT | 79 (19/20) | 130 (18/18) | 3985.14 | 5.01E-03 |
| TGAGNNA | 103 (20/20) | 158 (18/18) | 3861.85 | 6.07E-03 |
| CTCAA | 66 (20/20) | 115 (18/18) | 3716.14 | 7.63E-03 |
| ANNGGNGT | 55 (19/20) | 99 (18/18) | 3684.44 | 8.02E-03 |
| TTNGAG | 78 (20/20) | 116 (18/18) | 3519.73 | 1.04E-02 |
| TGTNANC | 64 (18/20) | 122 (18/18) | 3507.74 | 1.06E-02 |
| ANACC | 213 (20/20) | 278 (18/18) | 3458.47 | 1.14E-02 |
| TGGNNTC | 77 (19/20) | 128 (18/18) | 3384.73 | 1.28E-02 |
| CCAANCT | 11 (8/20) | 33 (18/18) | 3379.39 | 1.29E-02 |
| TTGANNC | 53 (19/20) | 93 (18/18) | 3372.46 | 1.31E-02 |
| CCNANNNT | 285 (20/20) | 337 (18/18) | 3362.13 | 1.33E-02 |
Discussion
ESCC has one of the highest mortality rates of
malignant tumors worldwide, particularly in Asia, with an overall
five-year survival rate <20% (16). NGAL has been shown to be an
important mediator of invasion and metastasis in ESCC (5,6,10).
However, for a improved understanding of the role of NGAL in ESCC,
a comprehensive analysis of the mRNA profile of NGAL
overexpression ESCC cells was conducted in the present study, using
multiple bioinformatic analyses. A total of 267 DEGs were observed
in the NGAL overexpressing cells compared with control
cells, using a two-fold change as the threshold. To understand the
function of these DEGs, the DEGs were analyzed by GO enrichment
using DAVID bioinformatics. Several GO terms associated with known
NGAL functions were detected. For example, 21 immune-associated
terms were identified, including response to stress, defense
response and regulation of immune response. In the response to
stimulus (GO:0050896) term, >43 genes were enriched. For
example, one of the enriched genes, RAD9, protects against
genomic instability by activating DNA damage checkpoint and DNA
damage repair pathways (17).
Another enriched gene, DEFB1, is constitutively expressed in
epithelial tissues, but may be upregulated upon receiving
inflammatory or microbial stimuli (18).
Recent studies have observed that NGAL is involved
in the antibacterial iron-depletion strategy of the innate immune
system. NGAL binds catecholate-type siderophores, such as
enterobactin synthesized by E. coli, to arrest E.
coli growth through inhibiting the iron-uptake ability
(19). Several studies found NGAL
to be critical in the antimicrobial molecular response in
infections, including Salmonella (20,21),
Chlamydia (22) and
Mycobacterium tuberculosis (23). The GO enrichment analysis in the
present study suggested that in addition to NGAL itself, NGAL
downstream effectors exert a marked impact on cell immune function
and in response to other stimuli, including stress and defense
responses.
Of note, 17 histone-associated proteins were
upregulated in response to NGAL overexpression. The
association between NGAL and histone-associated proteins had not
been reported previously, to the best of our knowledge. Therefore,
investigating how NGAL influences chromatin structure and gene
transcription was of interest. The results of the present study
provided novel information regarding the role of NGAL in gene
transcriptional regulation through chromatin organization and
nucleosome assembly.
The functional annotation chart provided a markedly
wider overview of the biological impact of NGAL
overexpression in ESCC than traditional GO enrichment. The chart
reported that five DEGs were found using the hsa04350:TGF-beta
signaling pathway term, which were not identified by the KEGG
pathway enrichment analysis. Alport syndrome, which contained
COL4A4 and COL4A3, was the only enriched term from
the OMIM_DISEASE category listed in the chart. Urine and plasma
NGAL have been revealed to be novel biomarkers for diagnosis and
outcome prediction in renal dysfunction conditions, including acute
kidney injury, chronic kidney disease and renal
ischemia-reperfusion injury (24–26).
The correlation between kidney disease and NGAL interaction with
downstream effectors was marked. A total of 67 genes were enriched
in the SP_PIR_KEYWORDS signal term and 33 of these genes were
contained in the Secreted term.
NGAL is a secreted protein, which forms a complex
with MMP-9 to prevent its autodegradation, which is critical for
extracellular matrix remodeling (2). Extracellular NGAL has been suggested
to cause the secretion of other proteins, such as FN1, which
regulate the acute inflammatory response, cell-matrix adhesion and
the defense response (27). Four
genes, C3, SAA1, CFB and FN1, were
enriched in the SP_PIR_KEYWORDS acute phase term. Of note, all four
genes are defined as positive acute phase proteins, which are
considered to exert the following general functions: Opsonization
and trapping of microorganisms and associated microbial products;
binding cellular remnants, such as nuclear fractions; scavenging
free hemoglobin and radicals; and modulating the immune response of
the host (28).
Although an entire pathway may not be identified to
be statically significant, alterations in local gene expression
levels may affect the local pathway significantly, which results in
a marked impact on the biological outcome. Subpathway analysis is a
powerful method to detect genes in the local area of the KEGG
pathway. Li et al (29)
constructed a drug-metabolic subpathway network and found the local
region of the tyrosine metabolic pathway to be closely associated
with the development of lung cancer. A total of 60 subpathways
corresponding to 27 entire pathways were found in the present
study. Several subpathway-derived entire pathways were identified
using this method. For example, the MAPK signaling pathway and the
TGF-beta signaling pathway were detected. These results suggested
that although certain DEGs did not significantly affect an entire
pathway, they did perturb the pathway locally. Other proteins in
these pathways were not differentially expressed at the mRNA level,
but this may exclude processes such as modification and complex
formation, undergone by the DEGs.
DEGs were classified into upregulated and
downregulated genes as determined by the respective expression
levels. How these two group genes were co-regulated by
distinguishing sequence patterns and transcription factors was
notable. The POCO software program identifies over- and
under-represented regulatory patterns among the promoter sequence
sets of upregulated and downregulated genes. Not all DEGs are
considered to be modified at the transcriptional level; the DEGS
may have been differentially expressed due to differences in mRNA
stability. Thus, in the present study, the 20 genes exhibiting the
greatest up- or downregulation in NGAL overexpressing ESCC
cells were analyzed by POCO. Hundreds of significant sequence
patterns and dozens of transcription factors were found to be over-
and under-represented in the downregulation gene set and the
upregulation gene set, respectively. This suggested that the change
in signal transduction following NGAL overexpression
resulted in specific transcription factors and/or certain sequence
patterns exerting critical regulatory roles, to achieve
co-regulation of the significantly down- or upregulated genes at
the transcriptional level.
A number of these potential transcription factors
have previously been reported to be associated with cancer invasion
or metastasis. Snail and ZEB1 (deltaEF1) are
predominantly involved in the repression of E-cadherin expression,
resulting in epithelial to mesenchymal transition, which has been
implicated as the critical event initiating cancer invasion and
metastasis (30,31). Overexpression of Snail was
shown to correlate positively with lymphovascular invasion and was
associated with poorer overall survival in ESCC patients (32). Nuclear expression of ZEB1
was observed in >33% ESCC tumor cells, while ZEB1 was not
detected in the normal adult esophageal epithelia (33). PBF was hypothesized to
induce the translocation of PTTG to the cell nucleus, where it
induces tumorigenesis via a number of different mechanisms
(33). PBF is upregulated
by estrogen and mediates estrogen-stimulated cell invasion in
breast cancer cells (34). SPI1
co-operates with MYC regulating the transcription of
microRNA-29b, which is important in the neutrophil
differentiation of acute promyelocytic leukaemia cells (35). Notably, NGAL was first identified
as a protein stored in specific granules of human neutrophils
(36). A potential SPI1 binding
site was identified in the promoter region of the NGAL gene
by computer analysis (37). These
results indicated that SPI1 may be the key molecule in biological
functions mediated by NGAL. SOX9, a high-mobility group box
transcription factor, is required for development, differentiation
and lineage commitment. Cytoplasmic SOX9 may serve as a valuable
prognostic marker in invasive ductal carcinoma and metastatic
breast cancer. The significant correlation identified between SOX9
and breast tumor cell proliferation implies that SOX9 directly
contributes to the poor clinical outcomes associated with invasive
breast cancer (38). These results
indicated that these transcription factors may be involved in the
invasion or metastasis mediated by NGAL. Although numerous sequence
patterns were not matched to known transcription factors, the
specific base composition suggested that these patterns may be
crucial in transcriptional regulation. These results indicated that
these sequence patterns and transcription factors may respond to
particular transcriptional regulation in downregulated and
upregulated DEGs.
In conclusion, in the present study, a comprehensive
understanding of the role of NGAL in ESCC following NGAL
overexpression was obtained by multiple bioinformatic analyses,
particularly through analyzing subpathway and sequence patterns for
co-expression, which provided more information than traditional
methods. These analytical methods may be used to search for novel
functional genes and pathways associated with the relevant genes
identified from high-throughput data.
Acknowledgements
This study was supported by grants from the
NSFC-Guangdong Joint Fund (grant no. U0932001), the National Basic
Research Program (grant no. 2012CB526608), the National High
Technology Research and Development Program of China (grant nos.
2012AA02A503 and 2012AA02A209), the National Science Foundation of
China (grant no. 30900560), the Foundation for Distinguished Young
Talents in Higher Education of Guangdong (grant no. LYM09081) and
Shantou University Medical Research Fund.
References
|
1
|
Flower DR: The lipocalin protein family:
structure and function. Biochem J. 318:1–14. 1996.
|
|
2
|
Yan L, Borregaard N, Kjeldsen L and Moses
MA: The high molecular weight urinary matrix metalloproteinase
(MMP) activity is a complex of gelatinase B/MMP-9 and neutrophil
gelatinase-associated lipocalin (NGAL). Modulation of MMP-9
activity by NGAL. J Biol Chem. 276:37258–37265. 2001. View Article : Google Scholar : PubMed/NCBI
|
|
3
|
Yang J, Goetz D, Li JY, et al: An iron
delivery pathway mediated by a lipocalin. Mol Cell. 10:1045–1056.
2002. View Article : Google Scholar : PubMed/NCBI
|
|
4
|
Chakraborty S, Kaur S, Guha S and Batra
SK: The multifaceted roles of neutrophil gelatinase associated
lipocalin (NGAL) in inflammation and cancer. Biochim Biophys Acta.
1826.129–169. 2012.PubMed/NCBI
|
|
5
|
Zhang H, Xu L, Xiao D, et al: Upregulation
of neutrophil gelatinase associated lipocalin in oesophageal
squamous cell carcinoma: significant correlation with cell
differentiation and tumour invasion. J Clin Pathol. 60:555–561.
2007. View Article : Google Scholar
|
|
6
|
Du ZP, Lv Z, Wu BL, et al: Neutrophil
gelatinase-associated lipocalin and its receptor: independent
prognostic factors of oesophageal squamous cell carcinoma. J Clin
Pathol. 64:69–74. 2011. View Article : Google Scholar : PubMed/NCBI
|
|
7
|
Hu L, Hittelman W, Lu T, et al: NGAL
decreases E-cadherin- mediated cell-cell adhesion and increases
cell motility and invasion through Rac1 in colon carcinoma cells.
Lab Invest. 89:531–548. 2009. View Article : Google Scholar : PubMed/NCBI
|
|
8
|
Iannetti A, Pacifico F, Acquaviva R, et
al: The neutrophil gelatinase-associated lipocalin (NGAL), a
NF-kappaB-regulated gene, is a survival factor for thyroid
neoplastic cells. Proc Natl Acad Sci USA. 105:14058–14063. 2008.
View Article : Google Scholar
|
|
9
|
Tong Z, Kunnumakkara AB, Wang H, et al:
Neutrophil gelatinase- associated lipocalin: a novel suppressor of
invasion and angiogenesis in pancreatic cancer. Cancer Res.
68:6100–6108. 2008. View Article : Google Scholar : PubMed/NCBI
|
|
10
|
Wu B, Li C, Du Z, et al: Network based
analyses of gene expression profile of LCN2 overexpression in
esophageal squamous cell carcinoma. Sci Rep. 4:54032014.PubMed/NCBI
|
|
11
|
Huang da W, Sherman BT and Lempicki RA:
Systematic and integrative analysis of large gene lists using DAVID
bioinformatics resources. Nat Protoc. 4:44–57. 2009.PubMed/NCBI
|
|
12
|
Merico D, Isserlin R, Stueker O, Emili A
and Bader GD: Enrichment map: a network-based method for gene-set
enrichment visualization and interpretation. PLoS One.
5:e139842010. View Article : Google Scholar : PubMed/NCBI
|
|
13
|
Li C, Li X, Miao Y, et al:
SubpathwayMiner: a software package for flexible identification of
pathways. Nucleic Acids Res. 37:e1312009. View Article : Google Scholar : PubMed/NCBI
|
|
14
|
Kankainen M and Holm L: POCO: discovery of
regulatory patterns from promoters of oppositely expressed gene
sets. Nucleic Acids Res. 33(Web Server issue): W427–W431. 2005.
View Article : Google Scholar : PubMed/NCBI
|
|
15
|
Jefferson JA, Lemmink HH, Hughes AE, et
al: Autosomal dominant Alport syndrome linked to the type IV
collage alpha 3 and alpha 4 genes (COL4A3 and COL4A4). Nephrol Dial
Transplant. 12:1595–1599. 1997. View Article : Google Scholar : PubMed/NCBI
|
|
16
|
He J, Gu D, Wu X, et al: Major causes of
death among men and women in China. N Engl J Med. 353:1124–1134.
2005. View Article : Google Scholar : PubMed/NCBI
|
|
17
|
Pérez-Castro AJ and Freire R: Rad9B
responds to nucleolar stress through ATR and JNK signalling, and
delays the G1-S transition. J Cell Sci. 125:1152–1164.
2012.PubMed/NCBI
|
|
18
|
Prado-Montes de Oca E: Human beta-defensin
1: a restless warrior against allergies, infections and cancer. Int
J Biochem Cell Biol. 42:800–804. 2010.PubMed/NCBI
|
|
19
|
Goetz DH, Willie ST, Armen RS, et al:
Ligand preference inferred from the structure of neutrophil
gelatinase associated lipocalin. Biochemistry. 39:1935–1941. 2000.
View Article : Google Scholar : PubMed/NCBI
|
|
20
|
Godinez I, Haneda T, Raffatellu M, et al:
T cells help to amplify inflammatory responses induced by
Salmonella enterica serotype Typhimurium in the intestinal
mucosa. Infect Immun. 76:2008–2017. 2008. View Article : Google Scholar : PubMed/NCBI
|
|
21
|
Nairz M, Fritsche G, Brunner P, et al:
Interferon-gamma limits the availability of iron for
intramacrophage Salmonella typhimurium. Eur J Immunol.
38:1923–1936. 2008. View Article : Google Scholar : PubMed/NCBI
|
|
22
|
Rodríguez N, Mages J, Dietrich H, et al:
MyD88-dependent changes in the pulmonary transcriptome after
infection with Chlamydia pneumoniae. Physiol Genomics.
30:134–145. 2007.PubMed/NCBI
|
|
23
|
Martineau AR, Newton SM, Wilkinson KA, et
al: Neutrophil- mediated innate immune resistance to mycobacteria.
J Clin Invest. 117:1988–1994. 2007. View Article : Google Scholar : PubMed/NCBI
|
|
24
|
Noto A, Cibecchini F, Fanos V and Mussap
M: NGAL and metabolomics: the single biomarker to reveal the
metabolome alterations in kidney injury. Biomed Res Int.
2013:6120322013. View Article : Google Scholar : PubMed/NCBI
|
|
25
|
Alharazy SM, Kong N, Saidin R, et al:
Serum neutrophil gelatinase-associated lipocalin and cystatin C are
early biomarkers of contrast-induced nephropathy after coronary
angiography in patients with chronic kidney disease. Angiology.
65:436–442. 2014. View Article : Google Scholar
|
|
26
|
Sohotnik R, Nativ O, Abbasi A, et al:
Phosphodiesterase-5 inhibition attenuates early renal
ischemia-reperfusion-induced acute kidney injury: assessment by
quantitative measurement of urinary NGAL and KIM-1. Am J Physiol
Renal Physiol. 304:F1099–F1104. 2013. View Article : Google Scholar
|
|
27
|
Soikkeli J, Podlasz P, Yin M, et al:
Metastatic outgrowth encompasses COL-I, FN1, and POSTN
up-regulation and assembly to fibrillar networks regulating cell
adhesion, migration, and growth. Am J Pathol. 177:387–403. 2010.
View Article : Google Scholar : PubMed/NCBI
|
|
28
|
Gruys E, Toussaint MJ, Niewold TA and
Koopmans SJ: Acute phase reaction and acute phase proteins. J
Zhejiang Univ Sci B. 6:1045–1056. 2005. View Article : Google Scholar : PubMed/NCBI
|
|
29
|
Li C, Shang D, Wang Y, et al:
Characterizing the network of drugs and their affected metabolic
subpathways. PLoS One. 7:e473262012. View Article : Google Scholar : PubMed/NCBI
|
|
30
|
Wu Y and Zhou BP: Snail: More than EMT.
Cell Adh Migr. 4:199–203. 2010. View Article : Google Scholar : PubMed/NCBI
|
|
31
|
Schmalhofer O, Brabletz S and Brabletz T:
E-cadherin, beta-catenin, and ZEB1 in malignant progression of
cancer. Cancer Metastasis Rev. 28:151–166. 2009. View Article : Google Scholar : PubMed/NCBI
|
|
32
|
Kuo KT, Chou TY, Hsu HS, Chen WL and Wang
LS: Prognostic significance of NBS1 and Snail expression in
esophageal squamous cell carcinoma. Ann Surg Oncol. 19 Suppl
3:S549–S557. 2012. View Article : Google Scholar : PubMed/NCBI
|
|
33
|
Ohashi S, Natsuizaka M, Naganuma S, et al:
A NOTCH3-mediated squamous cell differentiation program limits
expansion of EMT-competent cells that express the ZEB transcription
factors. Cancer Res. 71:6836–6847. 2011. View Article : Google Scholar : PubMed/NCBI
|
|
34
|
Smith VE, Franklyn JA and McCabe CJ:
Expression and function of the novel proto-oncogene PBF in thyroid
cancer: a new target for augmenting radioiodine uptake. J
Endocrinol. 210:157–163. 2011. View Article : Google Scholar : PubMed/NCBI
|
|
35
|
Batliner J, Buehrer E, Federzoni EA, et
al: Transcriptional regulation of MIR29B by PU.1 (SPI1) and MYC
during neutrophil differentiation of acute promyelocytic leukaemia
cells. Br J Haematol. 157:270–274. 2012. View Article : Google Scholar : PubMed/NCBI
|
|
36
|
Kjeldsen L, Johnsen AH, Sengeløv H and
Borregaard N: Isolation and primary structure of NGAL, a novel
protein associated with human neutrophil gelatinase. J Biol Chem.
268:10425–10432. 1993.PubMed/NCBI
|
|
37
|
Cowland JB and Borregaard N: Molecular
characterization and pattern of tissue expression of the gene for
neutrophil gelatinase-associated lipocalin from humans. Genomics.
45:17–23. 1997. View Article : Google Scholar
|
|
38
|
Chakravarty G, Moroz K, Makridakis NM, et
al: Prognostic significance of cytoplasmic SOX9 in invasive ductal
carcinoma and metastatic breast cancer. Exp Biol Med (Maywood).
236:145–155. 2011. View Article : Google Scholar : PubMed/NCBI
|