Introduction
As a predominant source of energy and a crucial
component of biological cell membranes, fat is an important
macronutrient for humans and other mammals. The level of fat intake
is positively correlated with the average serum cholesterol and the
mortality rate due to coronary heart disease (1). Fatty acids (FAs) are classified as
saturated, monounsaturated and polyunsaturated, and the biological
functions of the FAs depend on molecular structure and cellular
accumulation. Normally, FAs absorbed in the liver are esterified to
triglycerides (TGs) for transportation to extrahepatic tissues by
lipoproteins, and are oxidized via β-oxidation in the mitochondria
or peroxisomes. With an increase in nutrient intake, the hepatic FA
level is significantly increased, which may result in mitochondrial
oxidation of FAs and oxidative stress in the liver (2,3),
with subsequent development of metabolic disease. For example,
diabetes is commonly associated with changes in hepatic glucose and
lipid metabolism (4), which may be
partly attributed to the altered expression levels of hepatic genes
involved in glucose and lipid metabolism (5).
As precursors of the ligands that bind to nuclear
receptors (6,7), FAs are key in the regulation of
intracellular signaling pathways. Highly unsaturated fatty acids
(HUFAs; 20- and 22-carbon omega-6 or omega-3 polyenoic fatty acids)
have been reported to inhibit the transcription of glycolytic and
lipogenic genes through two types of HUFA regulatory response
regions (HUFA-RR) (7). One region overlaps with the insulin
response element (IRE), while the other co-localizes with
the carbohydrate response element. The HUFA-RR/IRE
contains recognition sequences of sterol regulatory-element binding
protein 1c (SREBP-1c). As a result, HUFAs inhibit the
activity of promoters containing the HUFA-RR/IRE by
reducing the levels of SREBP-1c associated with the
respective recognition sequences. SREBP-1c and
peroxisome proliferator-activated receptors (PPARs) regulate
multiple signaling pathways involved in hepatic carbohydrate and
lipid metabolism (8,9). Polyunsaturated fatty acids (PUFAs)
activate PPARs by direct binding, which results in the induction of
hepatic FA oxidation and thus the inhibition of hepatic FA
synthesis by suppressing SREBP-1c gene transcription and
enhancing SREBP-1c mRNA degradation. In murine models
of obesity and type 2 diabetes mellitus, PPAR-γ mRNA and
protein levels were upregulated in the liver (10). The activation of liver X receptors
(LXRs), members of the nuclear receptor family, inhibits the
synthesis of cholesterol (11) in
the liver and the absorption of cholesterol in the intestinal tract
(12). Apolipoproteins (apo)C-I
and E synthesized by the liver are predominant plasma proteins
involved in the transport of cholesterol and TGs. Overactivated
apoC-I may prevent the development of insulin resistance
(13). A PPAR receptor response
element is located in the control region of the
apoE/C-I gene cluster (14). However, the effect of exogenous FAs
on the expression levels of the apoC-I gene is not
clear.
Although a number of previous studies have
investigated the effects of dietary fat on the expression levels of
hepatic genes involved in lipid metabolism (15–17),
the studies have mainly focused on high-PUFA. However, dietary fat
is a mixture of saturated, monounsaturated and polyunsaturated FAs.
Reports regarding the effects of FA mixtures containing three types
of FA on the expression levels of genes involved in hepatic lipid
metabolism are limited. In the present study, palmitic acid (PA,
C16:0), oleic acid (OA, C18:1) and docosahaexenoic acid (DHA,
C22:6) were selected to represent saturated, mono-unsaturated and
poly-unsaturated FAs, respectively. According to a previous study
(18), LO2 cells can be used to
establish an in vitro model of hepatocyte steatosis. Using
treatment with single or multiple FAs at different concentrations,
the cytotoxicity and effects of the FAs on the expression levels of
genes involved in lipid metabolism in human hepatic LO2 cells were
investigated in order to provide an improved understanding of the
influence of FA composition in dietary fats on lipid
metabolism.
Materials and methods
Cell culture and treatment with FAs
LO2 cells were obtained from Tongji Medical College
(Wuhan, China) and were cultured in RPMI-1640 media supplemented
with 10% fetal bovine serum and 1% penicillin/streptomycin at 37°C
in a humidified incubator with 5% CO2. When the cells
reached 75% confluence, serum-free medium with different
concentrations of FAs was added into the culture for 24 h. The
concentrations of PA, OA and DHA used were 0, 0.4, 0.8, 1.6, 3.2,
6.4 and 12.8 μg/ml. PA, OA and DHA were obtained from Sigma (St.
Louis, MO, USA) and were dissolved in absolute ethyl alcohol (stock
solution, 5 mg/ml). Three ratios (mass-to-volume ratio) of PA, OA
and DHA were selected, 1:2:1, 1:1:1 and 1:1:2, according to the
SFA/MUFA/PUFA ratio (1:1.7:1.2) of the average Chinese diet
(19). As determined by the
cytotoxicity of each FA, the concentrations of mixed FAs were
selected to be 3.2 and 12.8 g/ml.
Cell viability
The effect of FAs on the viability of LO2 cells was
assessed by a 3-(4, 5-dimethylthiazol-2-yl)-2, 5-diphenyl
tetrazolium bromide (MTT; Amresco, Solon, OH, USA) assay. LO2 cells
were seeded in 96 well plates at 1×10⁴ cells/well. After
24 h FA treatment, 20 μl MTT solution (5 mg/ml, OH, USA) was added
to each well and the cells were incubated for 4 h at 37°C. A volume
of 100 ml dimethyl sulfoxide (Amresco) was then added to each well
to dissolve the formazan salts and the optical absorbance at 490 nm
was determined via a microplate reader (BioTek Instruments, Inc.,
Winooski, VT, USA). The viability is shown as a percentage of the
corresponding control.
Aspartate transaminase (AST) release
assay
LO2 cells were cultured in 12-well plates at
2×10⁵ cells/well. Following treatment with FAs for 24 h,
2 ml medium was collected and spun at 1,000 × g for 5 min at 4°C.
Thus, AST was released from the destroyed LO2 cells. The
supernatant was transferred to a fresh tube and stored at 4°C for
subsequent measurements. The activities of AST in the media were
assessed using an AST assay kit (Nanjing Jiancheng Bioengineering
Institute, Nanjing, China) following the manufacturer’s
instructions. The AST activity was presented as U/l. The higher the
AST activity, the lower the cell viability.
Measurement of intracellular TG
LO2 cells were cultured in 12-well plates at
2×10⁵ cells/well. Following treatment with the FAs for
24 h, the cells were washed with ice-cold phosphate-buffered saline
and dissolved in lysis buffer [50 mM Tris (pH 7.4), 150 mM NaCl, 1%
Triton X-100, 1% sodium deoxycholate, 0.1% SDS, 1 mM sodium
orthovanadate, 50 mM sodium fluoride, 1 mM EDTA and 20 μg/ml
leupeptin]. The lysates were spun at 12,000 × g for 5 min at 4°C.
The TG concentration in the supernatant was detected using a TG
assay kit (Jiancheng Bioengineering Institute, Nanjing, Jiangsu,
China) following the manufacturer’s instructions and then
normalized to total protein content.
Expression levels of mRNA
After 6 h FA treatment, the LO2 cells were collected
and total RNA was isolated using Trizol reagent (Life Technologies
Corporation, Grand Island, NY, USA) following the manufacturer’s
instructions. The concentration [absorbance at 260 nm, i.e. optical
density (OD)260 and purity (OD260/OD280)] of the RNA samples were
assessed using a DU Series 700 UV/Vis Scanning Spectrophotometer
(Beckman Coulter, Miami, FL, USA). The concentration of the
isolated RNA was adjusted to 1 mg/ml, stored at −80°C and was
thawed once. Single-strand cDNA was prepared from 1 mg RNA using a
reverse transcription-polymerase chain reaction (RT-PCR) assay kit
(Life Technologies Corporation) according to the manufacturer’s
instructions.
The expression levels of PPAR-γ, LXRα,
SREBP-1c, apoC-I and GAPDH mRNA were
determined by RT-PCR. All primers and the product sizes for the
genes analyzed in the present study are shown in Table I. At the end of RT-PCR, an
extension step was performed at 72°C for 5 min and the products
were stored at 4°C for further analysis. Each PCR sample was
separated on a 2% agarose gel. The integrated optical density of
each gene on the gel was analyzed using G:BOX Chemi XR5 (Syngene,
Cambridge, UK). The gene expression levels were defined as the
relative expression values calculated from target gene/GAPDH
gene expression levels. All PCR samples were run in triplicate or
quadruplicate.
 | Table IPrimer sequences of the corresponding
genes. |
Table I
Primer sequences of the corresponding
genes.
| Gene | Primer sequence
5′-3′ | Amplified fragment
length (bp) | GeneBank accession
number |
|---|
| PPAR-γ | F:
GCTGGCCTCCTTGATGAATA
R: TTGGGCTCCATAAAGTCACC | 114 | NM_138711 |
| LXRα | F:
CGCACTACATCTGCCACAGT
R: TCAGGCGGATCTGTTCTTCT | 141 | NM_001251935 |
|
SREBP-1c | F:
CCTATTTGACCCACCCTAT
R: GGCACTGACTCTTCCTTGA | 249 | NM_004176 |
| apoC-I | F:
GGCTCTTCCTGTCGCTCCCGGTC
R: TGAGTCAATCTTGAGTTTCTCCT | 245 | NM_001645 |
| GAPDH | F:
ACCACAGTCCATGCCATCAC
R: TCCACCACCCTGTTGCTGTA | 452 | NM_001256799 |
Statistical analysis
Data are presented as the mean ± standard deviation.
All quantitative data represent a minimum of three experiments
conducted in triplicate. Data were analyzed by one-way analysis of
variance with Tamhane’s T2 as a post hoc test using SPSS 17.0
statistical software (SPSS, Inc., Chicago, IL, USA). P<0.05 was
considered to indicate a statistically significant difference.
Results
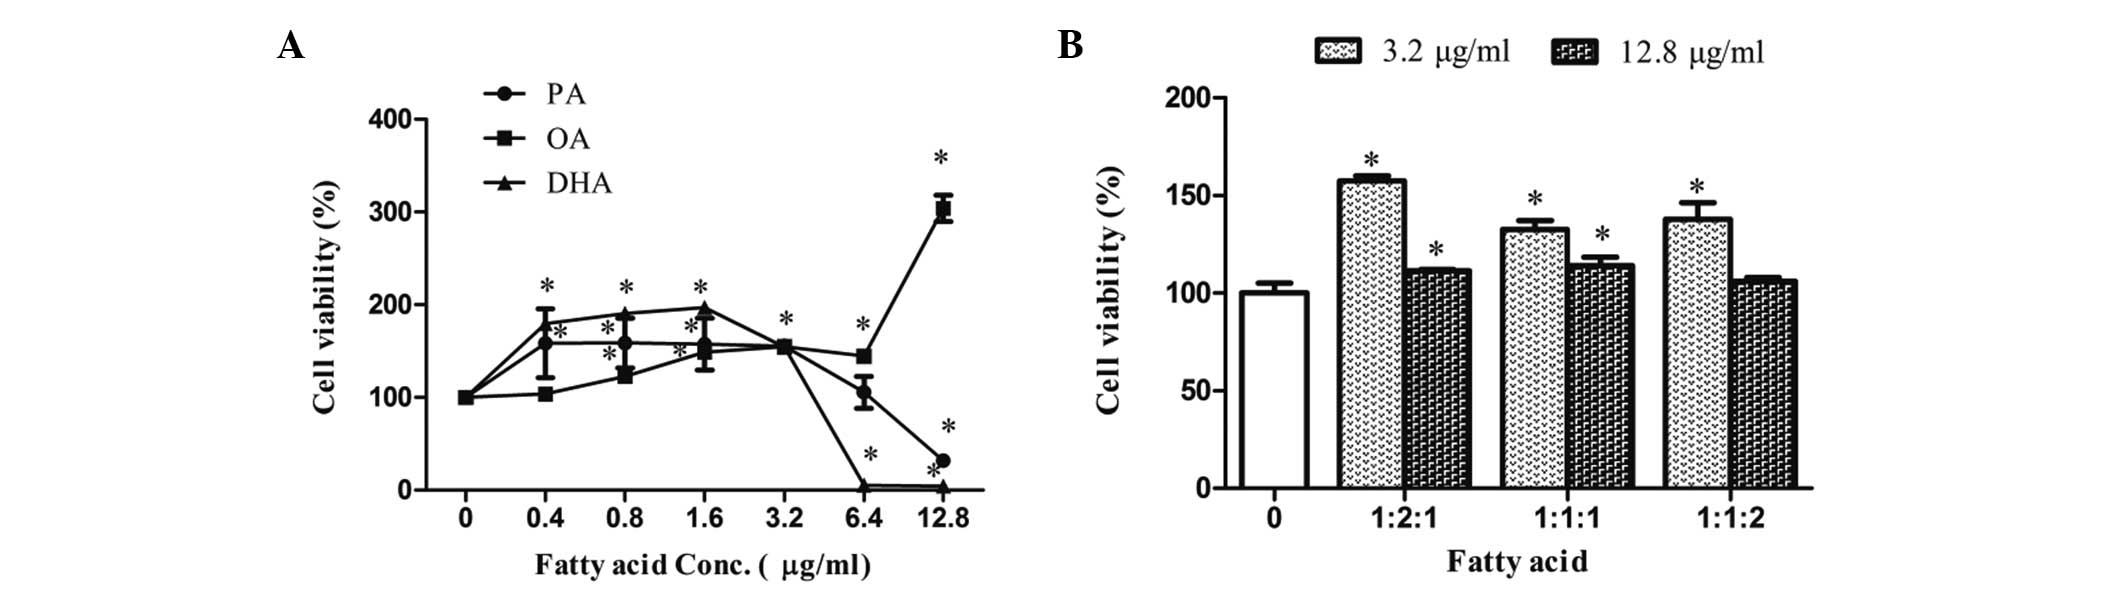
Effects of FAs on LO2 cell viability
The cell viability following FA treatment was
analyzed via an MTT assay and is shown in Fig. 1. At concentrations between 0 and
3.2 μg/ml, OA increased the viability of the LO2 cells compared
with the control group. DHA exhibited the same tendency at
concentrations of 0–1.6 μg/ml (P<0.05). PA significantly
increased the viability of LO2 cells compared with the control
group at concentrations of 0–0.4 μg/ml (P<0.05) and maintained
the same level of cell viability at concentrations of 0.4–3.2
μg/ml. Notably, at a concentration of 3.2 μg/ml, OA, DHA and PA
exhibited similar effects on cell viability (154.9±3.7% vs.
154.4±3.7% vs. 155.6±2.5% of the control group cell viability).
When the FA concentrations were >3.2 μg/ml, the cell viabilities
of the DHA and PA groups were markedly reduced in comparison with
the control group, particularly in the DHA group. No cell survived
at 6.4 μg/ml DHA. However, the cell viability in the OA group was
significantly increased at concentrations of 6.4–12.8 μg/ml
compared with the control group (P<0.05).
The effects of two concentrations (3.2 and 12.8
μg/ml, as determined by the above results) of mixed FAs (1:2:1,
1:1:1 and 1:1:2 for PA:OA:DHA, respectively) on LO2 cell viability
were investigated, and the results are shown in Fig. 1B. The cell viabilities following
treatment with mixed FAs were all increased compared with the
control (μg/ml) group. At 3.2 μg/ml FA, the cell viabilities of the
mixed groups were similar to the single FA groups. However, at a
total FA concentration of 12.8 μg/ml, the mixed FA-treated cells
exhibited increased cell viabilities compared with PA or DHA
treatment alone and reduced cell viabilities compared with OA
treatment alone. However, the cell viability among the three mixed
FA groups was not observed to be significantly different.
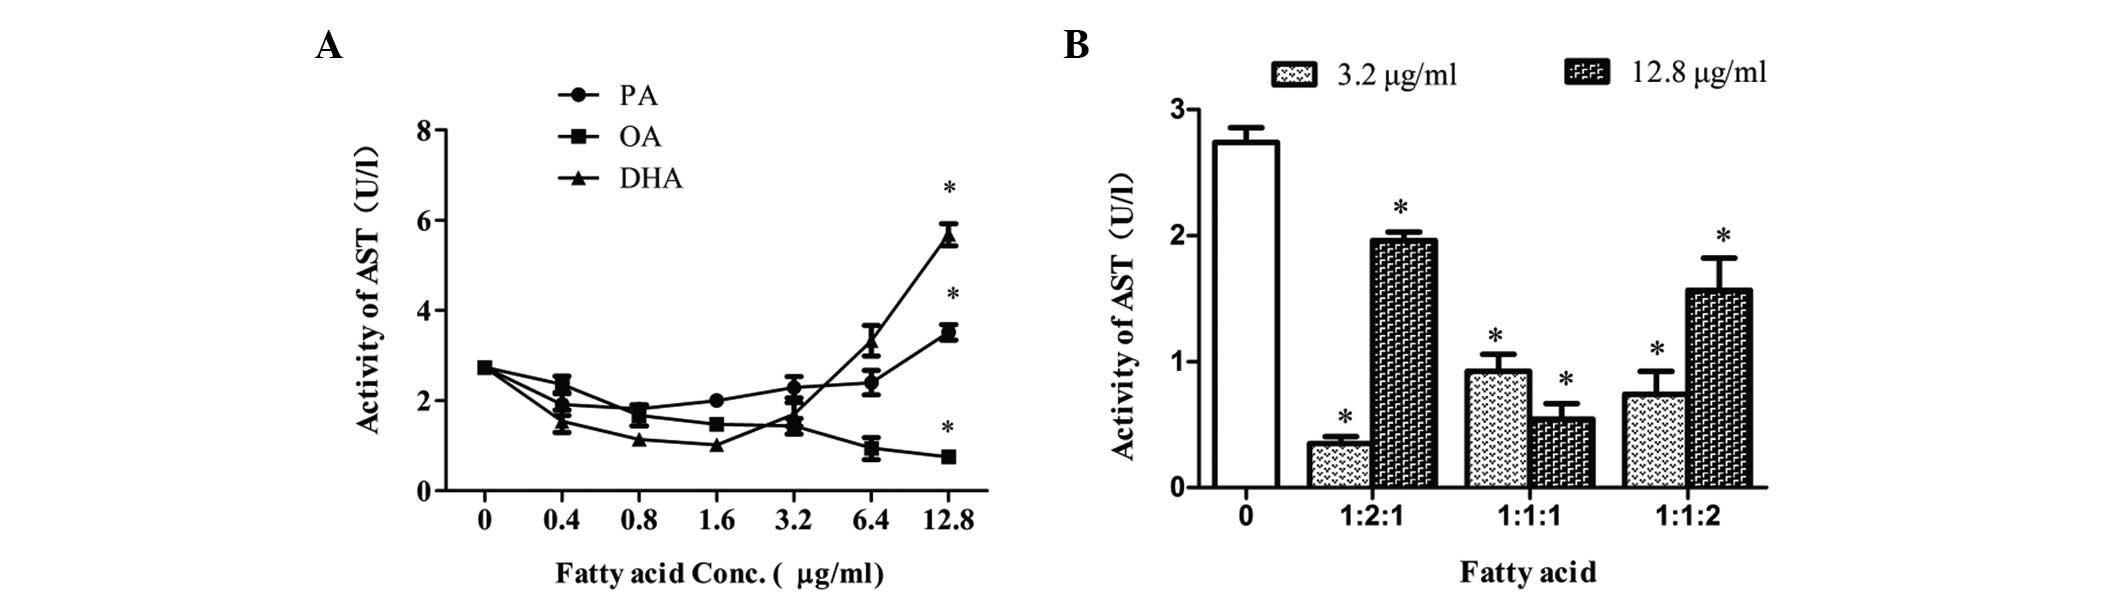
Effects of FAs on AST released from LO2
cells
The activity level of AST released from LO2 cells
following FA treatment was detected and the results are shown in
Fig. 2. OA, DHA and PA exhibited
different effects on AST activity (Fig. 2A). OA dose-dependently reduced the
levels of AST at increasing concentrations. DHA decreased the
activity of AST at concentrations <1.6 μg/ml and increased the
activity of AST with concentrations >1.6 μg/ml. The AST activity
remained constant with increasing PA concentrations until the PA
concentrations reached >6.4 μg/ml when the AST activity was
increased significantly (P<0.05). When the concentrations of
each FA were <6.4 μg/ml, the effects of PA and DHA on AST
activity were not identified as significantly different. At a
concentration of 12.8 μg/ml, PA and DHA significantly increased AST
activity (P<0.05), compared with that of the control group,
whilst OA significantly decreased AST activity (P<0.05).
For the three mixed FA groups, AST activity was
significantly reduced compared with that of the control group
(Fig. 2B; P<0.05). At a
concentration of 12.8 μg/ml, the AST activity levels of three
mixture groups were 1.96±0.07 (1:2:1), 0.54±0.12 (1:1:1) and
1.56±0.26 (1:1:2) U/l respectively, which were lower than those of
cells treated with PA (3.51±0.18) or DHA (5.68±0.25) alone. The AST
activity of the 1:2:1 and 1:1:2 groups were increased with the
increase in the mixture concentration; however, in the 1:1:1 group,
AST activity was greater at lower FA concentrations.
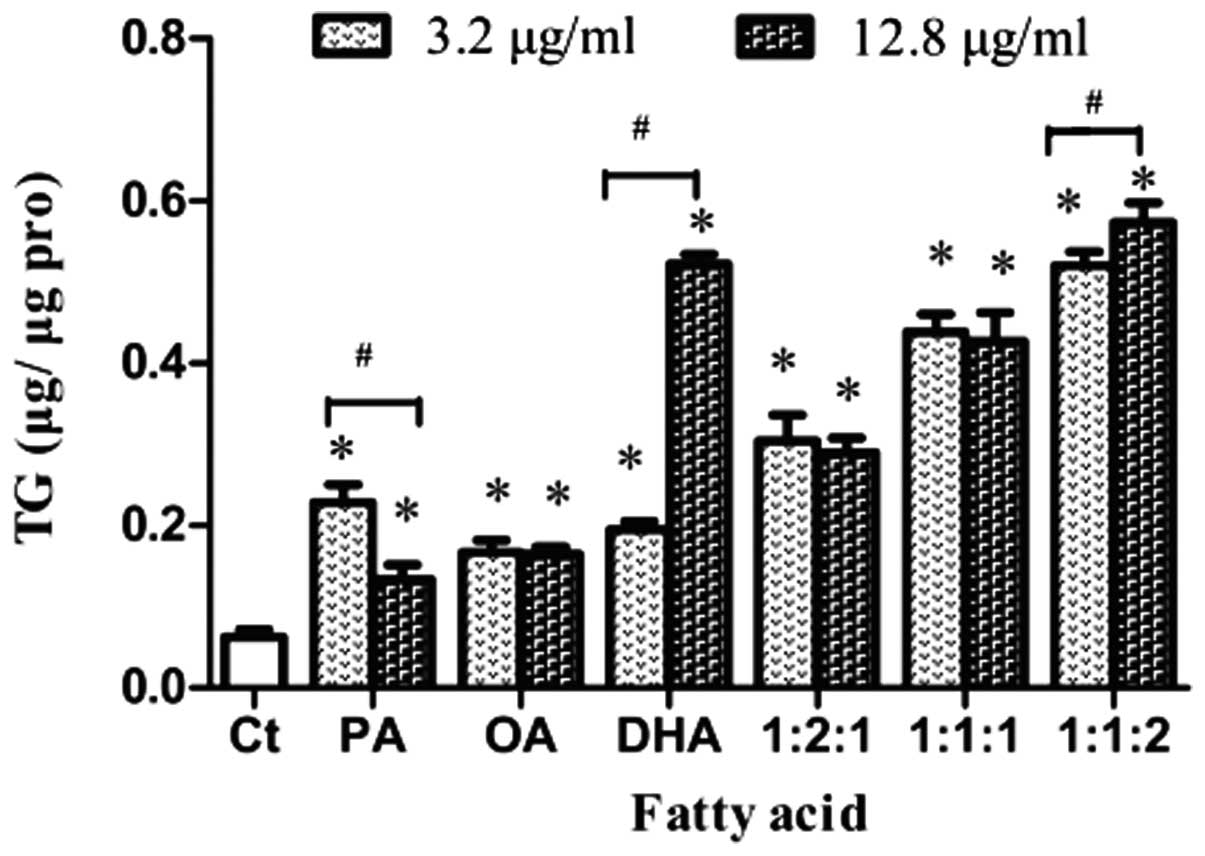
Effects of FAs on intracellular TG
The intracellular TG content in LO2 cells following
treatment with FAs at concentrations of 3.2 and 12.8 μg/ml (as
determined by the results of the cell viability and AST release
experiments) were detected and the results are shown in Fig. 3. The TG levels of treatment groups
were all significantly higher than those of the control group
(P<0.05), particularly in the three mixture groups. Notably, the
TG content following OA treatment was similar at concentrations of
3.2 and 12.8 μg/ml OA, as it was at the different FA concentrations
in the 1:2:1 and 1:1:1 mixture groups. The TG content following PA
treatment was significantly reduced at an increased concentration
(P<0.05); however, TG levels were significantly increased at the
higher concentration in the DHA group (P<0.05). In addition, the
intracellular TG levels in the 1:1:2 group were significantly
elevated at the increased FA concentration (P<0.05).
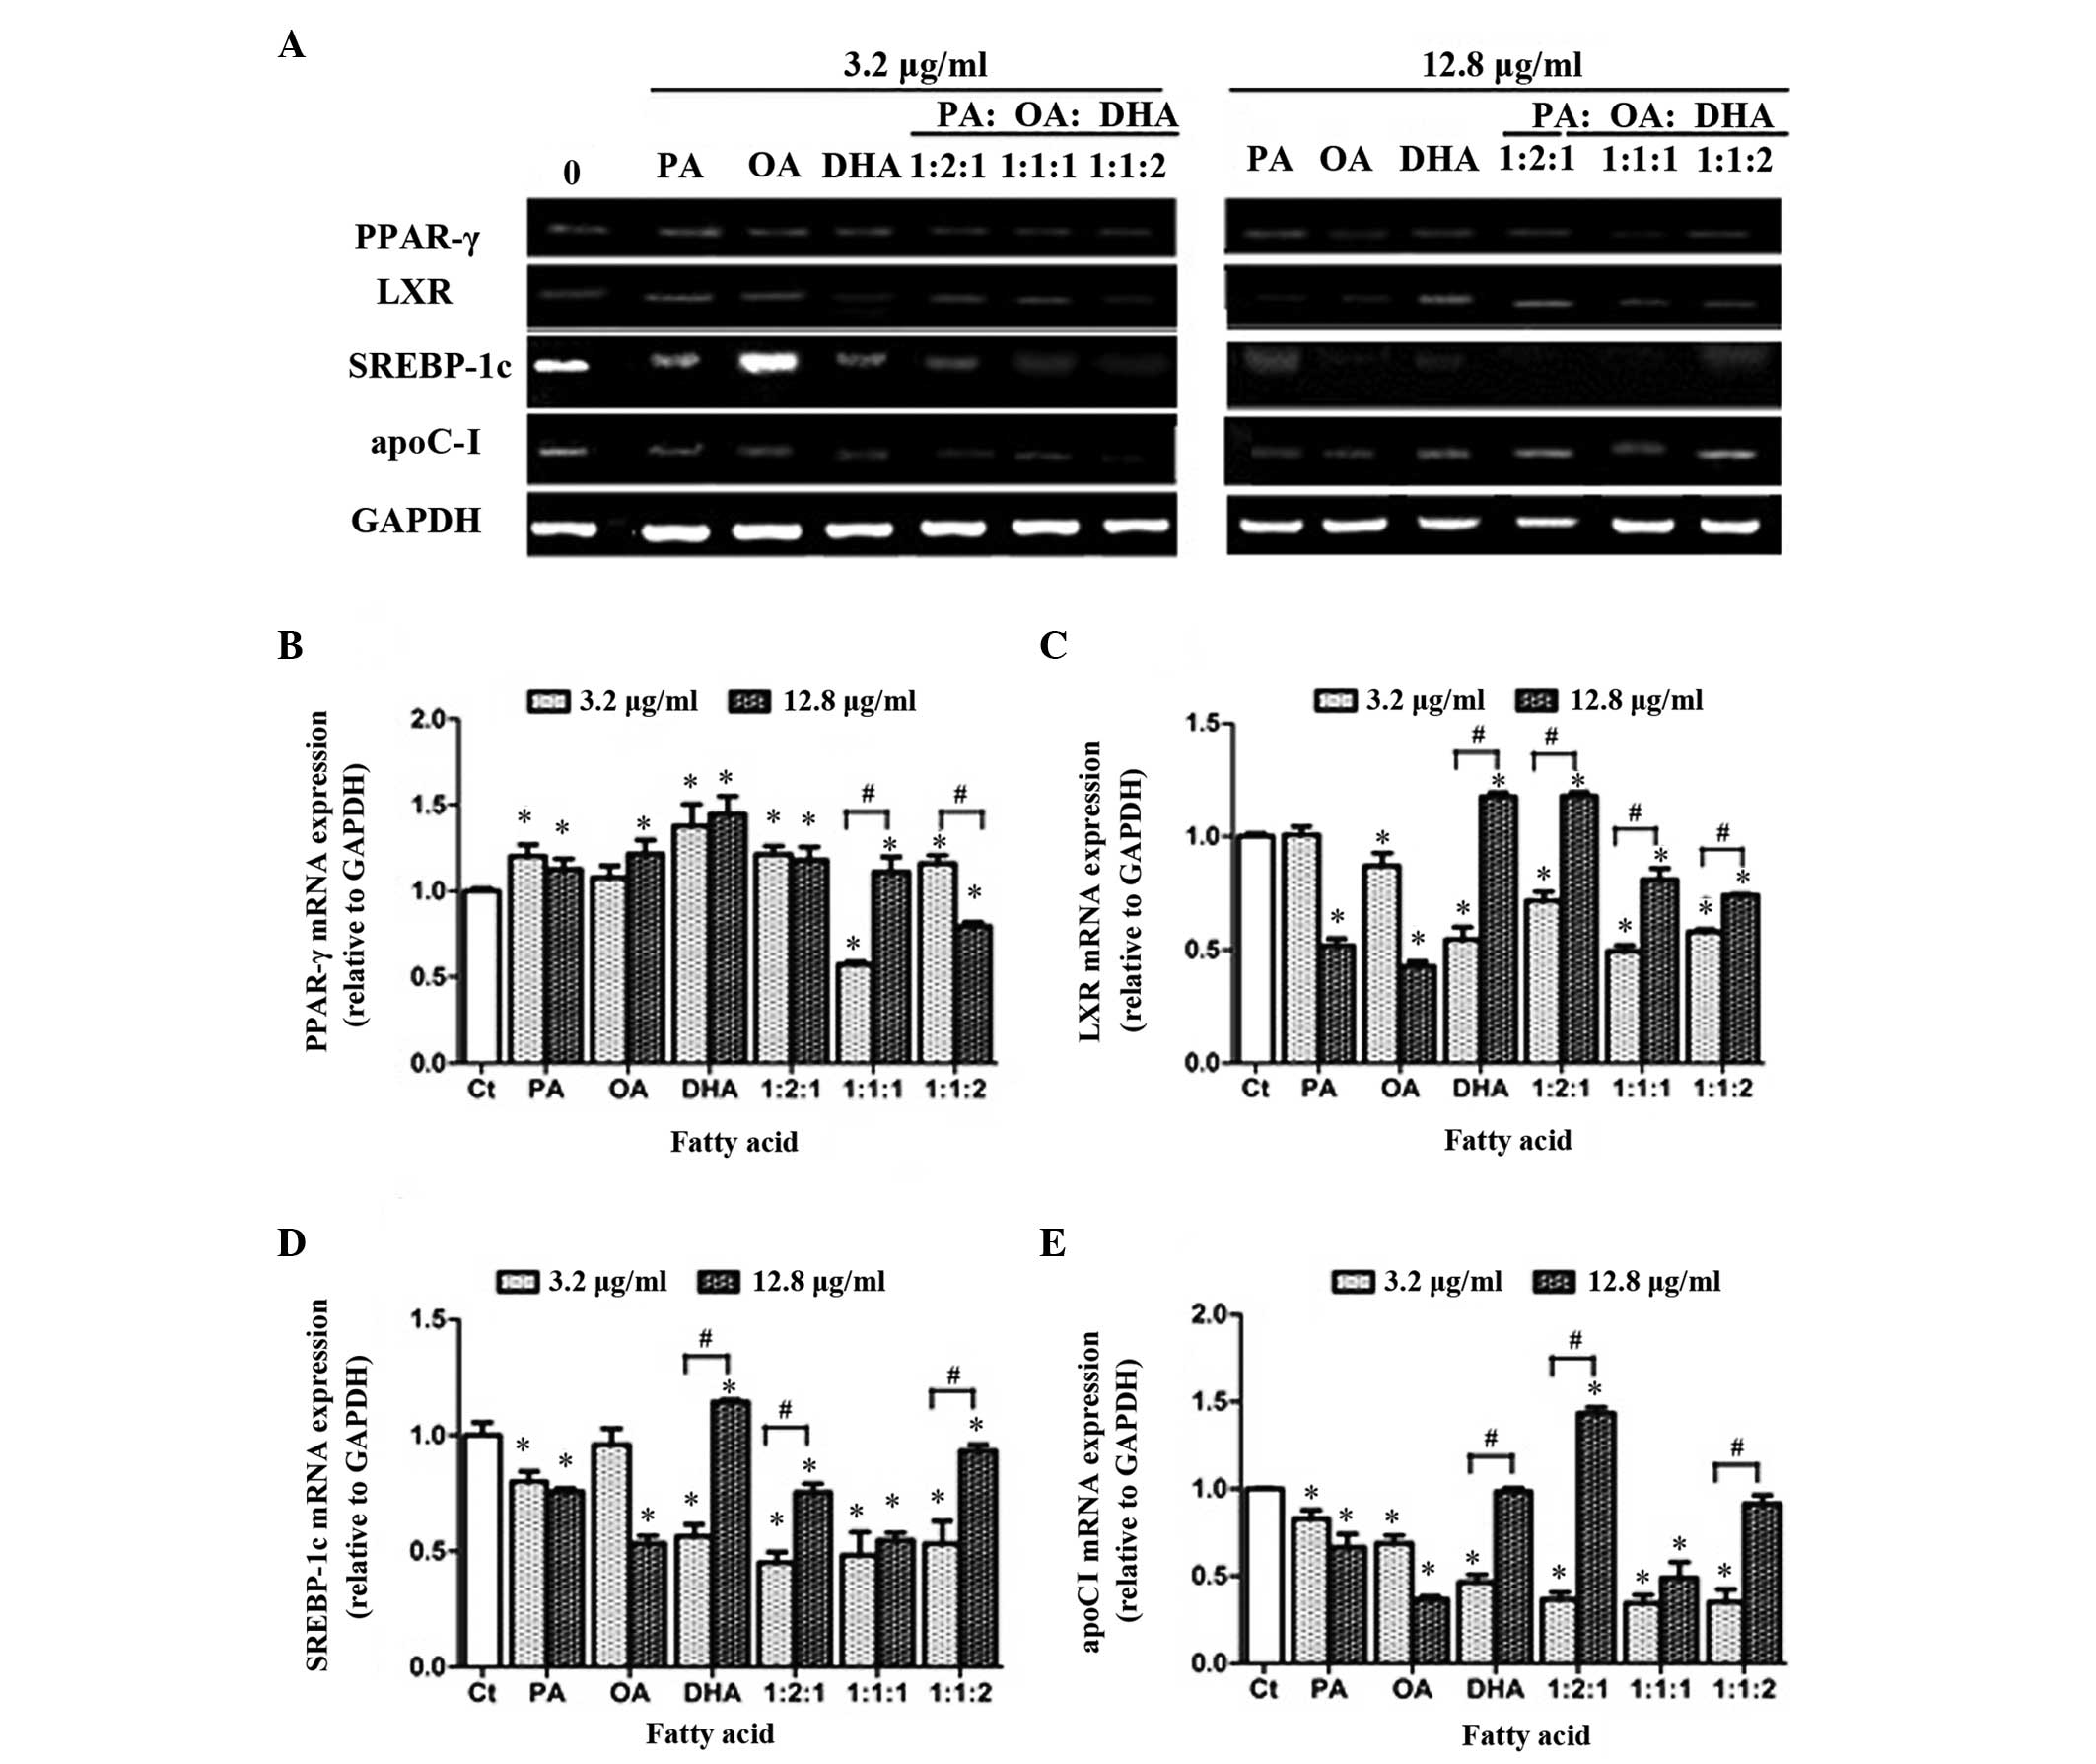
Effects of FAs on mRNA expression levels
of the PPAR-γ, LXRα, SREBP-1c and apoC-I genes
At concentrations of 0, 3.2 and 12.8 μg/ml, the
expression levels of the PPAR-γ, LXRα,
SREBP-1c and apoC-I genes in LO2 cells were examined
(Fig. 4). Treatment with single
PA, OA or DHA at 3.2 and 12.8 μg/ml concentrations significantly
increased the expression levels of PPAR-γ mRNA in LO2 cells
compared with those of the control group (Fig. 4A and B; P<0.05). The mixed FA
treatments exerted different effects on PPAR-γ expression
levels. For the 1:2:1 group, the PPAR-γ expression levels
were significantly increased to a similar degree at 3.2 and 12.8
μg/ml concentrations compared with the expression levels of the
control group (P<0.05). Notably, for the 1:1:1 group, the
PPAR-γ expression levels were significantly reduced at 3.2
μg/ml FA (P<0.05) and was significantly increased at 12.8 μg/ml
compared with the expression levels of the control group. However,
for the 1:1:2 group, the pattern of PPAR-γ expression was
reversed compared with that of the 1:1:1 group, with a decrease in
expression at the higher FA concentration.
At a concentration of 3.2 μg/ml, all groups, with
the exception of the PA group, exhibited a significant reduction in
LXRα expression levels compared with those of the control
group (Fig. 4C; P<0.05). For
the PA and OA groups, the LXRα expression levels were also
significantly reduced at the higher FA concentration, compared with
the control group (P<0.05). For the DHA-only and 1:2:1 mixture
groups, the LXRα expression levels after 12.8 μg/ml
treatment were significantly increased compared with those of the
control group (P<0.05). In addition, the 1:1:1 group exhibited a
significantly increased LXRα expression levels at the
increased FA concentration compared with the lower concentration
(P<0.05), although the two 1:1:1 mixed FA concentrations induced
significantly lower expression levels than those of the control
group (P<0.05). The LXRα expression levels in the 1:1:2
group were similar to those of the 1:1:1 group.
The expression levels of SREBP-1c in
the LO2 cells following FA treatment were significantly reduced
compared with those of the control group (P<0.05), with the
exception of SREBP-1c expression levels in the 12.8
μg/ml DHA group, which were significantly increased in comparison
with the control group (Fig. 4;
P<0.05). The changes in the SREBP-1c expression levels
between different FA concentrations in the DHA and 1:1:2 groups
were similar to the changes in LXRα expression levels at
different FA concentrations. However, in the PA group, the
SREBP-1c expression levels were similar at 3.2 and 12.8
μg/ml FA concentrations, as were those in the 1:1:1 group. At a
concentration of 3.2 μg/ml OA, the SREBP-1c expression
levels were not identified as significantly different from those of
the control group. The 1:2:1 group exhibited significantly
increased SREBP-1c expression levels at an increased
FA concentration, compared with the lower FA concentration
(P<0.05), although the two concentration of 1:2:1 mixed FAs
induced significantly lower SREBP-1c expression than
that of the control group (P<0.05).
The trend in apoC-I expression levels in
single and mixed FA groups was similar to that of LXRα
expression levels. However, compared with those of the control
group, the apoC-I expression levels in the PA group were
significantly reduced at 3.2 and 12.8 μg/ml (P<0.05). Notably,
the apoC-I expression levels in the DHA group were
significantly elevated at the higher DHA concentration compared
with the lower concentration (P<0.05), and the expression value
at a 12.8 μg/ml concentration was equal to that of the control
group. In the 1:1:1 group, no significant difference was identified
in apoC-I expression levels between FA treatments of 3.2 and
12.8 μg/ml.
Discussion
The results of the MTT assay and the AST activity in
the present study indicated that, within a certain concentration
range, the single saturated and unsaturated FAs, and the FA
mixtures at different ratios increased viability and protected the
integrity of LO2 cells. However, when the concentrations and/or the
ratios of the FAs changed, the biological effects were varied. High
doses of DHA and PA inhibited cell growth and impaired cell
function, while high doses of OA exerted the opposite effects. DHA
is an important biologically-active PUFA. Excess PUFA has been
reported to result in the generation of lipid peroxides and
potential cytotoxicity (20),
indicating the importance of controlling the total level of DHA. In
the mixed FA groups, the cell viabilities at 12.8 μg/ml were not
reduced and were lower than those of cells treated with 3.2 μg/ml
FAs, indicating that the higher the concentration of mixed FAs, the
greater the impairment of the hepatocytes. As a saturated FA, PA
effectively induces cell apoptosis compared with the
mono-unsaturated OA. When the PA:OA ratio is 1:2, OA attenuates the
apoptosis induced by PA (21).
Similarly, the results of the present study demonstrated that OA
ameliorated the inhibition of cell growth induced by high doses of
PA and DHA.
In the present study, the TG levels of LO2 cells in
the OA groups were higher than those of the control group, but were
lower than those of the DHA groups. The intracellular TG level was
elevated with the increased DHA level in the three mixed FA groups
at either concentration (3.2 or 12.8 μg/ml). In another study OA
was found to stimulate TG synthesis and secretion, whereas DHA was
observed to inhibit TG secretion (22). The effective conversion of OA into
TG is considered as a protective mechanism (3).
The PPAR-γ mRNA levels were evaluated by
RT-PCR. Although PPAR-γ normally expressed in the human and
murine liver represents only 10–30% of the level in adipose tissue,
obesity and over-nutrition have been shown to upregulate hepatic
PPAR-γ expression (10,20).
In the present study, the mRNA expression levels of PPAR-γ
in LO2 cells were increased following treatment with PA, OA or DHA
at all concentrations. The expression levels of PPAR-γ in
the livers of mice fed on a high-fat diet have also been reported
to be increased (23–25). The overactivation of PPAR-γ
may accelerate the synthesis of intracellular TG. However, the
underlying mechanism is not clear, although a circulating factor
has been suggested to stimulate hepatic PPAR-γ transcription
during increased energy availability. For the mixed FA groups, the
PPAR-γ expression levels were significantly reduced in the
3.2 μg/ml 1:1:1 and 12.8 μg/ml 1:1:2 groups. However, the
underlying mechanism for this effect requires further
investigation.
The gene encoding the nuclear receptor LXR has been
cloned, and LXRs have been demonstrated to regulate cellular
and systemic cholesterol homeostasis (26). Activation of PPAR-γ has been
shown to increase LXR expression levels (27). The human LXRa gene contains
the peroxisome proliferator response element (PPRE) (28). As PPAR agonists, FAs may increase
LXRa expression levels. Indeed, various saturated and
unsaturated FAs were demonstrated to increase LXRa
expression levels in rat hepatoma cells in vitro (29). However, in the present study, the
LXRa expression levels were reduced to approximately half
the level in the control group for several different FA treatment
groups. The LXRa expression levels were only significantly
increased in the 12.8 μg/ml DHA and 1:2:1 mixed FA groups. One
reason for this may be the 6-h FA treatment in LO2 cells. It has
been suggested that in the short-term, FAs are LXR antagonists,
whereas in the long-term, accumulation of FAs results in the
upregulation of LXRa gene expression (27).
SREBPs directly induced the expression of
>30 genes involved in the synthesis and the uptake of
cholesterol, FAs, TGs and phospholipids (30). Rodents fed PUFA-enriched diets
manifested reduced SREBP-1c mRNA expression levels and low
rates of lipogenesis in the liver (31). The results of the present study
also revealed that the expression levels of SREBP-1c mRNA in
LO2 cells were significantly reduced following administration of
FAs, with the exception of the 12.8 μg/ml DHA group, in which
SREBP-1c was marginally upregulated. The reason for
upregulated SREBP-1c following DHA treatment may have
been an excessive accumulation of intracellular TG. Recently, the
expression levels of transcription factors involved in lipid
metabolism have reported to be abnormal in the livers of obese
patients with nonalcoholic fatty liver disease. The level of
upregulation of SREBP-1c was similar with that of
PPAR-γ in the livers of obese patients compared with
controls (32). In addition, the
induction of PPAR-γ and SREBP-1 is associated with
the steatogenic property of FAs (21), suggesting that high doses of DHA
may be associated with the steatogenic property. Alternatively,
high DHA concentrations may alter cellular responses and induce a
compensatory increase in SREBP-1c expression levels.
The ApoE/CI gene cluster controls the region
containing the PPRE consensus sequence (the response element
of PPAR-γ) (14) and an
LXR response element (33).
LXR agonists stimulate the expression of apoC-I,
which also acts as a cholesterol acceptor (27). As an inhibitor of lipoprotein
lipase, overexpression of apoC-I is associated with
hypertriglyceridemia (34) and
prevents the development of insulin resistance (13). In the present study, apoC-I
mRNA expression levels showed a similar pattern to LXRa mRNA
expression levels, suggesting that the regulation of apoC-I
may be LXRα-dependent in LO2 cells.
There are several limitations in the present study.
Although PA, OA and DHA represented saturated, mono-unsaturated and
polyunsaturated FAs, respectively, these are merely a subsection of
dietary FAs. Furthermore, only one cell line was analyzed, and the
only associations investigated were those between FAs and the
expression levels of hepatic genes involved in lipid
metabolism.
In conclusion, the results of the present study
indicated that the type, concentration and mixture ratio of FAs are
important in the regulation of cell function and expression levels
of genes involved in lipid metabolism in LO2 hepatocytes and
therefore provide a basis for understanding FA function in the
liver.
Acknowledgements
The authors would like to thank all members of
Professor CH. Wang’s laboratory (belonging to the Department of
Toxicology, School of Public Health, Wuhan University, Hubei,
China) for assistance and suggestions. This study was supported by
the Fundamental Research Funds for the Central Universities and the
National Natural Science Foundation of China (grant no.
81172628).
Abbreviations:
|
FAs
|
fatty acids
|
|
SFA
|
saturated fatty acid
|
|
MUFA
|
monounsaturated fatty acid
|
|
PUFA
|
polyunsaturated fatty acid
|
|
PA
|
palmitic acid
|
|
OA
|
oleic acid
|
|
DHA
|
docosahaexenoic acid
|
|
AST
|
aspartate transaminase
|
|
TG
|
triglyceride
|
|
PPAR-γ
|
peroxisome proliferator-activated
receptor γ
|
|
LXRα
|
liver X receptors
|
|
SREBP-1c
|
sterol regulatory element binding
protein 1c
|
|
apoC-I
|
apolipoprotein C-I
|
References
|
1
|
Dietschy JM: Dietary fatty acids and the
regulation of plasma low density lipoprotein cholesterol
concentrations. J Nutr. 128:444S–448S. 1998.PubMed/NCBI
|
|
2
|
Videla LA, Rodrigo R, Araya J and
Poniachik J: Insulin resistance and oxidative stress
interdependency in non-alcoholic fatty liver disease. Trends Mol
Med. 12:555–558. 2006. View Article : Google Scholar : PubMed/NCBI
|
|
3
|
Aronis A, Madar Z and Tirosh O: Mechanism
underlying oxidative stress-mediated lipotoxicity: exposure of
J774.2 macrophages to triacylglycerols facilitates mitochondrial
reactive oxygen species production and cellular necrosis. Free
Radic Biol Med. 38:1221–1230. 2005. View Article : Google Scholar
|
|
4
|
McGarry JD: Banting lecture 2001:
dysregulation of fatty acid metabolism in the etiology of type 2
diabetes. Diabetes. 51:7–18. 2002. View Article : Google Scholar : PubMed/NCBI
|
|
5
|
Zhang Y, Li R, Li Y, Chen W, Zhao S and
Chen G: Vitamin A status affects obesity development and hepatic
expression of key genes for fuel metabolism in Zucker fatty rats.
Biochem Cell Biol. 90:548–557. 2012. View Article : Google Scholar : PubMed/NCBI
|
|
6
|
Chawla A, Repa JJ, Evans RM and
Mangelsdorf DJ: Nuclear receptors and lipid physiology: opening the
X-files. Science. 294:1866–1870. 2001. View Article : Google Scholar : PubMed/NCBI
|
|
7
|
Clarke SD: The multi-dimensional
regulation of gene expression by fatty acids: polyunsaturated fats
as nutrient sensors. Curr Opin Lipidol. 15:13–18. 2004. View Article : Google Scholar : PubMed/NCBI
|
|
8
|
Jump DB, Botolin D, Wang Y, Xu J,
Christian B and Demeure O: Fatty acid regulation of hepatic gene
transcription. J Nutr. 135:2503–2506. 2005.PubMed/NCBI
|
|
9
|
Jump DB: N-3 polyunsaturated fatty acid
regulation of hepatic gene transcription. Curr Opin Lipidol.
19:242–247. 2008. View Article : Google Scholar : PubMed/NCBI
|
|
10
|
Boelsterli UA and Bedoucha M:
Toxicological consequences of altered peroxisome
proliferator-activated receptor gamma (PPARgamma) expression in the
liver: insights from models of obesity and type 2 diabetes. Biochem
Pharmacol. 63:1–10. 2002. View Article : Google Scholar
|
|
11
|
Schultz JR, Tu H, Luk A, et al: Role of
LXRs in control of lipogenesis. Genes Dev. 14:2831–2838. 2000.
View Article : Google Scholar : PubMed/NCBI
|
|
12
|
Repa JJ, Turley SD, Lobaccaro JA, et al:
Regulation of absorption and ABC1-mediated efflux of cholesterol by
RXR heterodimers. Science. 289:1524–1529. 2000. View Article : Google Scholar : PubMed/NCBI
|
|
13
|
Jong MC, Voshol PJ, Muurling M, et al:
Protection from obesity and insulin resistance in mice
overexpressing human apolipoprotein C1. Diabetes. 50:2779–2785.
2001. View Article : Google Scholar : PubMed/NCBI
|
|
14
|
Galetto R, Albajar M, Polanco JI, Zakin MM
and Rodriguez-Rey JC: Identification of a
peroxisome-proliferator-activated-receptor response element in the
apolipoprotein E gene control region. Biochem J. 357:521–527. 2001.
View Article : Google Scholar : PubMed/NCBI
|
|
15
|
Clarke SD and Jump DB: Dietary
polyunsaturated fatty acid regulation of gene transcription. Annual
review of nutr. 14:83–98. 1994. View Article : Google Scholar : PubMed/NCBI
|
|
16
|
Jump DB, Thelen A and Mater M: Dietary
polyunsaturated fatty acids and hepatic gene expression. Lipids.
34:S209–S212. 1999. View Article : Google Scholar : PubMed/NCBI
|
|
17
|
Sampath H and Ntambi JM: Regulation of
gene expression by polyunsaturated fatty acids. Heart Metab.
32:32–35. 2006.
|
|
18
|
Pan XF, Wen CX and Xu JH: Comparison of
two cell lines for cell model of hepatocytic steatosis in vitro.
Journal of Guangdong Pharmaceutical College. 1:0422010.
|
|
19
|
Yang X, Zhang Y, Lin J, et al: A lower
proportion of dietary saturated/monounsaturated/polyunsaturated
fatty acids reduces the expression of adiponectin in rats fed a
high-fat diet. Nutr Res. 32:285–291. 2012. View Article : Google Scholar
|
|
20
|
Di Nunzio M, Valli V and Bordoni A: Pro-
and anti-oxidant effects of polyunsaturated fatty acid
supplementation in HepG2 cells. Prostaglandins, Leukot Essent Fatty
Acids. 85:121–127. 2011.PubMed/NCBI
|
|
21
|
Ricchi M, Odoardi MR, Carulli L, et al:
Differential effect of oleic and palmitic acid on lipid
accumulation and apoptosis in cultured hepatocytes. J Gastroenterol
Hepatol. 24:830–840. 2009. View Article : Google Scholar : PubMed/NCBI
|
|
22
|
Wong SH, Fisher EA and Marsh JB: Effects
of eicosapentaenoic and docosahexaenoic acids on apoprotein B mRNA
and secretion of very low density lipoprotein in HepG2 cells.
Arteriosclerosis. 9:836–841. 1989. View Article : Google Scholar : PubMed/NCBI
|
|
23
|
Vidal-Puig A, Jimenez-Liñan M, Lowell BB,
et al: Regulation of PPAR gamma gene expression by nutrition and
obesity in rodents. J Clin Invest. 97:2553–2561. 1996. View Article : Google Scholar : PubMed/NCBI
|
|
24
|
Knight BL, Hebbachi A, Hauton D, et al: A
role for PPARalpha in the control of SREBP activity and lipid
synthesis in the liver. Biochem J. 389:413–421. 2005. View Article : Google Scholar : PubMed/NCBI
|
|
25
|
Patel DD, Knight BL, Wiggins D, Humphreys
SM and Gibbons GF: Disturbances in the normal regulation of
SREBP-sensitive genes in PPAR alpha-deficient mice. J Lipid Res.
42:328–337. 2001.PubMed/NCBI
|
|
26
|
Bensinger SJ and Tontonoz P: Integration
of metabolism and inflammation by lipid-activated nuclear
receptors. Nature. 454:470–477. 2008. View Article : Google Scholar : PubMed/NCBI
|
|
27
|
Wójcicka G, Jamroz-Wiśniewska A,
Horoszewicz K and Bełtowski J: Liver X receptors (LXRs). Part I:
structure, function, regulation of activity, and role in lipid
metabolism. Postepy Hig Med Dosw (Online). 61:736–759.
2007.PubMed/NCBI
|
|
28
|
Laffitte BA, Joseph SB, Walczak R, et al:
Autoregulation of the human liver X receptor alpha promoter. Mol
Cell Biol. 21:7558–7568. 2001. View Article : Google Scholar : PubMed/NCBI
|
|
29
|
Tobin KA, Steineger HH, Alberti S, et al:
Cross-talk between fatty acid and cholesterol metabolism mediated
by liver X receptor-alpha. Mol Endocrinol. 14:741–752.
2000.PubMed/NCBI
|
|
30
|
Horton JD, Goldstein JL and Brown MS:
SREBPs: activators of the complete program of cholesterol and fatty
acid synthesis in the liver. J Clin Invest. 109:1125–1131. 2002.
View Article : Google Scholar : PubMed/NCBI
|
|
31
|
Xu J, Nakamura MT, Cho HP and Clarke SD:
Sterol regulatory element binding protein-1 expression is
suppressed by dietary polyunsaturated fatty acids. A mechanism for
the coordinate suppression of lipogenic genes by polyunsaturated
fats. J Biol Chem. 274:23577–23583. 1999. View Article : Google Scholar
|
|
32
|
Pettinelli P and Videla LA: Up-regulation
of PPAR-gamma mRNA expression in the liver of obese patients: an
additional reinforcing lipogenic mechanism to SREBP-1c induction. J
Clin Endocrinol Metab. 96:1424–1430. 2011. View Article : Google Scholar
|
|
33
|
Mak PA, Laffitte BA, Desrumaux C, et al:
Regulated expression of the apolipoprotein E/C-I/C-IV/C-II gene
cluster in murine and human macrophages. A critical role for
nuclear liver X receptors alpha and beta. J Biol Chem.
277:31900–31908. 2002. View Article : Google Scholar : PubMed/NCBI
|
|
34
|
Berbée JF, van der Hoogt CC, Sundararaman
D, Havekes LM and Rensen PC: Severe hypertriglyceridemia in human
APOC1 transgenic mice is caused by apoC-I-induced inhibition of
LPL. J Lipid Res. 46:297–306. 2005.PubMed/NCBI
|