Introduction
Lung cancer remains the leading cause of
cancer-associated mortality in the world. The majority of patients
are initially diagnosed with advanced disease, or develop
recurrence, neither of which is amenable to curative approaches
(1). Previous studies have
demonstrated that gefitinib is a promising therapeutic agent for
the treatment of a wide range of tumors, including non-small-cell
lung cancer (NSCLC). Gefitinib inhibits the autophosphorylation of
epidermal growth factor (EGF)-stimulated EGF receptor (EGFR), in
various EGFR-expressing human cancer cell lines (2). Activation of EGFR leads to receptor
associated tyrosine kinase (TK) activity, that initiates a cascade
of events leading to downstream signaling and numerous changes
characteristic of malignant progression. This results in the
enhancement of cellular growth and invasive capacity. Preclinical
data has indicated that gefitinib competes with adenosine
triphosphate for delivery of phosphate groups to critical tyrosine
residues, and this may prevent signal transduction through EGFR
(3). Four phase I studies have
shown that gefitinib is generally well tolerated, with evidence of
antitumor activity in NSCLC, and two large phase II gefitinib
monotherapy studies, in patients with pretreated advanced NSCLC,
have further confirmed that gefitinib is generally well tolerated
and has clinically significant antitumor activity (4,5).
Therapeutic responses to EGFR-TK inhibitors may persist for as long
as 2–3 years; however, drug resistance eventually emerges and this
limits the mean duration of response to 6–8 months (6,7).
Micro (mi)RNAs have been reported to participate in
lung cancer oncogenesis (8,9).
MiRNAs are small, endogenous, non-coding RNAs, which are highly
conserved and have been identified as a powerful tool for
regulating gene expression through the RNA interference pathway
(10,11). With the ability of one miRNA to
bind and regulate numerous mRNAs, and the potential for a single
mRNA to be targeted by numerous miRNAs, it is possible to fine-tune
the expression of proteins within the cell in a very precise manner
(12). Recent advances in
bioinformatics and high-throughput technologies, such as microarray
analysis, are increasing the understanding of the molecular
mechanisms underlying drug sensitivity and biological processes
(13). In the present study,
gefitinib resistant sub-clone A549 cells were established, and
miRNA expression microarray analyses and functional studies were
performed, to determine the molecular mechanisms of the
chemoresistance of NSCLC.
Materials and methods
Cell culture
The A549 human lung cancer cell line was purchased
from American Type Culture Collection (Manassas, VA, USA). The
cells were cultured in RPMI-1640 (Life Technologies, Grand Island,
NY, USA), supplemented with 10% fetal bovine serum (FBS; Life
Technologies) and 1% penicillin/streptomycin (Life Technologies) at
37°C in 5% CO2. The cells were grown as monolayers in 75
cm2 cell culture flasks, unless otherwise stated. All of
the cell lines tested negative for mycoplasma contamination, using
polymerase chain reaction (PCR) methods (14), and were authenticated using Short
Tandem Repeats testing. Gefitinib was purchased from AstraZeneca
(Macclesfield, UK). The primary antibody used for the western blot
analysis was a rabbit monoclonal anti-EGFR antibody (Abcam,
Cambridge, MA, USA).
Establishment of gefitinib-resistant
sub-clones from parent (control) cell lines
To develop gefitinib-resistance, the A549 cells were
continually exposed to stepwise increases in the concentration of
gefitinib over a period of 16–24 months. Briefly, the cells were
seeded at a density of ~5×10⁵/ml, in a T75 cell culture
flask with 10 ml complete growth medium. Following a 4–6 h of
incubation, relatively low concentrations of gefitinib, starting at
0.01 μg/ml, were dissolved in phosphate-buffered saline (PBS),
without Ca2+ and Mg2+, and added to the
medium. The cells remained in the gefitinib-supplemented media for
2–4 weeks, or until a stable cell re-population had formed. Regular
medium replenishment was performed throughout this period. The
gefitinib concentration was then increased by 0.5 to 2 fold. The
stepwise dose escalation continued for 16–24 months, until the
gefitinib concentration had reached ≥10 × the starting
concentration. Thereafter, gefitinib-resistant cell lines were
maintained in their highest achieved gefitinib concentration.
Concurrently, regular passage of the parent cells was
conducted.
Gefitinib sensitivity test
Prior to the gefitinib resistance/sensitivity
assessment (cytotoxicity assay), a cell proliferation assay was
carried out using the xCELLigence system (Roche Diagnostics, South
San Francisco, CA USA). The cell proliferation assay was performed
to identify the optimal conditions under which the real-time
cytotoxicity assay should be conducted. The proliferation assay was
used to identify the optimal seeding density for the cytotoxicity
assay for each of the cell lines, and to determine the duration of
the cytotoxicity assay.
The proliferation assay was carried out by seeding
various densities of cells into a 96-well plate (E-plate 96; Roche)
in quadruplicate, followed by real time monitoring of cellular
growth for up to seven days. After 24 h half of the wells on the
plate were treated with gefitinib, in order to determine the
cellular response. The proliferation assay was repeated twice on
each cell line. Optimal seeding densities for each line were
selected based on the marked changes in proliferation observed
72–96 h following gefitinib treatment, and small variations across
the replicate wells.
For the cytotoxicity assays, a cell count was
initially performed, the cells were then seeded in triplicate wells
with 180 μl gefitinib-free cell culture medium, in a 96-well plate.
After 24 h, 20 μl cell culture medium, containing serially diluted
gefitinib ranging from 0–800 μg/ml, was added to each well. The
number of viable cells was monitored every 15 min, for a total of
≥120 h. Half maximal inhibitory concentration (IC50)
values of the gefitinib-resistant and parent (control) cells were
subsequently calculated using the integrated software of the
xCELLigence system.
Morphologic analysis
The cells were grown in a chamber slide (Nalge Nunc
International, Naperville, IL, USA) and stained with hematoxylin
& eosin. The cells were visualized using a Nikon light
microscope (Nikon, Inc., Melville, NY, USA) with digital
photographic capability.
MiRNA expression profiling
A microarray was performed using a
μParaflo® Microfluidics Biochip (LC Sciences, Houston,
TX, USA). The microarray probe sequence was derived from Sanger
MiBase version 15.0 (http://microrna.sanger.org). Each chip contained
multiple quality control probes and used a dual-color chip to
examine miRNA expression profiling in the gefitinib-resistant and
parent A549 cells. The probes were synthesized using a
photosensitive PCR. The sequence consisted of two fragments: A
chemically modified oligonucleotide encoding a fragment
complementary to the target miRNA or target RNA, and an extension
arm at a certain distance from the connected encoding sequence,
which lessened the hybridization spatial impairment. The melting
temperature of the probe hybridization was balanced by chemical
modification. Total RNA was extracted with TRIzol (Life
Technologies) according to the manufacturer’s instructions, and the
RNA intergrity number was determined by Bioanalyzer (Agilent, Santa
Clara, CA, USA). RNA samples (5 μg) were filtered through a YM-100
micro centrifuge column (EMD Millipore, Billerica, MA, USA) to
produce small RNA (<300 nt). Poly (A) polymerase was used to add
a poly(A) tail to the 3′ end of small RNA, and an oligonucleotide
marker was used for further fluorescent labelling. Two types of
marker were used to label the matched RNA samples. The
hybridization was completed on the μParaflo®
Microfluidics Biochip using a micro circulation pump (Atactic
Technologies Inc., Houston, TX, USA). The hybridization mix
contained 100 μl 6× SSPE buffer (0.90 M NaCl, 60 mM
Na2HPO4, 6 mM EDTA, pH 6.8) with 25%
formaldehyde, at a temperature of 34°C. The Cy3 and Cy5 specific
fluorescent labels and the Axon GenePix® 4000B
microarray scanner (Molecular Devices, Sunnyvale, CA, USA) were
used to capture the hybridization images. ArrayPro (Media
Cybernetics, Inc., Rockville, MD, USA) was used to complete the
digital transformation.
Quantitative PCR (qPCR) validation for
miRNA expression profiling
A qPCR was performed to validate the differential
miRNA expression profiles obtained from the microarray analysis.
Total RNA was extracted with TRIzol (Life Technologies) according
to the manufacturer’s instructions, and the RNA intergrity number
was determined by Bioanalyzer (Agilent, Santa Clara, CA, USA).
Total RNA was reverse-transcribed into cDNA using AMV Reverse
Transcriptase (RT), RNase (Epicentre, Madison, WI, USA), dNTP
(HyTest Ltd, Turku, Finland), RT buffer, and RT primers (Invitrogen
Life Technologies, Carlsbad, CA, USA). The mixture was incubated at
16°C for 30 min, 42°C for 40 min, and 85°C for 5 min to generate a
library of miRNA cDNAs. U6 was used as the internal control for
normalization. The qPCR was subsequently performed using an ABI
PRISM® 7900 system (Applied Biosystems Life
Technologies, Foster City, CA, USA), according to a standardized
protocol. The qPCR was performed at 95°C for 10 min, followed by 40
cycles of 10 sec at 95°C and an interval of 1 min at 60°C.
MiRNA-7 transfection
The cells were plated in 6-well plates in phenol
red-free RPMI-1640 media, supplemented with 10% dextran-coated
charcoal FBS (Life Technologies). Transient transfections were
performed with 10 nM miR-7 (has-miR-7;
5′-UGGAAGACUAGUGAUUUUGUUGU-3′) using G-fectin (Genolution
Pharmaceutical, Seoul, Korea). A scrambled RNA sequence (5′-AAC AGT
CGC GTT TGC GAC TGG-3′; Genolution Pharmaceutical) was used as a
negative control. The culture medium was exchanged with miR-7 three
days post-transfection. The expression levels of miR-7 were
evaluated using qPCR, as described above, on the fifth day
following the initial transfection. The primer sequences used for
the qPCR were as follows: Forward, 5′-GGGCCCGCTCTAGACT
CGAGATATTTGCATGTCGCTATGTG-3′ and reverse,
5′-CGCGGCCGCCTAATGGATCCAAAAAAGGCACAGT CGAGGCTGATC-3′.
Bioinformatics analysis of miRNA
expression data
TargetScan (http://www.targetscan.org/), Microcosm Targets
(http://www.ebi.ac.uk/enright-srv/microcosm/htdocs/targets/v5/)
and microRNA.org (http://www.microrna.org/microrna/home.do) were used to
compute miRNA target predictions. Almost all known miRNA binding
site are located in the 3′ untranslated region of target mRNA, and
the target databases contained mRNA conserved binding sites of
miRNA.
Western blotting
The cells were lysed in radioimmunoprecipitation
assay buffer (150 mM NaCl, 1% NP-40, 50 mM Tris-HCl pH 7.4, 1 mM
phenylmethylsulfonyl fluoride, 1 μg/ml leupeptin, 1 mM deoxycholic
acid and 1 mM EDTA) containing a cocktail of protease and
phosphatase inhibitors (Merck Millipore, Darmstadt, Germany). The
cells were then centrifuged and lysed in lysis buffer containing 20
mM Tris-HCl (pH 7.4), 150 mM NaCl, 1 mM EDTA, 1 mM EGTA, 5 mM NaF,
1≈mM orthovanadate, 10% (vol/vol) glycerol, 1% Triton X-100, 0.5%
Nonidet P-40, 1 mM phenylmethylsulfonyl fluoride, 2 μg/ml
leupeptin, and 10 μg/ml aprotinin (Life Technologies). The samples
were cleared by centrifugation at 13,500 × g at 4°C for 10 min, and
protein concentrations were determined using a Bio-Rad protein
assay (Bio-Rad Laboratories, Inc., Hercules, CA, USA). Equal
amounts of protein samples (30–50 μg) were separated by 12%
SDS-PAGE and transferred to polyvinylidene fluoride membranes (EMD
Millipore), using the Bio-Rad semi-dry transfer system (Bio-Rad
Laboratories, Inc.).
Statistical analysis
To determine significance between the groups, paired
or unpaired t-tests were performed, depending on the experimental
specifications. Normality assumptions were assessed by
Shapiro-Wilks tests. When the normality assumption could not be
held, paired or unpaired Wilcoxon rank-sum tests were performed.
All of the analyses were conducted using SAS version 9.2 (SAS
Institute Inc., Cary, NC, USA) or SPSS version 13.0 (SPSS Inc.,
Chicago, IL, USA). A value of P<0.05 was considered to indicate
a statistically significant difference.
Results
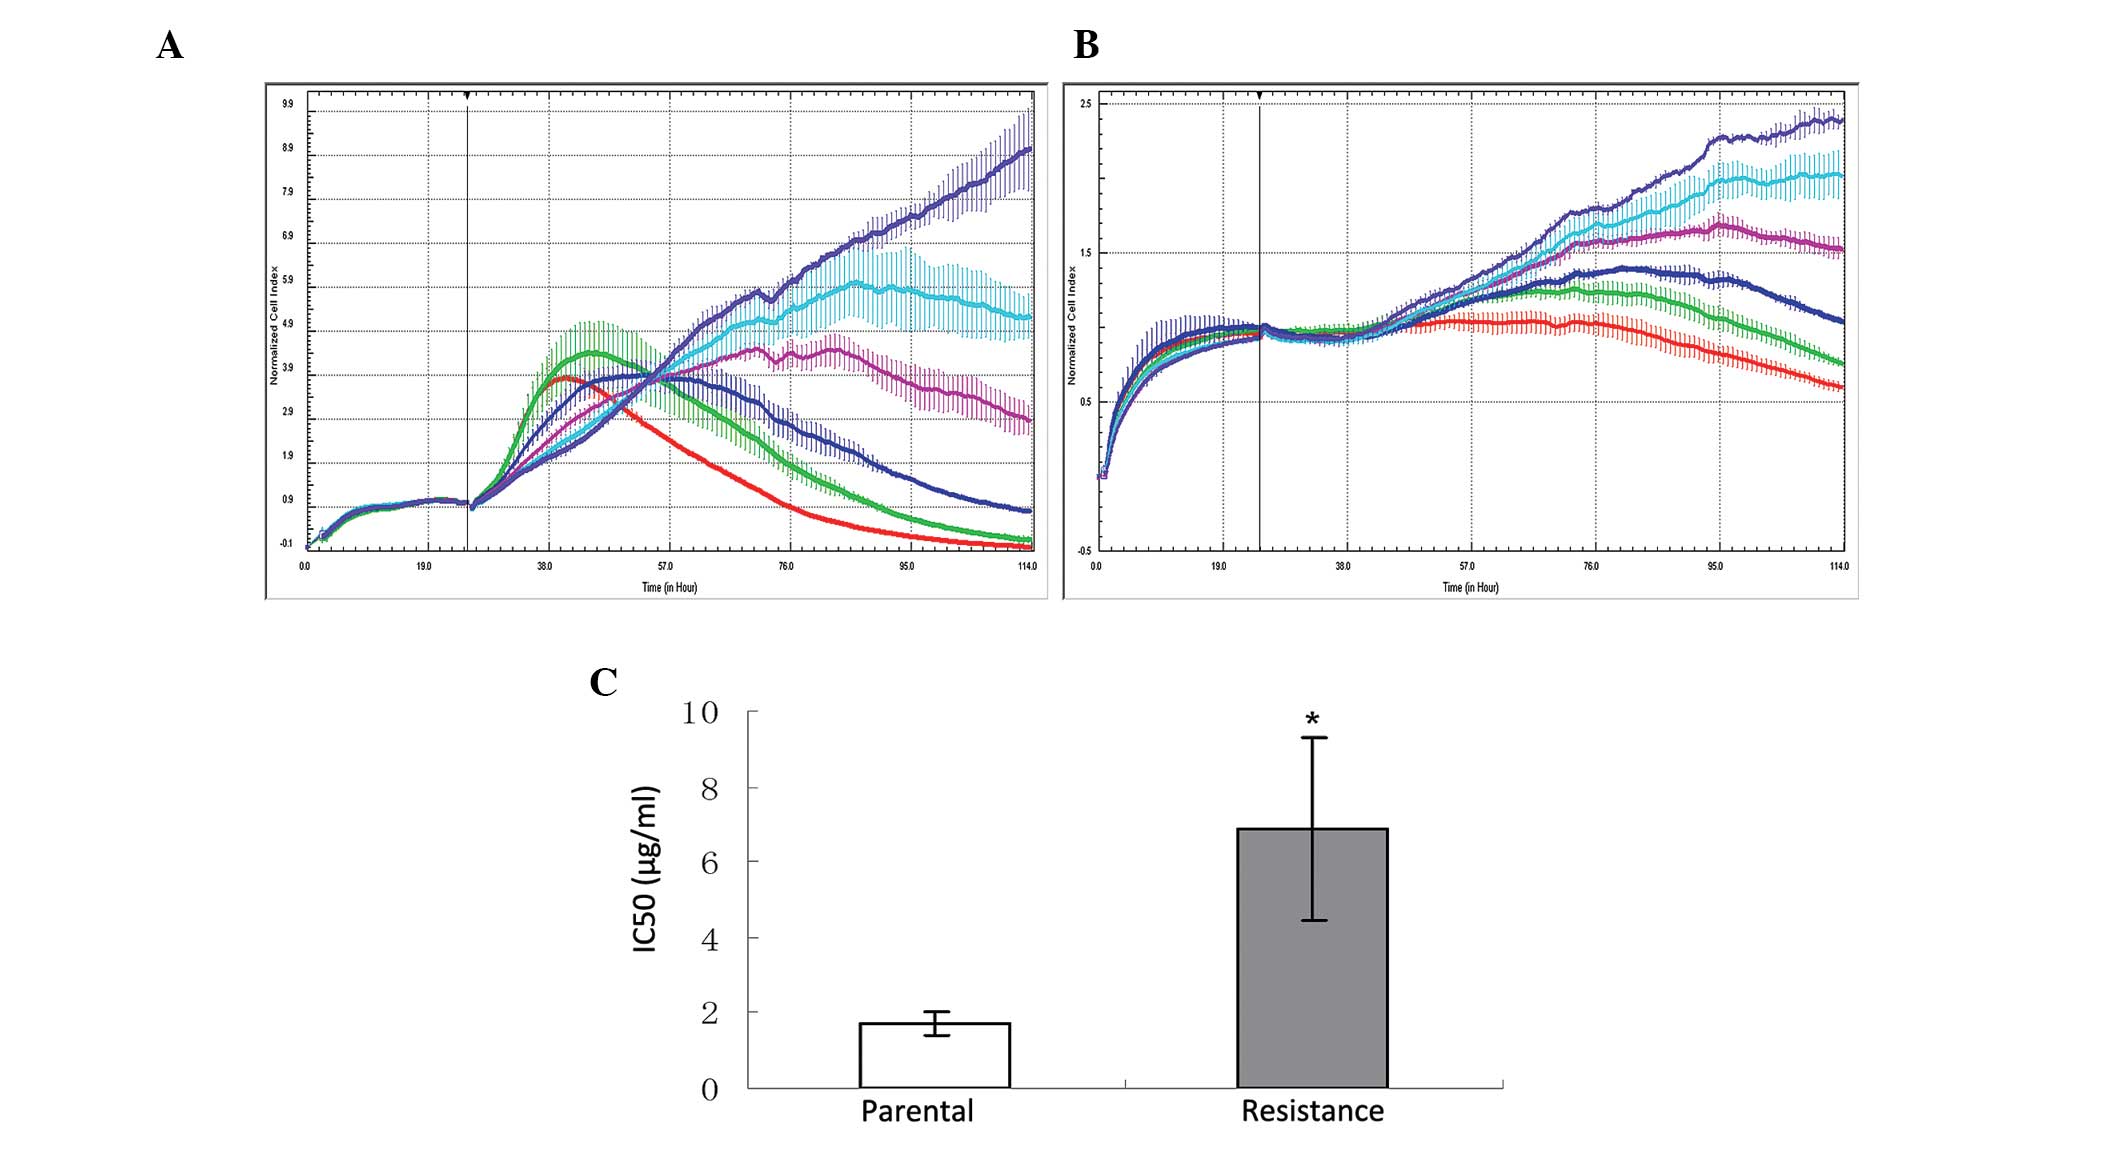
Gefitinib-resistant cell lines,
maintained on gefitinib, stably exhibited higher IC50
values
Gefitinib-resistant subclones had 3-fold greater
IC50 values, as compared with their parent counterparts
(Fig. 1), as determined by
cytotoxicity assays. To determine the stability of gefitinib
resistance in the gefitinib-resistant sub-clones, the
IC50 values were compared between the normally
maintained gefitinib-resistant sub-clones and the resistant
sub-clones which were subsequently cultured in gefitinib-free
medium for three weeks. Following the three weeks of gefitinib-free
culturing, there were no statistically significant changes to the
IC50 values.
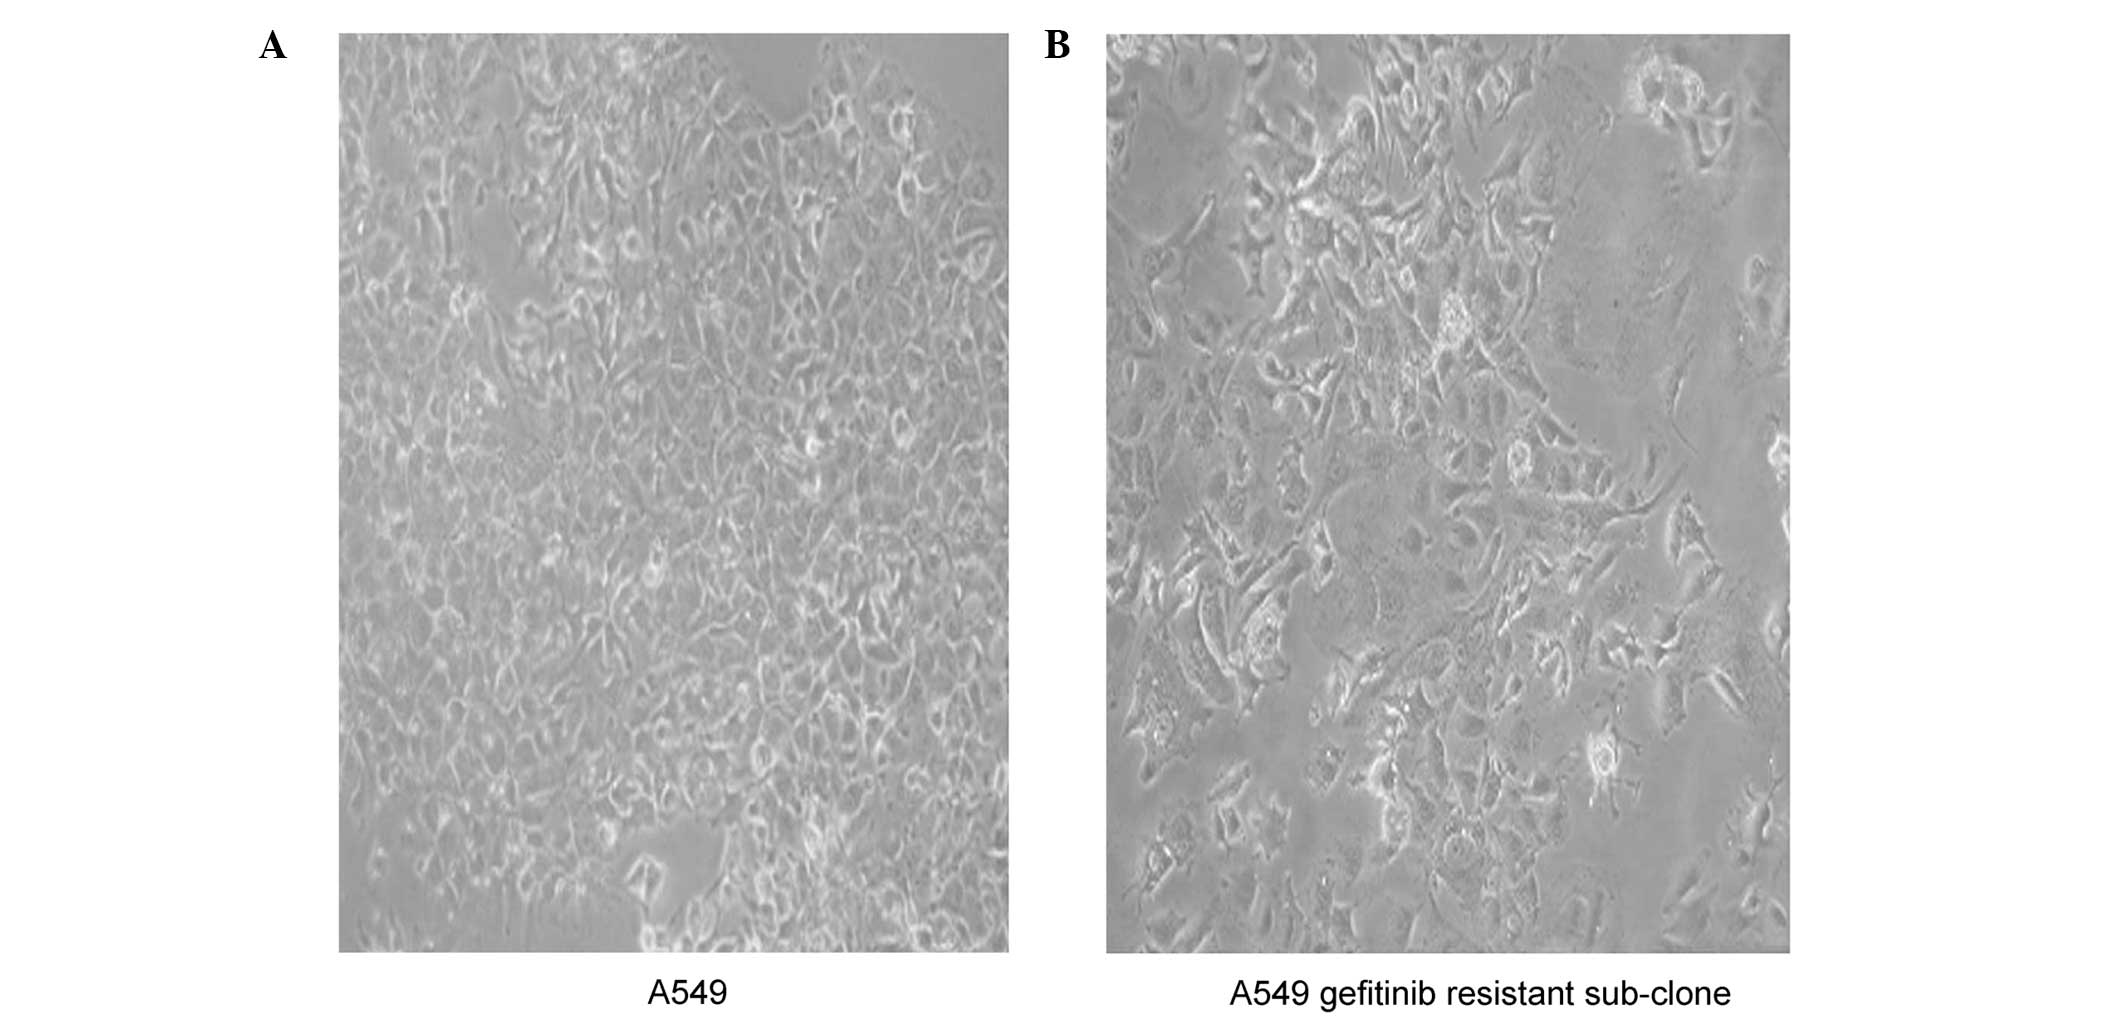
Morphological differences between parent
and gefitinib-resistant cell lines
Gefitinib-resistant sub-clones grew slower, as
compared with the parent cells. The resistant cell lines exhibited
an enlarged and flattened cell morphology, resembling that of cell
senescence, as compared with the parent cells, but only following
numerous generations. Conversely, acute exposure to high doses of
gefitinib did not result in morphological changes. The morphologic
changes observed in the A549 gefitinib-resistant cells included
spindle-shaped cells, with loss of polarity and increased formation
of pseudopodia (Fig. 2).
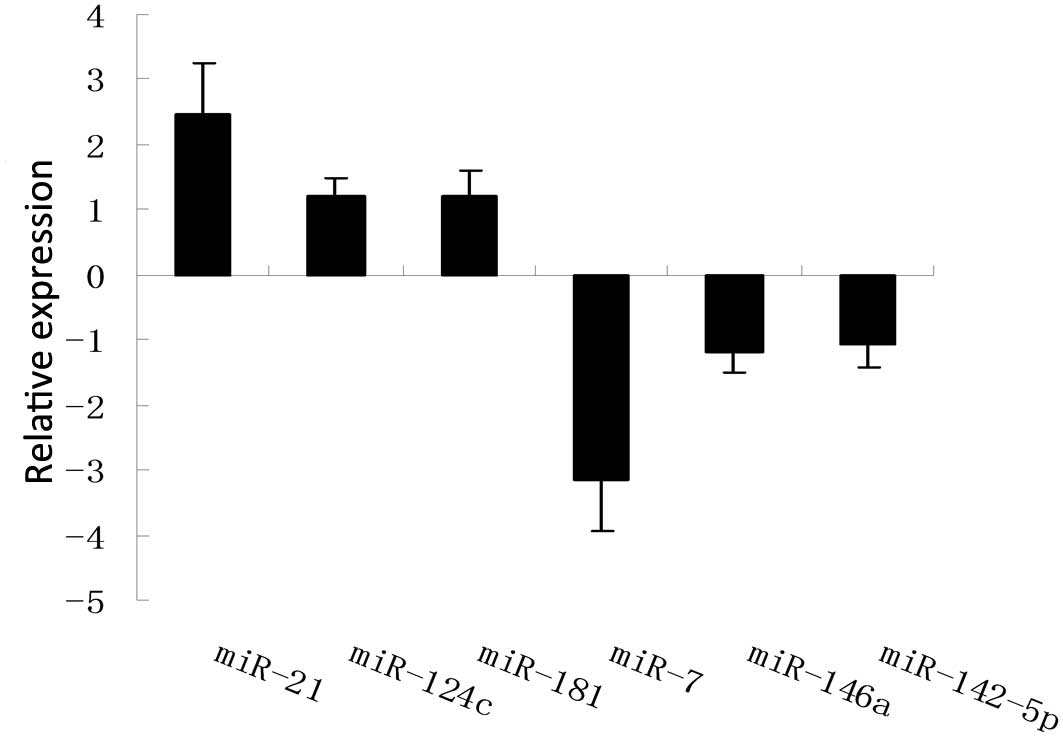
MiRNA array profiling and bioinformatics
analyses
A microarray platform was optimized for the analysis
of a panel of human miRNAs, and was used to analyze and compare the
pattern of miRNA expression between the parent and
gefitinib-resistant A549 cells. The expression profiles of 43
miRNAs changed significantly (2.0–14.0 fold), with 25 upregulated
miRNAs and 18 downregulated miRNAs detected in the resistant cells,
as compared with the parent cells (Table I). Six specific miRNAs, with the
most significantly altered expression levels between the groups,
were chosen to be verified using qPCR, and concordant results were
obtained (Fig. 3).
 | Table IDifferential expression levels of
micro (mi)RNAs in the gefitinib-resistant sub-clone and parent A549
lung cancer cells (resistance/parent). |
Table I
Differential expression levels of
micro (mi)RNAs in the gefitinib-resistant sub-clone and parent A549
lung cancer cells (resistance/parent).
| No. | miRNA | Fold changea (log2) | P-value |
|---|
| 1 | miR-21 | 13.234 | 0.0032 |
| 2 | miR-124c | 11.422 | 0.0051 |
| 3 | miR-181 | 11.233 | 0.0178 |
| 4 | miR-214 | 9.966 | 0.0020 |
| 5 | miR-31 | 8.434 | 0.0411 |
| 6 | miR-148a | 8.234 | 0.0069 |
| 7 | miR-299-5p | 8.012 | 0.0260 |
| 8 | miR-127 | 6.987 | 0.0145 |
| 9 | miR-660 | 6.782 | 0.0071 |
| 10 | miR-22 | 6.340 | 0.0124 |
| 11 | miR-24-1 | 5.233 | 0.0048 |
| 12 | miR-766 | 5.123 | 0.0021 |
| 13 | miR-762 | 5.076 | 0.0161 |
| 14 | miR-143 | 4.671 | 0.0052 |
| 15 | miR-376a | 4.234 | 0.0225 |
| 16 | miR-99a | 4.123 | 0.0146 |
| 17 | miR-132 | 4.098 | 0.0301 |
| 18 | miR-145 | 3.567 | 0.0169 |
| 19 | miR-125b | 3.123 | 0.0024 |
| 20 | miR-130a | 2.987 | 0.0071 |
| 21 | miR-423-5p | 2.871 | 0.0176 |
| 22 | miR-497 | 2.456 | 0.0248 |
| 23 | miR-375 | 2.344 | 0.0008 |
| 24 | miR-744 | 2.123 | 0.0013 |
| 25 | miR-140-3p | 2.098 | 0.0340 |
| 26 | miR-7 | −14.098 | 0.0043 |
| 27 | miR-146a | −9.856 | 0.0237 |
| 28 | miR-142-5p | −9.678 | 0.0198 |
| 29 | miR-122 | −7.345 | 0.0260 |
| 30 | miR-126 | −5.345 | 0.0103 |
| 31 | miR-424 | −5.231 | 0.0071 |
| 32 | miR-494 | −5.013 | 0.0342 |
| 33 | miR-224 | −4.875 | 0.0304 |
| 34 | miR-155 | −4.456 | 0.0102 |
| 35 | miR-638 | −4.123 | 0.0051 |
| 36 | miR-483-3p | −4.091 | 0.0178 |
| 37 | miR-92a | −3.987 | 0.0003 |
| 38 | miR-505 | −3.675 | 0.0311 |
| 39 | miR-125-3p | −3.102 | 0.0254 |
| 40 | miR-572 | −2.514 | 0.0260 |
| 41 | miR-100 | −2.287 | 0.0175 |
| 42 | miR-720 | −2.173 | 0.0091 |
| 43 | let-7e | −2.098 | 0.0105 |
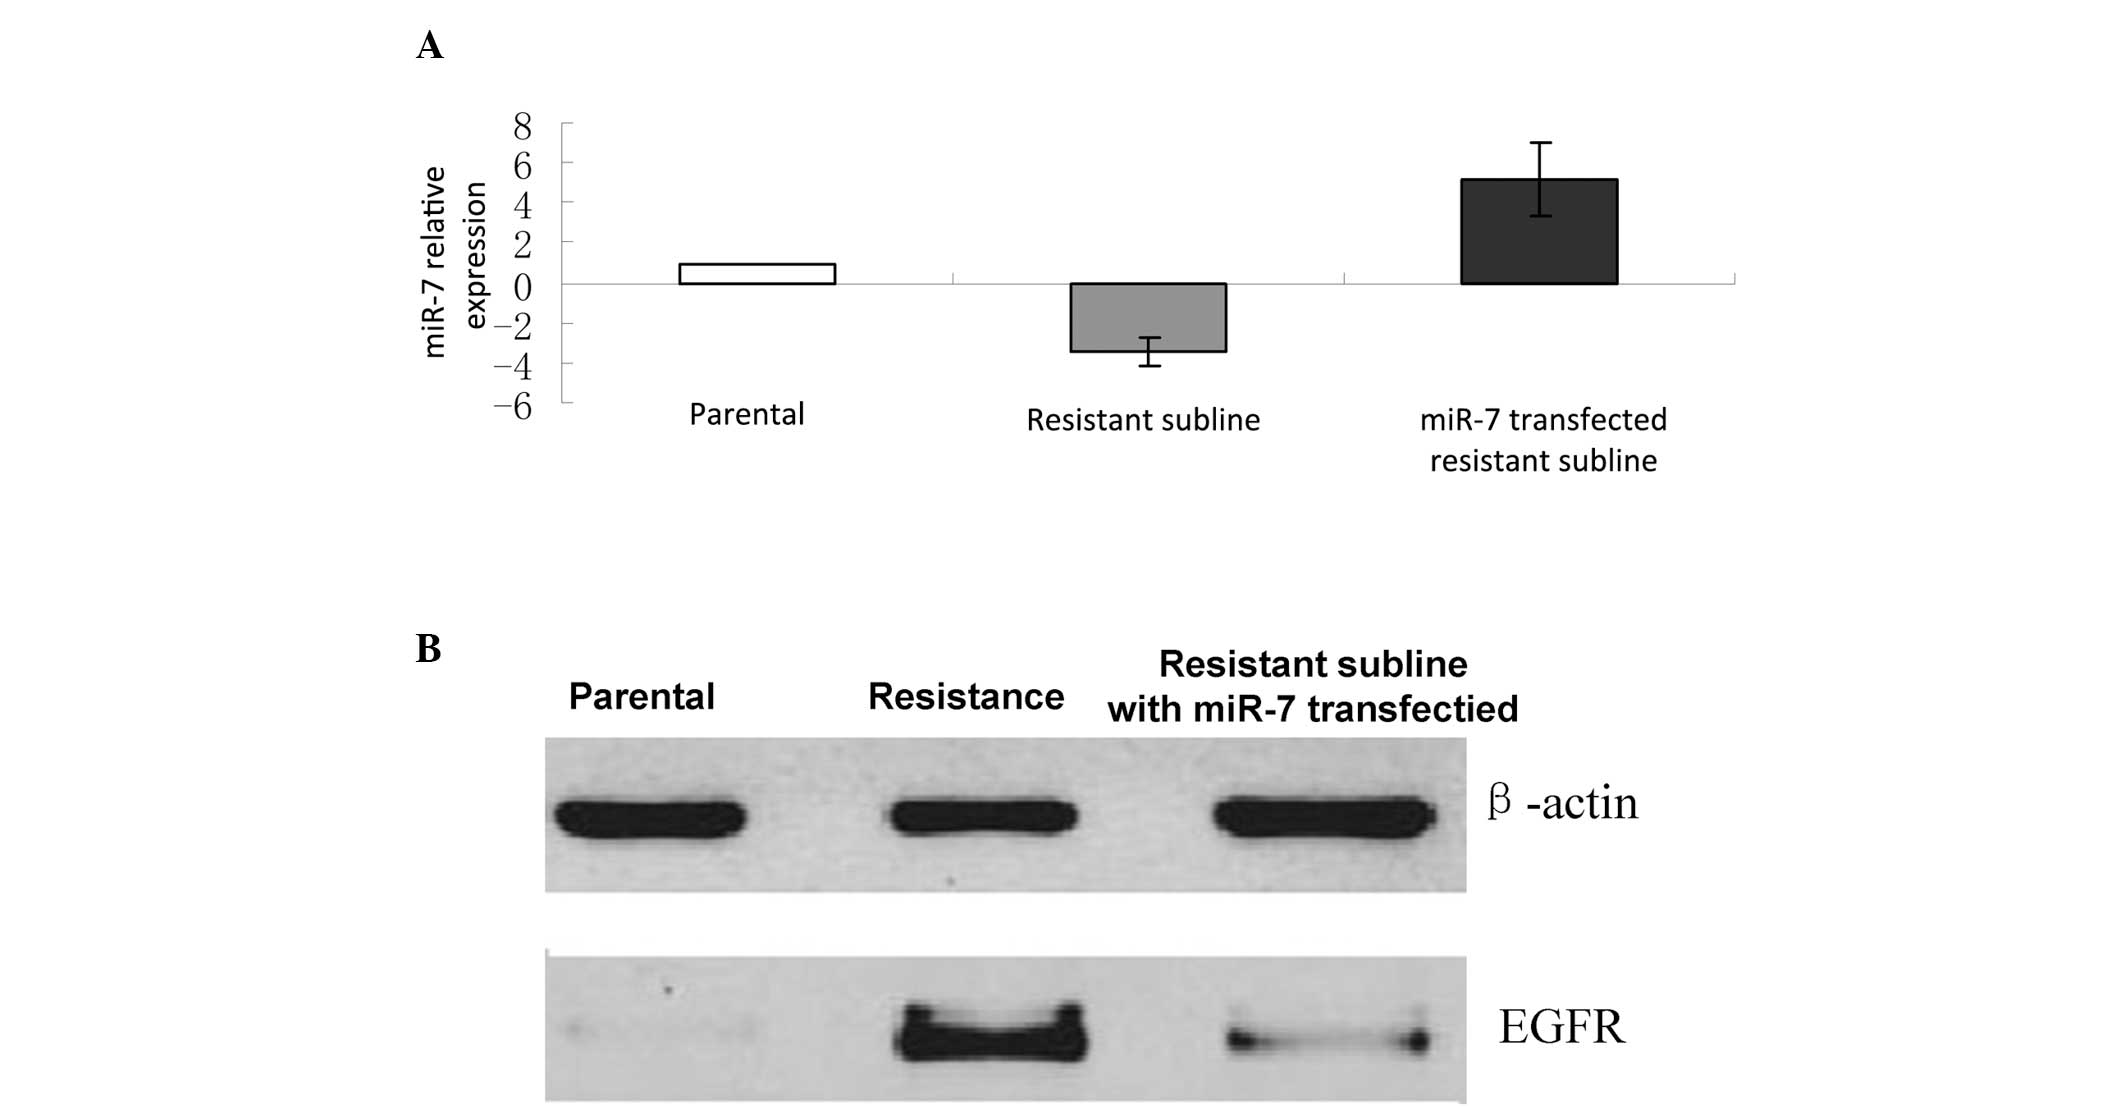
MiR-7 transfection reversed drug
sensitivity in the gefitinib resistant cell line
The analysis of potential target genes of miR-7 were
evaluated using TargetScan, Microcosm Targets, and microRNA.org
target prediction software. The results indicated EGFR as one of
the target genes of miR-7. Therefore, in the present study, the
correlation between EGFR and miR-7 expression was determined. In
order to confirm the effects of miR-7 mimics on miRNA expression,
miR-7 expression levels were determined using qPCR. MiR-7
expression levels were significantly upregulated following
transfection with miR-7, whereas the expression levels were
significantly downregulated in the gefitinib-resistant cells
without miR-7 transfection, as compared with the control cells
(Fig. 4A). Western blotting
results revealed that EGFR protein expression levels were
considerably reduced in the miR-7 mimic-transfected cells following
gefitinib treatment, as compared with the resistant cells without
miR-7 transfection (Fig. 4B).
Discussion
Chemotherapy remains the main therapeutic option for
the treatment of NSCLC. However, despite a good initial response to
therapy, most NSCLC patients suffer from the development of
chemoresistance and relapse (15).
Therefore, development of novel targeting specific molecules to
attenuate drug resistance, and establishment of rational
therapeutic approaches are required. Microarray analysis has made
it possible to identify appropriate candidate molecules for such
purposes (16). In the present
study a gefitinib-resistant cell line was successfully established
from the widely used A549 lung cancer cell line. Cellular models of
NSCLC in vitro are based on assays using sensitive and
resistant cell lines to chemotherapy, in order to mimic the
clinical scenario. Comprehensive miRNA expression profiles of NSCLC
were obtained using a miRNA microarray and the functions of the
identified miRNA were evaluated.
As well as the conventional end-point cytotoxicity
measurements, a label-free approach was used to determine the
cytotoxic response of adherent cells in real time, as previously
described (17). In the present
study, the real-time cell analyzer system xCELLigence (RTCA-SP) was
used to continuously monitor cellular growth and death, revealing
the physiological states of the cells throughout the process of
gefitinib treatment. The parent and developed resistant cell lines
exhibited different growth curves and drug responses, when seeded
at the same density. The morphological changes in the
gefitinib-resistant A549 cells observed in the present study were
concordant with those observed in a previous report (18). The gefitinib-resistant cells were
larger and more cellular vacuolation, as compared with the parent
cells; however, the shape of the resistant cells were polygonal,
which was similar to the parent cells.
Evidence regarding the roles of miRNAs in
determining drug sensitivity and resistance in lung cancer has
recently been emerging (19). A
previous study demonstrated that the miR-134/487b/655 cluster
contributed to transforming growth factor-β1-induced
epithelial-mesenchymal transition (EMT) and affected the resistance
to gefitinib by directly targeting the membrane-associated
guanylate kinase, WW and PDZ domain-containing protein 2 (MAGI2).
The suppression of MAGI2 subsequently resulted in the loss of
phosphatase and tensin homolog stability in lung cancer cells. This
resulted in the suggestion that the miR-134/miR-487b/miR-655
cluster may be a novel potential therapeutic target in advanced
lung adenocarcinoma patients, affecting the EMT phenomenon
(20). Dong et al (21) previously determined that miR-31 was
significantly upregulated in a cisplatin-resistant lung cancer cell
line, as compared with a cisplatin-sensitive cell line. This study
also demonstrated that miR-31 is capable of conferring
cisplatin-induced apoptosis and that inhibition of ABCB9 is
essential for cisplatin resistance. Using miRNA microarray
analysis, An et al (22)
identified 24 miRNAs displaying differential expression levels,
greater than 2-fold, in Rh2-treated A549 cells, as compared with
their respective parent cell lines. Aberrant miRNA expression has
also been detected for miR-30b, miR-30c, miR-221 and miR-222, which
may have important roles in gefitinib-induced apoptosis and EMT of
NSCLC cells in vitro and in vivo. These effects may
be mediated through inhibiting the expression of the genes encoding
BCL2-like 11, apoptotic peptidase activating factor 1, protein
kinase C ɛ and sarcoma viral oncogene homolog (23).
In the present study, a miRNA expression profile
detected a differential expression pattern between
gefitinib-resistant and gefitinib-sensitive A549 cells. Of the
miRNA genes analyzed, 43 miRNAs were significantly altered between
the cell lines (>2-fold), including the upregulation of 25 and
downregulation of 18 miRNAs. The differential expression levels of
these miRNAs in the cells suggests a role for these miRNAs in the
development of drug resistance in NSCLC cells.
miR-7 has previously been reported to inhibit EGFR
expression and subsequently suppress cell proliferation in numerous
human carcinoma cell lines (24,25).
Bioinformatic predictions suggest that the human EGFR mRNA
3′-untranslated region contains three miR-7 target sites, which are
not conserved across mammals (26). In Drosophila photoreceptor cells,
miR-7 controls EGFR signaling and promotes photoreceptor
differentiation (27). The other
targets of miR-7 include insulin-like growth factor-1 receptor
(IGF1R) and PIK3CD (28), the
E(spl) gene family (29) and Pak1
cancer cells (30). In a previous
study of breast cancer, miR-7 was suggested to have a role in the
development of resistance to endocrine therapy in breast cancer
patients, through regulating the expression of EGFR in carcinoma
cells (31). MiR-7 has also been
reported to regulate IGF-1R expression in tongue squamous cell
carcinoma cells (28). In the
present study, EGFR was negatively regulated by miR-7 mimic
transfection, and downregulation of EGFR expression at the protein
level largely correlated with elevated levels of miR-7 in the
gefitinib-resistant cells. The results of the present study suggest
that miR-7 may have central roles in the development of resistance
to endocrine therapy in resistant cells through regulating the
expression of EGFR in cancer cells.
In conclusion, the present study demonstrated that
specific miRNAs may be differentially expressed in drug-resistant
NSCLC cells, thereby suggesting their involvement in the generation
of the drug-resistant phenotype. The specific miRNA, miR-7 was
implicated, which targets the expression of EGFR. The results
indicate the potential use of these miRNAs as specific diagnostic
biomarkers for drug sensitivity of NSCLC. An in vitro model
may not explain resistance in patients, but remains a critical
initial step in studying the mechanisms of gefitinib resistance.
MiRNA signatures require further validation in clinical samples
from NSCLC patients. The results of the present study provide the
foundation for future research into biomarkers associated with
gefitinib resistance, which may ultimately lead to an improved
rationale for personalized chemotherapy selection.
Acknowledgements
The present study was supported by the Guizhou
Province Programs for Science and Technology Development.
References
|
1
|
Jemal A, Siegel R, Xu J and Ward E: Cancer
statistics, 2010. CA Cancer J Clin. 60:277–300. 2010. View Article : Google Scholar
|
|
2
|
Mendlsohn J and Baserga J: The EGF
receptor family as targets for cancer therapy. Oncogene.
19:6550–6565. 2000. View Article : Google Scholar : PubMed/NCBI
|
|
3
|
Fukuoka M, Yano S, Giaccone G, et al:
Multi-institutional randomized phase II trial of gefitinib for
previously treated patients with advanced non-small-cell lung
cancer (The IDEAL 1 Trial) [corrected]. J Clin Oncol. 21:2237–2246.
2003.
|
|
4
|
Kris MG, Natale RB, Herbst RS, et al:
Efficacy of gefitinib, an inhibitor of the epidermal growth factor
receptor tyrosine kinase, in symptomatic patients with non-small
cell lung cancer: a randomized trial. JAMA. 290:2149–2158. 2003.
View Article : Google Scholar
|
|
5
|
Nakagawa K, Tamura T, Negoro S, et al:
Phase I pharmacokinetic trial of the selective oral epidermal
growth factor receptor tyrosine kinase inhibitor gefitinib
(‘Iressa’, ZD1839) in Japanese patients with solid malignant
tumours. Ann Oncol. 14:922–930. 2003.
|
|
6
|
Jackman D, Pao W, Riely GJ, et al:
Clinical definition of acquired resistance to epidermal growth
factor receptor tyrosine kinase inhibitors in non-small-cell lung
cancer. J Clin Oncol. 28:357–360. 2010. View Article : Google Scholar
|
|
7
|
Peled N, Wynes MW, Ikeda N, et al:
Insulin-like growth factor-1 receptor (IGF-1R) as a biomarker for
resistance to the tyrosine kinase inhibitor gefitinib in non-small
cell lung cancer. Cell Oncol (Dordr). 36:277–288. 2013. View Article : Google Scholar : PubMed/NCBI
|
|
8
|
Roybal JD, Zang Y, Ahn YH, et al: miR-200
inhibits lung adenocarcinoma cell invasion and metastasis by
targeting Flt1/VEGFR1. Mol Cancer Res. 9:25–35. 2011. View Article : Google Scholar : PubMed/NCBI
|
|
9
|
Esquela-Kerscher A, Trang P, Wiggins JF,
et al: The let-7 microRNA reduces tumor growth in mouse models of
lung cancer. Cell Cycle. 7:759–764. 2008. View Article : Google Scholar : PubMed/NCBI
|
|
10
|
Ambros V: microRNAs: tiny regulators with
great potential. Cell. 107:823–826. 2001. View Article : Google Scholar : PubMed/NCBI
|
|
11
|
Hwang HW and Mendell JT: MicroRNAs in cell
proliferation, cell death, and tumorigenesis. Br J Cancer.
94:776–780. 2006. View Article : Google Scholar : PubMed/NCBI
|
|
12
|
Leung AK and Sharp PA: microRNAs: a
safeguard against turmoil? Cell. 130:581–585. 2007. View Article : Google Scholar : PubMed/NCBI
|
|
13
|
Coldren CD, Helfrich BA, Witta SE, et al:
Baseline gene expression predicts sensitivity to gefitinib in
non-small cell lung cancer cell lines. Mol Cancer Res. 4:521–528.
2006. View Article : Google Scholar : PubMed/NCBI
|
|
14
|
Uphoff CC and Drexler HG: Detecting
mycoplasma contamination in cell cultures by polymerase chain
reaction. Methods Mol Biol. 731:93–103. 2011. View Article : Google Scholar : PubMed/NCBI
|
|
15
|
Gainor JF and Shaw AT: Emerging paradigms
in the development of resistance to tyrosine kinase inhibitors in
lung cancer. J Clin Oncol. 31:3987–3996. 2013. View Article : Google Scholar : PubMed/NCBI
|
|
16
|
Guo L, Liu Y, Bai Y, Sun Y, Xiao F and Guo
Y: Gene expression profiling of drug-resistant small cell lung
cancer cells by combining microRNA and cDNA expression analysis.
Eur J Cancer. 46:1692–1702. 2010. View Article : Google Scholar : PubMed/NCBI
|
|
17
|
Nguemo F, Šarić T, Pfannkuche K, Watzele
M, Reppel M and Hescheler J: In vitro model for assessing
arrhythmogenic properties of drugs based on high-resolution
impedance measurements. Cell Physiol Biochem. 29:819–832. 2012.
View Article : Google Scholar : PubMed/NCBI
|
|
18
|
Rho JK, Choi YJ, Lee JK, et al: Epithelial
to mesenchymal transition derived from repeated exposure to
gefitinib determines the sensitivity to EGFR inhibitors in A549, a
non-small cell lung cancer cell line. Lung Cancer. 63:219–226.
2009. View Article : Google Scholar : PubMed/NCBI
|
|
19
|
Maftouh M, Avan A, Galvani E, Peters GJ
and Giovannetti E: Molecular mechanisms underlying the role of
microRNAs in resistance to epidermal growth factor
receptor-targeted agents and novel therapeutic strategies for
treatment of non-small-cell lung cancer. Crit Rev Oncog.
18:317–326. 2013. View Article : Google Scholar
|
|
20
|
Kitamura K, Seike M, Okano T, et al:
MiR-134/487b/655 cluster regulates TGF-β-induced
epithelial-mesenchymal transition and drug resistance to gefitinib
by targeting MAGI2 in lung adenocarcinoma cells. Mol Cancer Ther.
13:44–453. 2014.PubMed/NCBI
|
|
21
|
Dong Z, Zhong Z, Yang L, Wang S and Gong
Z: MicroRNA-31 inhibits cisplatin-induced apoptosis in non-small
cell lung cancer cells by regulating the drug transporter ABCB9.
Cancer Lett. 343:249–257. 2014. View Article : Google Scholar : PubMed/NCBI
|
|
22
|
An IS, An S, Kwon KJ, Kim YJ and Bae S:
Ginsenoside Rh2 mediates changes in the microRNA expression profile
of human non-small cell lung cancer A549 cells. Oncol Rep.
29:523–528. 2013.PubMed/NCBI
|
|
23
|
Garofalo M, Romano G, Di Leva G, et al:
EGFR and MET receptor tyrosine kinase-altered microRNA expression
induces tumorigenesis and gefitinib resistance in lung cancers. Nat
Med. 18:74–82. 2011.
|
|
24
|
Kefas B, Godlewski J, Comeau L, et al:
microRNA-7 inhibits the epidermal growth factor receptor and the
Akt pathway and is down-regulated in glioblastoma. Cancer Res.
68:3566–3572. 2008. View Article : Google Scholar : PubMed/NCBI
|
|
25
|
Giles KM, Barker A, Zhang PM, Epis MR and
Leedman PJ: MicroRNA regulation of growth factor receptor signaling
in human cancer cells. Methods Mol Biol. 676:147–163. 2011.
View Article : Google Scholar : PubMed/NCBI
|
|
26
|
Webster RJ, Giles KM, Price KJ, Zhang PM,
Mattick JS and Leedman PJ: Regulation of epidermal growth factor
receptor signaling in human cancer cells by microRNA-7. J Biol
Chem. 284:5731–5741. 2009. View Article : Google Scholar : PubMed/NCBI
|
|
27
|
Li X and Carthew RW: A microRNA mediates
EGF receptor signaling and promotes photorecepotor differentiation
in the Drosophila eye. Cell. 123:1267–1277. 2005. View Article : Google Scholar : PubMed/NCBI
|
|
28
|
Jiang L, Liu X, Chen Z, et al: MicroRNA-7
targets IGF1R (insulin-like growth factor 1 receptor) in tongue
squamous cell carcinoma cells. Biochem J. 432:199–205. 2010.
View Article : Google Scholar : PubMed/NCBI
|
|
29
|
Stark A, Brennecke J, Russell RB and Cohen
SM: Identification of Drosophila microRNA targets. PLoS Biol.
1:E602003. View Article : Google Scholar : PubMed/NCBI
|
|
30
|
Reddy SD, Ohshiro K, Rayala SK and Kumar
R: MicroRNA-7, a homeobox D10 target, inhibits p21-activated kinase
1 and regulates its functions. Cancer Res. 68:8195–8200. 2008.
View Article : Google Scholar : PubMed/NCBI
|
|
31
|
Masuda M, Miki Y, Hata S, et al: An
induction of microRNA, miR-7 through estrogen treatment in breast
carcinoma. J Transl Med. 10:S22012. View Article : Google Scholar : PubMed/NCBI
|