Introduction
Gastric cancer (GC) is the fourth most common cancer
worldwide. It causes ~800,000 deaths/year, which renders it the
second leading cause of cancer-related mortality after lung cancer
(1). Metastasis occurs in 80–90%
of individuals with GC, with a six-month survival rate of 65% for
patients diagnosed at the early stages, and <15% for those
diagnosed at late stages. Therefore, metastasis-related biomarkers
are necessary to allow early diagnosis and development of targeted
therapies.
A number of studies have demonstrated that diverse
signaling pathways are involved in the metastasis of GC. Yonemura
et al (2) demonstrated that
cancer cells producing VEGF-C induces proliferation and dilation of
lymphatic vessels, resulting in the invasion of cancer cells into
the lymphatic vessel and lymph node metastasis. Shimizu et
al (3) further showed that
inhibition of VEGFR-3 signaling inhibits lymph node metastasis of
GC cells. Xu et al (4)
found that expression of receptors for advanced glycation
end-products is closely associated with the invasive and metastatic
activity of GC cells. The tumor microenvironment also appears to
considerably affect metastasis. Upregulation of manganese
superoxide dismutase was found in metastatic GC, which may be
associated with the reactive oxygen status of the gastric tumor
microenvironment (5). The
epithelial cell adhesion molecule E-cadherin also plays a role in
tumorigenesis and metastasis of GC cells (6). Given the poor outcome of patients
with metastatic GC, additional research is necessary to unveil the
molecular mechanisms underlying metastasis, and thus provide useful
biomarkers for early diagnosis and treatment.
Microarray technology is an appropriate tool to
investigate the global gene expression changes in cancers such as
GC. Hippo et al (7) adopted
this technology to study the global gene expression profiles in GC.
Kang et al (8) identified
differentially expressed genes (DEGs) in drug-resistant GC cells.
Yamashita et al (9) carried
out a genome-wide screening for methylation-silenced genes using
5-aza-2′-deoxycytidine treatment and oligonucleotide
microarrays.
By now, massive microarray data have been acquired.
We considered that a comprehensive exploration of existing datasets
with bioinformatic tools may provide novel insights into GC
metastasis. Therefore, in the present study, a comparative analysis
between metastatic and non-metastatic GC gene expression data was
performed to identify DEGs, which may allow to reveal the molecular
mechanisms underlying metastasis and provide potential biomarkers
for the early diagnosis of this disease.
Materials and methods
Microarray data and pretreatment
The gene expression dataset GSE21328 was downloaded
from the Gene Expression Omnibus database (10), and comprised 2 metastatic stomach
cancer samples and 2 non-metastatic stomach cancer samples
(11). The platform in which the
data were acquired was the Agilent-014850 Whole Human Genome 4×44K
G4112F microarray (feature number version).
Raw data were log2 transformed. Probes
were mapped to genes according to the annotation file. The average
expression level for each gene was calculated from the expression
data for all probes corresponding to the same gene. Normalization
of the data was performed with the Affy package of Bioconductor
(12).
Identification of DEGs
The Bioconductor package limma (13) was chosen for differential
expression analysis. As cut-offs, we used the log (fold-change)
>1.5 and p-value <0.05. Hierarchical clustering of the DEGs
was performed on median-centered, log2-transformed data
using the Cluster software (14),
and was subsequently visualized using Treeview software (15).
Functional enrichment analysis
Gene Ontology (GO) enrichment analysis was performed
for upregulated and downregulated genes with DAVID (16). Terms with false discovery rate
(FDR) <0.05 were retained, and then compared between the two
groups.
Transcriptional regulatory network
analysis
A transcriptional regulatory network was constructed
for DEGs with information from the UCSC genome browser (http://genome.ucsc.edu) (17). GO and Kyoto Encyclopedia of Genes
and Genomes (KEGG; 18) enrichment analysis were performed for the
nodes in the network in order to identify proteins and pathways
that were significantly enriched in metastasis. FDR <0.05 was
set as the cut-off.
Construction of a protein-protein
interaction (PPI) network
A PPI network was constructed for DEGs using
information from the STRING database (http://string-db.org/). The interactions with score
>0.7 were retrieved from the database and then visualized using
the Cytoscape software platform (19). The proteins in the network were
defined as the nodes and the degree of a node corresponds to the
number of interactions of a protein. Functional enrichment analysis
was applied on hub nodes with degree of >5. The Clustering with
Overlapping Neighborhood Expansion (ClusterONE) plugin from
Cytoscape (20) was used to
extract functional modules from the entire network. Number of node
≥10 and p-value <0.05 were set as the cut-offs.
Results
DEGs
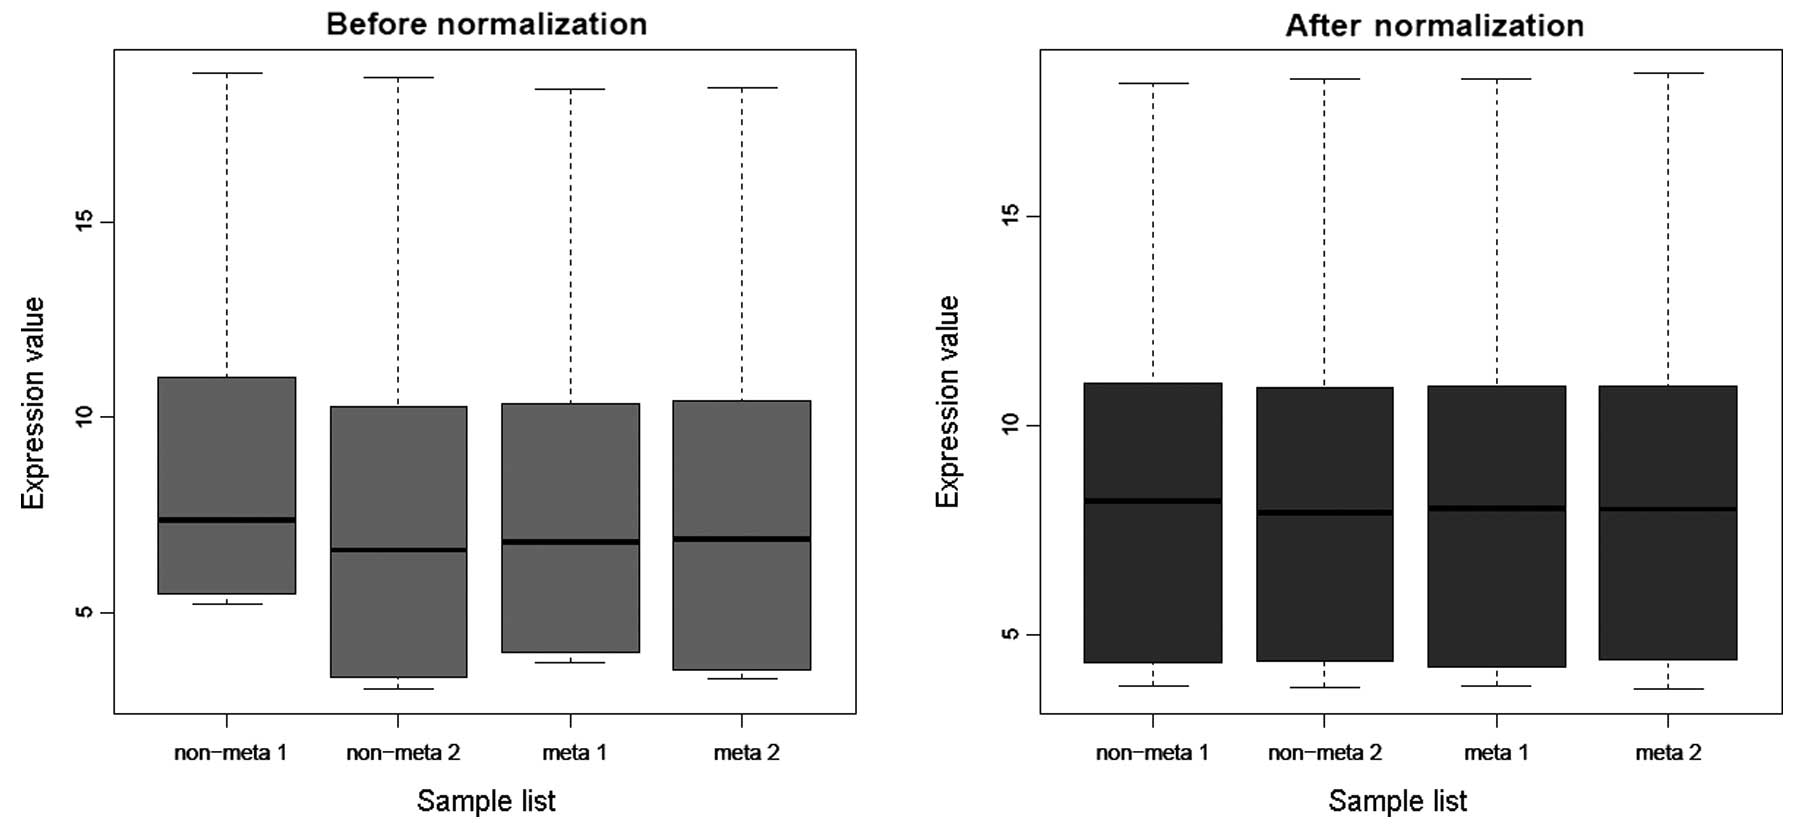
The microarray dataset GSE21328 included 12,116 gene
expression values. Normalization of these data was satisfactory
(Fig. 1). A total of 584 DEGs were
then identified for metastatic stomach cancer, of which 175 were
upregulated and 409 were downregulated. The clustering analysis
result is shown in Fig. 2,
indicating these genes may be used to distinguish between
metastatic and non-metastatic GC.
Functional enrichment analysis
Upregulated genes were enriched for the GO term
‘xenobiotic metabolic process’. Downregulated genes were enriched
for ‘immune response’, ‘response to virus’, ‘antigen processing and
presentation’, and ‘cell morphogenesis involved in
differentiation’. In addition, a considerable portion of DEGs was
predicted to locate at the extracellular space (Table I).
 | Table IGO enrichment analysis results for
upregulated and downregulated genes. |
Table I
GO enrichment analysis results for
upregulated and downregulated genes.
| Category | GO term | Count | P-value | FDR |
|---|
| Upregulated
genes | 0006805-xenobiotic
metabolic process | 5 | 3.88E-02 | 4.64E-02 |
| Downregulated
genes | 0006955-immune
response | 45 | 8.13E-09 | 6.86E-09 |
| 0009615-response to
virus | 16 | 7.17E-06 | 6.05E-06 |
| 0019882-antigen
processing and presentation | 13 | 1.56E-04 | 1.31E-04 |
| 0000904-cell
morphogenesis involved in differentiation | 17 | 5.50E-02 | 4.77E-02 |
|
0005615-extracellular space | 35 | 3.91E-04 | 1.96E-03 |
|
0044421-extracellular region part | 42 | 1.38E-03 | 6.91E-03 |
|
0005576-extracellular region | 69 | 3.08E-03 | 1.55E-02 |
| 0042611-MHC protein
complex | 9 | 5.05E-03 | 2.54E-02 |
| 0009986-cell
surface | 21 | 8.53E-03 | 4.29E-02 |
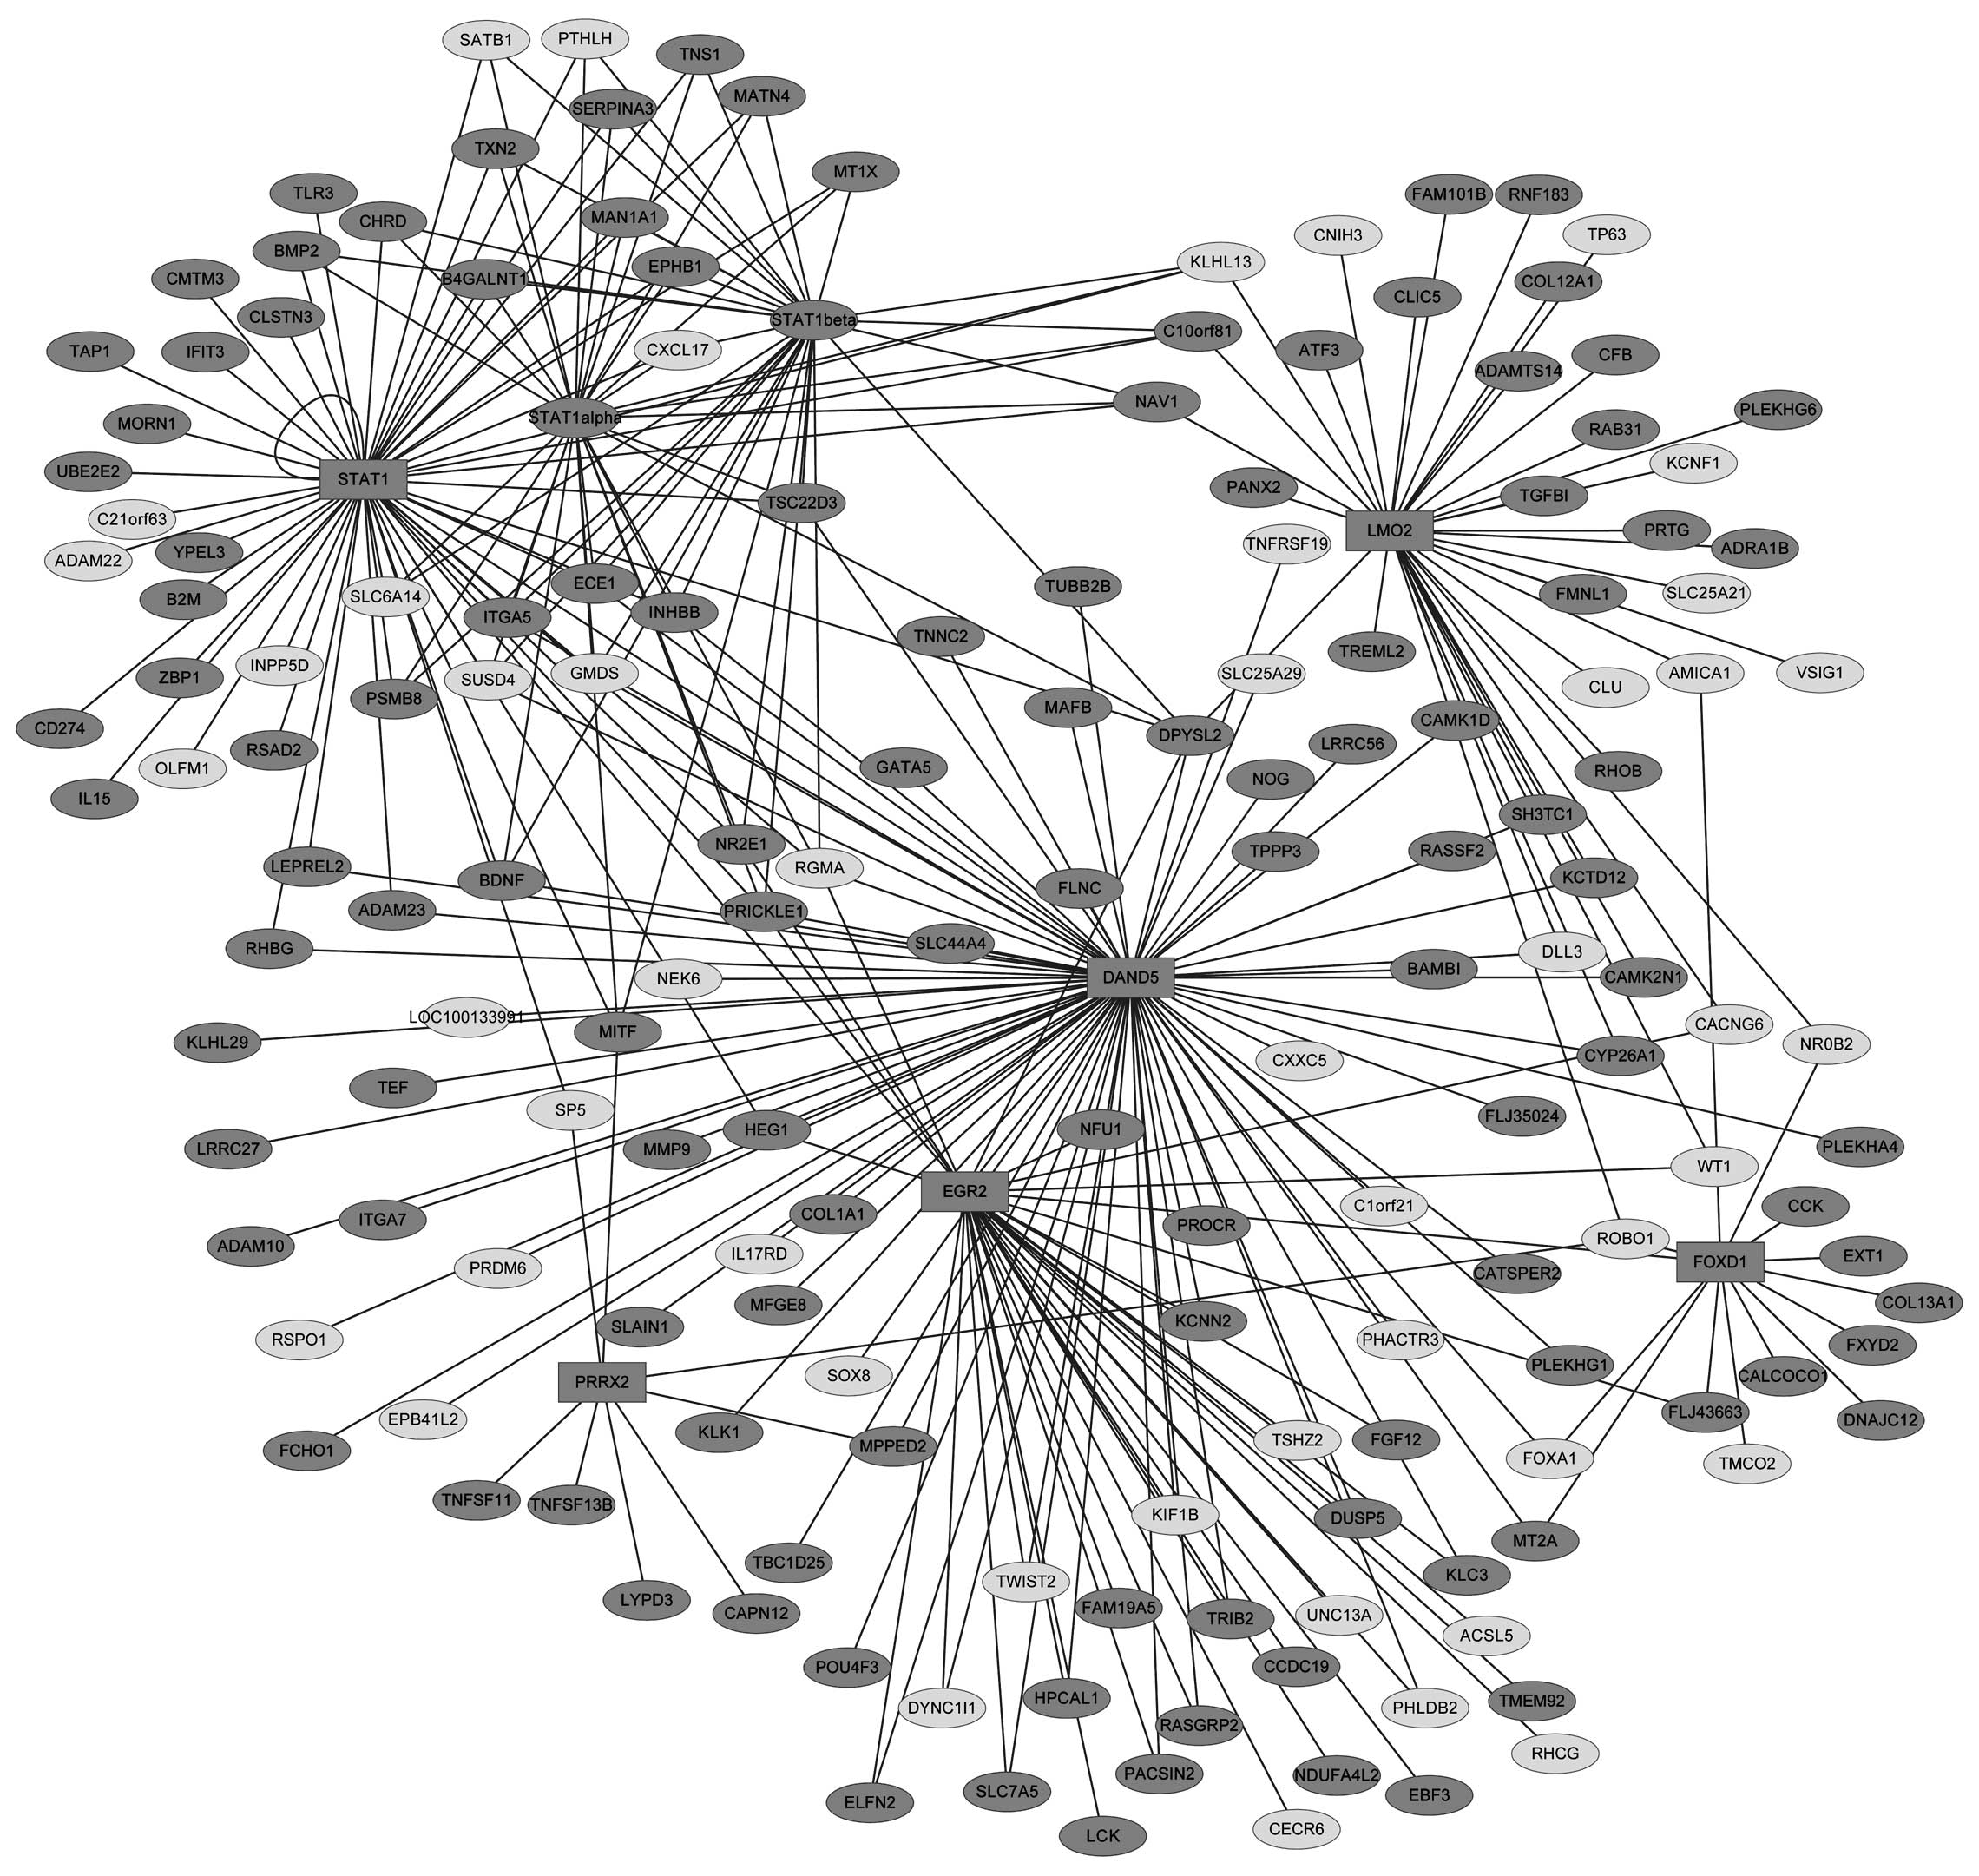
Transcriptional regulatory network
A total of 215 transcription factors (TFs) and
21,4607 TF-target gene interactions are included in the UCSC
database. Out of the 584 DEGs, 6 downregulated genes were found to
encode TFs. These TFs were: DAN domain family member 5 (DAND5),
which is a BMP antagonist, early growth response 2 (EGR2), forkhead
box D1 (FOXD1), LIM domain only 2 (LMO2), paired mesoderm homeobox
protein 2 (PRRX2) and signal transducer and activator of
transcription 1 (STAT1). No upregulated TFs were detected. A
transcriptional regulatory network was constructed on the 6 TFs,
and their 169 target genes (Fig.
3), forming 175 nodes (proteins) and 285 edges (interactions).
Functional enrichment analysis showed that the proteins in this
netwirk are significantly enriched for the GO term ‘negative
regulation of cell differentiation’ (FDR<0.05). This category
included proteins such as noggin (NOG), LIM domain only 2 (LMO2),
v-maf avian musculoaponeurotic fibrosarcoma oncogene homolog B
(MAFB), delta-like 3 (DLL3), tumor protein p63 (TP63), Toll-like
receptor 3 (TLR3), nuclear receptor subfamily 2, group E, member 1
(NR2E1), parathyroid hormone-like hormone (PTHLH), brain-derived
neurotrophic factor (BDNF), PR domain containing 6 (PRDM6),
inositol polyphosphate-5-phosphatase(INPP5D), chordin (CHRD), and
twist basic helix-loop-helix transcription factor 2 (TWIST2).
PPI network
Fig. 4 shows the
PPI network of DEGs in metastatic GC, which contained 191 nodes and
474 edges. The number of downregulated proteins was higher than
that of upregulated proteins. Moreover, downregulated proteins were
often observed as components of the same module, such as in module
1 in Fig. 5. A total of 6 modules
were identified from the entire network (Fig. 5) using ClusterONE. Module 1
comprised 32 downregulated genes products and 245 interactions.
Functional enrichment analysis showed that proteins of this module
were significantly enriched for immune functions, such as immune
response (FDR<0.05) and antigen processing and presentation of
peptide antigen via MHC class I (FDR<0.05). No significant
enrichment for GO terms was observed in the remaining 5 modules.
However, STAT1 was found to be part of two modules (1 and 2),
suggesting that this protein may have a role in the development of
metastatic GC.
Discussion
In the present study, a total of 584 DEGs were
identified in metastatic GC, of which 175 were upregulated and 409
downregulated. GO enrichment analysis revealed that the
downregulated genes were significantly enriched for immune response
and relevant pathways. According to the transcriptional regulatory
network analysis, 6 DEGs were found to be TFs, associated with 169
predicted targets. Functional enrichment analysis revealed that the
genes in this network are enriched for negative regulation of cell
differentiation. In addition, 6 functional modules were extracted
from the PPI network; of these modules, module 1 showed a
significant over-representation for immune response and relevant
biological functions.
Immune response is closely related to cancer, while
immune escape is a critical gateway to malignancy (21). The study by Maehara et al
(22) confirmed that there is a
negative correlation between lymph node metastasis and dendritic
cell infiltration in GC. In agreement with previous studies, a
number of downregulated genes in metastatic GC were found to be
involved in immune response, as well as antigen processing and
presentation of peptide antigen via major histocompatibility
complex (MHC) class I (Fig. 5,
module 1). Downregulation of human leukocyte antigen (HLA) class I
antigen processing molecules is considered to relate to renal cell
carcinoma (23). Cabrera et
al (24) found that HLA class
I expression in metastatic melanoma correlates to tumor development
during autologous vaccination. A decrease in the expression of
class I proteins was also reported in metastases of colorectal,
gastric and laryngeal carcinomas (25). In the present study, several
members of the HLA family were identified as downregulated, such as
MHC class I, J (HLA-J), MHC class I, B (HLA-B) and MHC class I, F
(HLA-F). Downregulation of HLA-B was also observed in metastatic
serous adenocarcinomas, although the difference was not
statistically significant (26).
Dedifferentiation is related to metastasis (27,28).
Certain of the proteins encoded by the DEGs that are associated
with this term have been reported to be linked to metastasis.
Nakata et al (29) showed
that LMO2 expression is related to aggressive behavior and distant
metastasis in prostate cancer. TP63 is a suppressor of
tumorigenesis and metastasis interacting with the mutant p53
protein (30). TLR3 is a member of
transmembrane proteins that recognize conserved molecular motifs of
viral and bacterial origin and initiate the innate immune response.
Zhang et al (31) reported
that TLR3 activation inhibits nasopharyngeal carcinoma metastasis
via downregulation of the chemokine receptor CXCR4. González-Reyes
et al (32) asserted that
the expression levels of TLR3, TLR4 and TLR9 have clinical value as
indicators of tumor aggressiveness in breast cancer. TWIST2 is
implicated in cell lineage determination and differentiation. Fang
et al (33) reported that
TWIST2 contributes to breast cancer progression by promoting the
epithelial-mesenchymal transition and cancer stem-like cell
self-renewal. Similar results were observed in cervical carcinoma
(34). Future studies on the
proteins encoded by these DEGs may provide interesting findings and
data for the development of new therapeutic targets for metastatic
GC.
Six TFs were identified from the DEGs and these
could regulate 169 target genes, forming 175 nodes in the
transcriptional regulatory network (Fig. 3). Previous studies have shed light
on their roles in the development of metastatic cancers. Ernst
et al (35) found that
STAT3 and STAT1 mediate IL-11-dependent and inflammation-associated
gastric tumorigenesis in gp130 receptor-mutant mice. In addition,
STAT1 is also related to metastasis. Khodarev et al
(36) point out that the STAT1
pathway mediates amplification of the metastatic potential and
resistance to therapy. In cultured cell-based experiments,
Greenwood et al (37)
reported that activation of STAT1 causes increased migration and
invasion, and increases the abundance of CD74. CD74 overexpression
leads to increased membrane expression of proteins involved in cell
adhesion and metastasis. The protein inhibitor of activated STAT1
(PIAS1) is a novel modulator of the JAK/STAT signaling pathway that
negatively regulates the inflammatory response. The study by Chen
et al (38) showed that
PIAS1 is downregulated in GC tissueS and involved in cell
metastasis. However, according to the study by Huang et al
(39), STAT1 is a negative
regulator of tumor angiogenesis and, hence, of tumor growth and
metastasis. STAT1 is an important TF regulating a range of target
genes. Diverse signaling pathways dominate the physiological
processes at different cellular conditions, which may explain the
conflicting roles reported for STAT1 in cancer. Research on
deregulated target genes of STAT1 may enhance the current
understanding on the regulatory mechanisms this TF is involved in.
Certain of the target genes of STAT1 have been previously
associated with cancer metastasis. The gene encoding the bone
morphogenetic protein-2 (BMP-2) is one of these: Park et al
(40) reported that BMP-2 is
associated with progression to a metastatic state in GC. The study
by Kang et al (41) further
pointed out that the BMP-2 signaling pathway enhances tumor
metastasis by sequential activation of the PI3K/AKT or the MAPK
pathways, followed by the induction of nuclear factor-κB and MMP-9.
The chemokine C-X-C motif ligand 17 gene (CXCL17) is another
transcriptional target of STAT1. CXCL17 was found to be
upregulated in metastatic GC in our data. Matsui et al
(42) indicated that the CXCL17
protein recruits immature myeloid-derived cells in tumor cells, and
promotes tumor progression through angiogenesis. Future research on
these target genes may reveal new therapeutic targets for
metastatic GC.
EGR2 is a transcription factor with three tandem
C2H2-type zinc fingers. It has been identified as a tumor
suppressor, and its expression level is decreased in various types
of cancer (43,44). miR-150 promotes GC proliferation by
negatively regulating the pro-apoptotic gene EGR2 (45). LaTulippe et al (46) reported that EGR2 and
EGR3 are differentially expressed at least 3-fold between
primary and metastatic prostate cancer. ERG2 has numerous target
genes, among which TWIST2, which was previously linked to
metastasis (47). The RGM domain
family member A (RGMA), a member of the repulsive guidance
molecule family, is also a target gene of ERG2. RGMA is
regarded as a key regulator of growth and aggressiveness of
prostate cancer cells (48). Zhao
et al (49) showed that
decreased expression of RGMA by DNA methylation in
colorectal cancer is related to tumor progression. In our data,
RGMA was downregulated in metastatic GC. We therefore
hypothesize that this gene may play a role in metastasis of GC
cells.
Overall, the present study described the
differential expression profiles between metastatic and
non-metastatic GC. The results of this study provided meaningful
data for future investigations; the identified DEGs will be useful
in future research aiming to elucidate the regulatory mechanism
underlying metastasis. Among these DEGs, STAT1 and
EGR2 are promising candidates for use as metastatic GC
biomarkers, and thus warrant further investigation.
Acknowledgements
This study was supported by a grant from the Natural
Scientific Foundation of Shanghai (no. 13ZR1413500). We wish to
express our warm acknowledgement to Lishan Wang from the Shanghai
Jiao Tong University. His ideas and help added a valuable dimension
to this study.
References
|
1
|
World Health Organization. Cancer. Fact
sheet 297. WHO; Geneva, Switzerland: 2011
|
|
2
|
Yonemura Y, Endo Y, Fujita H, et al: Role
of vascular endothelial growth factor C expression in the
development of lymph node metastasis in gastric cancer. Clin Cancer
Res. 5:1823–1829. 1999.PubMed/NCBI
|
|
3
|
Shimizu K, Kubo H, Yamaguchi K, et al:
Suppression of VEGFR-3 signaling inhibits lymph node metastasis in
gastric cancer. Cancer Sci. 95:328–333. 2004. View Article : Google Scholar : PubMed/NCBI
|
|
4
|
Xu X, Abuduhadeer X, Zhang WB, et al:
Knockdown of RAGE inhibits growth and invasion of gastric cancer
cells. Eur J Histochem. 57:e362013. View Article : Google Scholar : PubMed/NCBI
|
|
5
|
Malafa M, Margenthaler J, Webb B, Neitzel
L and Christophersen M: MnSOD expression is increased in metastatic
gastric cancer. J Surg Res. 88:130–134. 2000. View Article : Google Scholar : PubMed/NCBI
|
|
6
|
Tang B, Peng ZH, Yu PW, Yu G and Qian F:
Expression and significance of Cx43 and E-cadherin in gastric
cancer and metastatic lymph nodes. Med Oncol. 28:502–508. 2011.
View Article : Google Scholar : PubMed/NCBI
|
|
7
|
Hippo Y, Taniguchi H, Tsutsumi S, et al:
Global gene expression analysis of gastric cancer by
oligonucleotide microarrays. Cancer Res. 62:233–240.
2002.PubMed/NCBI
|
|
8
|
Kang HC, Kim IJ, Park JH, et al:
Identification of genes with differential expression in acquired
drug-resistant gastric cancer cells using high-density
oligonucleotide microarrays. Clin Cancer Res. 10:272–284. 2004.
View Article : Google Scholar
|
|
9
|
Yamashita S, Tsujino Y, Moriguchi K,
Tatematsu M and Ushijima T: Chemical genomic screening for
methylation-silenced genes in gastric cancer cell lines using
5-aza-2′-deoxycytidine treatment and oligonucleotide microarray.
Cancer Sci. 97:64–71. 2006.PubMed/NCBI
|
|
10
|
Edgar R, Domrachev M and Lash AE: Gene
Expression Omnibus: NCBI gene expression and hybridization array
data repository. Nucleic Acids Res. 30:207–210. 2002. View Article : Google Scholar : PubMed/NCBI
|
|
11
|
Hatakeyama K, Ohshima K, Fukuda Y, et al:
Identification of a novel protein isoform derived from
cancer-related splicing variants using combined analysis of
transcriptome and proteome. Proteomics. 11:2275–2282. 2011.
View Article : Google Scholar
|
|
12
|
Gautier L, Cope L, Bolstad BM and Irizarry
RA: affy - analysis of Affymetrix GeneChip data at the probe level.
Bioinformatics. 20:307–315. 2004. View Article : Google Scholar : PubMed/NCBI
|
|
13
|
Smyth GK: Limma: linear models for
microarray data. Bioinformatics and Computational Biology Solutions
Using R and Bioconductor. Springer; New York: pp. 397–420. 2005,
View Article : Google Scholar
|
|
14
|
Eisen MB, Spellman PT, Brown PO and
Botstein D: Cluster analysis and display of genome-wide expression
patterns. Proc Natl Acad Sci USA. 95:14863–14868. 1998. View Article : Google Scholar : PubMed/NCBI
|
|
15
|
Page RD: TreeView: an application to
display phylogenetic trees on personal computers. Comput Appl
Biosci. 12:357–358. 1996.PubMed/NCBI
|
|
16
|
Huang da W, Sherman BT, Tan Q, et al: The
DAVID Gene Functional Classification Tool: a novel biological
module-centric algorithm to functionally analyze large gene lists.
Genome Biol. 8:R1832007.
|
|
17
|
Chan PP, Holmes AD, Smith AM, Tran D and
Lowe TM: The UCSC Archaeal Genome Browser: 2012 update. Nucleic
Acids Res. 40:D646–D652. 2012. View Article : Google Scholar : PubMed/NCBI
|
|
18
|
Kanehisa M and Goto S: KEGG: kyoto
encyclopedia of genes and genomes. Nucleic Acids Res. 28:27–30.
2000. View Article : Google Scholar : PubMed/NCBI
|
|
19
|
Shannon P, Markiel A, Ozier O, et al:
Cytoscape: a software environment for integrated models of
biomolecular interaction networks. Genome Res. 13:2498–2504. 2003.
View Article : Google Scholar : PubMed/NCBI
|
|
20
|
Nepusz T, Yu H and Paccanaro A: Detecting
overlapping protein complexes in protein-protein interaction
networks. Nat Methods. 9:471–472. 2012. View Article : Google Scholar : PubMed/NCBI
|
|
21
|
Prendergast G: Immune escape as a
fundamental trait of cancer: focus on IDO. Oncogene. 27:3889–3900.
2008. View Article : Google Scholar : PubMed/NCBI
|
|
22
|
Maehara Y, Tomisaki S, Oda S, et al: Lymph
node metastasis and relation to tumour growth potential and local
immune response in advanced gastric cancer. Int J Cancer.
74:224–228. 1997. View Article : Google Scholar : PubMed/NCBI
|
|
23
|
Atkins D, Ferrone S, Schmahl GE, Störkel S
and Seliger B: Down-regulation of HLA class I antigen processing
molecules: an immune escape mechanism of renal cell carcinoma? J
Urol. 171:885–889. 2004. View Article : Google Scholar : PubMed/NCBI
|
|
24
|
Cabrera T, Lara E, Romero JM, et al: HLA
class I expression in metastatic melanoma correlates with tumor
development during autologous vaccination. Cancer Immunol
Immunother. 56:709–717. 2007. View Article : Google Scholar
|
|
25
|
López-Nevot MA, Esteban F, Ferrón A,
Gutiérrez J, et al: HLA class I gene expression on human primary
tumours and autologous metastases: demonstration of selective
losses of HLA antigens on colorectal, gastric and laryngeal
carcinomas. Br J Cancer. 59:221–226. 1989.
|
|
26
|
Lee YS, Kim TE, Kim BK, et al: Alterations
of HLA class I and class II antigen expressions in borderline,
invasive and metastatic ovarian cancers. Exp Mol Med. 34:18–26.
2002. View Article : Google Scholar : PubMed/NCBI
|
|
27
|
Grünert S, Jechlinger M and Beug H:
Diverse cellular and molecular mechanisms contribute to epithelial
plasticity and metastasis. Nat Rev Mol Cell Biol. 4:657–665.
2003.PubMed/NCBI
|
|
28
|
Kaihara T, Kusaka T, Nishi M, et al:
Dedifferentiation and decreased expression of adhesion molecules,
E-cadherin and ZO-1, in colorectal cancer are closely related to
liver metastasis. J Exp Clin Cancer Res. 22:117–123.
2003.PubMed/NCBI
|
|
29
|
Nakata K, Ohuchida K, Nagai E, et al: LMO2
is a novel predictive marker for a better prognosis in pancreatic
cancer. Neoplasia. 11:712–719. 2009.PubMed/NCBI
|
|
30
|
Melino G: p63 is a suppressor of
tumorigenesis and metastasis interacting with mutant p53. Cell
Death Differ. 18:1487–1499. 2011. View Article : Google Scholar : PubMed/NCBI
|
|
31
|
Zhang Y, Sun R, Liu B, et al: TLR3
activation inhibits nasopharyngeal carcinoma metastasis via
down-regulation of chemokine receptor CXCR4. Cancer Biol Ther.
8:1826–1830. 2009. View Article : Google Scholar : PubMed/NCBI
|
|
32
|
González-Reyes S, Marín L, González L, et
al: Study of TLR3, TLR4 and TLR9 in breast carcinomas and their
association with metastasis. BMC Cancer. 10:6652010.PubMed/NCBI
|
|
33
|
Fang X, Cai Y, Liu J, et al: Twist2
contributes to breast cancer progression by promoting an
epithelial-mesenchymal transition and cancer stem-like cell
self-renewal. Oncogene. 30:4707–4720. 2011. View Article : Google Scholar : PubMed/NCBI
|
|
34
|
Li Y, Wang W, Wang W, et al: Correlation
of TWIST2 up-regulation and epithelial-mesenchymal transition
during tumorigenesis and progression of cervical carcinoma. Gynecol
Oncol. 124:112–118. 2012. View Article : Google Scholar : PubMed/NCBI
|
|
35
|
Ernst M, Najdovska M, Grail D, et al:
STAT3 and STAT1 mediate IL-11-dependent and inflammation-associated
gastric tumorigenesis in gp130 receptor mutant mice. J Clin Invest.
118:1727–1738. 2008.PubMed/NCBI
|
|
36
|
Khodarev NN, Roach P, Pitroda SP, et al:
STAT1 pathway mediates amplification of metastatic potential and
resistance to therapy. PLoS One. 4:e58212009. View Article : Google Scholar : PubMed/NCBI
|
|
37
|
Greenwood C, Metodieva G, Al-Janabi K, et
al: Stat1 and CD74 overexpression is co-dependent and linked to
increased invasion and lymph node metastasis in triple-negative
breast cancer. J Proteomics. 75:3031–3040. 2012. View Article : Google Scholar : PubMed/NCBI
|
|
38
|
Chen P, Zhao D, Sun Y, Huang L, Zhang S
and Yuan Y: Protein inhibitor of activated STAT-1 is downregulated
in gastric cancer tissue and involved in cell metastasis. Oncol
Rep. 28:2149–2155. 2012.PubMed/NCBI
|
|
39
|
Huang S, Bucana CD, Van Arsdall M and
Fidler IJ: Stat1 negatively regulates angiogenesis, tumorigenicity
and metastasis of tumor cells. Oncogene. 21:2504–2512. 2002.
View Article : Google Scholar : PubMed/NCBI
|
|
40
|
Park Y, Kim JW, Kim DS, et al: The bone
morphogenesis protein-2 (BMP-2) is associated with progression to
metastatic disease in gastric cancer. Cancer Res Treat. 40:127–132.
2008. View Article : Google Scholar : PubMed/NCBI
|
|
41
|
Kang MH, Oh SC, Lee HJ, et al: Metastatic
function of BMP-2 in gastric cancer cells: the role of PI3K/AKT,
MAPK, the NF-κB pathway, and MMP-9 expression. Exp Cell Res.
317:1746–1762. 2011.PubMed/NCBI
|
|
42
|
Matsui A, Yokoo H, Negishi Y, et al:
CXCL17 expression by tumor cells recruits
CD11b+Gr1high F4/80− cells and
promotes tumor progression. PLoS One. 7:e440802012. View Article : Google Scholar : PubMed/NCBI
|
|
43
|
Unoki M and Nakamura Y: EGR2 induces
apoptosis in various cancer cell lines by direct transactivation of
BNIP3L and BAK. Oncogene. 22:2172–2185. 2003. View Article : Google Scholar : PubMed/NCBI
|
|
44
|
Nakahara Y, Shiraishi T, Okamoto H, et al:
Detrended fluctuation analysis of genome-wide copy number profiles
of glioblastomas using array-based comparative genomic
hybridization. Neuro Oncol. 6:281–289. 2004. View Article : Google Scholar
|
|
45
|
Wu Q, Jin H, Yang Z, et al: MiR-150
promotes gastric cancer proliferation by negatively regulating the
pro-apoptotic gene EGR2. Biochem Biophys Res Commun. 392:340–345.
2010. View Article : Google Scholar : PubMed/NCBI
|
|
46
|
LaTulippe E, Satagopan J, Smith A, et al:
Comprehensive gene expression analysis of prostate cancer reveals
distinct transcriptional programs associated with metastatic
disease. Cancer Res. 62:4499–4506. 2002.
|
|
47
|
Li Y, Wang W, Wang W, et al: Correlation
of TWIST2 up-regulation and epithelial-mesenchymal transition
during tumorigenesis and progression of cervical carcinoma. Gynecol
Oncol. 124:112–118. 2012. View Article : Google Scholar : PubMed/NCBI
|
|
48
|
Li J, Ye L, Kynaston HG and Jiang WG:
Repulsive guidance molecules, novel bone morphogenetic protein
co-receptors, are key regulators of the growth and aggressiveness
of prostate cancer cells. Int J Oncol. 40:544–550. 2012.
|
|
49
|
Zhao ZW, Lian WJ, Chen GQ, et al:
Decreased expression of repulsive guidance molecule member A by DNA
methylation in colorectal cancer is related to tumor progression.
Oncol Rep. 27:1653–1659. 2012.PubMed/NCBI
|