Introduction
The suppressor of cytokine signaling (SOCS) family
consists of eight members, namely SOCS1-SOCS7 and CISH
(cytokine-inducible SH2-containing protein). They share a central
Src homology 2 domain and a highly conserved carboxy-terminal SOCS
box (1). The SOCS family regulates
cytokine secretion through the Janus kinase signal transduction and
activators of transcription (JAK-STAT) signal transduction pathway.
Although the functions of certain SOCS family members remain to be
determined, CISH, SOCS1, SOCS2 and SOCS3 have been identified to
negatively regulate the signal transduction of the cytokines
interleukin (IL)-2, IL-4, IL-6 and interferon (IFN)-γ (2–4). It
has also been observed that SOCS1 negatively regulates the JAK-STAT
signal transduction pathway, the signal pathway conducted by
negative feedback through the Toll-like receptor, cell
differentiation and cell maturation (5). The SOCS1 gene suppresses the activity
of dendritic cells (DCs), hence the silencing of the SOCS1 gene is
conducive to the activation of DCs (6). In addition, SOCS1 expression has been
shown to cause significant cancer cell immunity to antitumor
therapies in mice (7,8), and suppressing the expression of
SOCS3 has been shown to enhance the sensitivity of kidney cancer
cells to IFN-α (9,10). SOCS1 serves as a target for the
improvement of antigen presentation of DCs and macrophages, and it
has been used in the research and development of vaccines for HIV
and tumors (11,12). Furthermore, SOCS1 expression is
also observed in tumor cells, and the abnormal expression of SOCS1
has been observed in a number of types of tumors, including liver
cancer, melanoma and prostate cancer (13–15).
The role of SOCS1 in tumorigenesis and the
development of cancer is controversial. While it has been shown
that SOCS1 can inhibit the transformation of tumor cells, it has
additionally been verified that SOCS1 promotes tumor cell invasion
and metastasis (15). INF-γ is an
important mediator in melanoma immunotherapy. Through negative
feedback, SOCS1 regulates the IFN-γ signaling pathway and
influences the effect of IFN-γ on cells. In order to further verify
the correlation between SOCS1 and IFN-γ, the present study silenced
SOCS1 in Mel526 human melanoma cells in order to investigate their
sensitivity to IFN-γ.
Materials and methods
pshSOCS1 vector construction
SOCS1 interference was obtaine, according to the
previous study (16). The
synthesized small hairpin RNA oligonucleotide sequence (primer
design and synthesis undertaken by Shanghai Sangon Inc., Shanghai,
China) was annealed to form a double stranded DNA fragment and
cloned into an ENTR/U6 vector (Invitrogen Life Technologies,
Carlsbad, CA, USA), thereby generating the pshSOCS1 vector. A
BLOCK-iT™ U6 RNAi Entry Vector kit was purchased from Invitrogen
Life Technologies, a 2X Taq PCR MasterMix PCR Amplification kit was
purchased from Tiangen Inc. (Beijing, China) and the PCR Amplifier
used was the Gene Amp PCR system 9600 (PerkinElmer, New York,
USA).
Cell culture and transfection
Mel-526 human melanoma cells (American Type Culture
Collection, Manassas, VA, USA) were routinely cultured in
Dulbecco’s modified Eagle’s medium (DMEM) containing 10% fetal calf
serum (Hangzhou Sijiqing Biological Engineering Materials Co., Ltd,
Hangzhou, China). The solution was placed in an incubator with 5%
CO2 and saturated humidity at 37°C. Every 3–4 days, one
passage was conducted. Cells at the logarithmic phase were selected
and inoculated with a concentration of ~3×10⁶ cells/well
for each experiment. One day prior to transfection, cells were
plated in a 6-pore plate. Four hours after the transfection, the
medium was replaced and then transferred to a medium with blood
serum for culturing and further collection for analysis.
Lipofectamine 2000 (Invitrogen Life Technologies) was used for cell
transfection according to the manufacturer’s instructions and 48 h
later the cells were stimulated with IFN-γ (Peprotech, Princeton,
NJ, USA) for 4 h.
Reverse transcription-quantitative
polymerase chain reaction (RT-qPCR)
The transfected cells and normal cells were
collected 48 h posttransfection. TRIzol® (Invitrogen
Life Technologies) was used to extract the total RNA from the
cells. M-MLV reverse transcriptase (Huicheng Biotechnology Co.,
Ltd., Shanghai, China) was used to produce cDNA. With the cDNA in
each group as the template, a buffer primer solution was added for
PCR. The process was repeated for each sample three times. GAPDH
was used as an internal reference. The primers used were as
follows: Forward: 5′-ATGCAGTCTCCACAGCAGCAGAG-3′ and reverse:
5′-CGAACGGAATGTGCGGAAGTG-3′ for SOCS1; forward:
5′-TCTTCCCTCTTCCACTCGGAGTCG-3′ and reverse:
5′-CTTCTGACCCATGCCCACCA-3′ for IRF-1; and forward:
5′-GAAGGTGAAGGTCGGAGTC-3′ and reverse: 5′-GAAGATGGTGATGGGATTTC-3′
for GAPDH. The volume of the reaction system was 50 μl and the
reaction conditions were as follows: 5 min of pre-degeneration at
95°C followed by 40 cycles of 30 sec at 94°C, 30 sec of annealing
(SOCS1, 60°C; IRF-1, 56°C; GAPDH, 55°C), 1 min at 72°C, and
finishing with 7 min of annealing at 72°C. At the end of the PCR,
the loading buffer was added. The product was processed by 1.5%
agarose gel electrophoresis. The bands were observed using the
gel-imaging system (Bio-Rad, Hercules, CA, USA). The PCR kit used
was a Real-Time PCR kit purchased from Takara Bio, Inc. (Dalian,
China).
Western blot analysis
Transfected and normal cells were collected 48 h
post-transfection. Cells were washed twice with cold
phosphate-buffered saline (PBS), cell lysis buffer was added (25
mmol/l Tris-HCl, 10 mmol/l EDTA, a volume fraction of 0.01 NP-40,
150 mmol/l sodium chloride and 1 g/l phenylmethylsulfonyl
fluoride), and the solution was placed in an ice bath for 1 h. The
solution was centrifuged at 4°C and 16,000 g for 25 min. The
protein concentration of the supernatant was measured by the Lowry
method (17). Cell lysates (50 μg)
were extracted and electro-transferred to a polyvinylidene fluoride
(PVDF) membrane by SDS-PAGE gel electrophoresis. Skimmed milk
powder with the mass fraction of 0.05 was used to block the PVDF
membrane for 1 h, and STAT1 rabbit monoclonal (Abcam, London, UK),
p-STAT1 mouse monoclonal (Abcam, London, UK), SOCS-1 rabbit
anti-human (Millipore, Billerica, MA, USA) and β-actin rabbit
anti-human (ORI Gene, Beijing, China) monoclonal antibodies were
added to the solution and incubated at 4°C overnight. The membranes
were washed and goat anti-mouse or anti-rabbit antibodies labeled
with horseradish peroxidase (diluted at 1:5,000; ORI Gene, Beijing,
China) were added and the reaction was left for 2 h. The PVDF
membrane was cleaned, an Enhanced Chemiluminescence reagent was
added and the membrane was placed in an X-ray cassette, tableted,
developed in a dark room and finally fixed. A GDS8000 image
acquisition and analysis system (UVP Inc., Upland, CA, USA) was
used for image capture and quantitative analysis of the western
blots.
MTT assay
One day prior to the experiment, cells at
logarithmic phases were divided into 96-pore plates at a density of
1.0×10⁴ cells/pore. INF-γ and fluorouracil were added at
different concentrations. The INFγ and fluorouracil were prepared
with dimethyl sulfoxide (DMSO) or PBS to produce 10 mmol/l stock
solutions, and the working concentrations used were 0.625, 1.25,
2.5, 5.0, 10.0 and 20.0 μmol/l. A total of six multiple pores were
set up with each concentration to reduce deviation of the data and
improve accuracy. Following a 48-h culture, 4.5 g/l MTT solution
was added and the solution was cultured for 5 h at 37°C. The
supernatant was then discarded and 160 μl DMSO was added to each
pore. Subsequently, the light absorption values were measured at a
wavelength of 550 nm. Prism software v.4.0 (Graphpad Software, La
Jolla, CA, USA) was used to calculate the median inhibitory
concentration (IC50). The experiments were repeated
three times.
Cell proliferation
Cells were seeded into a 96-pore plate at a density
of 3×10⁴ cells/well, and three multiple pores were set
up for each time point to reduce deviation of the data and improve
accuracy. Cells were collected 6, 24, 48 and 72 h following the
transfection, the isopyknic living cell number was counted and the
rate of cell proliferation was calculated according to the number
of isopyknic living cells.
Cell cycle detection
Cells in the supernatant and the adherent cells were
collected 48 post-transfection, rinsed twice with PBS and the
solution was fixed for 24 h at 4°C using cold ethyl alcohol with a
volume fraction of 0.70. Subsequently, the cells were washed twice
with PBS and stained in the absence of light with propidium iodide
at 4°C for 30 min. A FACsort flow cytometer (BD Biosciences,
Franklin Lakes, NJ, USA) was used for the cell cycle analysis.
Statistical analysis
SPSS version 16.0 statistical software (SPSS Inc.,
Chicago, IL, USA) was used for statistical analysis. Data are
expressed as the mean ± standard deviation, and the mean comparison
was conducted with a t-test. P<0.05 was considered to indicate a
statistically significant difference.
Results
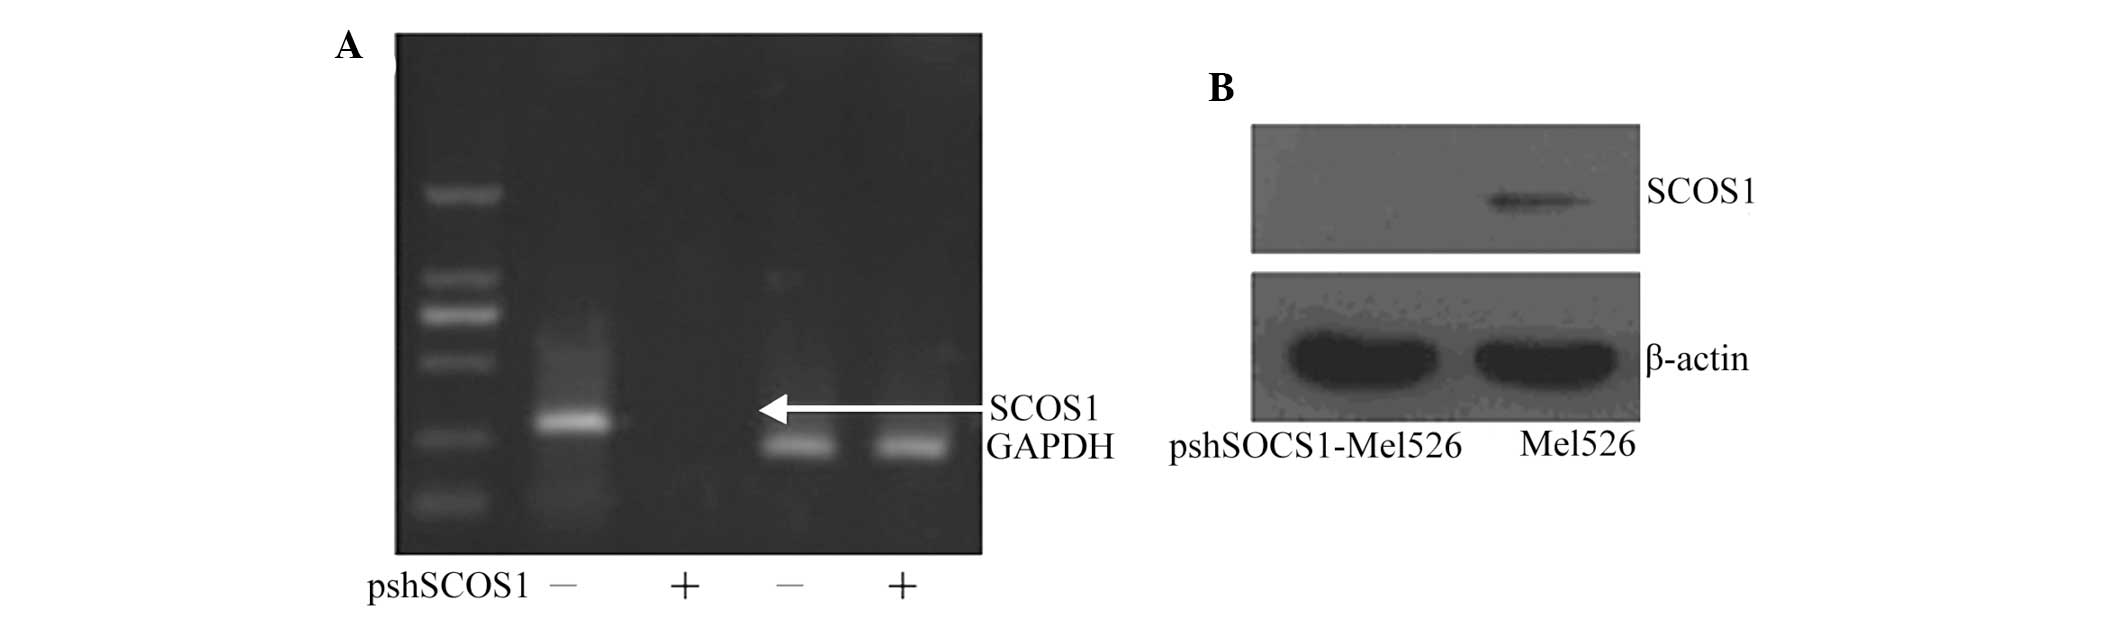
Verification of SOCS1 interference
effects
SOCS1 was effectively silenced in transfected cells
compared with that in the non-transfected cells (Fig. 1). The qPCR results showed that
SOCS1 expression was silenced by 90%.
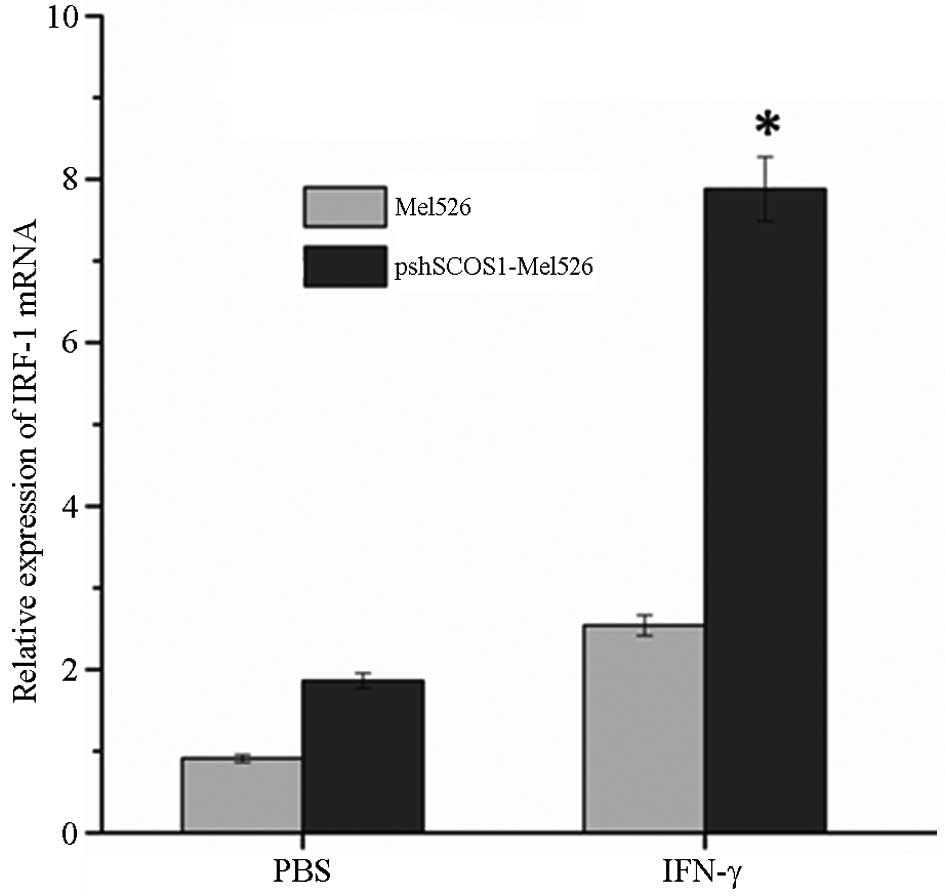
SOCS1 silencing significantly increases
the expression levels of IRF-1
SOCS1 efficiently regulates the signal transduction
pathway of cytokines via negative feedback. Analysis of the impact
of SOCS1 expression on the IFN-γ sensitivity of cells may aid in
predicting the lethal effects of IFN-γ on cells. Transfected Mel526
cells were subjected to 6 h of IFN-γ or isometric PBS stimulation
48-h post-transfection. The cells were collected for RT-qPCR
analysis to observe changes in the expression levels of nuclear
transcription factor IRF-1 following the activation of IFN-γ.
Compared with non-transfected cells SOCS1 silencing significantly
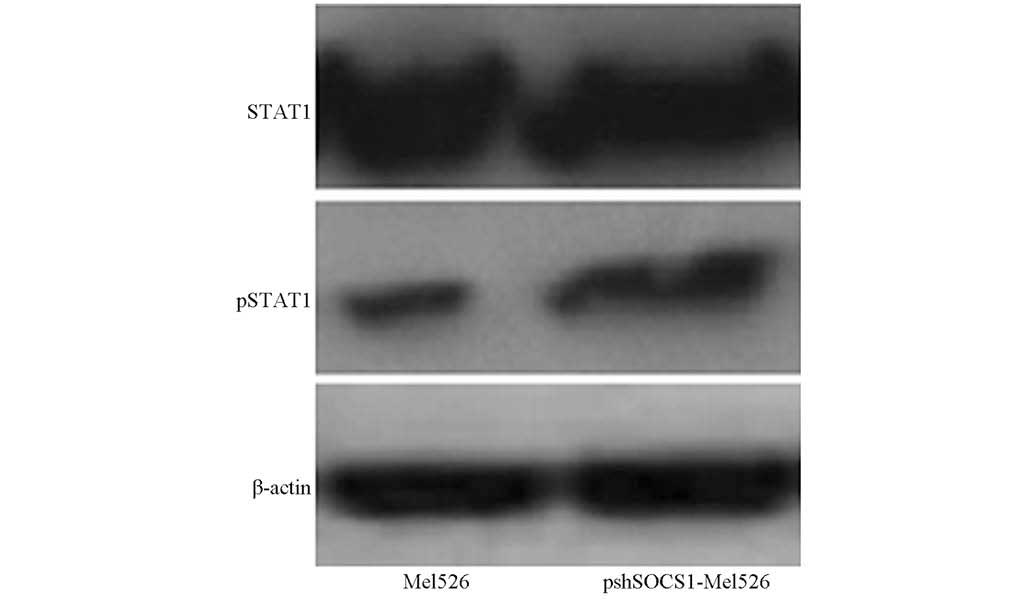
increased the expression levels of IRF-1 (P<0.05; Fig. 2). Subsequently, cells were gathered
for STAT1 and pSTAT1 detection. It was found that pSTAT1 expression
was greatly increased in the transfected cells (Fig. 3).
INF-γ sensitivity of cells improved
following SCOS1 silencing
The IC50 of chemotherapeutics INF-γ and
fluorouracil to Mel526 cells was detected with an MTT assay.
Compared with the null vector transfection group, the
IC50 of INF-γ and fluorouracil in Mel526 cells in the
transfection group was marginally reduced. There was no significant
difference between the IC50 of fluorouracil in the
Mel526 cells prior to and following SCOS1 silencing (P>0.05).
However, there was a significant difference between the
IC50 of INF-γ in Mel526 cells prior to and following
SCOS1 silencing (P<0.05, Table
I). This indicates that after the reduction in the expression
levels of SCOS1, the sensitivity of Mel526 cells to INF-γ was
greatly improved.
 | Table IIC50 of drugs in Mel526
cells prior to and following SOCS1 gene silencing. |
Table I
IC50 of drugs in Mel526
cells prior to and following SOCS1 gene silencing.
| IC50
(μmol/l) |
|---|
|
|
|---|
| Drug | Mel526 | pshSOCS1-Mel526 |
|---|
| IFN-γ | 10.32±0.18 | 4.27±0.26a |
| Fluorouracil | 4.57±0.37 | 3.61±0.25 |
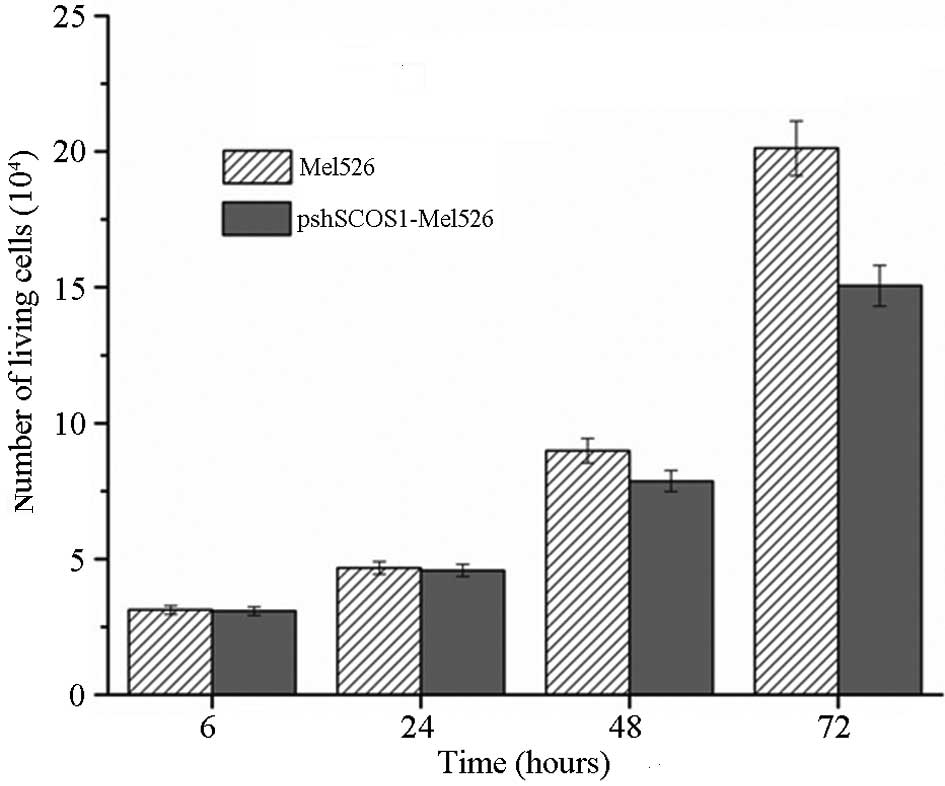
Cell proliferation
The number of cells 24 h following transfection was
not markedly changed. The number of Mel-526 cells after 48 h
exceeded that in the transfection group. The difference was clearer
after 72 h (Fig. 4).
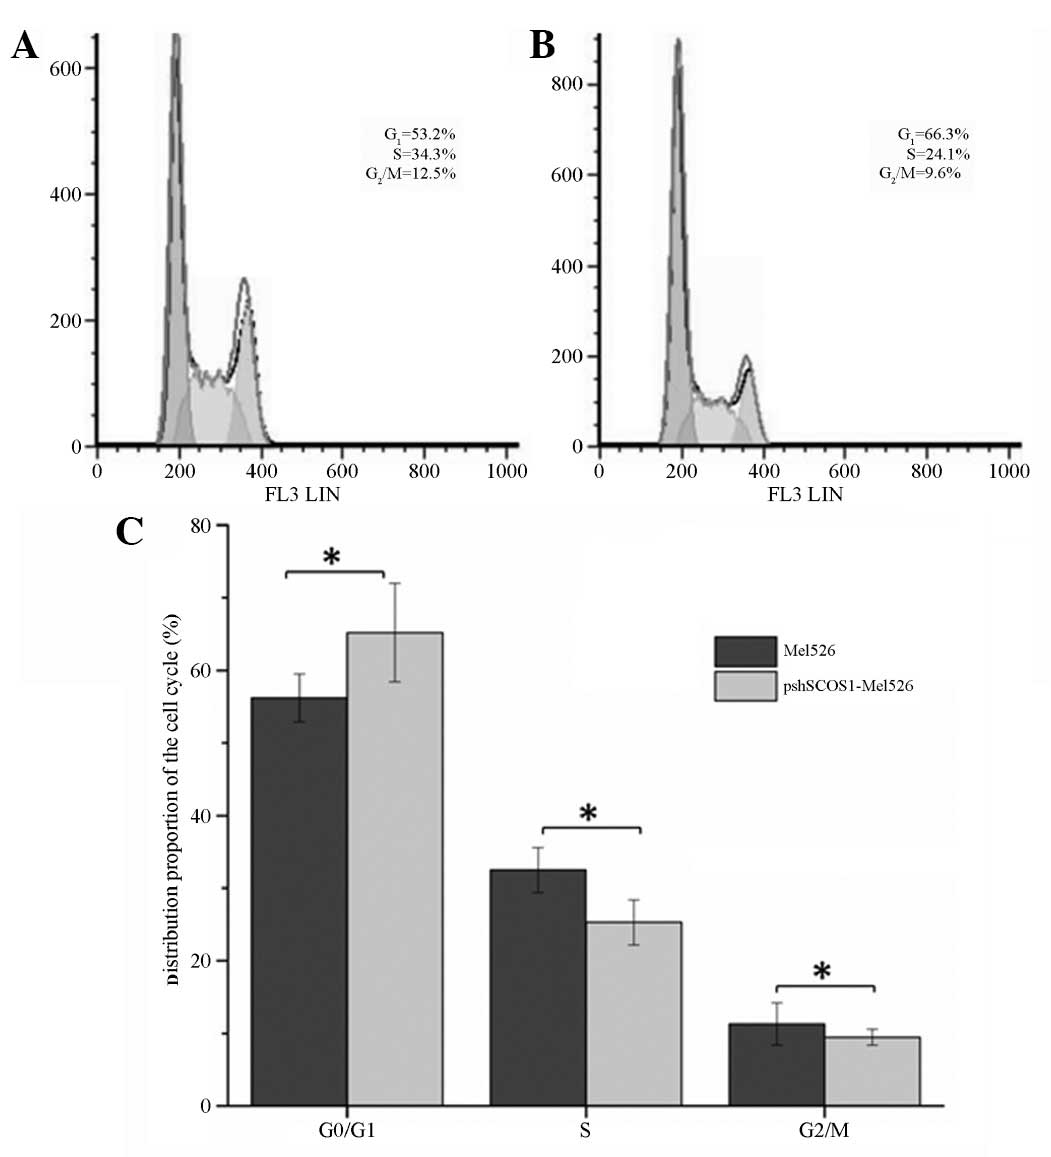
SOCS1 silencing alters the cell cycle
composition
Compared with the control group, following SCOS1
silencing, the ratio of cells in the G0/G1
phase significantly increased (P<0.05), but those in the S and
G2/M phases were significantly reduced (P<0.05;
Fig. 5). The results demonstrated
that SCOS1 silencing caused cell cycle arrest in the
G0/G1 phase.
Discussion
SOCS1 serves as an inhibitory molecule in a number
of types of tumors, including liver cancer (13), prostate cancer (15) and head and neck neoplasms (18). In tumor cells, SOCS1 expressions
levels have been shown to be reduced by certain mechanisms,
including the methylation of the promoter region (19), and SOCS1 was found to be methylated
in 60% of liver cancers (13).
Following the over-expression of SOCS1 in modified tumor cells,
cell apoptosis may be induced, thus inhibiting the tumor cell
proliferation. The reduction in expression levels of SOCS1 also
weakened its regulation of the JAK/STAT signaling pathway through
negative feedback, increasing the sensitivity of cells to a range
of inflammatory molecules and allowing other mechanisms to induce
the transformation of cells and generate tumors. The SOCS1
expression level has been shown to negatively correlate with the
degree of tumor infiltration (15,20,21);
however, the results of studies on the role of SOCS1 in
tumorigenesis of hormone-dependent malignancies were inconsistent.
In breast cancer, methylation was found to reduce the expression
level of SOCS1, and the overexpression can increase the SOCS1
expression and result in tumor suppression (22). However, certain studies have
proposed that the expression levels of SOCS1 in breast cancer were
higher than in healthy mammary tissues, but that in the breast
cancer cell line the expression did not rise. The high expression
levels of SOCS1 in tumor tissues may be caused by the stimulation
of inflammation stroma, such as GH growth hormone and prolactin
(23).
Among prostate cancer patients receiving castration,
the expression levels of SOCS1 were reduced. However, in patients
with recurring prostate cancer, the expression levels of SOCS1 were
increased, indicating that androgens may stimulate the expression
of SOCS1. This was verified by in vitro experiments
(24). Additionally, it has been
found that SOCS1 could lower the expression levels of cyclin and
cyclin-dependent kinase and inhibit cell growth. Among the
different types of melanoma, 75% were shown to have SOCS1
methylation (14). Furthermore,
the levels of SOCS1 expression in melanoma transfer sites was
reduced. An in vitro study found that overexpression of
SOCS1 in cells inhibited cell proliferation and metastasis
(22). However, other studies
identified that compared with healthy melanophores, higher levels
of SOCS1 expression were correlated with tumor metastasis and
invasion. Hence, SOCS1 expression may be a biomarker to predict
tumorigenesis and development (25). Additionally, high expression levels
of SOCS1 may influence the sensitivity of cells to diverse
cytokines, for example IFN-γ. For SOCS1-knockout mice, IFN-α
enhanced their antineoplastic activity through the action of CD4
and CD8 T cells (26). Induction
of SOCS1 expression enables the human T-lymphocytic leukemia virus
type 1 to avoid the antiviral activity of type I IFN (27). In addition, SOCS1 eliminates the
inhibitory effects of type I IFN on hepatitis C virus replication
(28). miR-122 adjusts the level
of type I IFN expression by blocking SOCS1 (29).
IFN-γ is an important cytokine in melanoma
immunotherapy, which regulates cell differentiation, proliferation
and other functions through the JAK/STAT signaling pathway. SOCS1
is a key negative regulator of the JAK/STAT signaling pathway and
may have a vital role in the reduction of IFN-γ sensitivity.
Clinically, a number of patients undergoing IFN-γ treatment show
IFN-γ resistance or insensitivity, which further limits the use of
IFN-γ and reduces its efficacy as a melanoma treatment. Thus,
silencing SOCS1 expression in cells to improve the sensitivity of
cells to IFN-γ may be important for the treatment of melanoma. In
the current study, with Mel526 cells as the experimental model, it
was found that silencing SOCS1 can improve IFN-γ sensitivity, thus
providing a novel approach to improve the efficacy of melanoma
immunotherapy. However, for different types of melanoma as the
experimental models, the experimental results can differ (30). Thus, a number of factors should be
integrated in the clinical translational research, including
pathological features and hormone-dependency.
The experimental results of the present study showed
that following the silencing of SOCS1 expression in Mel526 cells,
IFN-γ stimulation increased the levels of pSTAT1 expression, i.e.
the IFN-γ signaling pathway was enhanced. Thereby, it can increase
the expression of target genes and influence the growth of tumor
cells. In addition, IRF-1 expression was increased. The
aforementioned findings demonstrate that following silencing of
SOCS1, the sensitivity of cells to IFN-γ was enhanced. Furthermore,
it was found that silencing SOCS1 expression in Mel526 cells could
influence the cell cycle. During SOCS1 silencing, the S phase of
the cell cycle was extended. In other words, the replication time
of genetic material of cells was prolonged, which may inhibit the
proliferative ability of cells. The measurement of the cell
proliferation rate verified this phenomenon.
Enhancing the sensitivity of cells to IFN-γ is an
important approach in the treatment of melanoma. The results of the
current study showed that silencing SOCS1 expression in Mel526
cells significantly enhanced the cell sensitivity to IFN-γ and
influenced the cell cycle, leading to a prolonged S phase and
inhibition of the proliferation of tumor cells. These results
indicate that SOCS1 may be a vital target that influences
therapeutic effects of melanoma.
References
|
1
|
Linossi EM, Babon JJ, Hilton DJ and
Nicholson SE: Suppression of cytokine signaling: the SOCS
perspective. Cytokine Growth Factor Rev. 24:241–248. 2013.
View Article : Google Scholar : PubMed/NCBI
|
|
2
|
Shi J and Wei L: Regulation of JAK/STAT
signalling by SOCS in the myocardium. Cardiovasc Res. 96:345–347.
2012. View Article : Google Scholar : PubMed/NCBI
|
|
3
|
Tamiya T, Kashiwagi I, Takahashi R,
Yasukawa H and Yoshimura A: Suppressors of cytokine signaling
(SOCS) proteins and JAK/STAT pathways: regulation of T-cell
inflammation by SOCS1 and SOCS3. Arterioscler Thromb Vasc Biol.
31:980–985. 2011. View Article : Google Scholar : PubMed/NCBI
|
|
4
|
Yoshimura A, Suzuki M, Sakaguchi R, Hanada
T and Yasukawa H: SOCS, inflammation, and autoimmunity. Front
Immunol. 3:202012. View Article : Google Scholar
|
|
5
|
Bhattacharyya S, Zhao Y, Kay TW and Muglia
LJ: Glucocorticoids target suppressor of cytokine signaling 1
(SOCS1) and type 1 interferons to regulate Toll-like
receptor-induced STAT1 activation. Proc Natl Acad Sci USA.
108:9554–9559. 2011. View Article : Google Scholar : PubMed/NCBI
|
|
6
|
Satou R, Miyata K, Gonzalez-Villalobos RA,
Ingelfinger JR, Navar LG and Kobori H: Interferon-γ biphasically
regulates angiotensinogen expression via a JAK-STAT pathway and
suppressor of cytokine signaling 1 (SOCS1) in renal proximal
tubular cells. FASEB J. 26:1821–1830. 2012.
|
|
7
|
Hong B, Ren W, Song XT, Evel-Kabler K,
Chen SY and Huang XF: Human SOCS1 controls immuno-stimulatory
activity of monocyte derived dendritic cells. Cancer Res.
69:8076–8084. 2009. View Article : Google Scholar : PubMed/NCBI
|
|
8
|
Hu Q, Qin X, Qian G, et al: SOCS1
silencing can break high-dose dendritic cell immuno therapy induced
immune tolerance. Mol Med Report. 1:61–70. 2008.PubMed/NCBI
|
|
9
|
Ortiz-Muñoz G, Martin-Ventura JL,
Hernandez-Vargas P, et al: Suppressors of cytokine signaling
modulate JAK/STAT mediated cell responses during atherosclerosis.
Arterioscler Thromb Vasc Biol. 29:525–531. 2009.PubMed/NCBI
|
|
10
|
Tomita S, Ishibashi K, Hashimoto K, et al:
Suppression of SOCS3 increases susceptibility of renal cell
carcinoma to interferon-α. Cancer Sci. 102:57–63. 2011.PubMed/NCBI
|
|
11
|
Evel-Kabler K, Song XT, Aldrich M, Huang
XF and Chen SY: SOCS1 restricts dendritic cells’ ability to break
self tolerance and induce antitumor immunity by regulating IL-12
production and signaling. J Clin Inves. 116:90–100. 2006.
|
|
12
|
Song XT, Evel-Kabler K, Rollins L, Aldrich
M, Gao F, Huang XF and Chen SY: An alternative and effective HIV
vaccination approach based on inhibition of antigen presentation
attenuators in dendritic cells. PLoS Med. 3:e112006. View Article : Google Scholar : PubMed/NCBI
|
|
13
|
Chu PY, Yeh CM, Hsu NC, Chang YS, Chang JG
and Yeh KT: Epigenetic alteration of the SOCS1 gene in
hepatocellular carcinoma. Swiss Med Wkly. 140:w130652010.PubMed/NCBI
|
|
14
|
Liu S, Ren S, Howell P, Fodstad O and
Riker AI: Identification of novel epigenetically modified genes in
human melanoma via promoter methylation gene profiling. Pigment
Cell Melanoma Res. 21:545–558. 2008. View Article : Google Scholar : PubMed/NCBI
|
|
15
|
Neuwirt H, Puhr M, Santer FR, et al:
Suppressor of cytokine signaling (SOCS)-1 is expressed in human
prostate cancer and exerts growth-inhibitory function through
down-regulation of cyclins and cyclin-dependent kinases. Am J
Pathol. 174:1921–1930. 2009. View Article : Google Scholar
|
|
16
|
Lesinski GB, Zimmerer JM, Kreiner M, et
al: Modulation of SOCS protein expression influences the interferon
responsiveness of human melanoma cells. BMC Cancer. 10:1422010.
View Article : Google Scholar : PubMed/NCBI
|
|
17
|
Kusunoki H, Okuma K and Hamaguchi I:
Estimation of lactose interference in vaccines and a proposal of
methodological adjustment of total protein determination by the
lowry method. Jpn J Infect Dis. 65:489–494. 2012. View Article : Google Scholar : PubMed/NCBI
|
|
18
|
Starska K, Forma E, Lewy-Trenda I,
Stasikowska O, Bryś M, Krajewska WM and Łukomski M: The expression
of SOCS1 and TLR4-NFkappaB pathway molecules in neoplastic cells as
potential biomarker for the aggressive tumor phenotype in laryngeal
carcinoma. Folia Histochem Cytobiol. 47:401–410. 2009.
|
|
19
|
Ko E, Kim SJ, Joh JW, Park CK, Park J and
Kim DH: CpG island hypermethylation of SOCS-1 gene is inversely
associated with HBV infection in hepatocellular carcinoma. Cancer
Lett. 271:240–250. 2008. View Article : Google Scholar : PubMed/NCBI
|
|
20
|
Cooper JC, Shi M, Chueh FY, Venkitachalam
S and Yu CL: Enforced SOCS1 and SOCS3 expression attenuates
Lck-mediated cellular transformation. Int J Oncol. 36:1201–1208.
2010.PubMed/NCBI
|
|
21
|
Huang FJ, Steeg PS, Price JE, et al:
Molecular basis for the critical role of suppressor of cytokine
signaling-1 in melanoma brain metastasis. Cancer Res. 68:9634–9642.
2008. View Article : Google Scholar : PubMed/NCBI
|
|
22
|
Sutherland KD, Lindeman GJ, Choong DY, et
al: Differential hypermethylation of SOCS genes in ovarian and
breast carcinomas. Oncogene. 23:7726–7733. 2004. View Article : Google Scholar : PubMed/NCBI
|
|
23
|
Sasi W, Jiang WG, Sharma A and Mokbel K:
Higher expression levels of SOCS 1,3,4,7 are associated with
earlier tumour stage and better clinical outcome in human breast
cancer. BMC Cancer. 10:1782010. View Article : Google Scholar : PubMed/NCBI
|
|
24
|
Neuwirt H, Puhr M, Santer FR, et al:
Suppressor of cytokine signaling (SOCS)-1 is expressed in human
prostate cancer and exerts growth-inhibitory function through
down-regulation of cyclins and cyclin-dependent kinases. Am J
Pathol. 174:1921–1930. 2009. View Article : Google Scholar : PubMed/NCBI
|
|
25
|
Scutti JA, Matsuo AL, Pereira FV, et al:
Role of SOCS-1 gene on melanoma cell growth and tumor development.
Transl Oncol. 4:101–109. 2011. View Article : Google Scholar : PubMed/NCBI
|
|
26
|
Guenterberg KD, Lesinski GB, Mundy-Bosse
BL, Karpa VI, Jaime-Ramirez AC, Wei L and Carson WE III: Enhanced
anti-tumor activity of interferon-alpha in SOCS1-deficient mice is
mediated by CD4- and CD8- T cells. Cancer Immunol Immunother.
60:1281–1288. 2011. View Article : Google Scholar : PubMed/NCBI
|
|
27
|
Olière S, Hernandez E, Lézin A, et al:
HTLV-1 evades type I interferon antiviral signaling by inducing the
suppressor of cytokine signaling 1 (SOCS1). PLoS Pathog.
6:e10011772010.PubMed/NCBI
|
|
28
|
Shao RX, Zhang L, Hong Z, et al: SOCS1
abrogates IFN’s antiviral effect on hepatitis C virus replication.
Antiviral Res. 97:101–107. 2013.
|
|
29
|
Li A, Song W, Qian J, et al: MiR-122
modulates type I interferon expression through blocking suppressor
of cytokine signaling 1. Int J Biochem Cell Biol. 45:858–865. 2013.
View Article : Google Scholar : PubMed/NCBI
|
|
30
|
Mathieu MG, Miles AK, Ahmad M, et al: The
helicase HAGE prevents interferon-α-induced PML expression in
ABCB5+ malignant melanoma-initiating cells by promoting the
expression of SOCS1. Cell Death Dis. 5:e10612014.PubMed/NCBI
|