Introduction
Diabetes mellitus (or diabetes) is a chronic disease
that seriously affects human health. The World Health Organization
estimated ~285 million diabetes sufferers worldwide in 2010, and
this number is expected to increase to 360 million by 2030
(1). In total, ~90% of the cases
are Type 2 diabetes (T2DM), which has a more complex pathogenesis
than Type 1. T2DM is a multi-factorial disease characterized by
peripheral insulin resistance (2),
occasionally combined with an absolute lack of insulin.
Several large genetic association studies and
genome-wide association studies have revealed significant genes
consistently associated with susceptibility to T2DM, including
cyclin-dependent kinase inhibitor 2A/2B, CDK5 regulatory subunit
associated protein 1-like 1, insulin-like growth factor 2 mRNA
binding protein 2 and others (3).
Although these findings have facilitated the understanding of the
genetic causes of T2DM, this is not sufficient to elucidate the
progress and development of the disease, since the relative
expression of genes is also altered in a tissue- and time-specific
manner as the disease progresses.
Gene expression microarrays are a high-throughput
technology, which can be used for systematic studies of complex
molecular processes, including tissue development and
differentiation and for diseases, including cancer and diabetes.
Gene expression microarrays can give a genome-wide view of the way
genes are regulated at the transcriptional level in different
tissues at different time-points. Over the last two decades
microRNAs (miRNAs) have been found to act as key regulators of the
expression of multiple genes at the post-transcriptional level
(4), and it is now understood that
~30% of all the coding genes in the human genome are regulated by
miRNAs (5), including genes
involved in cell proliferation and differentiation, apoptosis and
metabolism (6). Additionally,
miRNAs also have roles in pathogenic processes, including cancer
(7,8) and inflammatory diseases (9).
Numerous gene expression studies have been
undertaken on T2DM, either on the pancreatic islets (10) or peripheral organs, including
muscle (11), kidney (12), liver (13) and adipose tissues (14). However, the simultaneous
examination of mRNA and miRNA gene expression and analysis of their
association in the same T2DM model tissue has not been previously
elucidated. In the present study, the mRNA and miRNA expression
profiles of pancreatic tissue from T2DM Goto-Kakizaki (GK) rats
were examined, and miRNA-mRNA regulatory networks were constructed
based on statistical analysis of the data, which are noteworthy of
further functional analysis.
Materials and methods
Animals
GK rats were purchased from the Shanghai SiLaike
Laboratory Animal Company (Shanghai, China) and Wistar rats were
from the Beijing Weitonglihua Laboratory Animal Center (Beijing,
China). All the rats were housed in the Animal House of Tsinghua
University (Beijing, China) and used in compliance with the
National Insurance of Health Guidance for the Care and Use of
Laboratory Animals. The 13–14 week-old male GK and Wistar rats
(300–400 g) were fed a normal diet. The present study was approved
by the Ethics Committee of Tsinghua University School of Medicine
(Beijing, China).
Islet preparation and RNA extraction
Pancreas islets were isolated from the pancreas of
the male GK and Wistar rats using a collagenase digestion
technique. In brief, the pancreases were distended via intraductal
injection of 3 ml 0.5 mg/ml collagenase (type V, C-9263, Invitrogen
Life Technologies, Carlsbad, CA, USA) into the duodenal nipple
following occlusion of the common bile duct. The pancreases were
then surgically removed and further digested in 2 ml 0.5 mg/ml
collagenase for 30 min at 37°C. Islet digests were then vigorously
agitated and quenched by the addition of ice-cold Hank’s balanced
salt solution (HBSS) supplemented with 12.5% fetal bovine serum
(FBS; Gibco Laboratories, Grand Island, NY, USA). The suspension
was washed twice to remove collagenase (in HBSS, 1,500 xg, 10 sec,
4°C) in order to separate the islets from the surrounding
undigested tissue.
Pancreatic islet cell resuspensions, with 70–80%
purity of islet cells, were cultured in RPMI-1640 medium (Gibco
Laboratories) with 15% FBS (v/v), 100 μg/ml penicillin, and then
incubated at 37°C under humidified conditions with 5%
CO2. RNA extraction for the tissue samples was
undertaken with TRIzol (Invitrogen Life Technologies) following the
manufacturer’s instructions.
miRNA microarrays
Comprehensive miRNA profiling was performed using
the GeneChip® miRNA 2.0 Array (Affymetrix, Santa Clara,
CA, USA) according to the manufacturer’s instructions. Briefly, RNA
from three GK or Wistar rat islets was mixed into a pool,
respectively, and 1 μg total RNA was labeled with the Biotin
FlashTag Biotin Labeling Kit (Affymetrix). The labeling reaction
was hybridized on the miRNA array in an Affymetrix Hybridization
Oven 640 (Affymetrix). The arrays were stained on the Fluidics
Station 450 and then scanned on a GeneChip® Scanner 3000
(both Affymetrix).
Quantitative polymerase chain reaction
(qPCR)
qPCR analysis was performed in order to verify the
expression results obtained with the Affymetrix miRNA expression
platform (Affymetrix). Stem-loop reverse transcription (RT)-PCR
assays were performed according to the method by Chen et al
(15) using a SuperGreen
quantitative PCR kit (CapitalBio Corp., Beijing, China) in a
LightCycler (Roche Diagnostics, Basel Switzerland). The relative
expression was calculated using the following formula:
Q=2−ΔΔCT, where ΔΔCT=ΔCTsample -
ΔCTcontrol; ΔCT=average CT test miRNA -
averageCT internal control, and CT stands for cycle
threshold. Let-7c was used as an internal standard. The stem-loop
RT primer and PCR primers for each miRNA are available upon
request. Statistical significance was determined by a student’s
t-test, using SPSS software version 20.0 (SPSS, Inc, Chicago, IL,
USA). P<0.05 was considered to indicate a statistically
significant difference.
Gene expression microarrays
The 27K Rat Genome Array chips
(SmartArrayTM, CapitalBio Corp), were used to profile
gene expression in islets from GK/Wistar rats according to the
manufacturer’s instructions. Briefly, RNA from three GK or Wistar
rat islets was mixed into a pool, respectively and the total RNA
samples (100 ng) were reversely transcribed using Moloney Murine
leukemia virus (Takara Chemicals, Shiga, Japan) and amplified by an
in vitro transcription based method. The Cyanine 3 (Cy3) or
Cyanine 5 (Cy5)-labeled cDNAs were hybridized to the CapitalBio 27K
rat genome array for 16 h at 42°C. The arrays were scanned with a
LuxScanTM 10K-A confocal scanner, and the data were
extracted with GenePix pro4.0 software (both CapitalBio).
Gene Ontology analysis and pathway
identification
The web-based Molecule Annotation System [(MAS):
http://bioinfo.capitalbio.com/mas] was
used to identify the possible functions of the
differentially-expressed genes. The MAS is a data-mining and
function-annotation tool using all the known genes in the human
genome as a background. The P-value of the pathway was calculated
using a hyper-geometric distribution. The Q-value is a measure in
terms of the false discovery rate (FDR). The pathways with
Q-value<0.05 were considered statistically significantly
enriched in the input set of host genes.
Confident prediction of microRNA targets
combined with gene expression profiles
Bioinformatics prediction of miRNA
targets
Two different databases were used for miRNA target
predictions, MiRanda (www.microrna.org/microrna/getDownloads.do) and
Targetscan (www.targetscan.org/mmu_60/), and only those targets
predicted by both databases were selected.
Combining predicted targets with gene
expression profiles
Typically, miRNAs downregulate target gene
expression, thus it was assumed that the expression of a given
miRNA would be reversely correlated with the mRNA expression of its
targets. Based on bioinformatics prediction, only microRNA-target
gene pairs with such opposing expression patterns were
selected.
Functional enrichment analysis of
miRNA target genes
The parameter θ was used to reflect the miRNA-target
regulation strength. θ is defined as (|FCm-1/FCg|), where FCm
represents the fold change in miRNA expression and FCg represents
the fold change in target gene expression. A stronger miRNA-target
gene regulatory correlation (i.e. a higher θ value)
theoretically indicates a more significant regulatory correlation
between miRNA and the target gene.
Results
miRNA microarray analysis and qPCR
confirmation of GK rats
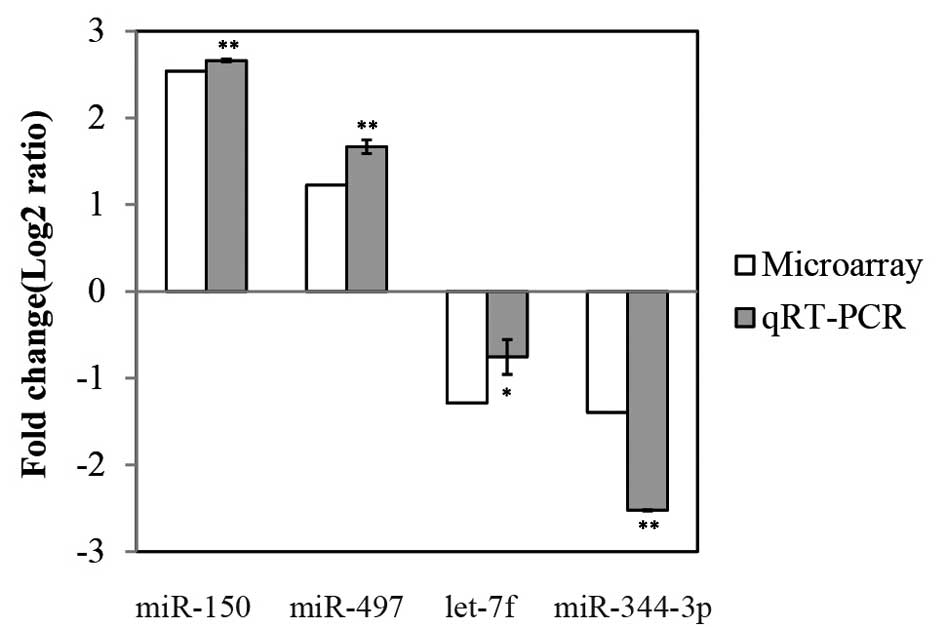
miRNA expression analysis was performed by
microarray of islets from diabetic GK rats and normal Wistar rats
and it was identified that a total of 19 miRNAs were >2-fold
upregulated or downregulated in GK rats as compared with the
controls (Table I). Among the
miRNAs, miR-214, miR-199a-5p, miR-150, miR-199a-3p, miR-351,
miR-145, miR-764, miR-497 and miR-92b were upregulated, whilst
miR-7a, miR-325-5p, miR-485, miR-708, miR-344-3p, let-7f, miR-26b,
miR-129, miR-29c and let-7a were downregulated. Stem-loop RT-PCR
was used to confirm the expression levels of four selected miRNAs,
in which miR-150 and miR-497 demonstrated upregulation, whereas
miR-344-3p and let-7f showed downregulation, confirming the changes
detected by the microarray (Fig.
1; P<0.05).
 | Table INineteen differentially-expressed
miRNAs between GK and Wistar rats. |
Table I
Nineteen differentially-expressed
miRNAs between GK and Wistar rats.
| Gene
expression | miRNA | Fold change |
|---|
| Upregulated | rno-miR-214 | 12.7232 |
|
rno-miR-199a-5p | 7.2678 |
| rno-miR-150 | 5.8137 |
|
rno-miR-199a-3p | 4.3030 |
| rno-miR-351 | 3.5565 |
| rno-miR-145 | 2.7425 |
| rno-miR-764 | 2.6075 |
| rno-miR-497 | 2.3444 |
| rno-miR-92b | 2.2852 |
| Downregulated | rno-miR-7a | 0.2137 |
| rno-miR-325-5p | 0.2871 |
| rno-miR-485 | 0.3500 |
| rno-miR-708 | 0.3693 |
| rno-miR-344-3p | 0.3794 |
| rno-let-7f | 0.4109 |
| rno-miR-26b | 0.4590 |
| rno-miR-129 | 0.4715 |
| rno-miR-29c | 0.4907 |
| rno-let-7a | 0.4970 |
Gene expression profiling of GK rats
CaptitalBio 27K Rat Genome Array chips were used to
evaluate the expression of target genes for differentially
expressed miRNAs in GK rats. A total of 670 genes were
differentially expressed (fold change >2.0) in GK rats compared
to Wistar rats. Among them, 370 genes were found upregulated, while
247 were downregulated. The top ten differentially upregulated or
downregulated genes are listed in Fig.
2A.
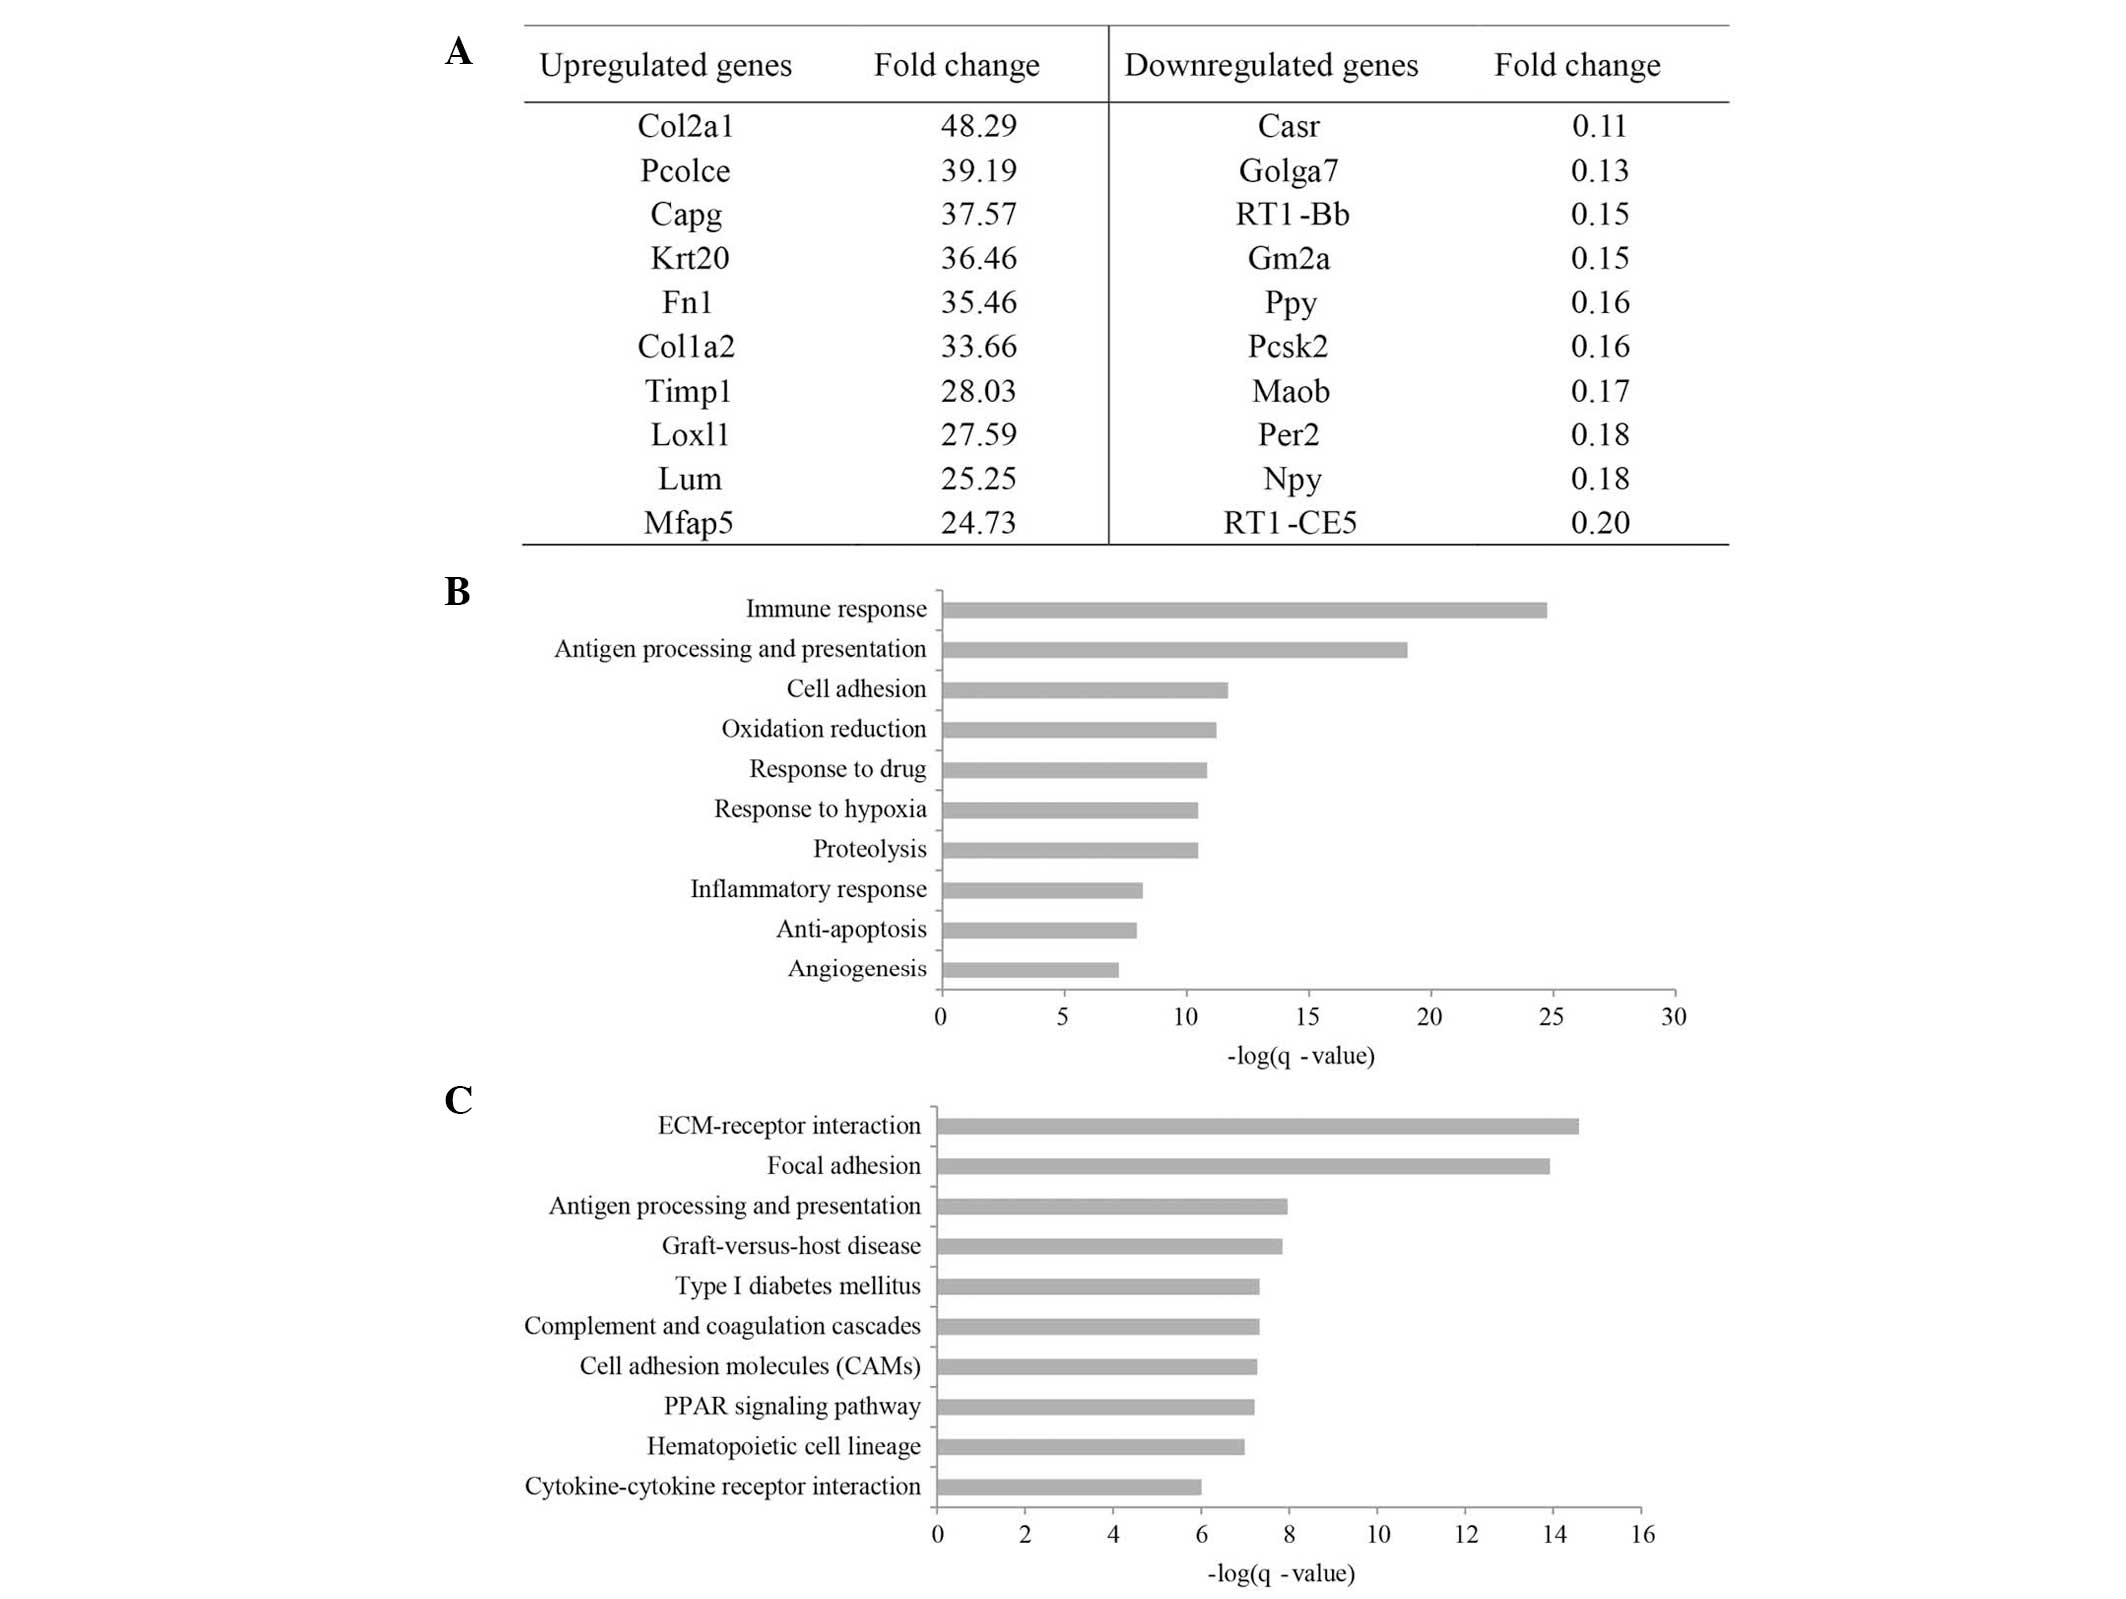 | Figure 2Functional analysis of the gene
microarray results for GK rats. (A) Top ten differentially
downregulated and -upregulated genes in GK rats compared to Wistar
rats. (B) Top ten significantly enriched GO items (Biological
process) for differentially-expressed genes between GK and Wistar
rats. (C) Top ten significantly-enriched pathways (Kyoto
Encyclopedia of Genes and Genomes) for differentially expressed
genes between GK and Wistar rats. GK, Goto-Kakizaki; GO, Gene
Ontology; Col2a1, collagen, type II, alpha 1; Pcolce,
procollagen C-endopeptidase enhancer; Capg,
macrophage-capping protein; Krt, keratin; Fn, fibronectin;
Colla2, collagen, type I, alpha 2; TIMP1, tissue
inhibitor of metalloproteinase-1; Loxl1, lysyl oxidase-like
1; Lum, lumican; Mfap5, microfibrillar associated
protein 5; Casr, calcium-sensing receptor; Golga7,
golgin A7; Gm2a, GM2 ganglioside activator; Ppy,
pancreatic polypeptide; Pcsk2, proprotein convertase
subtilisin/kexin type 2; Maob, monoamine oxidase B;
Per2, period circadian clock 2; Npy, neuropeptide Y;
ECM, extracellular matrix. |
GO analysis (using the MAS bioinformatics tool) of
the 670 differentially expressed genes revealed a number of
statistically representative enriched GO items for biological
processes, which are shown in Fig.
2B. The expression of genes with roles in immune responses,
cell adhesion, oxidation/reduction and response to hypoxia were
each significantly altered in GK rats.
MAS provided analysis of the canonical pathways in
which the differentially expressed genes are involved. At an FDR of
1%, 27 pathways that were statistically significantly enriched in
the identified genes were found, compared with the whole genome
expression as the background. Of note, the identified pathways
included extracellular matrix (ECM)-receptor interaction, focal
adhesion, type I diabetes mellitus and peroxisome
proliferator-activated receptor signaling pathways (Fig. 2C).
Construction of the miRNA-mRNA regulatory
networks
Typically, miRNAs regulate gene expression either
through mRNA degradation or translational repression, depending on
the degree of complementarity between miRNAs and their target gene
sequences (16). In the present
study, it was assumed that the expression of a given miRNA was
inversely correlated with the mRNA expression of its putative
targets. This bioinformatics prediction was combined with the
miRNA/mRNA expression data of the present study to generate
miRNA-mRNA regulatory networks.
Based on each of the putative miRNA-mRNA regulatory
correlation, it was found that several miRNAs regulated more than
one target gene, and that numerous genes were regulated by more
than one miRNA. Among all the differentially expressed miRNAs,
miR-485 had the most regulatory targets (32 target genes) and among
the differentially expressed mRNAs, phosphoprotein enriched in
astrocytes 15 (Pea15a), guanylate cyclase 1, soluble, alpha
3 (Gucy1a3), PDZK1 interacting protein 1 (Pdzk1ip1),
connective tissue growth factor (Ctgf), inositol
1,4,5-triphosphate 3-kinase C (Itpkc) and heat shock protein
5 (Hspa5) had most regulatory miRNAs (each had 4 potential
controlling miRNAs). Those miRNAs targeting multiple genes and
those genes targeted by multiple miRNAs may be the nodal points of
the whole regulatory network and may have more significant
functions. The top 10 nodal miRNAs and mRNAs that had the most
regulatory correlations are listed in Table II.
| Table IINumber of target genes for top 10
nodal miRNAs and the number of regulatory miRNAs for top 10 nodal
genes. |
Table II
Number of target genes for top 10
nodal miRNAs and the number of regulatory miRNAs for top 10 nodal
genes.
| microRNA | Number of
targets | Gene symbol | Number of
microRNA |
|---|
| rno-miR-485 | 32 | Pea15a | 4 |
| rno-miR-129 | 29 | Gucy1a3 | 4 |
| rno-miR-7a | 23 |
Pdzk1ip1 | 4 |
| rno-miR-214 | 19 | Ctgf | 4 |
| rno-miR-145 | 18 | Itpkc | 4 |
| rno-let-7a | 17 | Hspa5 | 4 |
| rno-miR-29c | 17 | Snx27 | 3 |
| rno-miR-92b | 17 | Nid67 | 3 |
| rno-let-7f | 16 |
Atp6v1b2 | 3 |
| rno-miR-26b | 16 | Sv2a | 3 |
| | LOC501110 | 3 |
| | Ist1 | 3 |
| | Pde4b | 3 |
| | Ccng1 | 3 |
| | Sparc | 3 |
| | Eif4b | 3 |
| | Nras | 3 |
| | Acadl | 3 |
| | Sult1a1 | 3 |
| | Txnip | 3 |
The significant levels of all pair-wise correlations
between differentially-expressed miRNAs and mRNAs were evaluated
through the parameter θ. In general, a stronger miRNA-mRNA
regulatory correlation (i.e. a higher θ value) theoretically
indicates more significant functions. The top 10 strongest
miRNA-mRNA regulatory correlations are listed in Table III. Based on the results of the
present study, the pair of miRNA-mRNA, let-7f/collagenase type II,
alpha 1 (Col2a1) had the strongest regulatory correlation
and could have significant roles in T2DM.
| Table IIITop 10 strongest miRNA-mRNA
regulatory correlations. |
Table III
Top 10 strongest miRNA-mRNA
regulatory correlations.
| miRNA | Gene symbol | FC | FC of gene | Distance between
changes |
|---|
| rno-let-7f | Col2a1 | 0.4109 | 48.2899 | 50.72358 |
| rno-let-7a | Col2a1 | 0.4970 | 48.2899 | 50.30197 |
| rno-miR-485 | Tspan1 | 0.3500 | 43.6812 | 46.53834 |
| rno-miR-7a | Col1a2 | 0.2137 | 33.6643 | 38.34376 |
| rno-miR-129 | Lum | 0.4715 | 25.2511 | 27.37199 |
| rno-let-7f | Cyp2c22 | 0.4109 | 24.1817 | 26.61538 |
| rno-miR-29c | Pcolce | 0.4907 | 24.575 | 26.61291 |
| rno-miR-29c | Lrrc17 | 0.4907 | 24.4755 | 26.51341 |
| rno-let-7a | Cyp2c22 | 0.4970 | 24.1817 | 26.19377 |
| rno-miR-7a | Ctgf | 0.2137 | 20.6531 | 25.33256 |
Analysis of individual miRNA-mRNA
regulatory correlation
Functional annotation analysis for the target genes
of individual differentially expressed miRNA was undertaken, and 14
out of 19 differentially expressed miRNAs were identified to
demonstrate at least one significantly enriched item of either GO
or Pathway analysis for its target genes. These miRNAs include
miR-214, miR-199a-5p, miR-150, miR-351, miR-145, miR-92b, miR-7a,
miR-485, miR-708, let-7f, miR-26b, miR-129, miR-29c and let-7a.
For example, let-7f was found downregulated in GK
rats by both the microarray and qPCR test and had a total of 16
target genes whose expression levels were elevated in GK rats
(Fig. 3A). Pathway analysis of
these 16 target genes indicated that numerous genes were involved
in the drug metabolism, amongst others (Fig. 3B). By contrast, miR-150 was one of
the upregulated miRNAs in GK rats and had 11 target genes
downregulated in the GK rats (Fig.
3C). A GO analysis of these targets indicated that biological
processes, including response to glucose stimulus, positive
regulation of insulin secretion and others were overrepresented
(Fig. 3D). The complete list of
all the target genes of each of the 14 miRNAs and the complete list
of significantly enriched items for target genes of each of the 14
miRNAs is available upon request.
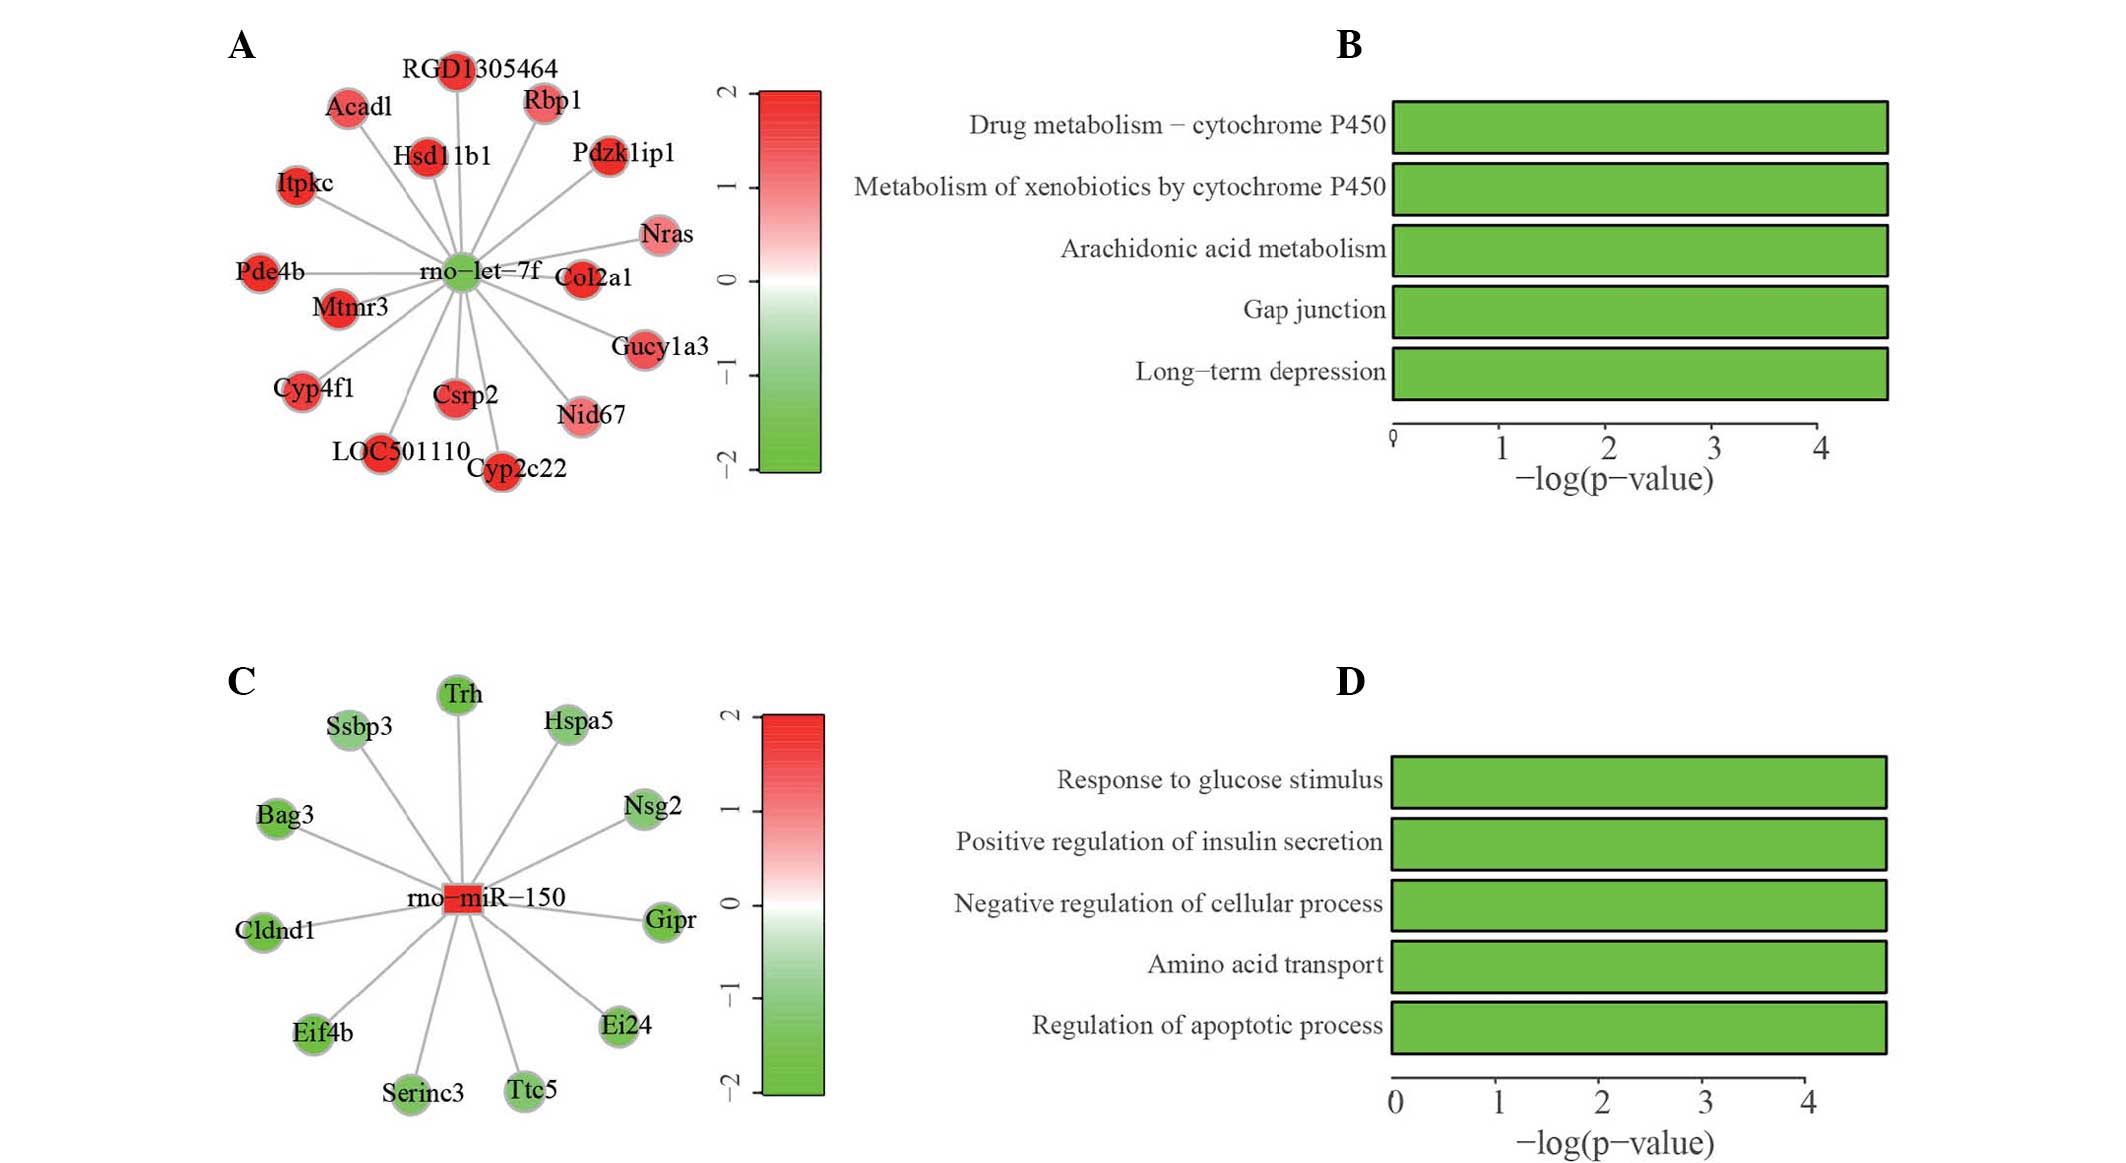 | Figure 3Construction of the representative
miRNA-mRNA regulatory networks. (A) Regulatory network of let-7f.
Green represents downregulation of the expression levels while red
represents upregulation. (B) Pathway analysis (KEGG) of 16 target
genes of let-7f. (C) Regulatory network of miR-150. (D) GO analysis
of 11 target genes of miR-150. miRNA, microRNA; GO, Gene Ontology;
Rbp, retinol binding protein; Pdzk1ip1, PDZK1
interacting protein 1; Col2a1, collagen, type II, alpha 1;
Gucy1a3, guanylate cyclase 1; Nid, nidogen; Cyp, cytochrome
P; Csrp, cysteine and glycine-rich protein; Pde4B,
cyclic adenosine monophosphate-specific 3′,5′-cyclic
phosphodiesterase 4B; Mtmr3, myotubularin-related protein 3;
Itpkc, inositol-trisphosphate 3-kinase C; Acadl,
acyl-CoA dehydrogenase, long chain; Hsd11b1,
11β-hydroxysteroid dehydrogenase type 1; Hspa5, heat shock
protein 5; Nsg2, neuron-specific gene family member 2;
Gipr, gastric inhibitory polypeptide receptor; Ei24,
etoposide-induced protein 24; Ttc5, tetratricopeptide repeat
domain 5; Serinc3, serine incorporator 3; Eif4b,
eukaryotic translation initiation factor 4B; Cldnd1, claudin
domain containing 1; Bag3, B-cell lymphoma 2-associated
athanogene 3; Ssbp3, single-stranded DNA-binding protein 3;
Trh, thyrotropin-releasing hormone. |
Discussion
The spontaneously diabetic GK rat is frequently used
as a model for human T2DM. Molecular and functional changes of
islet β-cells underlie the mechanism of how T2DM progresses,
particularly in the very early stage (17). In several other studies, the
combination of mRNA and miRNA profiling has also been used to
characterize diseases and to provide substantial information with
regard to regulatory correlations in these diseases, including in
cancer (18,19), neurodegenerative disease (20,21)
and infection (22). In the
present study, the first combined analysis of the expression
changes for both miRNAs and mRNAs in T2DM GK rats compared with
normal Wistar rats were reported. Furthermore, miRNA-mRNA
expression profiles were integrated through bioinformatics analysis
and miRNA-mRNA regulatory networks that may have significant
functions in T2DM were revealed.
Through the miRNA microarray, a total of 19 miRNAs
were observed whose expression levels were significantly changed in
GK rats compared to Wistar rats. Among the 19 miRNAs, four miRNAs
have already been reported to be correlated to diabetes in previous
studies, including miR-29c, let-7a, let-7f and miR-7 (23–25).
He et al (23) reported an
elevated expression of the miR-29 gene family in skeletal muscle,
liver and adipose tissues of diabetic GK rats. Overexpression of
miR-29a/b/c causes insulin resistance, similar to that of
incubation with high glucose and insulin (23). Frost and Olson (24) demonstrated that both global and
pancreas-specific overexpression of let-7 in mice resulted in
impaired glucose tolerance and reduced glucose-induced pancreatic
insulin secretion. Inhibition of the let-7 family prevents impaired
glucose tolerance in mice with diet-induced obesity, partially by
improving insulin sensitivity in the liver and muscle (24). Nieto et al (25) demonstrated that knockdown of miR-7
during early embryonic life resulted in an overall downregulation
of insulin production, and decreased β-cell numbers and glucose
intolerance in the postnatal period. Another two miRNAs,
miR-199a-3p and miR-129, which were found differentially expressed
in the present study, were also reported to reveal altered
expression levels under diabetic conditions in other studies
(26,27). Besides these six miRNAs, the
present study identified 13 additional novel miRNAs whose
expression levels were changed in diabetic GK rats, which may be
future research targets for T2DM pathogenesis.
Through gene expression profiling, a total of 670
differentially-expressed genes were identified in the present
study. A GO analysis indicated that the ‘immune response’ was the
most significantly enriched item and the ‘ECM-receptor interaction’
was identified as the most significantly enriched pathway. A gene
set for the ‘immune response’ includes chemokine (C-C motif) ligand
2 (Ccl2), Ccl7, Ccl11, Cxcl1,
interleukin 1B (Il1B), Il6 and interferon regulatory
binding factor 8, indicating that inflammation may be a significant
aspect in the dysfunction of β-cells in spontaneous T2DM GK rats.
It is known that a T-cell-mediated autoimmune response against β
cells is a primary pathogenic mechanism in type 1 diabetes
(28). Additionally, growing
evidence has indicated the causative link between tissue
inflammation and the onset of insulin resistance (29). However, the effect of inflammation
on β cell function in T2D was only reported recently (30–32)
and the present study provided additional evidence that
inflammatory processes are involved in β-cell dysfunction. The gene
set for the ‘ECM-receptor interaction’ includes Col2a1,
Col27a1, integrin, beta 6, Cd36, neuronal cell
adhesion molecule and fibronectin 1. This indicated that under
diabetic conditions, islets also exhibit dysfunction in pathways
correlated to cell adhesion, cell migration and ECM accumulation,
pathological characteristics which are common to diabetic
nephropathy and diabetic retinopathy (33,34).
In addition to the deregulation of numerous miRNAs
and mRNAs in T2DM tissues, the present study also identified
potential miRNA-mRNA regulatory correlations that could have
significant roles in the pathogenesis of T2DM. Several miRNAs,
including miR-485, were connected with a number of putative target
genes and certain genes, including Pea15a, Gucy1a3,
Pdzk1ip1, Ctgf, Itpkc and Hspa5 were
found to be regulated by several miRNAs. These miRNAs and mRNA
genes can be regarded as nodes of the whole regulatory network and
are indicated to have pivotal functions. In this regard,
Pea15a has been reported to control glucose transport and is
overexpressed in fibroblasts, as well as in skeletal muscle and
adipose tissues in type 2 diabetes (35). Ctgf has also been implicated
to be associated with kidney complications that may occur in type 2
diabetes (36,37). Furthermore, Hspa5 was found
increased in the pancreas of type 2 diabetes patients, indicating
increased endoplasmic reticulum stress during this disease
(38), and in a microarray-based
gene expression study, Itpkc was found to be
insulin-regulated (39). These
various studies are supportive of several of the findings of the
present study. Furthermore, it was attempted to evaluate the
strength of identified miRNA-mRNA correlations and it was proposed
that miRNA-mRNA pairs, including let-7f/Col2a1 may also have
significant roles in T2DM.
Finally, through GO and pathway analysis of putative
targets of individual miRNA, it was identified that certain miRNAs,
including let-7f, regulated target genes associated with drug
metabolism; certain miRNAs, including miR-150, regulated target
genes associated with the response to glucose stimulation; numerous
miRNAs, including miR-145, regulated genes associated with cell
proliferation and apoptosis; and numerous other miRNAs, including
miR-194, regulated genes associated with the inflammatory response.
This observation indicated possible regulatory functions of each
miRNA as well as the association of specific target genes with
regulated cellular pathways.
In conclusion, mRNA and miRNA microarray analyses of
the pancreas islet of GK rats have been performed and miRNA-mRNA
regulatory networks in T2DM GK rats have been constructed. This
analysis revealed possible miRNA-mRNA regulatory correlations
between numerous miRNAs and their potential target genes. Further
functional studies are required in order to confirm these proposed
miRNA-mRNA regulatory correlations and to quantify their potential
biological significance.
Acknowledgements
This study was supported by a grant of the National
Natural Science Foundation of China (no. 81200464).
Abbreviations:
|
T2DM
|
type 2 diabetes
|
|
miRNA
|
microRNA
|
|
GK
|
Goto-Kakizaki
|
|
GO
|
gene ontology
|
|
MAS
|
molecule annotation system
|
|
ECM
|
extracellular matrix
|
|
FBS
|
fetal bovine serum
|
|
HBSS
|
Hank’s balanced salt solution
|
|
FDR
|
false discovery rate
|
|
FC
|
fold change
|
|
Pea15a
|
phosphoprotein enriched in astrocytes
15
|
|
Gucy1a3
|
guanylate cyclase 1, soluble, alpha
3
|
|
Pdzk1ip1
|
PDZK1-interacting protein 1
|
|
Ctgf
|
connective tissue growth factor
|
|
Itpkc
|
inositol 1,4,5-triphosphate 3-kinase
C
|
|
Hspa5
|
heat shock protein 5
|
References
|
1
|
Wild S, Roglic G, Green A, Sicree R and
King H: Global prevalence of diabetes: estimates for the year 2000
and projections for 2030. Diabetes Care. 27:1047–1053.
2004.PubMed/NCBI
|
|
2
|
Lin Y and Sun Z: Current views on type 2
diabetes. J Endocrinol. 204:1–11. 2010. View Article : Google Scholar : PubMed/NCBI
|
|
3
|
McCarthy MI and Zeggini E: Genome-wide
association studies in type 2 diabetes. Curr Diab Rep. 9:164–171.
2009. View Article : Google Scholar : PubMed/NCBI
|
|
4
|
Lee RC, Feinbaum RL and Ambros V: The C.
elegans heterochronic gene lin-4 encodes small RNAs with antisense
complementarity to lin-14. Cell. 75:843–854. 1993. View Article : Google Scholar : PubMed/NCBI
|
|
5
|
Filipowicz W, Bhattacharyya SN and
Sonenberg N: Mechanisms of post-transcriptional regulation by
microRNAs: are the answers in sight? Nat Rev Genet. 9:102–114.
2008. View
Article : Google Scholar : PubMed/NCBI
|
|
6
|
Bartel DP: MicroRNAs: genomics,
biogenesis, mechanism, and function. Cell. 116:281–297. 2004.
View Article : Google Scholar : PubMed/NCBI
|
|
7
|
Qin W, Dong P, Ma C, et al: MicroRNA-133b
is a key promoter of cervical carcinoma development through the
activation of the ERK and AKT1 pathways. Oncogene. 31:4067–4075.
2012. View Article : Google Scholar : PubMed/NCBI
|
|
8
|
Tan X, Qin W, Zhang L, et al: A 5-microRNA
signature for lung squamous cell carcinoma diagnosis and hsa-miR-31
for prognosis. Clin Cancer Res. 17:6802–6811. 2011. View Article : Google Scholar : PubMed/NCBI
|
|
9
|
Guo H, Liu H, Mitchelson K, et al:
MicroRNAs-372/373 promote the expression of hepatitis B virus
through the targeting of nuclear factor I/B. Hepatology.
54:808–819. 2011. View Article : Google Scholar : PubMed/NCBI
|
|
10
|
Olsson AH, Yang BT, Hall E, et al:
Decreased expression of genes involved in oxidative phosphorylation
in human pancreatic islets from patients with type 2 diabetes. Eur
J Endocrinol. 165:589–595. 2011. View Article : Google Scholar : PubMed/NCBI
|
|
11
|
Sreekumar R, Halvatsiotis P, Schimke JC
and Nair KS: Gene expression profile in skeletal muscle of type 2
diabetes and the effect of insulin treatment. Diabetes.
51:1913–1920. 2002. View Article : Google Scholar : PubMed/NCBI
|
|
12
|
Shen Z, Zhang S, Zou CC, Gu WZ and Shang
SQ: DNA microarray analysis of the gene expression profile of
kidney tissue in a type 2 diabetic rat model. Mol Med Report.
3:947–952. 2010.PubMed/NCBI
|
|
13
|
Zhou H, Saito S, Piao G, et al: Network
screening of Goto-Kakizaki rat liver microarray data during
diabetic progression. BMC Syst Biol. 5(Suppl 1): S162011.
View Article : Google Scholar : PubMed/NCBI
|
|
14
|
Yang YL, Xiang RL, Yang C, et al: Gene
expression profile of human skeletal muscle and adipose tissue of
Chinese Han patients with type 2 diabetes mellitus. Biomed Environ
Sci. 22:359–368. 2009. View Article : Google Scholar : PubMed/NCBI
|
|
15
|
Chen C, Ridzon DA, Broomer AJ, et al:
Real-time quantification of microRNAs by stem-loop RT-PCR. Nucleic
Acids Res. 33:e1792005. View Article : Google Scholar : PubMed/NCBI
|
|
16
|
Guo H, Ingolia NT, Weissman JS and Bartel
DP: Mammalian microRNAs predominantly act to decrease target mRNA
levels. Nature. 466:835–840. 2010. View Article : Google Scholar : PubMed/NCBI
|
|
17
|
Quan W, Jo EK and Lee MS: Role of
pancreatic β-cell death and inflammation in diabetes. Diabetes Obes
Metab. 15(Suppl 3): 141–51. 2013.
|
|
18
|
Van der Auwera I, Limame R, van Dam P,
Vermeulen PB, Dirix LY and Van Laere SJ: Integrated miRNA and mRNA
expression profiling of the inflammatory breast cancer subtype. Br
J Cancer. 103:532–541. 2010.PubMed/NCBI
|
|
19
|
Fu J, Tang W, Du P, et al: Identifying
microRNA-mRNA regulatory network in colorectal cancer by a
combination of expression profile and bioinformatics analysis. BMC
Syst Biol. 6:682012. View Article : Google Scholar : PubMed/NCBI
|
|
20
|
Nunez-Iglesias J, Liu CC, Morgan TE, Finch
CE and Zhou XJ: Joint genome-wide profiling of miRNA and mRNA
expression in Alzheimer’s disease cortex reveals altered miRNA
regulation. PLoS One. 5:e88982010.PubMed/NCBI
|
|
21
|
Jin J, Cheng Y, Zhang Y, et al:
Interrogation of brain miRNA and mRNA expression profiles reveals a
molecular regulatory network that is perturbed by mutant
huntingtin. J Neurochem. 123:477–490. 2012. View Article : Google Scholar : PubMed/NCBI
|
|
22
|
Steuerwald NM, Parsons JC, Bennett K,
Bates TC and Bonkovsky HL: Parallel microRNA and mRNA expression
profiling of (genotype 1b) human hepatoma cells expressing
hepatitis C virus. Liver Int. 30:1490–1504. 2010. View Article : Google Scholar : PubMed/NCBI
|
|
23
|
He A, Zhu L, Gupta N, Chang Y and Fang F:
Overexpression of micro ribonucleic acid 29, highly up-regulated in
diabetic rats, leads to insulin resistance in 3T3-L1 adipocytes.
Mol Endocrinol. 21:2785–2794. 2007. View Article : Google Scholar : PubMed/NCBI
|
|
24
|
Frost RJ and Olson EN: Control of glucose
homeostasis and insulin sensitivity by the Let-7 family of
microRNAs. Proc Natl Acad Sci USA. 108:21075–21080. 2011.
View Article : Google Scholar : PubMed/NCBI
|
|
25
|
Nieto M, Hevia P, Garcia E, et al:
Antisense miR-7 impairs insulin expression in developing pancreas
and in cultured pancreatic buds. Cell Transplant. 21:1761–1774.
2012. View Article : Google Scholar : PubMed/NCBI
|
|
26
|
Wang XH, Qian RZ, Zhang W, Chen SF, Jin HM
and Hu RM: MicroRNA-320 expression in myocardial microvascular
endothelial cells and its relationship with insulin-like growth
factor-1 in type 2 diabetic rats. Clin Exp Pharmacol Physiol.
36:181–188. 2009. View Article : Google Scholar : PubMed/NCBI
|
|
27
|
Wu JH, Gao Y, Ren AJ, et al: Altered
microRNA expression profiles in retinas with diabetic retinopathy.
Ophthalmic Res. 47:195–201. 2012. View Article : Google Scholar : PubMed/NCBI
|
|
28
|
Mallone R and van Endert P: T cells in the
pathogenesis of type 1 diabetes. Curr Diab Rep. 8:101–106. 2008.
View Article : Google Scholar : PubMed/NCBI
|
|
29
|
Shoelson SE, Lee J and Goldfine AB:
Inflammation and insulin resistance. J Clin Invest. 116:1793–1801.
2006. View Article : Google Scholar : PubMed/NCBI
|
|
30
|
Ehses JA, Perren A, Eppler E, et al:
Increased number of islet-associated macrophages in type 2
diabetes. Diabetes. 56:2356–2370. 2007. View Article : Google Scholar : PubMed/NCBI
|
|
31
|
Donath MY and Shoelson SE: Type 2 diabetes
as an inflammatory disease. Nat Rev Immunol. 11:98–107. 2011.
View Article : Google Scholar : PubMed/NCBI
|
|
32
|
Eguchi K, Manabe I, Oishi-Tanaka Y, et al:
Saturated fatty acid and TLR signaling link β cell dysfunction and
islet inflammation. Cell Metab. 15:518–533. 2012.
|
|
33
|
Thrailkill KM, Clay Bunn R and Fowlkes JL:
Matrix metalloproteinases: their potential role in the pathogenesis
of diabetic nephropathy. Endocrine. 35:1–10. 2009. View Article : Google Scholar : PubMed/NCBI
|
|
34
|
Khalfaoui T, Lizard G and Ouertani-Meddeb
A: Adhesion molecules (ICAM-1 and VCAM-1) and diabetic retinopathy
in type 2 diabetes. J Mol Histol. 39:243–249. 2008. View Article : Google Scholar : PubMed/NCBI
|
|
35
|
Condorelli G, Vigliotta G, Iavarone C, et
al: PED/PEA-15 gene controls glucose transport and is overexpressed
in type 2 diabetes mellitus. EMBO J. 17:3858–3866. 1998. View Article : Google Scholar : PubMed/NCBI
|
|
36
|
Makino H, Mukoyama M, Sugawara A, et al:
Roles of connective tissue growth factor and prostanoids in early
streptozotocin-induced diabetic rat kidney: the effect of aspirin
treatment. Clin Exp Nephrol. 7:33–40. 2003. View Article : Google Scholar : PubMed/NCBI
|
|
37
|
Danda RS, Habiba NM, Rincon-Choles H, et
al: Kidney involvement in a nongenetic rat model of type 2
diabetes. Kidney Int. 68:2562–2571. 2005. View Article : Google Scholar : PubMed/NCBI
|
|
38
|
Laybutt DR, Preston AM, Akerfeldt MC, et
al: Endoplasmic reticulum stress contributes to beta cell apoptosis
in type 2 diabetes. Diabetologia. 50:752–763. 2007. View Article : Google Scholar : PubMed/NCBI
|
|
39
|
Wu X, Wang J, Cui X, et al: The effect of
insulin on expression of genes and biochemical pathways in human
skeletal muscle. Endocrine. 31:5–17. 2007. View Article : Google Scholar : PubMed/NCBI
|