Introduction
Chronic obstructive pulmonary disease (COPD) is an
increasingly prevalent disorder worldwide, which has high mortality
rates and produces a severe economic burden (1). It has been predicted that by 2020,
COPD may become the third major cause of mortality in the world
(1); in addition, in China alone,
~65 million mortalities due to COPD were estimated between 2003 and
2033 (2). It is therefore
essential that novel mechanisms for the treatment and control of
COPD are established. The risk factors of COPD include smoking, air
pollution and solid-fuel use (2).
Previous studies have provided evidence for the use of inhaled
glucocorticosteroids, short- and long-acting bronchodilators as
well as low-dose, slow-release theophylline being effective for the
treatment of COPD (3); however,
the adverse effects of therapeutic agents are difficult to avoid
(4).
Traditional Chinese Medicine (TCM) has been used for
numerous years for the treatment of COPD and is reported to have
markedly advantageous effects on reducing the frequency of acute
exacerbations and improving the quality of life of patients
(5,6). However, the molecular mechanisms of
COPD and the beneficial effects of TCM remain to be elucidated;
therefore, it is difficult to define the efficacy and advantages of
TCM in the treatment of COPD (7).
The TCM pattern is a set of priciples used to classify a disease
according to a group of symptoms and summarize the patients’
condition at various stages of the disease process (8). It was suggested that TCM patterns may
be used to study COPD in the clinic. A previous study indicated
that COPD exhibited three common TCM patterns, each of which
responded to one specific herbal therapy (9). The aim of the present study was to
investigate the molecular mechanisms of COPD through metabolomic
analysis as well as explore the targets and intervention mechanisms
of the common TCM granules Bu-Fei Jian-Pi in a rat model of stable
COPD.
Materials and methods
Animal models
All animal handling and procedures were performed in
accordance with the Guide for the Care and Use of Laboratory
Animals (National Institutes of Health, Bethesda, MD, USA),
following approval from the Institutional Animal Care and Use
Committee at Henan University of Traditional Chinese Medicine
(Henan, China). All surgeries were performed aseptically, with the
minimal amount of pain and discomfort possible.
A total of 60 male and 60 female Sprague-Dawley rats
(200–240 g; Beijing Laboratory Animal Research Center, Beijing,
China) were each divided at random into three groups. Rats in the
control group (n=40) and model group (n=40) were injected
subcutaneously with 3.5 ml/kg physiological saline (0.9% wt/vol
NaCl). The treatment group (n=40) was injected subcutaneously with
a solution of Bu-Fei Jian-Pi granules twice a day for 12 weeks. The
volumes of TCM or saline were adjusted according to the body weight
of each individual animal. The rats were kept in a 12-h light/dark
cycle with food and water available ad libitum. At week 32,
~24 h following the final injection, rats were administered
anesthetic intraperitoneally with 50 mg/kg ketamine (Fujian Gutian
Pharmaceutical Co., Ltd., Fujian, China) and sacrificed by cervical
dislocation, the brains were then removed immediately. A
thoracotomy was then performed in order to excise the superior,
midle and inferior lobes of the right lung, the specimens were then
snap-frozen in liquid nitrogen and stored at −80°C until further
use. This process was typically performed within 5–10 min following
sacrification to limit post-mortem changes in the metabolite
content of the samples.
Bacteria
Klebsiella pneumoniae (strain no. 46116) was
provided by the National Center for Medical Culture Collection
attached to the National Institutes for Food and Drug Control
(Bejing, China). The concentration was adjusted to 6×10⁸
colony forming units (CFU)/ml prior to administration.
TCM and medicine
The Bu-fei Jian-Pi TCM therapy consisted of: 15 g
radix Codonopsis dangshen; 15 g radix Astragali seu
Hedysari huangqi; 12 g Poria fuling; 9 g bulbus
Fritillariae Cirrhosae Chuanbeimu; 12 g Lumbricus
dilong; and 9 g Pericarpium Citri Reticulatae chenpi. All
herbs were prepared and provided by the Clinical Pharmacology
Research Base of the First Affiliated Hospital of Henan University
of TCM (Henan, China), a state TCM clinical research base. Prior to
use, compounds were extracted and stored at 4°C.
Constructing a stable rat model of
COPD
Rat models of COPD were induced using smoke
inhalations and recurrent bacterial infections. Rats were
administered 0.1 ml Klebsiella pneumoniae solution
(6×10⁸ CFU/ml) through dripping into the nasal cavity
every five days for eight weeks. Hongqiqu filter cigarettes
consisting of: Flue-cured tobacco; 14 mg tar; 1.2 mg nicotine and
15 mg carbon monoxide, were provided by the Henan Anyang Cigarette
Factory (Henan, China) and were used for inducing stable COPD in
rat models. The inhalations lasted for 30 minutes each time, three
times a day with three-hour intervals between each inhalation. The
inhalation lasted for 12 weeks in total. For each inhalation in
weeks one and two, eight cigarettes were used and in weeks 3–12, 15
cigarettes were used. The COPD rat models generated were stable and
suitable for the evaluation of the effects of the drug.
Grouping and medication
Rats were divided into groups as follows: A1,
control group; B1, model group; and D1, Bu-Fei Jian-Pi-treated
group D1. On the first day of the 9th week, groups A1 and B1 were
orally administered with distilled water twice a day. The D1 group
was administered 5 mg/kg/day under identical conditions. Treatment
continued daily until the twentieth week, half of the rats were
sacrificed at 20 weeks in order to study the short-term effects of
the TCM and the other half of the rats were then kept until week 32
and sacrificed in order to determine the long-term effects of the
TCM.
Content measurement and data
collection
Lung tissue was collected in order to perform liquid
chromatography-mass spectrometry (LC-MS) metabolic analysis.
Lung tissue was removed from the liquid nitrogen
(−80°C) and immediately cut into samples of 60±5 mg.
Chromatographic methanol (Fujian Gutian Pharmaceutical Company) was
pre-cooled to −20°C and added to each sample (200 μl). A
TissueLyzer II was used to homogenize the tissue (30 Hz; three
minutes). The homogenized tissue solution was injected with 200 μl
chloroform (Fujian Gutian Pharmaceutical Company) and 300 μl
methanol (Fujian Gutian Pharmaceutical Company). Following
centrifugation at 4°C for 15 min (8,000 × g), Liquid supernatant
(800 μl) was then transferred into an Eppendorf tube. Methanol (500
μl) was then added to the residue and centrifuged under identical
conditions, the resultant supernatant (500 μl) was then transferred
into the Eppendorf tube containing the former 800-μl supernatant.
Subsequently, 500 μl mixed supernatant was removed and the solvent
was removed under streaming nitrogen. The mixed supernantant was
then reconstituted by adding 100 μl aqueous methanol solution (1:1)
and oscillated.
Following centrifugation under identical conditions,
the supernatant was subjected to high-performance liquid
chromatography/quadrupole-time-of-flight mass spectrometry
(HPLC/QToF-MS), set up as follows: Agilent 1200 series HPLC system
with Agilent Poroshell SB-C18 Reversed-Phase Column (2.1×50 mm; 2.7
μl) and the Agilent 6520 series QtoF-MS mass spectrometer (Agilent
Technologies, Inc., Santa Clara, CA, USA). Mobile phase (flow rate,
0.3 ml/min; injection volume, 5 μl) for the ultrapure solution
contained: A, 0.1% formic acid; and B, an acetonitrile solution of
0.1% formic acid. The chromatographic elution procedure was
performed at 40°C as follows: 0 min, 1% B; 1 min, 1% B; 3 min, 45%
B; 9 min, 80% B; 11 min, 100% B; 18 min, 100% B; 19 min, 1% B; 25
min, 1% B. MS settings were as follows: Ion source, Dual ESI;
ionization mode, ESI+; desolvation and atomization gas, high-purity
nitrogen>99.999%); gas flow rate, 10 l/min; 330°C; spray fog
pressure, 40 psi; capillary voltage, 4,000 V; capillary fragmentor
voltage, 135 V; skimmer voltage, 65 V; MS acquisition range,
100–1,000 Da (with online calibration mode for a real-time
correction of the m/z values, the reference ion qualities were
121.050873 and 922.009798); mass spectrometry data recording mode,
centroid mode; and instrument control and data acquisition
software, MassHunter WorkStation Qualitative Analysis (Version
B.03.01; Agilent Technologies, Inc.). Samples were analyzed at
random using standard in multivarient data analysis (SIMCA)-P
software version 11.0 (Umetrics, Umeå, Sweden). Group comparisons:
B1 vs. A1; and B1 vs. D1.
Data processing
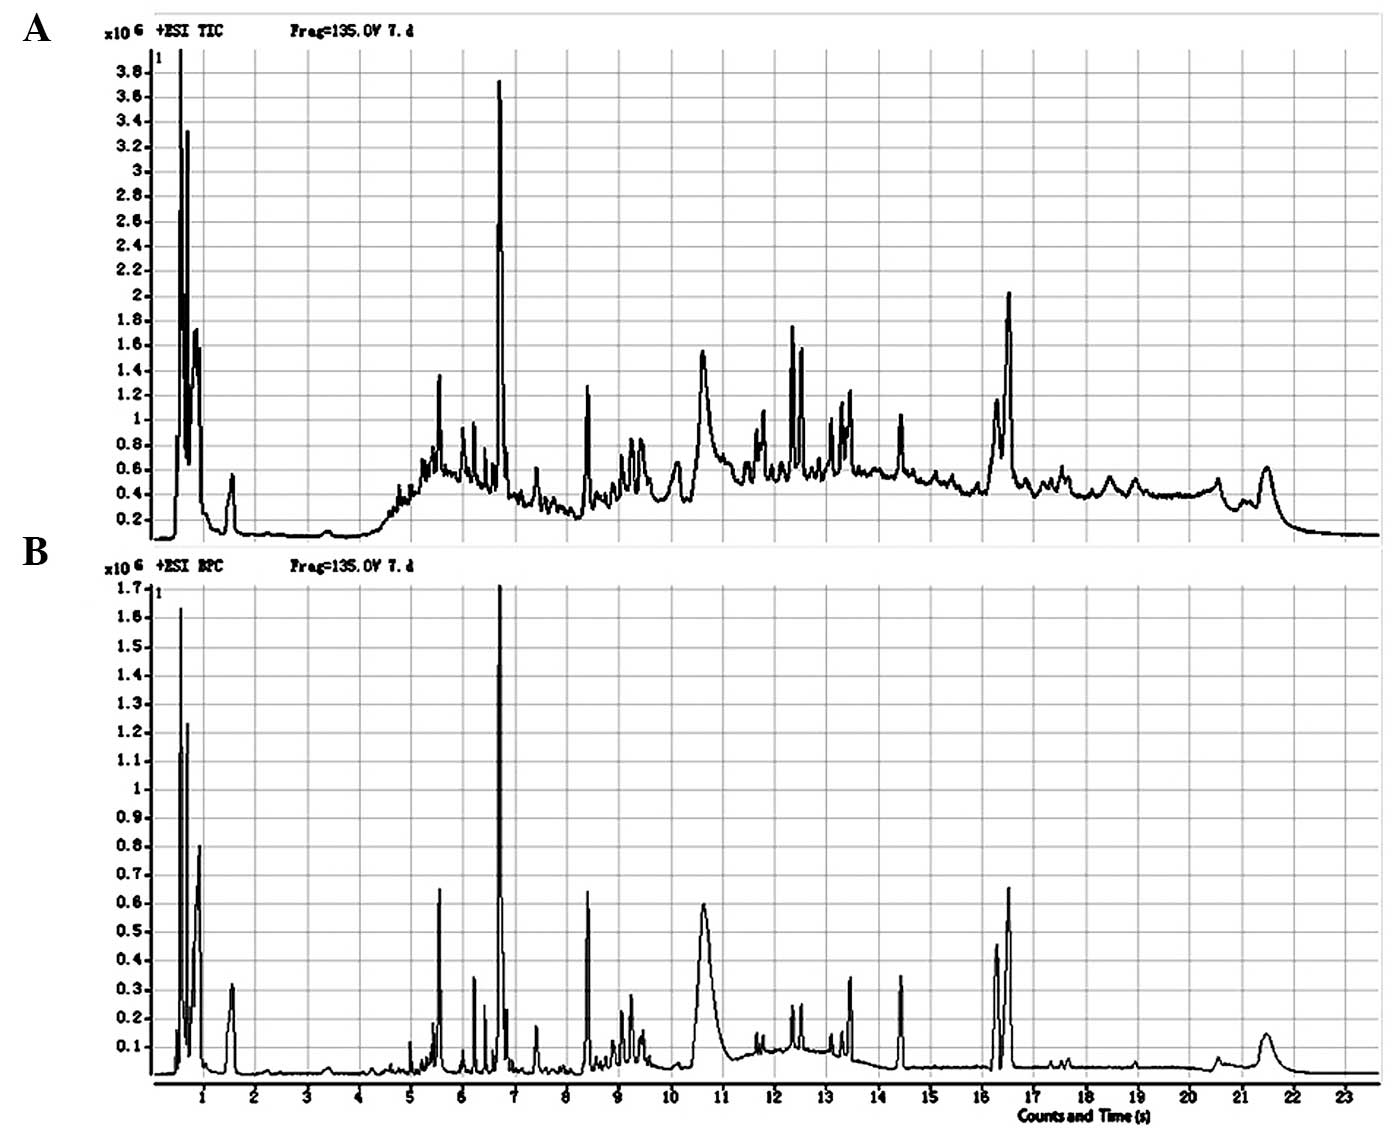
The total ion and base-peak chromatograms from the
representative samples are shown in Fig. 1. MassHunter WorkStation Qualitative
Analysis software (version B.03.01) was used to convert the raw
data into the ‘*.mzdata’ format. The R platform was then used to
process the raw data with the XCMS package to obtain information
about the baseline filter, peak identification, retention times and
peak alignment. The three-dimensional structural data was then
organized into a two-dimensional matrix of data, including
variables (retention time-mass-charge ratio, rt_mz), the
observation volume (96 samples) and the integral area. The XCMS
centWave method was used to identify the peaks, peak width was set
to 4–12 s, 30 parts per million (ppm); and the signal to noise
ratio was set to 3. The local regression (LOESS) method was used to
perform a nonlinear correction to the retention time. The process
observed 2,544 variables (rt_mz). Prior to performing statistical
analysis, the total integrated area of each sample was normalized
to 1,000.
Statistical analysis
Significance was determined using the Student’s
paried t-test and the one-way analysis of variance on the mean of
three different experiments. Statistical analysis was performed
using SIMCA-P 11.0 software, which was standardized from the raw
data to obtain an intuitive result. P<0.05 was considered to
indicate a statistically significant difference between values.
Results
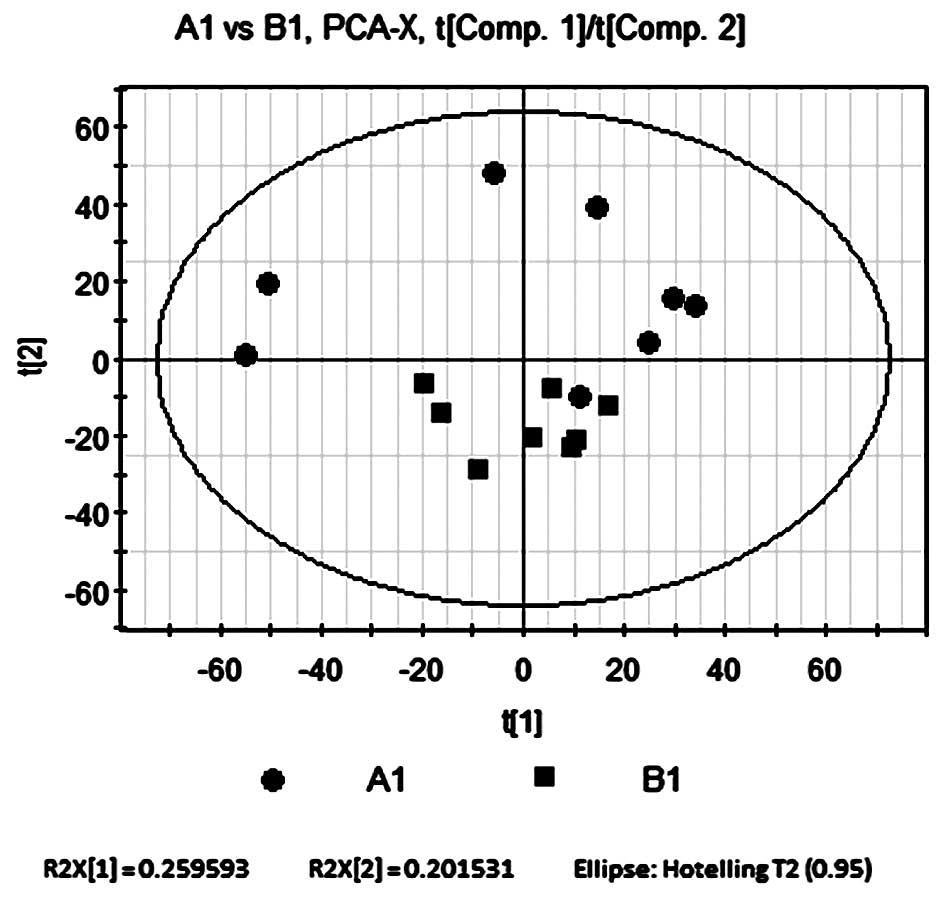
Principal component analysis (PCA)
compares B1 and A1
PCA was performed on the control and model groups
using SIMCA-P software, which par-formatted and mean-centered the
raw data for an intuitive result. The software automatically
performed a model-fitting analysis for three principal components.
The accumulated variance contribution rate was R2X=0.572. All
samples were located within the 95% confidence interval,
represented by the Hotelling’s T2 ellipse (Fig. 2), which indicated that no outliers
existed. In general, an R2X value >0.4 indicates a reliable
model, therefore the metabolic differences between the two sample
groups determined by the present PCA model were reliable.
The results of the PCA revealed that samples from
the control group were widely distributed throughout the PCA score
plot, with the majority located in the upper quadrants; however,
samples from the model group were limited to a small region of the
score plot in the lower quadrants (Fig. 2). The two groups were not
completely separated according to the PCA score plot; however, the
decreased variability of the model group was significant enough to
indicate that the model group was affected by induced COPD; other
factors, including environmental, dietary and hereditary
influences, had a relatively insignificant effect on the score
plot. The separation trend of the PCA therefore indicated that
there were significant metabolic differences between groups A1 and
B1.
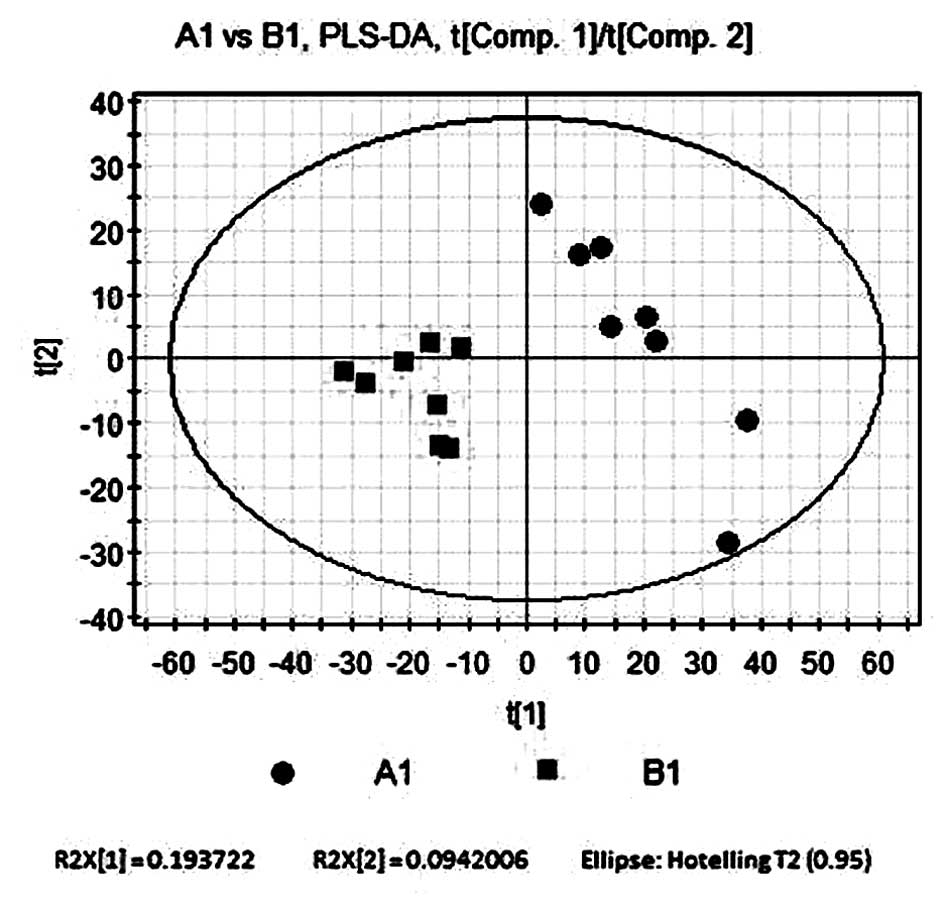
Partial least squares-discriminant
analysis (PLS-DA) compares B1 and A1
PLS-DA, a supervisory multi-dimensional statistical
model analysis method, was used to analyze the two sample groups.
The software automatically filtered out noise. As shown in Fig. 3, a total of three principal
components were selected for analysis, the first principal
component score t[1] is shown on the horizontal axis and the second
principal component score t[2] is shown on the vertical axis. The
contribution rate of the supervision model, R2Y=0.931, indicated
that PLS-DA was a reliable model for showing the differences
between the two sample groups. The model forecast rate, Q2=0.613,
demonstrated the predictive ability of the model. The results
revealed that the control group was located in a larger area, while
the model group was clustered in a smaller area. This therefore
indicated that A1 and B1 had significant differences in their
metabolic profile.
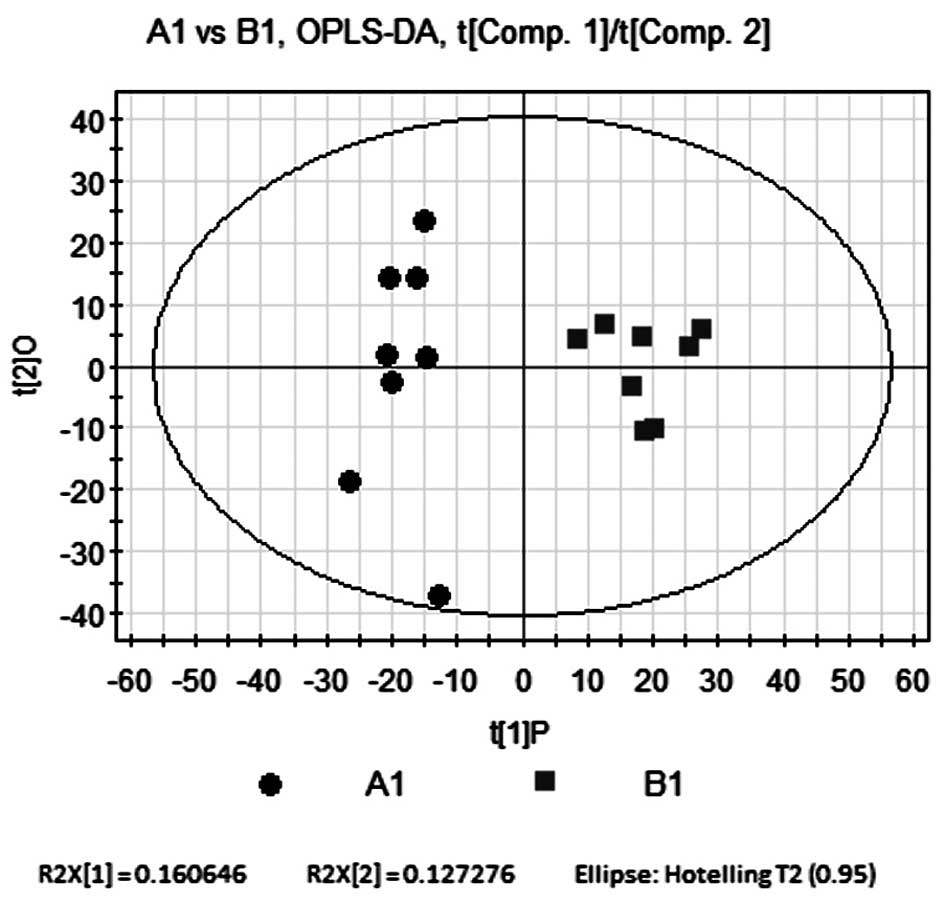
Orthogonal partial least
squares-discriminant analysis (OPLS-DA) compares B1 and A1
In order to eliminate and classify noise in the
control and model groups as well as to obtain more reliable
significant differences in metabolite activity between the two
groups, OPLS-DA was used to filter any irrelevant quadrature
signals from the model classification. OPLS-DA consisted of one
principal component (P), R2Y=0.801 and one quadrature component
(O), R2Y=0.13. The quality parameters of the model were R2Y=0.931
and Q2=0.72, indicating that the model was reliable. As shown in
Fig. 4, the OPLS-DA score plot
revealed comparable results to those of the PLS-DA model. The
samples from the control and model groups were distributed on
opposite sides of P; in addition, the control group was more
sparsely spread across O. This therefore indicated that the samples
from the two groups had significant metabolic differences.
Identification of 49 metabolites with
different concentrations in B1 and A1
Variable importance in projection (VIP; >1) was
used to perform model analysis, in combination with t-test
statistical analysis methods (P<0.05) to the explore different
metabolites between the two groups. The molecular weights of the 49
metabolites that had different concentrations in B1 and A1 were
identified according to the Metabolite and Tandem MS (Metlin)
Database of the Human Metabolome Database (HMDB; http://metlin.scripps.edu/index.php). The
threshold for quality was 30 ppm (Table I).
 | Table IThe molecular weight of the 49
metabolites with different concentrations in B1 and A1 were
identified according to the Metabolite and Tandem Mass Spectrometry
Database of the Human Metabolome Database. |
Table I
The molecular weight of the 49
metabolites with different concentrations in B1 and A1 were
identified according to the Metabolite and Tandem Mass Spectrometry
Database of the Human Metabolome Database.
| Name | rt | m/z | VIP(B1/A1) | metabolite | fold (B1/A1) |
|---|
| M279T535_1 | 8.92 | 279.2320 | 2.10 | α-Linolenic acid | 0.4862801 |
| M369T354 | 5.90 | 369.2265 | 2.08 | 20-Hydroxy-PGE2 | 0.6286648 |
| M281T535 | 8.91 | 281.2394 | 2.04 | Linoleic acid | 0.520539 |
| M351T401 | 6.68 | 351.2163 | 1.90 | Lipoxin A5 | 0.475968 |
| M213T466 | 7.76 | 213.1485 | 1.89 | 7-Oxo-11-dodecenoic
acid | 0.5081364 |
| M165T328 | 5.46 | 165.0905 | 1.72 | 3-Phenylbutyric
acid | 0.3791378 |
| M331T430 | 7.16 | 331.2667 | 1.71 | Eicosapentaenoic acid
ethyl ester | 0.4811344 |
| M214T302 | 5.03 | 214.1431 | 1.59 |
N-Heptanoyl-homoserine lactone | 0.456305 |
| M174T307 | 5.12 | 174.1117 | 1.56 | Acetyl-L-leucine | 0.502141 |
| M337T492 | 8.21 | 337.2370 | 1.51 | 11-Deoxy-PGE2 | 0.4664266 |
| M165T305 | 5.08 | 165.0595 | 1.37 | Phenylpyruvic
acid | −0.683227 |
| M165T318 | 5.29 | 165.0755 | 1.21 | α-D-Fucose | 0.3453485 |
| M398T484 | 8.07 | 398.2902 | 1.21 | PGE1
ethanolamide | 0.5641619 |
| M319T535 | 8.91 | 319.2247 | 2.08 |
5-hydroxyeicosapentaenoic acid | 0.5407731 |
| M367T397 | 6.62 | 367.2451 | 1.84 | PGE2 methyl
ester | 0.4350498 |
| M303T316 | 5.27 | 303.1911 | 1.81 |
2-Methoxyestradiol | 0.5379153 |
| M321T585 | 9.76 | 321.2420 | 1.81 |
5-Hydroxyeicosatetraenoic acid | 0.4598037 |
| M335T455 | 7.58 | 335.2199 | 1.78 | 20-Carboxy
arachidonic acid | 0.4121728 |
| M335T369 | 6.14 | 335.2215 | 1.78 | 20-Carboxy
arachidonic acid | 0.4440207 |
| M311T543 | 9.06 | 311.2220 | 1.71 |
13(S)-HpOTrE | 0.6599862 |
| M333T543 | 9.05 | 333.2040 | 1.69 |
11β-hydroxyprogesterone | 0.5746297 |
| M338T586 | 9.77 | 338.2695 | 1.67 | Linoleoyl
glycine | |
| M285T800 | 13.33 | 285.2798 | 1.67 | Stearic acid | −0.290979 |
| M208T310 | 5.16 | 208.0964 | 1.65 |
N-Acetyl-L-phenylalanine | 0.4514552 |
| M353T363 | 6.05 | 353.2300 | 1.65 | 20-Hydroxy
LTB4 | 0.3555726 |
| M126T298 | 4.97 | 126.0219 | 1.64 | Taurine | 0.5644918 |
| M367T352 | 5.86 | 367.2114 | 1.63 |
20-Carboxy-LTB4 | 0.4634855 |
| M205T328 | 5.47 | 205.0832 | 1.63 |
γ-D-Glutamylglycine | 0.4171233 |
| M242T310 | 5.177 | 242.1745 | 1.61 |
N-Nonanoyl-L-Homoserine
lactone | 0.4906304 |
| M289T307 | 5.12 | 289.1752 | 1.60 |
2-Hydroxyestradiol | 0.5220455 |
| M307T606 | 10.11 | 307.2627 | 1.58 | Linolenic acid
ethyl ester | 0.6468999 |
| M305T578 | 9.63 | 305.2476 | 1.51 | Arachidonic acid
(peroxide free) | 0.3752692 |
| M313T363 | 6.04 | 313.2373 | 1.49 |
13(S)-HpODE | 0.364127 |
| M271T315 | 5.25 | 271.1645 | 1.49 | Estrone | 0.4819101 |
| M213T362 | 6.04 | 213.1483 | 1.48 | 7-Oxo-11-dodecenoic
acid | 0.3521852 |
| M136T49 | 0.82 | 136.0756 | 1.48 | Phenacylamine | 0.1746112 |
| M327T699 | 11.66 | 327.2296 | 1.46 | 4,5-Dehydro
docosahexaenoic acid | −0.611621 |
| M295T363 | 6.04 | 295.2268 | 1.43 | 13(S)-HOTrE | 0.3480763 |
| M149T316 | 5.27 | 149.0448 | 1.40 | D-α-Hydroxyglutaric
acid | 0.2677423 |
| M297T566 | 9.43 | 297.2350 | 1.38 |
9-hydroxy-10,12-octadecadienoic acid | 0.5084189 |
| M518T527 | 8.78 | 518.3248 | 1.37 | LysoPC(18:3) | −0.695892 |
| M160T303 | 5.05 | 160.1327 | 1.33 | 2-Amino butanoic
acid | 0.3999979 |
| M333T389 | 6.49 | 333.2417 | 1.28 | Leukotriene A4
methyl ester | 0.1849361 |
| M528T505 | 8.41 | 528.2997 | 1.25 | LysoPE(22:5) | 0.5568003 |
| M175T44 | 0.74 | 175.0232 | 1.24 | Aconitic acid | 0.7021798 |
| M300T269 | 4.49 | 300.0949 | 1.21 | 8-Hydroxy
guanosine | −0.462865 |
| M277T564 | 9.40 | 277.2164 | 1.20 |
9,12-Octadecadienoic acid | 0.4366534 |
| M322T699 | 11.66 | 322.2742 | 1.14 | α-Linolenoyl
ethanolamide | −0.570115 |
| M232T288 | 4.80 | 232.1542 | 1.11 | Isobutyryl
carnitine | 0.463761 |
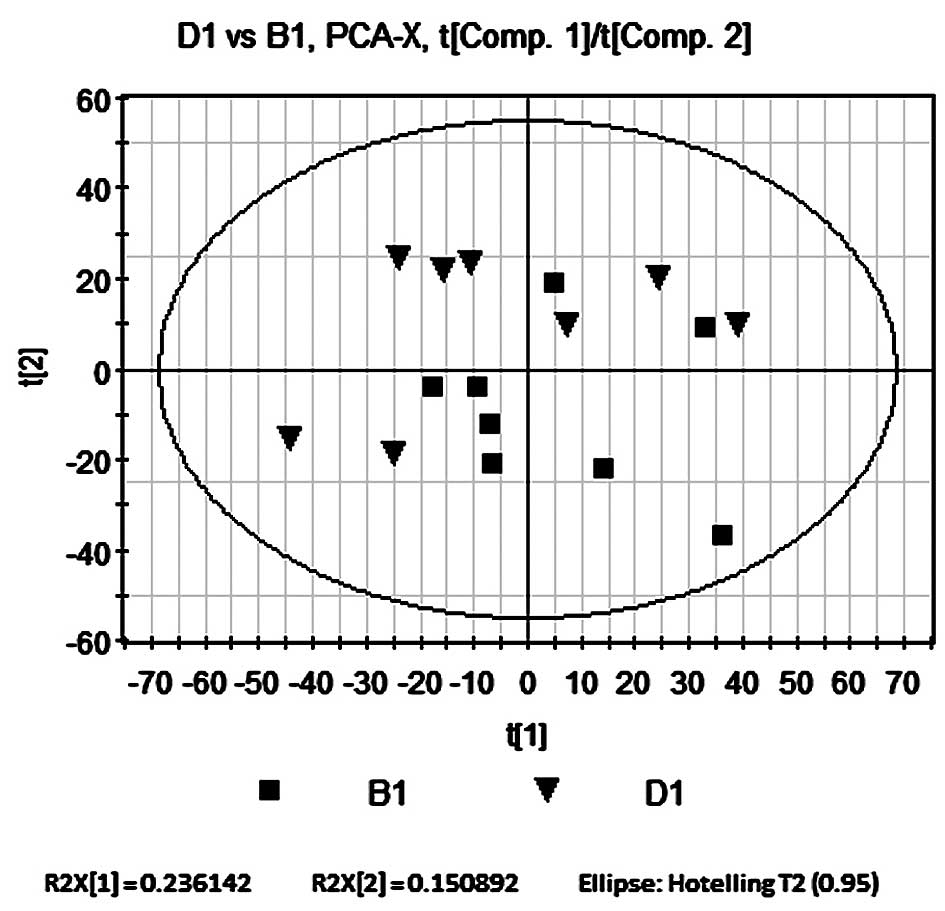
PCA compares B1 and D1
PCA was performed on rats in the Bu-Pi
Jian-Fei-treated and model groups using SIMCA-P software under
identical conditions to those of the PCA of B1 and A1. The
accumulated variance contribution rate was R2X=0.508, therefore
indicating that the PCA model was reliable. As shown in Fig. 5, all samples in the PCA score plot
were located within the 95% confidence interval, represented by the
Hotelling’s T2 ellipse, which indicated that no outliers were
present. The results showed no significant separation between the
two groups; however, there was a relatively weak separation trend
as the distribution of B1 tended to locate in the lower right
quadrant and D1 in the upper left quadrant.
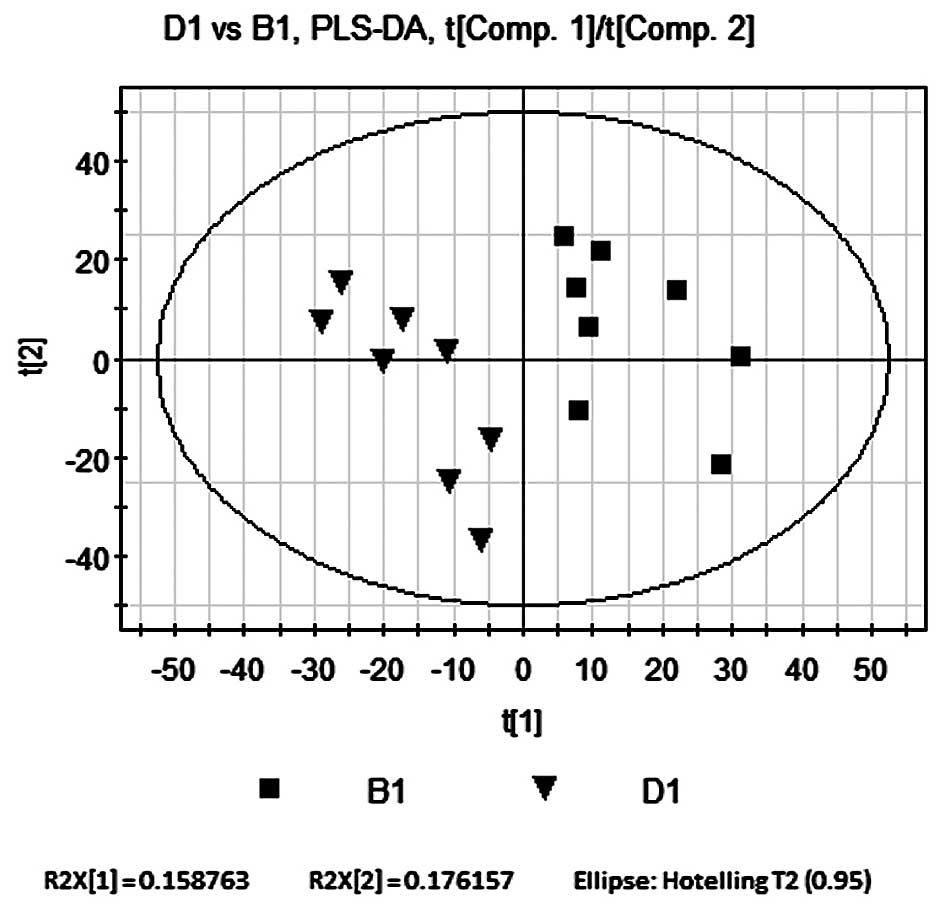
PLS-DA compares B1 and D1
PLS-DA was used as described in the PLS-DA
comparison of B1 and A1. The contribution rate of supervision
model, R2Y=0.998, indicated that PLS-DA was a reliable model for
the differences between the two sample groups and the model
forecast rate, Q2=0.859 demonstrated the predictive ability of the
model. As shown in Fig. 6, the
seperation of the model and Bu-Fei Jian-Pi-treated groups on
opposite sides of the horizontal axis indicated that the metabolic
activity of rats in the D1 group was significantly altered
following treatment.
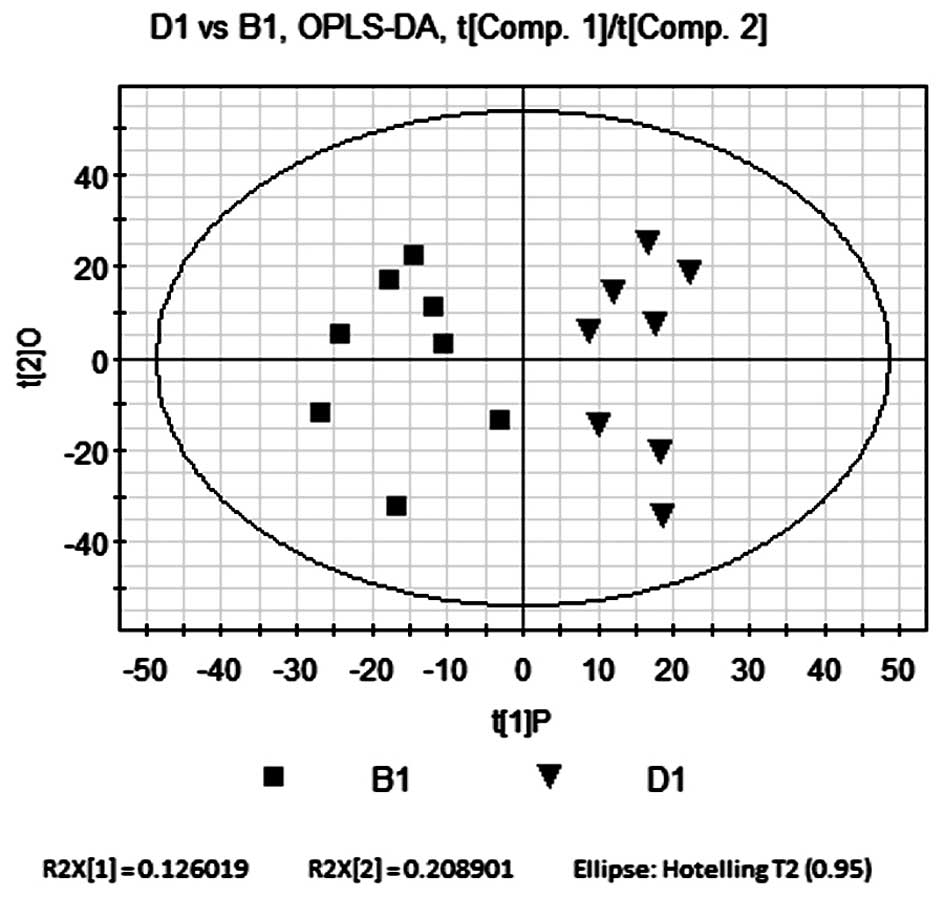
OPLS-DA compares B1 and D1
OPLS-DA was performed as described in the OPLS-DA
comparison of B1 and A1. The P and O were R2Y=0.75 and R2Y=0.123,
respectively. The quality parameters of the model were R2Y=0.874
and Q2=0.565. Scores are shown in Fig.
7. Similarly to the results of the PLS-DA model, the OPLS-DA
model explained that R2Y and the predicted rate Q2 were high,
indicating that the current model was reliable. As shown in
Fig. 7, the OPLS-DA score plot
revealed comparable results to those of the PLS-DA model. The
samples from the model and Bu-Fei Jian-Pi-treated groups were
distributed on opposite sides of P. This therefore indicated that
there were significant metabolic differences between the two
groups.
Identification of the different
metabolites between B1 and D1
VIP (>1) and t-tests were used to perform model
and statistical analysis (P<0.05) of the different metabolites
between the two groups. The molecular weights of the 31 different
metabolites was identified according to the Metlin Database, with a
threshold of quality of 30 ppm (Table
II).
| Table IIThe molecular weight of the 31
different metabolites between B1 and D1 were identified according
to the Metabolite and Tandem Mass Spectometry Database of the Human
Metabolome Database. |
Table II
The molecular weight of the 31
different metabolites between B1 and D1 were identified according
to the Metabolite and Tandem Mass Spectometry Database of the Human
Metabolome Database.
| Name | rt | m/z | VIP(B1/D1) | metabolite | fold (D1/B1) |
|---|
| M165T305 | 5.08 | 165.0595 | 2.27 | Phenylpyruvic
acid | 0.24 |
| M476T445 | 7.41 | 476.2646 | 2.26 | LysoPE (18:3) | 0.21 |
| M369T354 | 5.90 | 369.2265 | 2.20 |
20-Hydroxy-PGE2 | −0.36 |
| M536T415 | 6.92 | 536.3341 | 2.14 | LysoPC (18:1) | −0.40 |
| M337T492 | 8.21 | 337.2370 | 2.08 | Leukotriene B4 | −0.46 |
| M273T318 | 5.30 | 273.1801 | 2.06 | β-Estradiol | −0.55 |
| M279T535_1 | 8.92 | 279.2320 | 2.05 | γ-Linolenic
acid | −0.21 |
| M496T548 | 9.14 | 496.3326 | 2.05 | LysoPC(16:0) | −0.39 |
| M281T535 | 8.91 | 281.2394 | 2.03 | Linoleic acid | −0.38 |
| M147T317 | 5.29 | 147.0649 | 1.98 | Adipic acid | 0.30 |
| M330T460 | 7.67 | 330.2641 | 1.98 | 4,8
Dimethylnonanoyl carnitine | −0.26 |
| M147T48 | 0.81 | 147.0440 | 1.97 | Phenylpropiolic
acid | −0.34 |
| M137T51_1 | 0.85 | 137.0459 | 1.96 | Hypoxanthine | 0.40 |
| M351T485 | 8.09 | 351.2164 | 1.94 | Lipoxin A5 | −0.33 |
| M508T608 | 10.13 | 508.3330 | 1.91 | LysoPE (20:1) | 0.24 |
| M147T804 | 13.40 | 147.0653 | 1.90 | Adipic acid | 0.61 |
| M355T526 | 8.76 | 355.2842 | 1.87 | 1-Linoleoyl
glycerol | −0.82 |
| M398T484 | 8.07 | 398.2902 | 1.85 | PGE1
ethanolamide | −0.84 |
| M214T302 | 5.03 | 214.1431 | 1.83 |
N-Heptanoyl-homoserine lactone | −0.37 |
| M331T430 | 7.16 | 331.2667 | 1.82 | Eicosapentaenoic
acid ethyl ester | −0.31 |
| M295T429 | 7.15 | 295.2268 | 1.82 |
9-Oxooctadeca-10,12-dienoic acid | −0.24 |
| M174T307 | 5.12 | 174.1117 | 1.78 |
Acetyl-L-leucine | −0.39 |
| M213T466 | 7.76 | 213.1485 | 1.78 | 7-Oxo-11-dodecenoic
acid | −0.22 |
| M551T606 | 10.14 | 551.3555 | 1.78 | Phosphatidic acid
(25:0) | 0.23 |
| M165T318 | 5.29 | 165.0755 | 1.72 | α-D-Fucose | 0.24 |
| M351T401 | 6.68 | 351.2163 | 1.70 | Lipoxin A5 | −0.19 |
| M293T417 | 6.96 | 293.2109 | 1.69 |
9-Oxo-10,12,15-octadecatrienoic acid | −0.38 |
| M126T38 | 0.64 | 126.0637 | 1.69 |
5-Methylcytosine | 0.62 |
| M428T40 | 0.67 | 428.0368 | 1.65 | Adenosine
diphosphate | 0.20 |
| M165T328 | 5.46 | 165.0905 | 1.60 | 3-Phenylbutyric
acid | −0.18 |
| M383T569 | 9.48 | 383.2796 | 1.32 | 20-Ethyl
prostaglandin F2α | 0.21 |
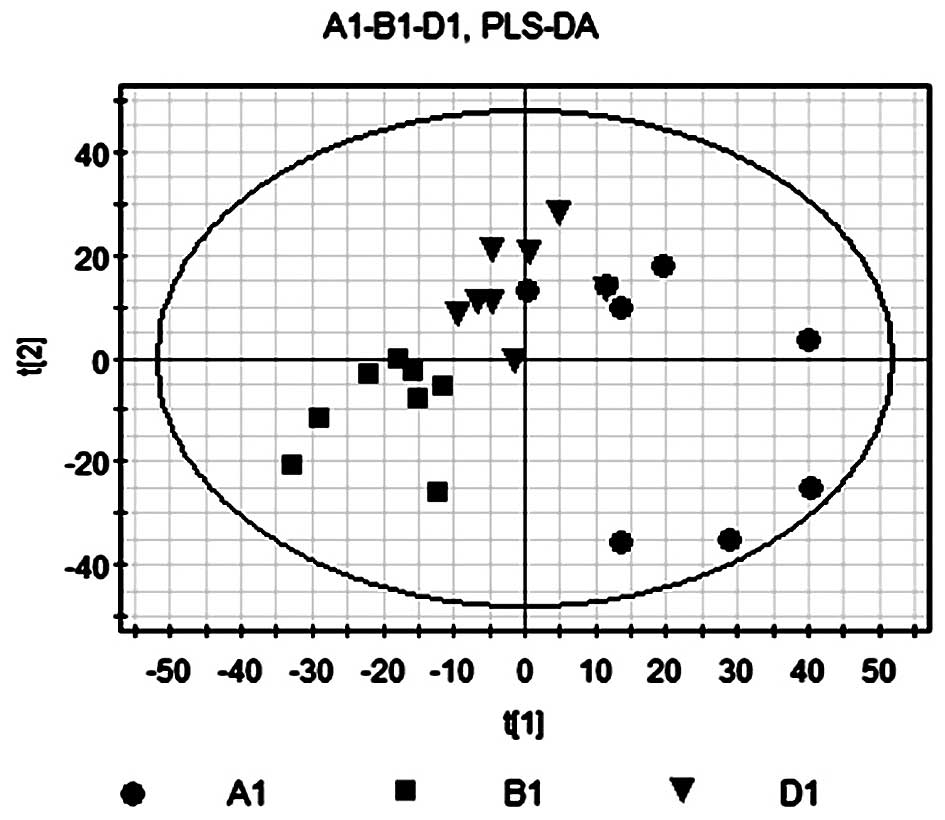
PLS-DA of A1, B1 and D1
PLS-DA was used as previously described in the
PLS-DA comparison of B1 and A1. The contribution rate of
supervision model was R2Y=0.998, which indicated that PLS-DA was a
reliable model for the differences between the two sample groups
and the model forecast rate Q2=0.859 demonstrated the predictive
ability of the model. As shown in Fig.
8, the model group in the right quadrants and the Bu-Fei
Jian-Pi-treated group in the left quadrants indicated that rats in
the D1 group had a significantly different metabolic profile from
that of rats in the untreated group.
Identification of metabolites with
different concentrations in A1, B1 and D1
Following treatment with Bu-Fei Jian-Pi, 13
metabolites had different concentrations among the three groups.
Eleven metabolites showed a negative fold change in the Bu-Fei
Jian-Pi-treated group compared to that of the model group; however,
minimal changes were observed in phenylpyruvic acid and α-D-Fucose
expression (Table III).
| Table IIIIdentification of 13 metabolites with
different concentration among A1, B1 and D1 according to the
Metabolite and Tandem Mass Spectometry Database of the Human
Metabolome Database. |
Table III
Identification of 13 metabolites with
different concentration among A1, B1 and D1 according to the
Metabolite and Tandem Mass Spectometry Database of the Human
Metabolome Database.
| Name | rt | m/z | metabolite | VIP (B1/A1) | fold (B1/A1) | VIP (B1/D1) | fold (D1/B1) |
|---|
| M279T535_1 | 8.92 | 279.23 | α-Linolenic
acid | 2.10 | 0.49 | 2.05 | −0.21 |
| M369T354 | 5.90 | 369.23 |
20-Hydroxy-PGE2 | 2.08 | 0.63 | 2.20 | −0.36 |
| M281T535 | 8.91 | 281.24 | Linoleic acid | 2.04 | 0.52 | 2.03 | −0.38 |
| M351T401 | 6.68 | 351.22 | Lipoxin A5 | 1.90 | 0.48 | 1.70 | −0.19 |
| M213T466 | 7.76 | 213.15 | 7-Oxo-11-dodecenoic
acid | 1.89 | 0.51 | 1.78 | −0.22 |
| M165T328 | 5.46 | 165.09 | 3-Phenylbutyric
acid | 1.72 | 0.38 | 1.60 | −0.18 |
| M331T430 | 7.16 | 331.27 | Eicosapentaenoic
acid ethyl ester | 1.71 | 0.48 | 1.82 | −0.31 |
| M214T302 | 5.03 | 214.14 |
N-Heptanoyl-homoserine lactone | 1.59 | 0.46 | 1.83 | −0.37 |
| M174T307 | 5.12 | 174.11 |
Acetyl-L-leucine | 1.56 | 0.50 | 1.78 | −0.39 |
| M337T492 | 8.21 | 337.24 | 11-Deoxy-PGE2 | 1.51 | 0.47 | 2.08 | −0.46 |
| M165T305 | 5.08 | 165.06 | Phenylpyruvic
acid | 1.37 | 0.68 | 2.27 | 0.24 |
| M165T318 | 5.29 | 165.08 | α-D-Fucose | 1.21 | 0.35 | 1.72 | 0.24 |
| M398T484 | 8.07 | 398.29 | PGE1
ethanolamide | 1.21 | 0.56 | 1.85 | −0.84 |
Discussion
COPD is a prevalent disease with high rates of
mortality (1). COPD is defined by
the persistent and increasing limitation of airflow, which may be
enhanced by exacerbations and the occurence of additional morbidity
in patients (2). Current treatment
of COPD uses conventional Western classes of medication proposed by
the Global Initiative for Chronic Obstructive Lung Diseases (GOLD)
(3). However, TCM has been used
for numerous years as an alternative method of treatment for COPD
patients. The present study aimed to elucidate the molecular
mechanisms of COPD via metabolomic analysis and to explore the
targets and intervention mechanisms of the common TCM granules
Bu-Fei Jian-Pi in a rat model of stable COPD.
In the present study Bu-Fei Jian-Pi granules were
produced from a selection of herbs according to a traditional
Chinese formula (5). Treatment was
performed over three months followed by a further three months
observation of the rats. The results revealed favourable effects on
COPD model rats, with no adverse events.
Metabonomics is a technique used in pharmaceutical
and clincal studies for rapidly analyzing biological dysfunction.
It may be used in conjunction with nuclear magnetic resonance (NMR)
of biological fluids using high resolution 1H
spectroscopic profiling and multivariate analyis in order to
identify metabolic changes associated with physiological conditions
(10,11).
Metabonics is defined as the quantitative
measurement of the response of living systems in dynamic
multi-parametric conditions to genetic modification or
pathophysiological stimuli (12).
It provides an overal quantification of the low-molecular
endogenous metabolites found in biological samples, including
tissue, urine and plasma (13,14).
Data sets provided by high-resolution 1H NMR
spectroscopy are complex and require chemometrics approaches in
order to visulize them and identify patterns in the spectral
measurements. Metabolites may therefore be used to classify models
for numerous disease states, toxic shock, genetic modifications and
dietary changes (15–19). PCA, SIMCA, PLS-DA and neural
networks are amongst the most frequently used chemometric
approaches for analyzing metabonomics data (13,18,20–22).
In the present study, PCA models were used in order
to explain the metabolic differences between the control and model
groups. The results demonstrated a significantly reduced
variablilty of the model group compared to that of the control
group; in addition, the separation trend along the vertical axis
was observably different between the two groups. This therefore
indicated that there was a significant difference between the
metabolic profiles of the model (B1) and control groups (A1).
Furthermore, the PLA-DA model showed that following noise
filtration, A1 and B1 had significant metabolic differences and the
OPLS-DA model demonstrated that samples from the model and control
groups were separately distributed on the opposite sides of the
first principal component (PC1). This provided further evidence for
the significant metabolic differences between the control and model
groups. The molecular weights of the 49 differentially concentrated
metabolites were then identified according to the Metlin
Database.
PCA models demonstrated that there was a weak, but
not significant separation trend between the model and Bu-Fei
Jian-Pi-treated groups. However, PLS-DA models indicated that
following treatment with Bu-Fei Jian-Pi, COPD rats had
significantly different metabolic profiles from those in the model
group. In addition, the results of the OPLS-DA revealed that the
samples from the model and the Bu-Fei Jian-Pi-treated groups were
distributed on opposite sides of the PC1, indicating that the two
groups had significant metabolic differences. The molecular weights
of the 31 differentially concentrated metabolites between the model
and Bu-Fei Jian-Pi groups were then identified according to the
Metlin Database.
Following treatment with Bu-Fei Jian-Pi, 13
metabolites had the same B1/A1 and B1/D1 ratio, indicating that
metabolite levels in mice of the B1 group were restored to those of
healthy mice (A1 group) following treatment. Eleven metabolites
showed a negative fold change in the Bu-Fei Jian-Pi-treated groups
compared to levels in the model group; however, minimal changes
were observed in phenylpyruvic acid and α-D-fucose levels.
COPD has an unpredictable clinical course with a
diverse range of phenotypes; as a result, its progression and
development remain difficult to determine and there have been no
clearly defined biomarkers (7).
However, previous studies have shown that the use of NMR and MS,
together with chemometric analysis, may be used to evaluate the
metabolic activities of biological systems. This may therefore be
used as a diagnostic tool for metabolomic analysis, with the
ability to observe qualitative and quantitative changes in cellular
metabolism (11). Furthermore,
these techniques may lead to the detection of homeostatic
disturbances prior to clincical manifestations of diseases
(12). There have been few
previous studies into the metabolic analysis of COPD; however, it
has been suggested that these metabolomic methods have the
potential to distinguish COPD from other diseases as well as
diagnose COPD, including its classification and stage of
progression (23).
In conclusion, the results of the present study
demonstrated significant metabolic differences in the lungs of COPD
model rats [constructed by smoke inhalation and recurrent bacterial
infection (24,25)] compared with
those of healthy control rats. In addition, COPD model rats treated
with the TCM Bu-Fei Jian-Pi granules were revealed to have a
significantly different spectrum of metabolites from that of
untreated COPD rats. This therefore indicated that TCM had a
significant beneficial effect in a rat model of stable COPD.
Furthermore, the significantly altered metabolite profile of COPD
rat models compared to that of the control rats may provide
evidence for potential COPD biomarkers. However, further studies
are required in order to assess the sensitivity and specificity of
these methods in COPD as well as to evaluate TCM treatment on COPD
via these specific potential biomarkers.
Acknowledgements
This study was supported by grants from the National
Natural Science Foundation of China (no. 81130062).
References
|
1
|
Raherison C and Girodet PO: Epidemiology
of COPD. Eur Respir Rev. 18:213–221. 2009. View Article : Google Scholar
|
|
2
|
Lin HH, et al: Effects of smoking and
solid-fuel use on COPD, lung cancer, and tuberculosis in China: a
time-based, multiple risk factor, modelling study. Lancet.
372:1473–1483. 2008. View Article : Google Scholar : PubMed/NCBI
|
|
3
|
Qaseem A, Wilt TJ, Weinberger SE, et al:
American college of Physicians; American Collage of Chest
Physicians; American Thoracic Society and European Respiratory
Society: Diagnosis and management of stable chronic obstructive
pulmonary disease: a clinical practice guideline update from the
American College of Physicians, American College of Chest
Physicians, American Thoracic Society, and European Respiratory
Society. Ann Intern Med. 155:179–191. 2011. View Article : Google Scholar : PubMed/NCBI
|
|
4
|
Calverley PM, Anderson JA, Celli B, et al:
Satmeterol and flutieasene propionate and survival in chronic
obstructive pulmonary disease. N Engl J Med. 356:775–789. 2007.
View Article : Google Scholar : PubMed/NCBI
|
|
5
|
Li JS, Wang ZW, Yu XQ, et al: Clinical
efficacy and safety of TCM for COPD at stable phase: A Systematic
review. Traditional Chinese Medicine of Liaoning. 37:229–232.
2010.
|
|
6
|
Li JS, Wang ZW, Yu XQ, et al: Systemic
evaluation of TCM for COPD in the acute stage of exacerbation.
Traditional Chinese Medicine of Tianjin. 25:428–431. 2008.
|
|
7
|
Zhang WJ and Zhang YP: Recent research in
chronic obstructive pulmonary disease treated with TCM. Clinical
Traditional Chinese Medicine of Beijing. 14:39–41. 2007.
|
|
8
|
Lu AP and Chen KJ: Chinese medicine
pattern diagnosis could lead to innovation in medical sciences.
Chin J Integr Med. 17:811–817. 2011. View Article : Google Scholar : PubMed/NCBI
|
|
9
|
Wang ZW, Li JS, et al: Symptom diagnosis
criteria for chronic obstructive pulmonary diseases at stationary
phase from literature. The Science of Traditional Chinese Medicine.
218:55–58. 2008.
|
|
10
|
Nicholls AW, Nicholson JK, Haselden JN and
Waterfield CJ: A metabonomic approach to the investigation of
drug-induced phospholipidosis: an NMR spectroscopy and pattern
recognition study. Biomarkers. 5:410–423. 2000. View Article : Google Scholar
|
|
11
|
Nicholson JK and Wilson ID: Understanding
‘global’ systems biology: metabonomics and the continuum of
metabolism. Nat Rev Drug Discov. 2:668–676. 2003. View Article : Google Scholar : PubMed/NCBI
|
|
12
|
Nicholson JK, Lindon JC and Holmes E:
‘Metabonomics’: understanding the metabolic responses of living
systems to pathophysiological stimuli via multivariate statistical
analysis of biological NMR spectroscopic data. Xenobiotica.
29:1181–1189. 1999. View Article : Google Scholar : PubMed/NCBI
|
|
13
|
Holmes E, Nicholls AW, Lindon JC, et al:
Chemometric models for toxicity classification based on NMR spectra
of biofluids. Chem Res Toxicol. 13:471–478. 2000. View Article : Google Scholar : PubMed/NCBI
|
|
14
|
Lindon JC, Nicholson JK, Holmes E, et al:
Metabonomics: Metabolic processes studied by NMR spectroscopy of
biofluids. Concepts Magn Reson. 12:289–320. 2000. View Article : Google Scholar
|
|
15
|
Brindle JT, Antti H, Holmes E, et al:
Rapid and noninvasive diagnosis of the presence and severity of
coronary heart disease using 1H-NMR-based metabonomics. Nat Med.
8:1439–1444. 2002. View Article : Google Scholar : PubMed/NCBI
|
|
16
|
Keun HC, Ebbels TM, Bollard ME, et al:
Geometric trajectory analysis of metabolic responses to toxicity
can define treatment specific profiles. Chem Res Toxicol.
17:579–587. 2004. View Article : Google Scholar : PubMed/NCBI
|
|
17
|
Lindon JC, Nicholson JK, Holmes E, et al:
Contemporary issues in toxicology the role of metabonomics in
toxicology and its evaluation by the COMET project. Toxicol Appl
Pharmacol. 187:137–146. 2003. View Article : Google Scholar : PubMed/NCBI
|
|
18
|
Holmes E, Nicholson JK and Tranter G:
Metabonomic characterization of genetic variations in toxicological
and metabolic responses using probabilistic neural networks. Chem
Res Toxicol. 14:182–191. 2001. View Article : Google Scholar : PubMed/NCBI
|
|
19
|
Solanky KS, Bailey NJ, et al: Application
of biofluid 1H nuclear magnetic resonance-based metabonomic
techniques for the analysis of the biochemical effects of dietary
isoflavones on human plasma profile. Anal Biochem. 323:197–204.
2003. View Article : Google Scholar : PubMed/NCBI
|
|
20
|
Holmes E and Antti H: Chemometric
contributions to the evolution of metabonomics: mathematical
solutions to characterising and interpreting complex biological NMR
spectra. Analyst. 127:1549–1557. 2002. View
Article : Google Scholar
|
|
21
|
Gavaghan CL, Wilson ID and Nicholson JK:
Physiological variation in metabolic phenotyping and functional
genomic studies: use of orthogonal signal correction and PLS-DA.
FEBS Lett. 530:191–196. 2002. View Article : Google Scholar : PubMed/NCBI
|
|
22
|
Ebbels T, Keun H, Beckonert O, et al:
Toxicity classification from metabonomic data using a density
superposition approach: ‘CLOUDS’. Anal Chim Acta. 490:109–122.
2003. View Article : Google Scholar
|
|
23
|
Młynarz P, Barg W, Deja S and Jankowska R:
Application of metabolomic in COPD diagnosing. Pol Merkur Lekarski.
33:207–212. 2012.(In Polish).
|
|
24
|
Li Y, Li SY, Li JS, et al: A rat model for
stable chronic obstructive pulmonary disease induced by cigarette
smoke inhalation and repetitive bacterial infection. Biol Pharm
Bull. 35:1752–1760. 2012. View Article : Google Scholar : PubMed/NCBI
|