Introduction
Down sydrome (DS) is a relatively frequent
chromosomal disorder. It is diagnosed in 1:500 to 1:800 of pregnant
females (1). DS is clinically
manifested by multiple somatic anomalies, mental retardation and
precocious dementia. Pathological examination of DS brains reveals
poor maturation, atrophy of the dendrites and the early appearance
of senile plaques, which are characteristic of Alzheimer’s disease
(AD). DS represents an important issue for affected families and
the society, but there is no effective treatment at present.
Advanced maternal age (35 years old) is an important risk factor
for fetal DS (2). The most popular
diagnostic strategy for DS relies in the combined detection of AFP,
hCG, uE3 and inhibin A, with a detection rate of 60–75% and a 5%
false positive rate (3). It is
important to find a safe and effective method for diagnosis of DS.
One strategy to achieve this is via identification of new
biomarkers using noninvasive proteomic approaches. In a previous
study, the isobaric tags for relative and absolute quantification
(iTRAQ) technique was combined with matrix-assisted laser
desorption/ionization (MALDI) time of flight (TOF)/TOF select
biomarkers (4). In this study,
iTRAQ was combined with Gene Ontology (GO) analysis, in order to
identify the proteins that are differentially expressed in DS and
their predicted functions.
Proteomic approaches are a promising tool for the
identification of diagnostic biomarkers of DS (5). iTRAQ was developed by Applied
Biosystems, Inc. (Foster City, CA, USA) in 2004. iTRAQ-based
proteomic analysis represents a major development in the rapid
detection of potential biomarkers. The key advantage of the 8-plex
iTRAQ system is the ability to simultaneously analyze up to 8
different biological specimens, thereby increasing the throughput
while reducing experimental errors (6). iTRAQ has been recently employed in
the study of certain diseases (7–9). In
this study, we used iTRAQ in conjunction with multidimensional
chromatography, followed by GO analysis, to detect and quantify
proteome differences.
Materials and methods
Samples
Umbilical cord blood samples were obtained from
April-August 2011 from pregnant females, six carrying a DS fetus
(age, 27–37) and 11 carrying a healthy fetus (age, 27–37), at the
Shenzhen People’s Hospital (Shenzhen, China). Diagnosis of DS in
these women was performed by chromosomal examination. This study
was undertaken with the approval of the Institutional Ethical Board
of Guilin 181st Hospital (Guilin, China), and written informed
consent was provided by all subjects.
Sample preparation
Cord blood (10 ml) was collected from enrolled
subjects in heparinized vacutainers. The samples were centrifuged
at 3,000 × g for 30 min at 10°C, the plasma was separated, and
100-μl aliquots were stored at −80°C until further use.
Protein extraction
Total protein was extracted from the plasma samples
with the ProteoMiner protein enrichment kit (Bio-Rad Laboratories,
Hercules, CA, USA) as per the manufacturer’s instructions. Protein
concentration was measured with the Pierce™BCA Protein Assay kit
(Thermo Fisher Scientific, Waltham, MA, USA). A previous study
indicated that extensive analysis of well-characterized pooled
samples is more effective than analysis of individual samples
(10). In this study, 40 μg of
protein from each sample was pooled with protein samples of the DS
or control group prior to proteomic analysis.
iTRAQ, strong cation exchange (SCX) and
mass spectrometry (MS)/MS
The proteins from each pool were blocked, digested,
and labeled in accordance with the protocol of the Applied
Biosystems iTRAQ™ Reagents system (Thermo Fisher Scientific). The
iTRAQ tags were as follows: healthy control, 114; DS, 116. The
labeled peptides were combined into one sample.
Multidimensional liquid chromatography was performed
to separate the tryptic peptides prior to MS. The combined samples
were separated into 10 SCX fractions using a 35×0.3 mm, 300Å,
3.5-μm particle size column (Zorbax Bio-SCX; Agilent, Santa Clara,
CA, USA) with a potassium formate gradient in 25% acetonitrile. The
peptides in these fractions were further separated on a Tempo™ LC
nanoflow and MALDI spotting system, equipped with a reversed-phase
Magic C18AQ column (Applied Biosystems Life Technologies, Foster
City, CA, USA). Each chromatography run yielded ~380 MALDI spots on
a stainless steel MALDI target plate, by the same method as
previously described (4).
MS data acquisition was conducted with a 4800 Plus
MALDI TOF/TOF™ analyzer (Applied Biosystems, Inc.). Only peaks with
a signal-to-noise ratio ≥40 were selected for tandem mass
spectrometry. Mass spectra from 500 laser shots were acquired for
each spot. The combined MS/MS data from all 10 fractions were used
for a Paragon Algorithm (11)
search. Human version 3.62 proteome data were downloaded from the
EBI website (http://www.ebi.ac.uk/) (4).
Statistical and GO analysis
Proteins that provided tryptic peptides with an
average reporter ion ratio ≥1.5 were classified as upregulated and
those with an average reporter ion ratio ≤0.67 as downregulated. To
further investigate the functions of the identified proteins, we
used the online GO tool WEGO (http://wego.genomics.org.cn/), which allowed
annotation of the proteins with regards to the molecular function
(MF), cellular component (CC) and biological process (BP) with
which they are associated.
Results
Proteome of the umbilical cord blood
Using peptides of >1 an average reporter ion
ratio ≥1.5 and an average reporter ion ratio ≤0.67 as cutoffs, 505
proteins were identified and quantified from the plasma. These
proteins, from the pooled sample composed of individuals diagnosed
with DS, were divided into 13 upregulated and 6 downregulated
compared to healthy subjects, as shown in Table I.
 | Table IThe upregulated and downregulated
proteins in umbilical cord blood samples of Down syndrome
fetuses. |
Table I
The upregulated and downregulated
proteins in umbilical cord blood samples of Down syndrome
fetuses.
| UniProt accession
no. | Protein name | Peptides | Ratio |
|---|
| Upregulated proteins
(n=13) |
| Q8N1G4 | Leucine-rich
repeat-containing protein 47 | 3 | 60.27 |
| Q9UNM6 | 26S proteasome
non-ATPase regulatory subunit 13 | 1 | 60.27 |
| P55209 | Nucleosome assembly
protein 1-like 1 | 2 | 60.27 |
| Q6P1M3 | Lethal (2) giant
larvae protein homolog 2 | 1 | 60.27 |
| Q96HE7 | ERO1-like protein
α | 2 | 60.27 |
| Q9ULD0 | 2-oxoglutarate
dehydrogenase-like, mitochondrial | 10 | 60.27 |
| P63313 | Thymosin β-10 | 4 | 60.27 |
| O43681 | ATPase ASNA1 | 3 | 60.27 |
| Q9UHI5 | Large neutral amino
acids transporter small subunit 2 | 2 | 60.27 |
| Q9Y6X5 | Ectonucleotide
pyrophosphatase/phosphodiesterase family member 4 | 1 | 60.27 |
| P02649 | Apolipoprotein E | 40 | 3.75 |
| P00751 | Complement factor
B | 7 | 1.96 |
| P02743 | Amyloid P component,
serum | 7 | 1.68 |
| Downregulated
proteins (n=6) |
| Q9H1E5 | Thioredoxin-related
transmembrane protein 4 | 1 | 0.01 |
| Q9UHV9 | Prefoldin subunit
2 | 3 | 0.01 |
| Q01433 | AMP deaminase 2 | 1 | 0.01 |
| Q00765 | Receptor
expression-enhancing protein 5 | 4 | 0.01 |
| P43243 | Matrin-3 | 4 | 0.01 |
| P10451 | Osteopontin | 1 | 0.44 |
Among the differentially expressed proteins in
Table I and based on published
studies, 5 proteins [apolipoprotein E, complement factor B (CFB),
amyloid P component, serum (APCS), matrin-3 and osteopontin (OPN)]
were found to be relevant to DS, with the first three being
markedly upregulated in DS. The remaining proteins [leucine-rich
repeat-containing protein 47, 26S proteasome non-ATPase regulatory
subunit 13, nucleosome assembly protein 1-like 1, lethal (2) giant larvae protein homolog 2,
endoplasmic oxidoreductin-1-like (ERO1-like) protein α,
2-oxoglutarate dehydrogenase-like, mitochondrial, thymosin β-10,
ATPase ASNA1, large neutral amino acids transporter small subunit
2, ectonucleotide pyrophosphatase/phosphodiesterase family member
4, thioredoxin-related transmembrane protein 4, prefoldin subunit
2, AMP deaminase 2 and receptor expression-enhancing protein 5]
showed the highest ratios (60.27 and 0.01), compared to healthy
controls.
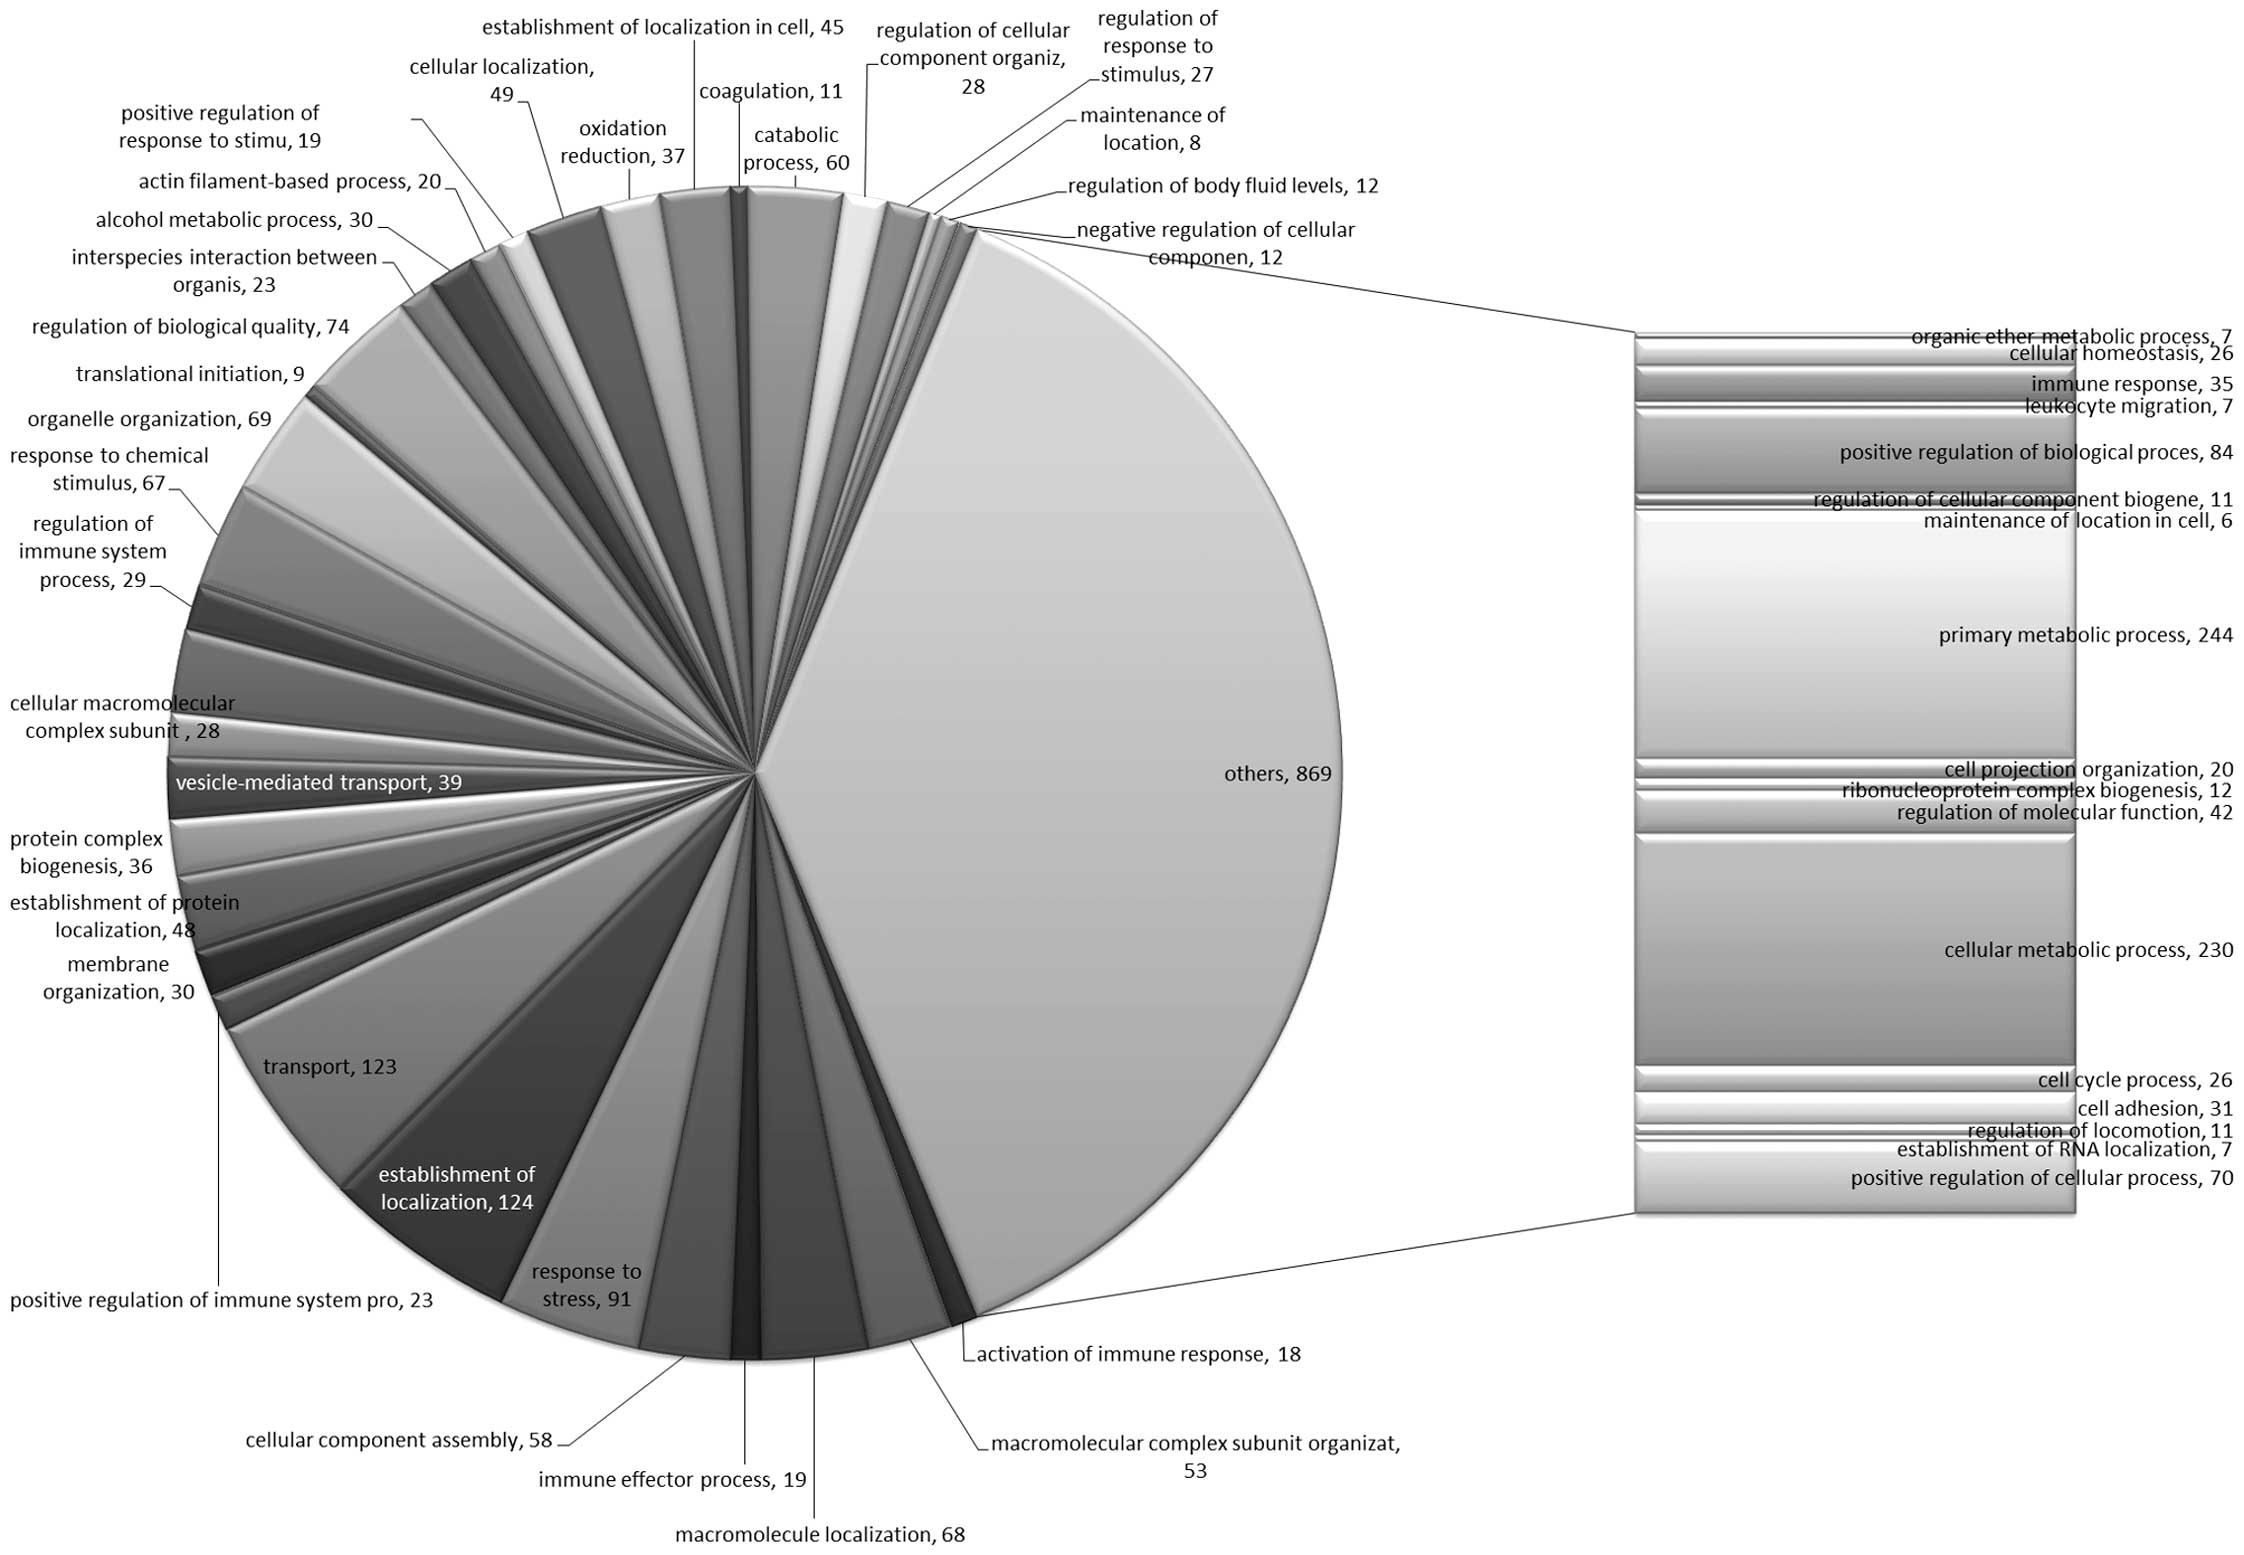
The 505 proteins were assigned to MF, CC and BP GO
terms; the distribution of these proteins in the three GO term
categories is shown in Figs.
1–3. The top 5 MFs in terms of
relative proportion were protein binding, hydrolase activity,
nucleotide binding, oxidoreductase activity and lipid binding
(Table IIA). The top 5 CCs were
intracellular, intracellular part, intracellular organelle,
membrane-bounded organelle and organelle part (Table IIB). The top 5 BPs were primary
metabolic process, cellular metabolic process, establishment of
localization, transport and positive regulation of BP (Table IIC). The full list of MF, CC and
BP associated with apolipoprotein E, CFB, APCS, matrin-3 and OPN is
shown in Table III. MF, CC and
BP terms for the proteins which showed the highest fold difference
are presented in Table IV.
| Table IIThe top 5 molecular function,
cellular component and biological process Gene Ontology terms for
the 505 proteins. |
Table II
The top 5 molecular function,
cellular component and biological process Gene Ontology terms for
the 505 proteins.
| A, Top 5 molecular
functions |
|---|
|
|---|
| Molecular
function | Count | Proportion (%) |
|---|
| Protein
binding | 326 | 64.94 |
| Hydrolase
activity | 89 | 17.73 |
| Nucleotide
binding | 83 | 16.53 |
| Oxidoreductase
activity | 43 | 8.57 |
| Lipid binding | 32 | 6.37 |
|
| B, Top 5 cellular
components |
|
| Cellular
component | Count | Proportion (%) |
|
| Intracellular | 405 | 80.68 |
| Intracellular
part | 403 | 80.28 |
| Intracellular
organelle | 318 | 63.35 |
| Membrane-bounded
organelle | 278 | 55.38 |
| Organelle part | 191 | 38.05 |
|
| C, Top 5 biological
processes |
|
| Biological
process | Count | Proportion (%) |
|
| Primary metabolic
process | 244 | 48.61 |
| Cellular metabolic
process | 230 | 45.82 |
| Establishment of
localization | 124 | 24.7 |
| Transport | 123 | 24.5 |
| Response to
stress | 91 | 18.13 |
| Table IIIMolecular function, cellular
component, and biological process Gene Ontology terms associated
with apolipoprotein E, complement factor B, amyloid P component,
serum, matrin-3 and osteopontin. |
Table III
Molecular function, cellular
component, and biological process Gene Ontology terms associated
with apolipoprotein E, complement factor B, amyloid P component,
serum, matrin-3 and osteopontin.
| UnipProt no. | Protein name | Molecular
function | Cellular
component | Biological
process |
|---|
| P02649 | Apolipoprotein
E | Protein binding,
lipid binding pattern binding, carbohydrate binding | Intracellular part,
intracellular, extracellular space, intracellular organelle,
extracellular region part, plasma lipoprotein particle,
protein-lipid complex, membrane-bounded organelle, cell surface,
cell soma, cell projection | Macromolecular
complex subunit organization, macromolecule localization, cellular
component assembly, response to stress, establishment of
localization, transport, membrane organization, vesicle-mediated
transport, response to chemical stimulus, organelle organization,
regulation of biological quality, alcohol metabolic process,
cellular localization, establishment of localization in cell,
catabolic process, regulation of cellular component organization,
maintenance of location, organic ether metabolic process, cellular
homeostasis, positive regulation of biological process, maintenance
of location in cell, primary metabolic process, regulation of
molecular function, cellular metabolic process, regulation of
locomotion, positive regulation of cellular process |
| P00751 | Complement factor
B | Protein binding,
hydrolase activity | Intracellular part,
intracellular, protein complex | Activation of
immune response, immune effector process, response to stress,
positive regulation of immune system process, response to external
stimulus, regulation of immune system process, response to chemical
stimulus, positive regulation of response to stimulus, regulation
of response to stimulus, immune response, positive regulation of
biological process, primary metabolic process |
| P02743 | Amyloid P
component, serum | Protein binding,
carbohydrate binding | Protein complex,
extracellular space, extracellular region part | Macromolecular
complex subunit organization, cellular component assembly, response
to stress, protein complex biogenesis, cellular macromolecular
complex subunit, response to chemical stimulus, primary metabolic
process, cellular metabolic process |
| P43243 | Matrin-3 | Protein binding,
nucleotide binding | Intracellular part,
intracellular, organelle part, intracellular organelle part,
intracellular organelle, organelle membrane, organelle envelope,
membrane-bounded organelle, organelle lumen, endomembrane
system | |
| P10451 | Osteopontin | Protein binding,
extracellular matrix binding | Intracellular part,
intracellular, extracellular space, extracellular region part,
vesicle, apical part of cell, cell projection | Response to stress,
response to external stimulus, response to chemical stimulus,
regulation of cellular component organization, regulation of
response to stimulus, negative regulation of cellular component,
positive regulation of biological process, cell adhesion, positive
regulation of cellular process |
| Table IVMolecular function, cellular
component, and biological process Gene Ontology terms associated
with proteins that showed the highest fold difference. |
Table IV
Molecular function, cellular
component, and biological process Gene Ontology terms associated
with proteins that showed the highest fold difference.
| UniProt no. | Protein name | Molecular
function | Cellular
component | Biological
process |
|---|
| Upregulated
proteins |
| Q8N1G4 | Leucine-rich
repeat-containing protein 47 | Protein
binding | | Primary metabolic
process, cellular metabolic process |
| Q9UNM6 | 26S proteasome
non-ATPase regulatory subunit 13 | Protein
binding | Intracellular part,
intracellular, protein complex | Catabolic process,
positive regulation of biological process, primary metabolic
process, regulation of molecular function, cellular metabolic
process, cell cycle process, positive regulation of cellular
process |
| P55209 | Nucleosome assembly
protein 1-like 1 | Protein
binding | Intracellular part,
intracellular, protein complex, organelle part, intracellular
organelle part, intracellular organelle, vesicle | Macromolecular
complex subunit organization, cellular component assembly, cellular
macromolecular complex subunit, organelle organization, positive
regulation of biological process, primary metabolic process,
cellular metabolic process, establishment of localization in
cell |
| Q6P1M3 | Lethal (2) giant
larvae protein homolog 2 | | Intracellular part,
intracellular | Establishment of
localization, transport, vesicle-mediated transport, cellular
localization, establishment of localization in cell |
| Q96HE7 | ERO1-like protein
α | Protein binding,
cofactor binding, oxidoreductase activity, nucleotide binding | Intracellular part,
intracellular, organelle part, intracellular organelle part,
intracellular organelle, organelle membrane, cell fraction,
membrane-bounded organelle, endomembrane system | Response to stress,
establishment of localization, transport, response to chemical
stimulus, oxidation reduction, primary metabolic process, cellular
metabolic process |
| Q9ULD0 | 2-oxoglutarate
dehydrogenase-like, mitochondrial | Cofactor binding,
oxidoreductase activity, vitamin binding | Intracellular part,
intracellular, organelle part, intracellular organelle part,
intracellular organelle, membrane-bounded organelle, organelle
lumen | Alcohol metabolic
process, oxidation reduction, catabolic process, primary metabolic
process, cellular metabolic process |
| P63313 | Thymosin β-10 | Protein
binding | Intracellular part,
intracellular, intracellular organelle, non-membrane-bounded
organelle | Macromolecule
localization, organelle organization, regulation of biological
quality, actin filament-based process, regulation of cellular
component organization, maintenance of location, negative
regulation of cellular component, regulation of cellular component
biogene |
| O43681 | ATPase ASNA1 | Hydrolase activity,
nucleotide binding | Intracellular part,
intracellular, organelle part, intracellular organelle part,
intracellular organelle, cell fraction, membrane-bounded organelle,
non-membrane-bounded organelle, organelle lumen | Establishment of
localization, transport, response to chemical stimulus, regulation
of biological quality, cellular homeostasis |
| Q9UHI5 | Large neutral amino
acids transporter small subunit 2 | Protein
binding | Intracellular part,
intracellular | Establishment of
localization, transport, response to chemical stimulus, regulation
of biological quality, primary metabolic process, cellular
metabolic process |
| Q9Y6X5 | Ectonucleotide
pyrophosphatase/phosphodiesterase family member 4 | Hydrolase
activity | | |
| Downregulated
proteins |
| Q9H1E5 | Thioredoxin-related
transmembrane protein 4 | | Intracellular part,
intracellular, intracellular organelle, membrane-bounded
organelle | Establishment of
localization, transport, regulation of biological quality,
oxidation reduction, cellular homeostasis, cellular metabolic
process |
| Q9UHV9 | Prefoldin subunit
2 | Protein
binding | Intracellular part,
intracellular, protein complex | Primary metabolic
process, cellular metabolic process |
| Q01433 | AMP deaminase
2 | Hydrolase
activity | | Primary metabolic
process, cellular metabolic process |
| Q00765 | Receptor
expression-enhancing protein 5 | Protein
binding | | |
Discussion
Quantification of the proteins via iTRAQ analysis
has been suggested to be a suitable strategy for the identification
of biomarkers, since iTRAQ allows the comparison of protein
abundance among samples by measuring the peak intensities of
reporter ions released from the iTRAQ-tagged peptides. In this
study, we adopted iTRAQ technology and GO analysis to
quantitatively analyse the proteome of plasma from the umbilical
cord blood of DS fetus-carrying mothers, in order to identify
useful biomarkers for DS. As a result, 505 proteins were
identified, and were classified to MF, CC and BP terms by GO
analysis. Among the up- and downregulated proteins in DS (Table I), we focused on 5 (apolipoprotein
E, CFB, APCS, matrin-3, and OPN) to verify whether these may
constitute novel DS biomarkers.
A putative risk factor for AD in the general
population, the E4 allele of the apolipoprotein E gene, has
highlighted the role of genetic influences in AD. It has long been
recognized that DS is associated with early and severe development
of AD neuropathological lesions (12). APCS and the Ig λ chain C region
were also found in the sera of patients with DS in another study
(8). We found that the
concentration of apolipoprotein E in the plasma of umbilical cord
blood was 3.75 times (x) higher in the DS compared to the control
group The MF, CC and BP GO terms associated with apolipoprotein E
are shown in Table III.
CFB plays an important role in the alternative
complement pathway in AD (13),
which shares a number of similar features with DS. Yu et al
(14) found that the concentration
of CFB is significantly increased in the serum of mothers with
fetuses affected by DS. CFB may be associated with the brain damage
that occurs in DS. In certain studies, CFB was associated with
brain diseases, and a relationship between DS and the complement
system was revealed (13,15–17).
In the present study, we found that the concentration of CFB in the
plasma of umbilical cord blood was 1.95× higher in the DS compared
to the control group. The MFs associated with CFB were protein
binding and hydrolase activity. The CCs associated with CFB were
intracellular part, intracellular and protein complex. The BPs
associated with CFB included activation of immune response, immune
effector process, and response to stress (full list in Table III).
The APCS glycoprotein is encoded by a single gene
locating on the human chromosome 1, has 204 residues, and is
secreted (18). APCS
immunoreactivity is commonly observed in DS, AD, and amyloid
disorders with primarily cerebrovascular compromise (19,20).
In the present study, we found that the concentration of APCS in
the plasma of umbilical cord blood was 1.68× higher in the DS
compared to the control group. The MFs, CCs and BPs associated with
APCS are listed in Table III.
The MFs were protein and carbohydrate binding, the CCs were protein
complex, extracellular space and extracellular region part, and the
BPs included macromolecular complex subunit organization, CC
assembly, response to stress, and protein complex biogenesis
(Table III).
OPN is a secreted glycoprotein with an
arginine-glycine-aspartic acid (RGD) sequence, and able to bind a
number of receptors, including the integrins and certain variant
forms of CD44. OPN plays an important role in diverse
fibro-inflammatory diseases. OPN is expressed in hepatocytes and
macrophage-like cells in DS individuals showing perinatal liver
fibrosis. OPN was thus proposed to be involved in the pathogenesis
of perisinusoidal liver fibrosis, frequently observed in neonates
with DS (21). We found that the
concentration of OPN in the plasma of umbilical cord blood was
2.27× lower in the DS compared to the control group. The MFs, CCs
and BPs associated with OPN are displayed in Table III. The MFs were protein and
extracellular matrix binding, the CCs included intracellular part,
intracellular, and extracellular space, while the BPs included
response to stress, external stimulus, and chemical stimulus
(Table III).
Matrin-3 is an inner nuclear matrix protein of 125
kDa, which is highly conserved in mammals (22). Matrin-3 contains a bipartite
nuclear localization signal, two zinc finger domains, and two
canonical RNA recognition motifs (23). Matrin-3 is encoded by the
MATR3 gene, which is expressed in skeletal muscle (24). Autosomal and the active X
chromosome territories were found to express matrin-3 (25). Matrin-3 was also found to be a
target of the ataxia telangiectasia mutated (ATM) protein kinase
(26). Degradation of matrin-3 may
be a key cellular event, which induces a shift from apoptotic to
necrotic death (27). Matrin-3
expression was significantly decreased in the fetal DS brain
(28). The manifold decreased spot
unambiguously assigned to matrin-3 in previous studies may reflect
or induce aberrant transcription reported to occur in DS (28,29).
In this study, we found that the concentration of matrin-3 in the
plasma of umbilical cord blood was 100× lower in the DS compared to
the control group. We did not found a BP term associated with
matrin-3. The MFs associated with matrin-3 were protein and
nucleotide binding, and the CCs included intracellular part,
intracellular, and organelle part (Table III).
In conclusion, the iTRAQ technology, a relatively
new strategy for proteomic analysis, was used here to study the
changes in protein expression associated with DS. This approach
identified 5 significantly differentially expressed proteins
(apolipoprotein E, CFB, APCS, matrin-3 and OPN), which were
previously reported to relate to DS. The MFs, CCs and BPs
associated with these proteins indicate that they may be suitable
DS biomarkers. However, further investigation of the functions of
these proteins, as well as of the proteins with high fold changes
in DS identified herein is required.
Acknowledgements
We thank the patients and healthy volunteers who
participated in this study, as well as teachers and classmates for
their help. This study was supported by the Guangxi Key Laboratory
Construction Project planning program 12-071-32, the Guangdong
Provincial S&T program (2012B032000008), the Shenzhen S&T
program 201202121 (2013–2014), the Innovation and Technology
Commission of the Shenzhen Municipal Science and Technology Plan
Project (CXZZ20130321090846345) and the Guilin Technology Plan
(20110328 and 20130120-21).
References
|
1
|
Sherman SL, Allen EG, Bean LH and Freeman
SB: Epidemiology of Down syndrome. Ment Retard Dev Disabil Res Rev.
13:221–227. 2007. View Article : Google Scholar : PubMed/NCBI
|
|
2
|
Kwon JY, Park IY, Kwon SM, Kim CJ and Shin
JC: The quadruple test for Down syndrome screening in pregnant
women of advanced maternal age. Arch Gynecol Obstet. 285:629–633.
2012. View Article : Google Scholar
|
|
3
|
Kolialexi A, Tsangaris GT, Papantoniou N,
et al: Application of proteomics for the identification of
differentially expressed protein markers for Down syndrome in
maternal plasma. Prenat Diagn. 28:691–698. 2008. View Article : Google Scholar : PubMed/NCBI
|
|
4
|
Wang L, Dai Y, Qi S, Sun B, Wen J, Zhang L
and Tu Z: Comparative proteome analysis of peripheral blood
mononuclear cells in systemic lupus erythematosus with iTRAQ
quantitative proteomics. Rheumatol Int. 32:585–593. 2012.
View Article : Google Scholar
|
|
5
|
Garbis SD, Tyritzis SI, Roumeliotis T, et
al: Search for potential markers for prostate cancer diagnosis,
prognosis and treatment in clinical tissue specimens using
amine-specific isobaric tagging (iTRAQ) with two-dimensional liquid
chromatography and tandem mass spectrometry. J Proteome Res.
7:3146–3158. 2008. View Article : Google Scholar : PubMed/NCBI
|
|
6
|
Bouchal P, Roumeliotis T, Hrstka R,
Nenutil R, Vojtesek B and Garbis SD: Biomarker discovery in
low-grade breast cancer using isobaric stable isotope tags and
two-dimensional liquid chromatography-tandem mass spectrometry
(iTRAQ-2DLC-MS/MS) based quantitative proteomic analysis. J
Proteome Res. 8:362–373. 2009. View Article : Google Scholar
|
|
7
|
Sun C, Song C, Ma Z, et al: Periostin
identified as a potential biomarker of prostate cancer by
iTRAQ-proteomics analysis of prostate biopsy. Proteome Science.
9:222011. View Article : Google Scholar : PubMed/NCBI
|
|
8
|
Kolla V, Jenö P, Moes S, Tercanli S,
Lapaire O, Choolani M and Hahn S: Quantitative proteomics analysis
of maternal plasma in Down syndrome pregnancies using isobaric
tagging reagent (iTRAQ). J Biomed Biotechnol. 2010:9520472010.
View Article : Google Scholar
|
|
9
|
Sui W, Tang D, Zou G, Chen J, Ou M, Zhang
Y and Dai Y: Differential proteomic analysis of renal tissue in
lupus nephritis using iTRAQ reagent technology. Rheumatol.
32:3537–3543. 2012. View Article : Google Scholar
|
|
10
|
Abdi F, Quinn JF, Jankovic J, et al:
Detection of biomarkers with a multiplex quantitative proteomic
platform in cerebrospinal fluid of patients with neurodegenerative
disorders. J Alzheimers Dis. 9:293–348. 2006.PubMed/NCBI
|
|
11
|
Shilov IV, Seymour SL, Patel AA, et al:
The Paragon Algorithm, a next generation search engine that uses
sequence temperature values and feature probabilities to identify
peptides from tandem mass spectra. Mol Cell Proteomics.
6:1638–1655. 2007. View Article : Google Scholar : PubMed/NCBI
|
|
12
|
Hyman BT, West HL, Rebeck GW, et al:
Quantitative analysis of senile plaques in Alzheimer disease:
Observation of log-normal size distribution and molecular
epidemiology of differences associated with apolipoprotein E
genotype and trisomy 21 (Down syndrome). Proc Natl Acad Sci USA.
92:3586–3590. 1995. View Article : Google Scholar : PubMed/NCBI
|
|
13
|
Strohmeyer R, Shen Y and Rogers J:
Detection of complement alternative pathway mRNA and proteins in
the Alzheimer’s disease brain. Brain Res Mol Brain Res. 81:7–18.
2000. View Article : Google Scholar : PubMed/NCBI
|
|
14
|
Yu B, Zhang B, Wang J, Wang QW, Huang RP,
Yang YQ and Shao SH: Preliminary proteomic-based identification of
a novel protein for Down’s syndrome in maternal serum. Exp Biol Med
(Maywood). 237:530–539. 2012. View Article : Google Scholar
|
|
15
|
Kossmann T, Stahel PF, Morganti-Kossmann
MC, Jones JL and Barnum SR: Elevated levels of the complement
components C3 and factor B in ventricular cerebrospinal fluid of
patients with traumatic brain injury. J Neuroimmunol. 73:63–69.
1997. View Article : Google Scholar : PubMed/NCBI
|
|
16
|
Head E, Azizeh BY, Lott IT, Tenner AJ,
Cotman CW and Cribbs DH: Complement association with neurons and
beta-amyloid deposition in the brains of aged individuals with Down
syndrome. Neurobiol Dis. 8:252–265. 2001. View Article : Google Scholar : PubMed/NCBI
|
|
17
|
Stoltzner SE, Grenfell TJ, Mori C,
Wisniewski KE, Wisniewski TM, Selkoe DJ and Lemere CA: Temporal
accrual of complement proteins in amyloid plaques in Down’s
syndrome with Alzheimer’s disease. Am J Pathol. 156:489–499. 2000.
View Article : Google Scholar : PubMed/NCBI
|
|
18
|
Pepys MB, Baltz ML, de Beer FC, et al:
Biology of serum amyloid P component. Ann NY Acad Sci. 389:286–298.
1982. View Article : Google Scholar : PubMed/NCBI
|
|
19
|
Perlmutter LS, Barrón E, Myers M, Saperia
D and Chui HC: Localization of amyloid P component in human brain:
vascular staining patterns and association with Alzheimer’s
disease. J Comp Neurol. 352:92–105. 1995. View Article : Google Scholar : PubMed/NCBI
|
|
20
|
Rowe IF, Jennson O, Lewis P, Candy J,
Tennent GA and Pepys MB: Immunohistochemical demonstration of
amyloid P component in cerebro-vascular amyloidosis. Neuropathol
Appl Neurobiol. 10:53–61. 1984. View Article : Google Scholar : PubMed/NCBI
|
|
21
|
Tokairin T, Nishikawa Y, Watanabe H, et
al: Osteopontin expression in the liver with severe perisinusoidal
fibrosis: Autopsy case of Down syndrome with transient
myeloproliferative disorder. Pathol Int. 58:64–68. 2008. View Article : Google Scholar
|
|
22
|
Belgrader P, Dey R and Berezney R:
Molecular cloning of matrin 3. A 125-kilodalton protein of the
nuclear matrix contains an extensive acidic domain. J Biol Chem.
266:9893–9899. 1991.PubMed/NCBI
|
|
23
|
Hisada-Ishii S, Ebihara M, Kobayashi N and
Kitagawa Y: Bipartite nuclear localization signal of matrin 3 is
essential for vertebrate cells. Biochem Biophys Res Commun.
354:72–76. 2007. View Article : Google Scholar : PubMed/NCBI
|
|
24
|
Senderek J, Garvey SM, Krieger M, et al:
Autosomal-dominant distal myopathy associated with a recurrent
missense mutation in the gene encoding the nuclear matrix protein,
matrin 3. Am J Hum Genet. 84:511–518. 2009. View Article : Google Scholar : PubMed/NCBI
|
|
25
|
Zeitz MJ, Malyavantham KS, Seifert B and
Berezney R: Matrin 3: chromosomal distribution and protein
interactions. J Cell Biochem. 108:125–133. 2009. View Article : Google Scholar : PubMed/NCBI
|
|
26
|
Salton M, Lerenthal Y, Wang SY, Chen DJ
and Shiloh Y: Involvement of Matrin 3 and SFPQ/NONO in the DNA
damage response. Cell Cycle. 9:1568–1576. 2010. View Article : Google Scholar : PubMed/NCBI
|
|
27
|
Przygodzka P, Boncela J and Cierniewski
CS: Matrin 3 as a key regulator of endothelial cell survival. Exp
Cell Res. 317:802–811. 2011. View Article : Google Scholar
|
|
28
|
Bernert G1, Fountoulakis M and Lubec G:
Manifold decreased protein levels of matrin 3, reduced motor
protein HMP and hlark in fetal Down’s syndrome brain. Proteomics.
2:1752–1757. 2002. View Article : Google Scholar : PubMed/NCBI
|
|
29
|
Labudova O, Krapfenbauer K, Moenkemann H,
Rink H, Kitzmüller E, Cairns N and Lubec G: Decreased transcription
factor junD in brains of patients with Down syndrome. Neurosci
Lett. 252:159–162. 1998. View Article : Google Scholar : PubMed/NCBI
|