Introduction
The development of cancer is considered to be a
multistep process dependent on genetic and environmental factors.
Cervical cancer develops from precursor lesions of the cervix
called squamous intraepithelial lesions (SILs). Progression from
normal tissue to invasive cervical cancer (ICC) occurs through a
series of increasing grades of SILs; low-grade squamous
intraepithelial lesions (L-SILs) and high-grade squamous
intraepithelial lesions (H-SILs) (1). Persistent human papillomavirus (HPV)
infection is a key factor in this process (2). Little is known about the secondary
factors or cofactors associated with the progression from
persistent HPV infection to precancerous lesions and invasive
cancer. Tumor cells overcome the restriction of replication cycles
and regulation of apoptosis observed in normal cells, and
essentially become immortal. One of the regulators of apoptosis and
proliferation is insulin-like growth factor-1 (IGF-1) (3). IGF-1 is an endocrine and
paracrine/autocrine growth factor secreted by numerous tissues. IGF
is a complex axis consisting of two ligands (IGF-1/IGF-2), two
insulin-like growth factor receptors 1 and 2 (IGFR-1, IGFR-2), six
insulin-like growth factor binding proteins (IGFBP-1 to 6), four
insulin-like growth factor binding protein-related peptides
(IGFBP-rP-1 to 4), insulin and insulin receptor (INSR) (4).
Several studies suggest that the IGF axis may play a
significant role in the development of cancer. The role of IGF in
cancer susceptibility appears to be multifactorial, and the
preponderance of data suggests a slightly increased risk of certain
cancers due to the higher activity of the IGF system (5). Conversely, patients with congenital
deficiencies in IGF-1 demonstrate a protective effect against
cancer development (6). According
to Laron et al (6),
congenital absence of IGF protects against the development and
progression of neoplastic processes.
Despite the number of factors that influence IGF-1
levels, it has been estimated that up to 60% of the variability has
a genetic basis (7,8). The gene encoding for the human
protein IGF-1 is located in the long arm of chromosome 12
(12q22–24.1), covers an area of ~90 kb and contains six exons
separated by long (1.9–50 kb) introns. The sequence of the IGF-1
gene is highly conserved, and its transcription is under the
control of two promoters, P1 and P2. The P1 promoter regulatory
region of the IGF-1 gene is highly polymorphic. It is estimated
that approximately 90% of IGF-1 transcripts control P1. The P1
promoter region of the human genome consists of 322 nucleotides
located in the 5′UTR of exon 1 and a regulatory region of 1,630
nucleotides. The most conserved is the 322-nucleotide stretch of
the 5′UTR. The P1 promoter sequence lacks typical sequences of
other genes, such as the TATA or CCAAT element and other areas rich
in GC. The P1 promoter has five sections protected from DNase
digestion: HS3A, HS3B, HS3C, HS3D and HS3E. HS3D is considered to
be responsible for the regulation of the expression of IGF-1 by
estrogens (9,10). The position 648 bp of P1 lies
(CA)n microsatellite repeat polymorphism comprises a
variable length of CA repeat sequence. The number of CA repeats
ranges between 10 and 25 with the most common allele containing 19
repeats, characteristic of Caucasians (9,11).
The polymorphism of the promoter CA dinucleotide repeats is
associated with IGF-1 serum level, birth weight and body height,
and with diseases including diabetes, cardiovascular disease and
cancer (12–14).
The present study aimed to analyze the association
between the CA dinucleotide repeat length polymorphism in the P1
promoter region of the IGF-1 gene in the peripheral blood cells and
cervical tissue samples of females with SILs of the uterine cervix
and squamous cervical cancer.
Materials and methods
Clinical samples
Materials for the evaluation of IGF-1 and CA repeat
analysis of the P1 promoter region of the IGF-1 gene comprised of:
i) peripheral blood obtained prior to surgery from the antecubital
vein of 160 patients enrolled at the gynecological surgery at the
Department of Gynecological Oncology and Gynecology, Medical
University of Lublin, Poland, and from 67 females voluntarily
recruited by doctors and nurses; ii) paraffin-embedded tissue
sections obtained from paraffin blocks of patients who underwent
surgery at the Department of Gynecological Oncology and Gynecology,
Medical University of Lublin, Poland.
Written informed consent was obtained from all the
subjects included, and the study was carried out in accordance with
the principles of the Helsinki Declaration. The study was approved
by the Ethics Committee of the Medical University of Lublin
(Resolution of the Bioethics Committee no. KE 0254/263/2011).
The study involved 160 patients with the following
postoperative histopathological diagnoses: L-SIL (n=52), H-SIL
(n=54) and ICC (n=54). In the ICC group, all 54 patients had
squamous cell carcinoma. According to the WHO classification
(15), a high degree of
differentiation (G1) was observed in 12/54 (22.2%) patients, a
moderate degree of observed in 31/54 (57.4%) and a low degree of
differentiation in 11/54 (20.4%). According to the FIGO
classification (16), 41/54
patients (75.9%) were classified as stage I and 13/54 patients
(24.1%) as stage IIa.
The control group consisted of 67 paraffin sections
taken from patients referred for diagnostic procedures of the
cervix, among which the histopathological results were cervicitis
and/or endocervicitis chronica. Serum and tissues (67 samples) were
obtained from the same patient. Diagnoses were confirmed or negated
by two independent pathologists.
The average age of the patients in the control group
was 45±8.2, and in the test group it was 47.2±8.3.
Determining the level of IGF-1 in plasma
by enzyme-linked immunosorbent assay (ELISA)
Concentrations of IGF-1 were determined by ELISA
according to the manufacturer’s recommended procedure for the
quantitative determination of human IGF-1 concentrations in cell
culture supernatants, serum and plasma (cat. no. DG100; R&D
Systems, Minneapolis, MN, USA).
Isolation of DNA from whole blood
cells
DNA was isolated from peripheral blood cells using a
DNA isolation kit (QIAamp DNA mini kit; cat. no. 51306; Qiagen,
Hilden, Germany).
Isolation of DNA from paraffin sections
of tissue
Paraffin blocks with tissue fixed in 10% buffered
formalin were cut into two or three sections, 4 μm thick. The
microtome was rinsed with alcohol before cutting each block. A new
cutting blade was used for the cutting of each of the paraffin
blocks. The sections obtained in this manner were placed in a
1.5-ml testing tube with polypropylene and maintained at 4°C for
future studies.
The isolation of DNA from archival paraffin tissue
was carried out using the Maxwell 16 FFPE Plus LEV DNA Purification
kit (cat. no. AS1135; Promega, Madison, WI, USA), apparatus for
automated DNA isolation, and a computer program for this kit (cat.
no. AS1250; Promega). The resulting DNA was used as a template in a
polymerase chain reaction (PCR) reaction for the analysis of CA
repeats in the P1 promoter region of the IGF-1 gene.
Quantitative determination of the DNA obtained was
carried out by a spectrophotometric method using an automatic
spectrophotometer Novaspec II (Pharmacia Co.).
Identification of HPV DNA
HPV DNA in isolated total DNA was identified by PCR
amplification of the HPV gene sequence using the primers MY09, MY11
(17) and LC1, LC2 (18) complementary to the genome sequence
of most common types of HPV as described previously (17,18).
Analysis of CA repeats in P1 region of
IGF-1
An analysis of the (CA)n repeats of the
IGF-1 gene located 1 kb upstream from the transcription start site
was performed using PCR and fragment analysis. PCR was performed in
15-μl volumes consisting of 100 ng genomic DNA, 3.75 pmol
fluorescently labeled forward primer (FAM)
(5′-AAGAAAACACACTCTGGCAC-3′) and 3.75 pmol reverse primer
(5′-ACCACTCTGGGAGAAGGGTA-3′), 0.01 mM deoxy-NTP, 1.5 mM
MgCl2, 1X PCR buffer and 0.6 units HiFi DNA polymerase
(Novazym, Poland; Cat. No. N1003-05). The analysis was performed
using a thermal cycler (TGradient Thermocycler, Biometra, Germany).
Amplification cycles included one cycle of 4 min at 94°C and 28 PCR
cycles consisting of 5 sec at 94°C (denaturation), 30 sec at 60°C
(annealing), 1 min at 72°C (elongation), and a final elongation
step at 65°C for 30 min. Analysis of the size of the PCR product
was carried out on an automated ABI 3130 XL sequencer camera and
determined in comparison with the internal GS600LIZ size markers
(Applied Biosystems, Inc., Foster City, CA, USA). The estimation of
CA repeat numbers in each of the analyzed specimens was based on an
extrapolation to the previously developed specific allelic ladder.
The ladder marker consisted of 14 sequenced amplifications
representing alleles with 7, 9, 11, 13 and 23 CA repeats.
Immunohistochemical studies of the
expression of IGF-1
Immunohistochemical assessment of IGF-1 protein
expression was carried out using a the LSAB+System-HRP (rabbit,
mouse, goat) kit (DAB+, cat. no. K0679; Dako, Carpinteria, CA,
USA). The method used goat polyclonal antibody directed against the
human IGF-1 (cat. no. 18 773; Sigma-Aldrich, St. Louis, MO, USA).
Antibodies were diluted in antibody diluent with
background-reducing components (cat. no. S3022; Dako).
Semiquantitative scoring of slides
Immunohistochemical evaluation of IGF-1 protein
expression was performed independently by two pathologists.
Pathologists counted the cells with ×200 magnification in a field
of 16 squares, which corresponded to an area of 0.25
mm2. The percentage of immunopositive cells was scored
according to the method of Nakagawa et al (18) as follows: 0, negative staining
(<5% stained); +1, weak staining (5–24% stained); +2, moderate
staining (25–50% stained); and +3, strong staining (>50%
stained).
Quantitative scoring of slides
The measurement of immunoreactive cells was
performed using Cell-2 software, ver. 4.1 (Poznan University of
Medical Sciences, Poland). This method is based on an analysis of
the distribution of colors and their optical density. The software
identifies cells with an optical density greater than the
background and on the basis of the color ratio classifies cells as
immunoreactive. To determine the percentage of positive cells in
the sections, the number of immunopositive cells was divided by the
total cell count. A minimum of 5,000 cells was counted in a single
section. An investigator who was blinded with regard to the
condition of the sample performed all analyses. Statistical
analysis of the results was performed with the Kruskal-Wallis test
with Dunn’s post-test using Statistica software ver. 5 (StatSoft,
Krakow, Poland). P<0.05 was considered to indicate a
statistically significant difference in the HC-immunohistochemical
studies of the expression of IGF-1 in tissues.
Statistical analysis
The values of the analyzed parameters were measured
using a nominal scale characterized by multiplicity and percentage,
while the ratio scale was assessed using the mean, median, standard
deviation, lower and upper quartiles, and range of variation. The
differences or correlations between the analyzed parameters were
verified employing multi-way tables and the homogeneity or
independence were tested with the χ2 test. Due to the
skewed distribution of measurable parameters, evaluated on the
basis of the Shapiro-Wilk test, the analysis of the differences
between the studied subgroups was performed by non-parametric
tests. The comparison of two independent groups was performed using
the Mann-Whitney U test. To compare more than two groups, the
Kruskal-Wallis test and multiple comparisons/post hoc tests were
carried out. The analysis assumed a 5% error of inference and the
associated significance level of P<0.05 was used to indicate the
existence of statistically significant differences. Statistical
analyses were performed with Statistica software ver. 8.0
(StatSoft).
Results
Analysis of blood serum IGF-1 level
The IGF-1 blood serum levels for the study and
control groups are presented in Table
I. The comparative analysis of study groups versus the control
group based on the Mann-Whitney U test revealed statistically
significant differences in the concentrations of IGF-1 in the group
of patients with H-SIL (P=0.047) and cervical cancer compared with
controls (Table I).
 | Table ICharacteristics of insulin-like
growth factor-1 (ng/ml) in blood serum of patients from the study
and control groups. |
Table I
Characteristics of insulin-like
growth factor-1 (ng/ml) in blood serum of patients from the study
and control groups.
| Group | n | Mean | SD | Median | Q1 | Q3 | Min-max | P-value |
|---|
| Control | 67 | 172.9 | 81.14 | 154.6 | 120.4 | 201.1 | 100–414 | - |
| L-SIL | 52 | 183.4 | 71.45 | 189.1 | 148.5 | 222.4 | 120–245 | 0.220 |
| H-SIL | 54 | 210.7 | 40.89 | 180.1 | 156.5 | 206.1 | 130–420 | 0.047 |
| ICC | 54 | 226.1 | 87.40 | 186.9 | 151.1 | 280.6 | 110–573 | 0.090 |
Allelic distribution of CA repeats in
IGF-1 gene P1 promoter in DNA isolated from serum and tissue
samples
DNA from the blood and tissue of study patients was
isolated and the correlation between the CA repeats situated in the
P1 promoter region of the IGF-1 gene, serum and tissue level of
IGF-1 and cervical cancer development was investigated. The IGF-1
genotype distribution in the total cohort and subcategories is
shown in Tables II and III. The length range of CA repeats in
the study DNA was 11 to 21; however, the most common genotype in
the serum and tissues of the control group was homozygote CA19
repeat (74.6 and 89.6%, respectively). These differences were
statistically significant (P<0.001). The other frequent
genotypes in the control group were CA19/20 (11.9%) and CA18/19
(10.5%). Among the females with precancerous lesions (L-SIL, H-SIL)
and cancer (ICC), the homogenous genotype CA19/19 was observed in
the DNA from the serum and the tissue in 32.7 and 28.8% of females
with L-SIL, respectively, in 24.1 and 11.1% with H-SIL and in 29.6
and 31.5% with ICC. The other most frequent genotypes in females
with L-SIL were CA19/21, with a frequency of 28.9 and 23.1% in the
serum and tissue, respectively (Table
II), and CA19/20 and CA18/19 in the serum of females with H-SIL
(37 and 25.9%, respectively). Alleles CA17/19, CA18/19 and CA19/20
were identified among the patients with ICC. All study differences
in the number of CA repeats were statistically significant in
groups of patients with H-SIL (P<0.001) and ICC (P<0.01)
compared with controls. Among the females with H-SIL it was
observed that 96.3% (52/54) had one CA19 allele whereas in the ICC
group the figure was 68% (37/54).
| Table IIComparison of evaluation of
microsatellite instability (CA repeats) in DNA isolated from
peripheral blood cells and paraffin tissues of patients from the
study and control groups. |
Table II
Comparison of evaluation of
microsatellite instability (CA repeats) in DNA isolated from
peripheral blood cells and paraffin tissues of patients from the
study and control groups.
| Control, n (%)
(n=67) | L-SIL, n (%)
(n=52) | H-SIL, n (%)
(n=54) | ICC, n (%)
(n=54) |
|---|
|
|
|
|
|
|---|
| Group | Serum | Tissue | Serum | Tissue | Serum | Tissue | Serum | Tissue |
|---|
| IGF-1
(CA)n genotype |
| CA11/19 | - | - | 2 (3.8) | 1 (1.9) | - | - | - | - |
| CA17/18 | - | - | 3 (5.7) | 3 (5.8) | 2 (3.7) | 1 (1.9) | - | 2 (3.7) |
| CA17/19 | - | 2 (3.0) | 7 (13.5) | 10 (19.2) | - | 7 (13.0) | 6 (11.1) | 7 (13.0) |
| CA17/21 | - | - | - | - | - | - | - | |
| CA18/19 | 7 (10.5) | 1 (1.5) | 4 (7.7) | 8 (15.4) | 14 (25.9) | 7 (13.0) | 8 (14.8) | 10 (18.5) |
| CA18/20 | - | - | - | - | - | 2 (3.7) | - | - |
| CA18/21 | 2 (3.0) | 1 (1.5) | - | - | - | - | 8 (14.8) | 2 (3.7) |
| CA19/19 | 50 (74.6) | 60 (89.6) | 17 (32.7) | 15 (28.8) | 13 (24.1) | 6 (11.1) | 16 (29.6) | 17 (31.5) |
| CA19/20 | 8 (11.9) | 2 (3.0) | 4 (7.7) | - | 20 (37.0) | 23 (42.6) | 8 (14.8) | 9 (16.7) |
| CA19/21 | - | 1 (1.5) | 15 (28.9) | 12 (23.1) | 5 (9.3) | 7 (13.0) | 5 (9.3) | 6 (11.1) |
| CA20/20 | - | | - | 3 (5.8) | - | 1 (1.9) | 3 (5.6) | 1 (1.9) |
| IGF-1
(CA)n genotype groups |
| Group 1 |
| 19/19 | 50 (74.6) | 60 (89.6) | 17 (32.7)a | 15 (28.8) | 13 (24.1) | 6 (11.1) | 16 (29.6) | 17 (31.5) |
| 19/non-19 | 15 (22.4) | 6 (8.9) | 32 (61.5) | 34 (65.4) | 39 (72.2) | 44 (81.5) | 35 (64.8) | 32 (59.2) |
|
Non-19/non-19 | 2 (3.0) | 1 (1.5) | 3 (5.8) | 3 (5.8) | 2 (3.7) | 4 (7.4) | 3 (5.6) | 5 (9.3) |
| P-valuea | <0.001 | <0.001 | <0.01 | <0.01 | <0.01 | <0.001 | 0.781 | 0.341 |
| P-valueb | 0.071 | | 0.059 | | 0.063 | | 0.069 | |
| Group 2 |
| <CA19 | 9 (13.4) | 4 (5.5) | 16 (30.8) | 29.0 | 16 (29.6) | 17 (31.5) | 22 (40.8) | 21 (38.9) |
| CA19 | 50 (74.6) | 60 (89.5) | 17 (32.7) | 30.3 | 13 (24.1) | 6 (11.1) | 16 (29.6) | 17 (31.5) |
| >CA19 | 8 (12.0) | 3 (5.0) | 19 (36.5) | 40.7 | 25 (46.3) | 31 (57.4) | 16 (29.6) | 16 (29.6) |
| P-valuea | <0.01 | <0.01 | 0.94 | 0.872 | 0.078 | 0.069 | 0.89 | 0.91 |
| P-valueb | 0.070 | | 0.058 | | 0.055 | | 0.064 | |
| Group 3 |
| CA19 allele
present | 65 (97.0) | 66 (98.5) | 49 (94.2) | 49 (94.2) | 52 (96.3) | 50 (92.6) | 37 (68.5) | 49 (90.7) |
| CA19 allele
absent | 2 (3.0) | 1 (1.5) | 3 (5.8) | 3 (5.8) | 2 (3.7) | 4 (7.4) | 17 (31.5) | 5 (9.3) |
| P-value | <0.001 | <0.001 | <0.001 | <0.001 | <0.001 | <0.001 | <0.001 | <0.001 |
| P-value | 0.068 | | 0.055 | | 0.058 | | 0.070 | |
| Table IIICovariate-adjusted mean plasma
insulin-like growth factor-1 levels (ng/ml) for subjects with or
without 19-19 CA repeats. |
Table III
Covariate-adjusted mean plasma
insulin-like growth factor-1 levels (ng/ml) for subjects with or
without 19-19 CA repeats.
| 19-19 repeats | CA19<19,
CA19>19 and non-19-19 repeats | P-value |
|---|
|
|
|
|
|---|
| Group | n | IGF-1 (SD) | n | IGF-1 (SD) | A | B |
|---|
| Control | 50 | 176.2 (72.2) | 17 | 156.8 (71.3) | 0.791 | - |
| L-SIL | 17 | 177.2 (70.2) | 35 | 165.6 (72.3) | 0.083 | 0.69 |
| H-SIL | 13 | 194.4 (54.7) | 41 | 193.9 (61.5) | 0.841 | 0.041 |
| ICC | 16 | 212.6 (50.8) | 38 | 228.4 (58.5) | 0.948 | 0.048 |
CA repeats with a length of <19 were classified
as short, repeats of length >19 were considered as long, and
others as non-19-19 repeats. Statistically significant differences
in the number of CA repeat lengths were observed in the group of
patients with H-SIL and ICC in comparison with the controls
(Table III).
There was no statistically significant difference in
the serum concentrations of IGF-1 with CA repeats in the promoter
region P1 of IGF-1 gene in the L-SIL patients with 19-19 repeats in
comparison with the concentration of IGF in the blood serum of
patients with 19>19, 19<19 or non-19-19 repeats in the study
groups and the control group (Table
III). However, the concentration of IGF-1 in the 19-19 group
and the non-19-19, 19>19 and 19<19 group was significantly
higher in the H-SIL group (P=0.041) and ICC group (P=0.048)
compared with the control group (Table III).
IGF-1 (CA)n genotype in DNA
isolated from the peripheral blood cells and tissues of patients
with precancerous and cervical cancer
In an additional study we analyzed the
(CA)n repeats in DNA isolated from the blood serum and
postoperative tissues from the same patients diagnosed with L-SIL,
H-SIL and ICC (Table IV).
| Table IVInsulin-like growth factor-1
(CA)n genotype in DNA isolated from the peripheral blood
cells (B) and tissues (T) of patients with precancerous lesions and
cervical cancer. |
Table IV
Insulin-like growth factor-1
(CA)n genotype in DNA isolated from the peripheral blood
cells (B) and tissues (T) of patients with precancerous lesions and
cervical cancer.
| Group | L-SIL, n
(%)(n=52) | H-SIL, n
(%)(n=54) | ICC, n
(%)(n=54) | Total, n
(%)(n=160) | P-value |
|---|
| CA19 same in B and
T | 11 (21.2) | 11 (20.1) | 10 (18.3) | 32 (20.0) | 0.087 |
| In B and T some but
other 19-19 | 18 (34.6) | 16 (29.6) | 17 (31.4) | 51 (31.9) | 0.069 |
| In B and T
different | 23 (44.2) | 27 (50.3) | 27 (50.3) | 77 (48.1) | 0.070 |
| P-value | 0.078 | <0.05 | <0.05 | <0.065 | |
| P-value | 0.075 | <0.05 | <0.05 | 0.061 | |
The frequency of the homozygote CA19/19 (in blood
and tissue) in females with L-SIL was observed to be 21.2% of study
patients. This was not statistically significant. Statistically
significant differences in CA repeats (in blood and tissue) were
observed in females with H-SIL (50.3%) and ICC (50.3%) for the
homozygote group CA19/19 (Table
IV).
Statistically significant differences in CA repeats
were observed in females with H-SIL and ICC between the study and
the control groups (Table II). A
total of 20% of patients had identical CA repeats in blood and
tissue (Table IV). This finding
suggests that certain factors for cervical cancer promotion or
progression may be dependent on genetic differences in the gene
regulation of transcription.
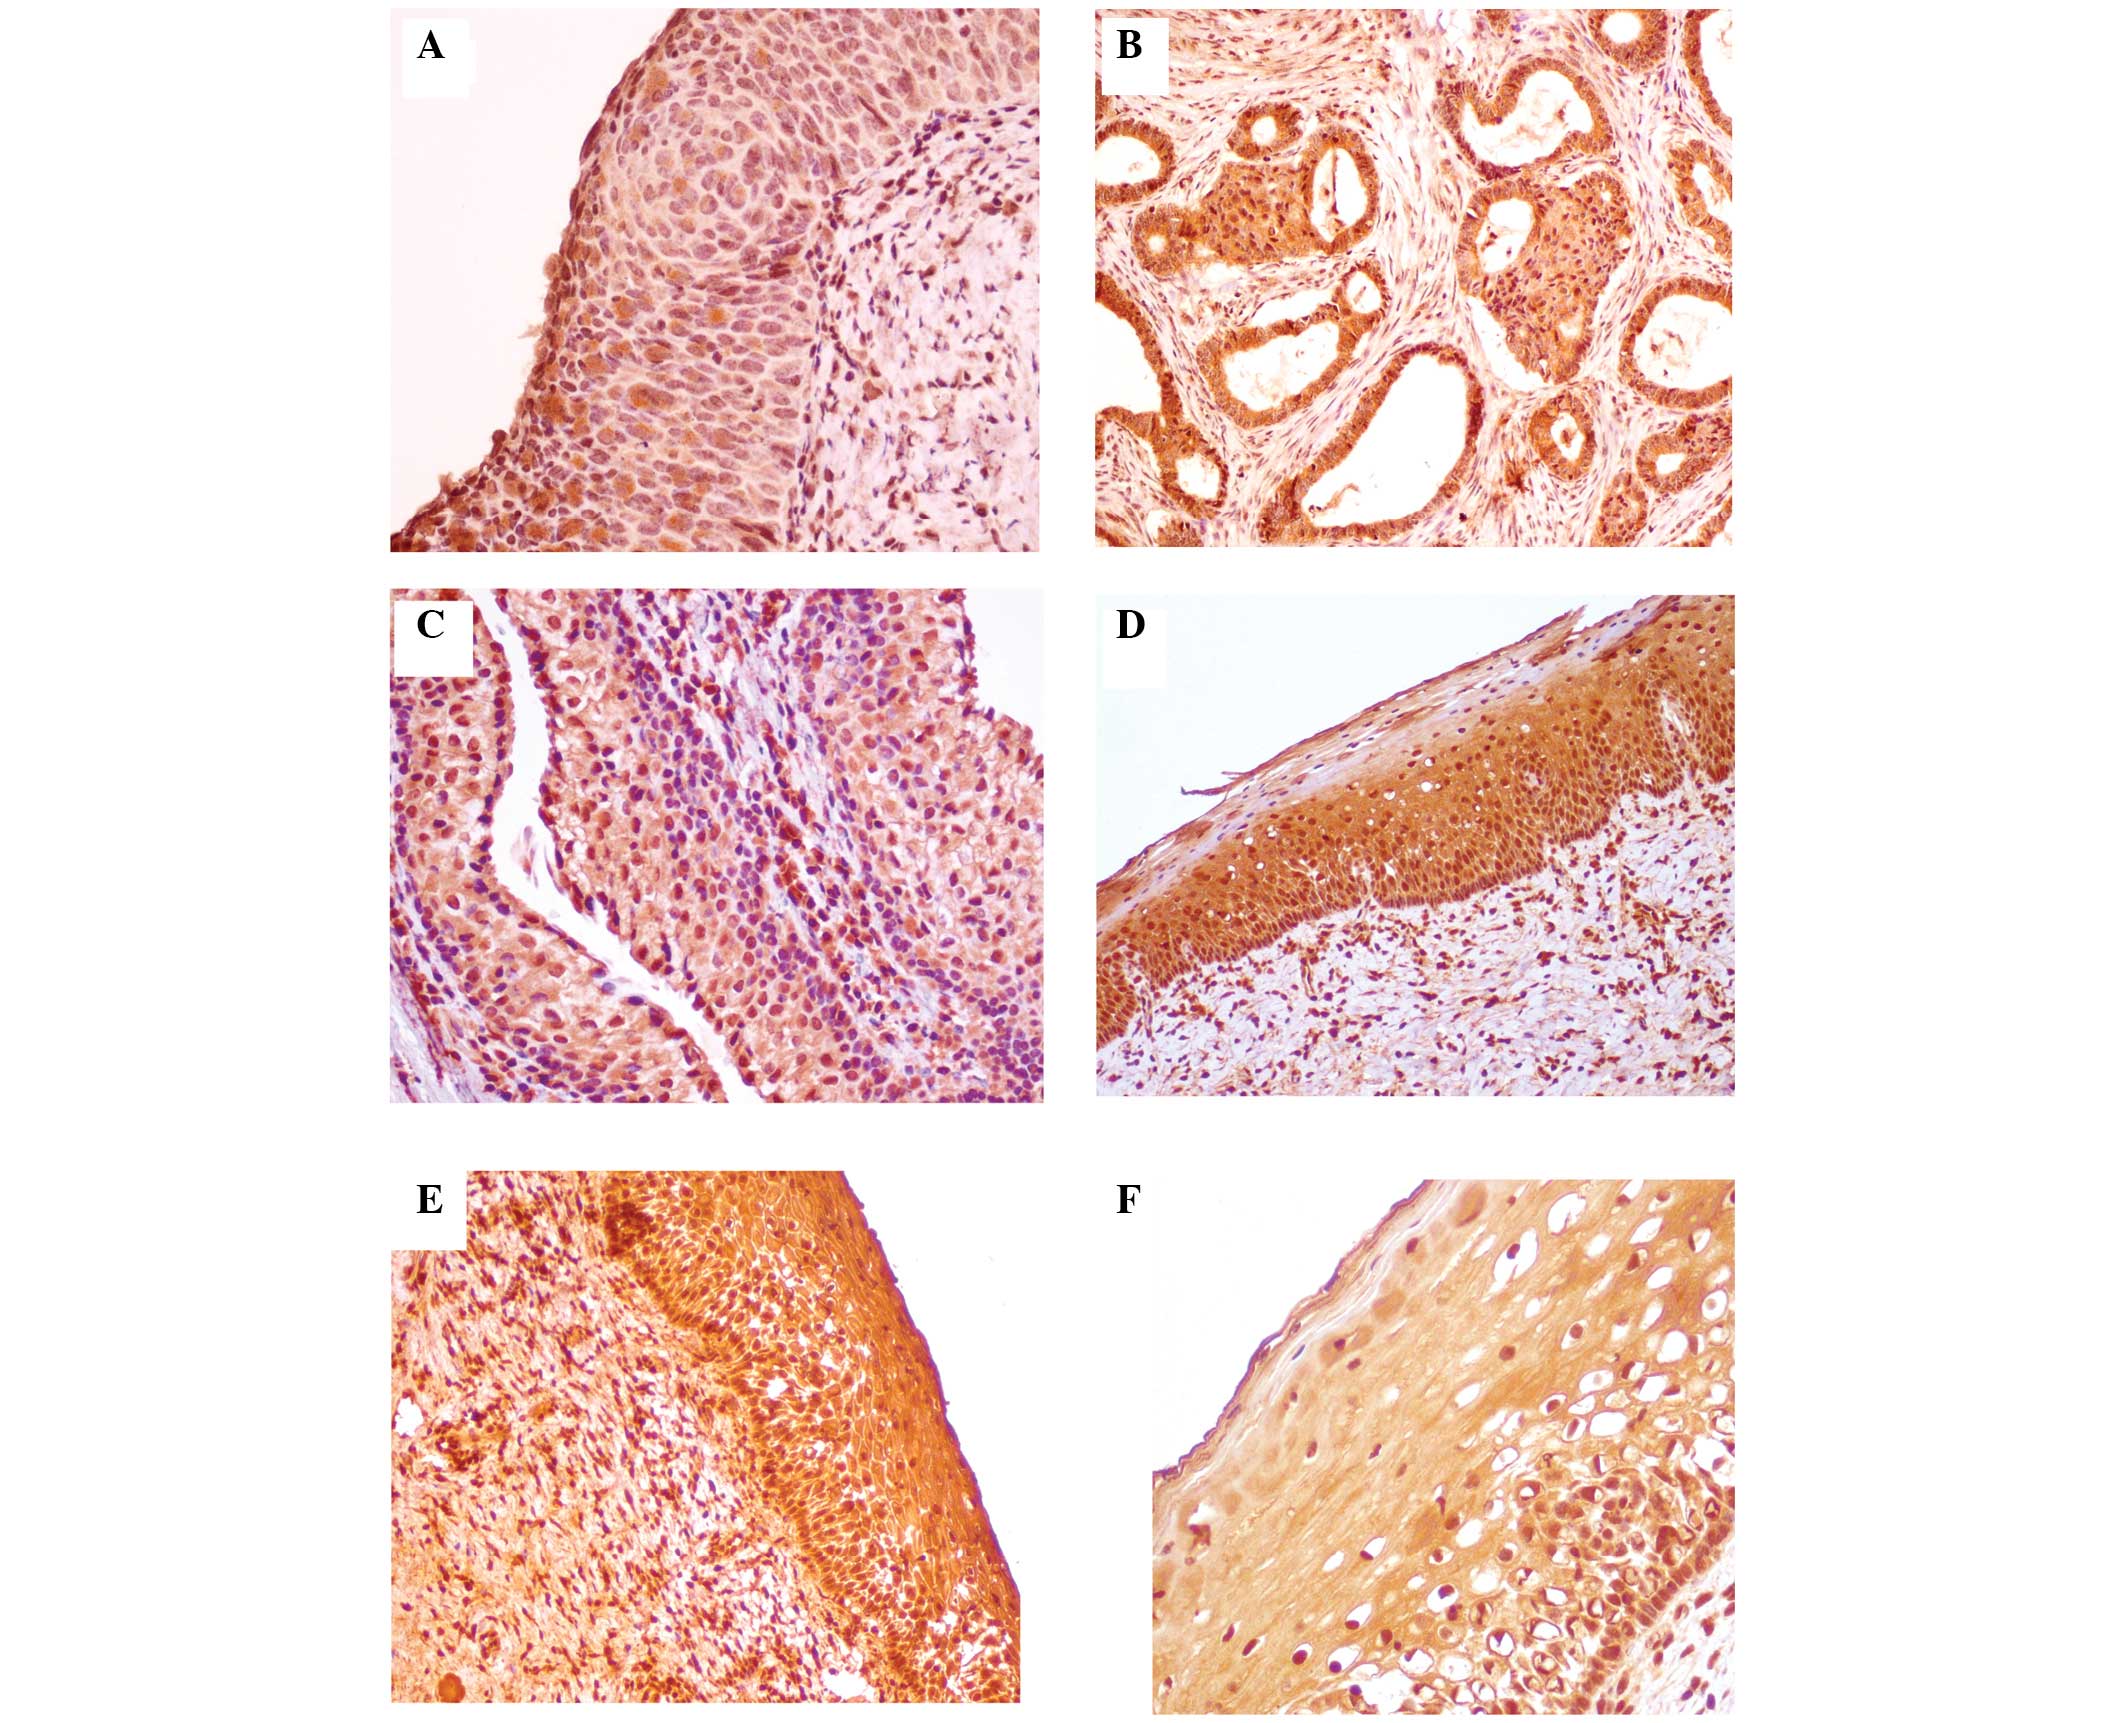
Analysis of IGF-1 expression in tissues
during cervical cancer development
The IGF-1 expression in tissue samples of
precancerous lesions and cervical cancer cases is presented in
Fig. 1.
Semiquantitative scoring of slides
The results of the semiquantitative analysis of
IGF-1 protein expression are summarized in Table V.
| Table VSignificance of variables compared
with the expression of insulin-like growth factor-1. |
Table V
Significance of variables compared
with the expression of insulin-like growth factor-1.
| Expression, n
(%) | | |
|---|
|
| | |
|---|
| Group | 0 | +1 | +2 | +3 | Total | Statistical
analysis |
|---|
| L-SIL | 5 (9.6) | 36 (69.3) | 10 (19.2) | 1 (1.9) | 52 |
χ2=76.14 |
| H-SIL | 3 (5.5) | 11 (20.5) | 16 (29.6) | 24 (44.4) | 54 | P<0.0001 |
| ICC | 0 (0.0) | 0 (0.0) | 25 (46.3) | 2 (53.7) | 54 | |
| Total | 8 (5.0) | 47 (29.4) | 51 (31.9) | 54 (33.7) | 160 | |
As demonstrated, IGF-1 protein expression in the
L-SIL group was denoted as +3 in 1.9% of slides, +2 in 19.2% of
slides, +1 in 69.3% of slides, and in 9.6% there was no expression.
In the H-SIL group the results were, respectively, +3 in 44.4%, +2
in 29.6%, +1 in 20.5%, and in 5.5% of samples there was no
expression. In the ICC group, positive IGF-1 expression was
designated as +2 in 46.3% and +3 in 53.7% of cases. The
χ2 test revealed a statistically significant association
between the histological diagnosis and the percentage of IGF-1
immunopositive cells (P<0.0001).
Additionally, Spearman’s correlation coefficient was
evaluated to verify whether the degree of reaction intensity was
dependent on the diagnosis. A statistically significant, strong
positive correlation between the type of diagnosis and intensity of
IGF-1 expression was observed (P<0.05; Table VI).
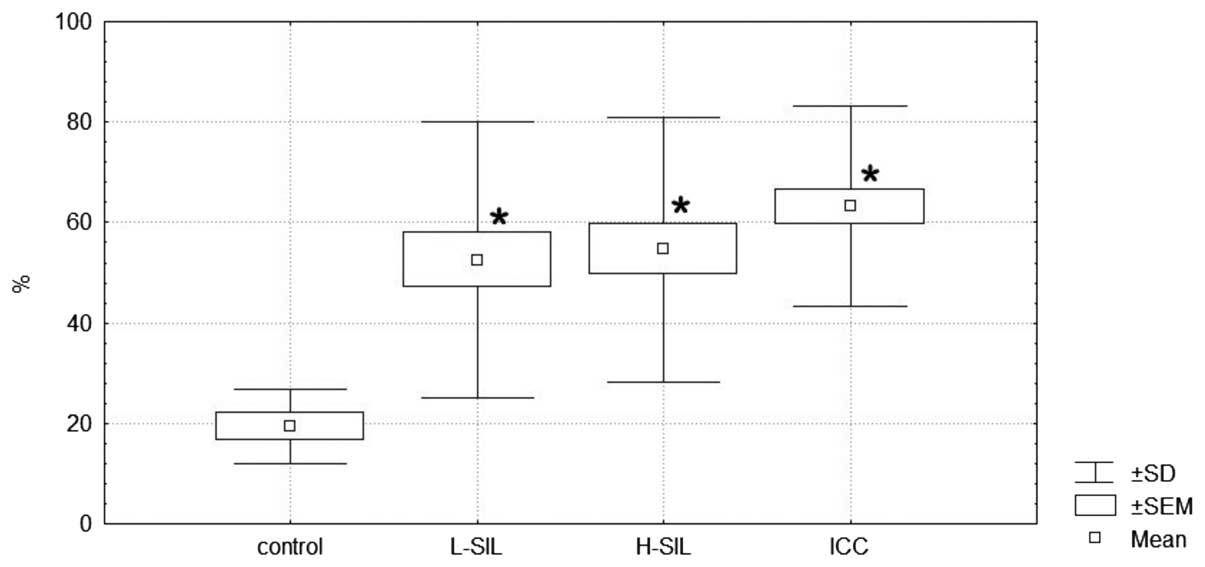
Quantitative scoring of the slides
Positive staining was also scored using the software
Cell-2 ver. 4.1 according to the percentage of cells with positive
staining and type of histopathological diagnosis. The obtained data
are expressed graphically as the median and range in Fig. 2.
Statistical analysis revealed that the number of
IGF-1-expressing cells is significantly higher in L-SIL, H-SIL and
ICC versus the control (Kruskal-Wallis test, P=0.032; Dunn’s
post-test, P=0.034, P=0.013 and P=0.001 for L-SIL, H-SIL and ICC,
respectively). Between the L-SIL, H-SIL and ICC groups, no
statistically significant differences were observed.
Discussion
Genetic polymorphisms that regulate gene expression
are crucial factors accounting for human diversity and disease
susceptibility. In a systematic survey of human variations in the
cis-regulatory regions, IGF-1 was identified to be one of the 23
genes that demonstrated a consistent allelic imbalance. These
findings imply that certain functional elements lie within the
IGF-1 regulatory region and contribute to the diversity in IGF-1
concentration among individuals (19).
Epidemiological studies indicate that a high
concentration of blood-circulating IGF-1 (endocrine fraction) is a
risk factor in numerous types of cancer, including colon cancer
(20), prostate cancer (21,22),
breast cancer (22) and non-small
cell lung cancer (23). Although
the level of circulating IGF-1 is affected by various factors,
including growth hormones and IGFBP concentration, gender, age,
ethnic group and nutritional status (24), studies have demonstrated that 38%
of the variance in IGF-1 concentration among individuals is caused
by genetic effects (24). Early
studies suggested a possible role of the IGF system in cervical
carcinogenesis (25).
The key factor in the development of cervical cancer
is HPV infection (2). However, the
virus alone is not sufficient for the development of cervical
cancer, and other factors or cofactors are necessary for the cancer
to occur. HPV factors or cofactors in cervical cancer may act by
influencing the acquisition of HPV infection, by increasing the
risk of HPV persistence or by increasing the risk of progression
from HPV infection to H-SIL or ICC. A number of cofactors or
factors have also been identified to distinguish ICC from H-SIL or
L-SIL (2).
A comparative analysis of IGF-1 in the blood serum
and cervical tissues of patients carried out by the authors in this
study revealed statistically significant higher levels of IGF-1 in
the group of patients with H-SIL. Analysis of IGF-1, depending on
the concentrations of its serum level of IGF-1 with repeat CA in
the P1 promoter region of the IGF-1 gene for subjects with or
without CA19-19 repeats, demonstrated statistically significant
higher levels in the H-SIL and ICC groups, compared with
others.
The higher concentrations of IGF-1 in H-SIL suggest
the involvement of IGF-1 in cervical carcinogenesis induced by HPV.
Results of a study by Shen et al (25) reveal that IGF-1 may be a potential
stimulus for the proliferation and invasion of cervical cancer
cells, through effects on integrin ανβ3, which is considered to be
one of the possible HPV receptors. According to Bruchim and Werner
(26), IGF-1 also stimulates
potassium chloride cotransporters, which are required for the
invasion and proliferation of cervical, ovarian and breast cancer
cells. Additional E6 HPV viral proteins deactivate IGFBP-1, which
increases the bioavailability of IGF-1 to IGFR-1 (27). It is also suggested that the
oncogenic proteins E6 and E7 of HPV have a distorting effect. In
turn, an inhibition of the proliferation of cervical cancer cells
may be accomplished by antibodies directed against IGFR-1 (28). An in vitro study by Nakamura
et al (29) indicates the
possibility to reverse the phenotype of tumor cell lines by
controlling the up-down IGFR.
Prospective studies evaluating the dependence of the
natural history of cervical cancer in relation to the IGF axis were
performed by Harris et al (30) in a group of 137 females. The
results of this study confirmed the effect of the IGF system on the
development of cervical cancer involving oncogenic types of HPV,
and also revealed that a high ratio of IGF-1/IGFBP-3 was associated
with an increase in chronic HPV infection (adjusted hazard ratio,
−0.14; 95% confidence interval, 0.04–0.57).
Similar correlations have been demonstrated by Lee
et al (31), who studied
serum IGF-1 and IGFBP-3 levels in a group of 44 patients with ICC,
82 patients with cervical intraepithelial neoplasia (CIN) and a
control group of 40 patients without neoplastic lesions of the
cervix. The average concentration of IGF-1 in the serum of patients
with CIN was higher compared with the control group, while for the
ratio of IGF-1/IGFBP-3, the decomposition quartile was
significantly higher (P=0.041). These data do not support the
results of Schaffer et al (32), which suggest that IGF-1 may be
considered a biomarker of CIN progression.
However, a case study published by Jozefiak et
al (33) revealed, in turn,
significantly lower concentrations of IGF-1 (P<0.001) in the
serum of patients with ICC in comparison with the control group.
These authors also observed no statistically significant difference
between the serum levels of IGF-1 in HPV-positive and HPV-negative
individuals.
A meta-analysis of CA repeats in the promoter region
of IGF-1 was carried out by Chen et al (13). The meta-analysis included 17
studies in a group of 8,799,901 patients and 13,901 controls, seven
studies in patients with prostate cancer (2,307 cases and 2,622
controls), seven studies of breast cancer (3,533 cases and 7,771
controls), and three studies of colorectal cancer (2,959 cases and
3,508 controls). The odds ratio (OR) for the CA19 repeat allele
versus the non-19 allele was 1.03 (95% confidence interval,
0.95–1.11; P<0.0001). There was no statistical survival
depending on both the recessive and dominant modeling CA19 allele.
No effect of repetition (CA), 19 patients with breast cancer (seven
comparisons: OR=1.03; 95% CI, 0.90–1.17; P=0.005), prostate cancer
(seven comparisons: OR=1.08; 95% CI, 0.88–1.27; P=0.0002), and
colon cancer (three comparisons: OR=0.96; 95% CI, 0.89–1.03;
P=0.36). No evidence was observed that the CA19 allele is
associated with cancer risk in Caucasians and Asians. This
meta-analysis revealed that repeat polymorphism CA19 is not a major
determinant of susceptibility to cancer within the population.
However, the authors emphasize the need for large-scale
population-based studies to further assess the polymorphisms of
IGF-1 CA19 and the assessment of cancer risk in a defined
population.
Two published studies have demonstrated that CA19
was significantly associated with a higher level of circulating
IGF-1 (34,35). However, the results on this issue
were inconsistent, as a different study revealed the opposite
association (36) while a further
study by DeLellis et al (37) revealed no association. In a study
by Chen et al (38), the
results demonstrated that the CA repeat microsatellite by itself
was not significantly associated with serum IGF-1 levels. This is
consistent with the multiethnic cohort study conducted by DeLellis
et al (37). One possible
explanation for the discrepancy between the present study and other
studies is the difference in ethnicity of the study population. The
majority of association studies of IGF-1 are based on a Caucasian
population, in which the CA19 allele is more prevalent and the
genotype and haplotype compositions are different from those of the
Chinese population (39).
Studies of CA repeats in the DNA of the P1 promoter
of IGF-1 are ambiguous and controversial (38–41)
and do not apply to repeat CA gynecological diseases.
Costalonga et al (40) hypothesized that IGF-1 is a mediator
of growth hormone, and therefore may be considered as a candidate
gene for the recombinant human growth factor (rhGH). Adults
homozygous for the CA19 repeat in the P1 promoter of IGF-1 had
lower serum levels of IGF-1. The aim of this study (40) was to evaluate the effect of CA
repeat polymorphisms in the IGF-1 gene in response to the growth of
recombinant growth factor therapy in patients with growth hormone
deficiency. The authors concluded that the presence of homozygosity
for the CA19 IGF-1 gene is associated with less favorable short-
and long-term effects of growth following rhGH treatment in
patients with severe growth hormone deficiency.
Clinical research by Chen et al (38) was a concern for the Chinese
population. The researchers defined the haplotype patterns, both
SNP and microsatellite repeats, and evaluated their impact on the
concentration of IGF-1. This was the first study in which patterns
of microsatellite instability haplotypes and SNPs in the P1
promoter of IGF-1 were considered together. The results revealed
that microsatellite instability and haplotypes were correlated with
the serum concentration of IGF-1 in a group of 450 premenopausal
Chinese females.
In the present study, we compared the microsatellite
instability of DNA in Caucasian females, obtained from the
peripheral blood cells of CA DNA obtained from sections of the same
patients stored in surgical archives. The observed microsatellite
instability, identical in blood and in tissue, may suggest the
nature of hereditary changes in DNA. In contrast, the instability
in the blood, which differs from the CA of DNA from tissue, may
suggest that postoperative neoplastic changes may be the result of
local changes.
This suggests the existence of a specific gene
predisposing to tumor genesis, as evidenced by microsatellite
instability in the DNA of white blood cells and in tumor
tissue.
A search of the available databases for
microsatellite instability in DNA promoter P1-IGF-1 did not reveal
any studies comparing the repetition of CA in peripheral blood and
tissues. Thus, any interpretation of the results is at present
extremely difficult and requires execution and repetition of
studies in a larger group of patients quantitatively with SILs and
ICC.
The transcriptional activity of IGF-1 emphasized the
role of the P1 promoter polymorphism of IGF-1 (14). The results of Pacholska-Bogalska
et al (14), analyzing
P1-IGF-1 DNA from blood and tissue cells with CIN and cervical
cancer, revealed that a single nucleotide polymorphism at position
−383 C>T P1 promoter IGF-1 was present in 16% of HPV-positive
patients with precancerous and cancerous changes of the cervix.
The expression of IGF-1 protein in tissue samples
was revealed to be statistically significantly higher in
precancerous lesions of the cervix and squamous carcinoma of the
cervix than in the control group.
In recent years, evidence has been mounting that the
IGF axis may be involved in human cancer progression (5) and may be targeted for therapeutic
intervention. The current findings in patients with advanced
cervical cancer support this. In the future, the association of
IGF-1, the IGF system and the 19-19 repeat P1 promoter IGF-1 gene
and the clinical outcome of cervical cancer patients in
post-treatment samples may add significance in disease mapping as a
prognostic marker. It also indicates a possible use in developing
newer therapeutic drugs and identifying their targets as well as in
the assessment of the clinical outcomes of the disease.
Acknowledgements
This study was supported by grants from the Medical
University of Lublin (DS 120, DS 128 and MB 128).
References
|
1
|
Doorbar J: Molecular biology of human
papillomavirus infection and cervical cancer. Clin Sci (Lond).
110:525–541. 2006. View Article : Google Scholar
|
|
2
|
zur Hausen H: Papillomaviruses and cancer:
From basic studies to clinical application. Nat Rev Cancer.
2:342–350. 2002. View
Article : Google Scholar : PubMed/NCBI
|
|
3
|
Rosenzwieg SA and Atreya HS: Defining the
pathway to insulin-like growth factor system targeting in cancer.
Biochem Pharmacol. 80:1115–1124. 2010. View Article : Google Scholar
|
|
4
|
Baserga R: Customizing the targeting of
IGF-1 receptor. Future Oncol. 5:43–53. 2009. View Article : Google Scholar : PubMed/NCBI
|
|
5
|
Weroha SJ and Haluska P: The insulin-like
growth factor system in cancer. Endocrinol Metab Clin North Am.
41:335–350. 2012. View Article : Google Scholar : PubMed/NCBI
|
|
6
|
Laron Z, Steuerman R and Shevah O: Laron
Syndrome patients with congenital IGF-I deficiency seem protected
from malignant diseases. Laron Syndrome - From Man to Mouse. Laron
Z and Kopchich J: Springer-Verlag; Berlin Heidelberg: pp. 339–340.
2011, View Article : Google Scholar
|
|
7
|
Grimberg A and Cohen P: Role of
insulin-like growth factors and their binding proteins in growth
control and carcinogenesis. J Cell Physiol. 183:1–9. 2000.
View Article : Google Scholar : PubMed/NCBI
|
|
8
|
Pollak MN: Insulin and insulin-like growth
factor signaling in neoplasia. Nat Rev Cancer. 12:915–928. 2008.
View Article : Google Scholar
|
|
9
|
Rotwein P, Pollock KM, Didier DK and Krivi
GG: Organization and sequence of the human insulin-like growth
factor I gene. J Biol Chem. 261:4828–4832. 1986.PubMed/NCBI
|
|
10
|
Adamo ML, Neuenschwander S, LeRoith D, et
al: Structure, expression and regulation of the IGF-I gene. Adv Exp
Med Biol. 343–351. 1993.
|
|
11
|
Yu H, Li B, Smith M, et al: Polymorphic CA
repeats in the IGF-I gene and breast cancer. Breast Cancer Res
Treat. 70:117–122. 2001. View Article : Google Scholar
|
|
12
|
Wong HL, Delellis K, Probst-Hensch N, et
al: A new single nucleotide polymorphism in the insulin-like growth
factor I regulatory region associates with colorectal cancer risk
in Singapore Chinese. Cancer Epidemiol Biomarkers Prev. 14:144–151.
2005.PubMed/NCBI
|
|
13
|
Chen X, Guan J, Song Y, et al: IGF I (CA)
repeat polymorphism and risk of cancer: a meta analysis. J Hum
Genet. 53:227–238. 2008. View Article : Google Scholar
|
|
14
|
Pacholska-Bogalska J, Jozefiak A, Nowak W,
et al: Association of the IGF-I promoter P1 polymorphism with risk
of cervical cancer. Eur J Gynaecol Oncol. 32:393–398.
2011.PubMed/NCBI
|
|
15
|
Tavassoli FA and Deville P: World Health
Organization Classification of Tumors. Pathology, Genetics. Tumours
of the Breast and Female Genital Organs. IRAC Press; Lyon: 2003
|
|
16
|
Benedet JL, Bender H, Jones H, Ngan HY and
Pecorelli S: FIGO staging classifications and clinical practice
guidelines in the management of gynecologic cancers. FIGO Committee
on Gynecologic Oncology. Int J Gynaecol Obstet. 70:209–262. 2000.
View Article : Google Scholar : PubMed/NCBI
|
|
17
|
Manos MM, Ting Y, Wright DK, et al: The
use of polymerase chain reaction amplification for the detection of
genital human papillomaviruses. Cancer Cell. 7:209–214. 1989.
|
|
18
|
Nakagawa K, Yamamura K, Maeda S and
Ichihashi M: Bcl-2 expression in epidermal keratinocytic diseases.
Cancer. 74:1720–1724. 1994. View Article : Google Scholar : PubMed/NCBI
|
|
19
|
Serre D, Gurd S, Ge B, et al: Differential
allelic expression in the human genome: a robust approach to
identify genetic and epigenetic cis-acting mechanisms regulating
gene expression. PLoS Genet. 4:e10000062008. View Article : Google Scholar : PubMed/NCBI
|
|
20
|
Keku TO, Vidal A, Oliver S, et al: Genetic
variants in IGF-I, IGF-II, IGFBP-3, and adiponectin genes and colon
cancer risk in African Americans and Whites. Cancer Causes Control.
23:1127–1138. 2012. View Article : Google Scholar : PubMed/NCBI
|
|
21
|
Dean JP, Sprenger CC, Wan J, et al:
Response of the insulin-like growth factor (IGF) system to IGF-IR
inhibition and androgen deprivation in a neoadjuvant prostate
cancer trial: effects of obesity and androgen deprivation. J Clin
Endocrinol Metab. 98:E820–E828. 2013. View Article : Google Scholar : PubMed/NCBI
|
|
22
|
Tsilidis KK, Travis RC, Appleby PN, et al:
Insulin-like growth factor pathway genes and blood concentrations,
dietary protein and risk of prostate cancer in the NCI Breast and
Prostate Cancer Cohort Consortium (BPC3). Int J Cancer. 15:495–504.
2013. View Article : Google Scholar
|
|
23
|
Wang Z, Wang Z, Liang Z, et al: Expression
and clinical significance of IGF-1, IGFBP-3, and IGFBP-7 in serum
and lung cancer tissues from patients with non-small cell lung
cancer. Onco Targets Ther. 6:1437–1444. 2013.PubMed/NCBI
|
|
24
|
Savage MO: Insulin-like growth factors,
nutrition and growth. World Rev Nutr Diet. 106:52–59. 2013.
View Article : Google Scholar : PubMed/NCBI
|
|
25
|
Shen MR, Hsu YM, Hsu KF, et al:
Insulin-like growth factor 1 is a potent stimulator of cervical
cancer cell invasiveness and proliferation that is modulated by
ανβ3 integrin signaling. Carcinogegenesis. 27:962–971. 2006.
View Article : Google Scholar
|
|
26
|
Bruchim I and Werner H: Targeting IGF-1
signaling pathways in gynecologic malignancies. Expert Opin Ther
Targets. 17:307–320. 2013. View Article : Google Scholar : PubMed/NCBI
|
|
27
|
Mannhard B, Weinzimer SA, Wagner M, et al:
Human papillomavirus type 16 E7 oncoprotein binds and inactivates
growth-inhibitory insulin-like growth factor binding protein 3. Mol
Cell Biol. 20:6483–6495. 2000. View Article : Google Scholar
|
|
28
|
Maloney EK, McLaughlin JL, Dagdigian NE,
et al: An anti-insulin-like growth factor I receptor antibody that
is a potent inhibitor of cancer cell proliferation. Cancer Res.
63:5073–5083. 2003.PubMed/NCBI
|
|
29
|
Nakamura K, Hongo A and Kodama J:
Down-regulation of the insulin-like growth factor I receptor by
antisense RNA can reverse the transformed phenotype of human
cervical cancer cell lines. Cancer Res. 60:760–765. 2000.PubMed/NCBI
|
|
30
|
Harris TG, Bruk RD, Yu H, et al: Insulin
like-growth factor axis and oncogenic human papillomavirus natural
history. Cancer Epidemiol Biomarkers Prev. 17:245–248. 2008.
View Article : Google Scholar : PubMed/NCBI
|
|
31
|
Lee SW, Lee SY, Lee SR, et al: Plasma
levels of insulin-like growth factor-I and insulin-like growth
factor binding protein-3 in women with cervical neoplasia. J
Gynecol Oncol. 21:174–180. 2010. View Article : Google Scholar : PubMed/NCBI
|
|
32
|
Schaffer A, Koushik A, Trottier H, et al:
Insulin-like growth factor-I and risk of high-grade cervical
intraepithelian neoplasia. Cancer Epidemiol Biomarkers Prev.
16:716–722. 2007. View Article : Google Scholar : PubMed/NCBI
|
|
33
|
Jozefiak A, Pacholska-Bogalska J,
Myga-Nowak M, et al: Serum and tissue levels of insulin-like growth
factor-I in women with dysplasia and HPV-positive cervical cancer.
Mol Med Report. 1:231–237. 2008.
|
|
34
|
Cleveland RJ, Gammon MD, Edmiston SN, et
al: IGF1 CA repeat polymorphisms, lifestyle factors and breast
cancer risk in the Long Island Breast Cancer Study Project.
Carcinogenesis. 27:758–765. 2006. View Article : Google Scholar
|
|
35
|
Missmer SA, Haiman CA and Hunter DJ: A
sequence repeat in the insulin-like growth factor-1 gene and risk
of breast cancer. Int J Cancer. 100:332–336. 2002. View Article : Google Scholar : PubMed/NCBI
|
|
36
|
Fehringer G, Ozcelik H, Knight JA, et al:
Association between IGF1 CA microsatellites and mammographic
density, anthropometric measures, and circulating IGF-I levels in
premenopausal Caucasian women. Breast Cancer Res Treat.
116:413–423. 2009. View Article : Google Scholar
|
|
37
|
DeLellis K, Ingles S, Kolonel L, et al:
IGF1 genotype, mean plasma level and breast cancer risk in the
Hawaii/Los Angeles multiethnic cohort. British J Cancer.
88:277–282. 2003. View Article : Google Scholar
|
|
38
|
Chen HY, Chan IHS, Sham ALK, et al:
Haplotype effect in the IGF1 promoter accounts for the association
between microsatellite and serum IGF1 concentration. Clin
Endocrinol (Oxf). 74:520–527. 2011. View Article : Google Scholar
|
|
39
|
Jernström H, Sandberg T, Bågeman E, et al:
Insulin-like growth factor-1 genotype predicts breast volume after
pregnancy and hormonal contraception and is associated with
circulating insulin-like growth factor-1 levels: implications for
risk of early-onset breast cancer in young women from hereditary
breast cancer families. Br J Cancer. 14:92:857–866. 2005.
View Article : Google Scholar
|
|
40
|
Costalonga EF, Antonini SR, Guerra G Jr,
et al: Growth hormone pharmacogenetics: the interactive effect of
amicrosatellite in the IGF1 promoter region with the GHR-exon 3
and-202 A/C IGFBP3 variants on treatment outcomes of children with
severe GH deficiency. Pharmacogenomics J. 125:439–445. 2012.
View Article : Google Scholar
|
|
41
|
Hand BD, Kostek MC, Ferrell RE, et al:
Influence of promoter region variants of insulin-like growth factor
pathway genes on the strength-training response of muscle
phenotypes in older adults. J Appl Physiol. 103:1678–1687. 2007.
View Article : Google Scholar : PubMed/NCBI
|