Introduction
Breast cancer, is a major public-health issue
worldwide, and is the most common type of cancer in females
(1). Approximately 25% (2) of all females diagnosed with breast
cancer succumb to their disease, despite being treated according to
the clinical guidelines (3). The
causes of breast cancer have been widely investigated to improve
disease prevention and diagnosis. Susceptibility to breast cancer
has been attributed to a small number of highly penetrant mutations
and a large number of low-penetrant variations (4). The mutations of the tumor suppressor
genes breast cancer 1 (BRCA1) and BRCA2, have been demonstrated to
be closely associated with breast cancer (5,6).
However, the complex pathogenesis remains controversial and is
under investigation.
Genistein is the simplest isoflavonoid, which exists
extensively in the Leguminosae (7), and is often used as a cancer
chemopreventive agent. Previous research has demonstrated that
genistein can reduce the incidence of diseases that are dependent
upon estrogen, and functions in the prevention of tumors,
cardiovascular disease and osteoporosis (8). Furthermore, genistein has been
demonstrated to be effective in the prevention of chemically
induced mammary tumors in rats (9). This has been attributed to the
promotion of cell differentiation and inactivation of the epidermal
growth factor signaling pathway (10). Conversely, research has shown that
dietary genistein can stimulate mammary gland growth and enhance
the growth of MCF-7 cell tumors in ovariectomized athymic mice
(11). A ≥10 μmol/l dose of
genistein in in vitro experiments has confirmed its
effectiveness in breast cancer treatment (12). However, dietary treatment with
genistein at physiological concentrations produces blood levels of
genistein (0.39–3.36 μmol/l) that are sufficient to stimulate
estrogenic effects, such as breast tumor growth (13). Therefore the effects of different
concentrations and doses of genistein in the prevention or
promotion of breast cancer remain unclear.
The present study investigated the potential
mechanism underlying the effects of genistein and the influence of
different genistein concentrations on breast cancer. Microarray
data analysis was used to compare the gene expression profiles of
the MCF-7 human breast cancer cell line, treated with 3 and 10
μmol/l genistein, with MCF-7 cells treated with alcohol.
Materials and methods
Affymetrix microarray data
The gene microarray data of GSE5200 (14), including three MCF-7 human breast
cancer cell samples treated with 0.1% alcohol (control group) for
48 h, three MCF-7 human breast cancer cell samples treated with 3
μmol/l genistein for 48 h and three MCF-7 human breast cancer cell
samples treated with 10 μmol/l genistein for 48 h, were downloaded
from the Gene Expression Omnibus (GEO) database (http://www.ncbi.nlm.nih.gov/geo/). The Affymetrix
Human Genome U133A Array (GPL96) was applied for the analysis of
gene expression profiling, and annotation information for all the
probe sets was obtained from Affymetrix (Santa Clara, CA, USA).
Preprocessing of the raw data and
differentially expressed gene (DEG) analysis
Data preprocessing and normalization were performed
using the Support Vector Regression (15). The raw data of all the samples were
converted to an expression profile format. The missing data were
then imputed (16), and the
complete data were normalized using Support Vector Regression
(15). Statistical analysis was
performed using the LIMMA (Linear Models for Microarray Data)
package in R language (17) to
identify the DEGs in the groups treated with 3 μmol/l and 10 μmol/l
genistein compared with the control group. The threshold was set at
P<0.05 and |logFC| >1.
Functional enrichment of DEGs
The sequences of the DEGs selected in the 3 and 10
μmol/l genistein groups were mapped using the Clusters of
Orthologous Groups (COG) database (http://www.ncbi.nlm.nih.gov/COG) (18) with BLASTX software (19) (similarity threshold, E-value
<1E-5), to obtain the functional annotation and COG
classification of the DEGs. Through COG classification, the
functions of the DEGs in the breast cancer cells treated with
different concentrations of genistein, were represented visually
and were subsequently analyzed.
Construction of the interaction
network
The combination and dissociation of proteins is
required for vital physiological activities and the responses of
cells to the external and internal environment are based on the
signal transduction networks formed by protein-protein interaction
(PPI) networks (20). It is
therefore necessary to investigate PPI networks to understand
biological processes (21). In the
present study, the interaction networks of the DEGs in the two
groups treated with genistein were constructed using Osprey
software (22), which is designed
to enhance the understanding of interaction networks and protein
complexes. This software is integrated with the Biomolecular
Interaction Network Database (BIND) (23) and Global Resource Information
Database (GRID) (23,24), which include >50,000
interactions among protein and nucleotide sequences. The
interaction networks of the two groups were integrated and the
overlapping network was abstracted for subsequent analysis.
Functional enrichment analysis of the
genes in the overlapping network
Gene set enrichment analysis is based on a group of
genes that possess common or relevant functions as compared with
the traditional single gene analysis. The variation in biological
function is considered to be related to the expression profile of
the gene sets rather than individual genes (24,25).
In the present study, the DEGs obtained in the overlapping network
of the two interaction networks, underwent functional enrichment
analysis using the Database for Annotation Visualization and
Integrated Discovery (DAVID) (26)
software, with a false discovery rate (FDR) <0.05.
Pathway enrichment of the genes in the
overlapping network
The pathway enrichment analysis of the DEGs that
were identified in the overlapping network, which was obtained from
the two groups treated with 3 and 10 μmol/l genistein respectively,
was performed using WebGestalt (27,28)
software. The statistical threshold was set to FDR <0.05.
Results
Screening of the DEGs
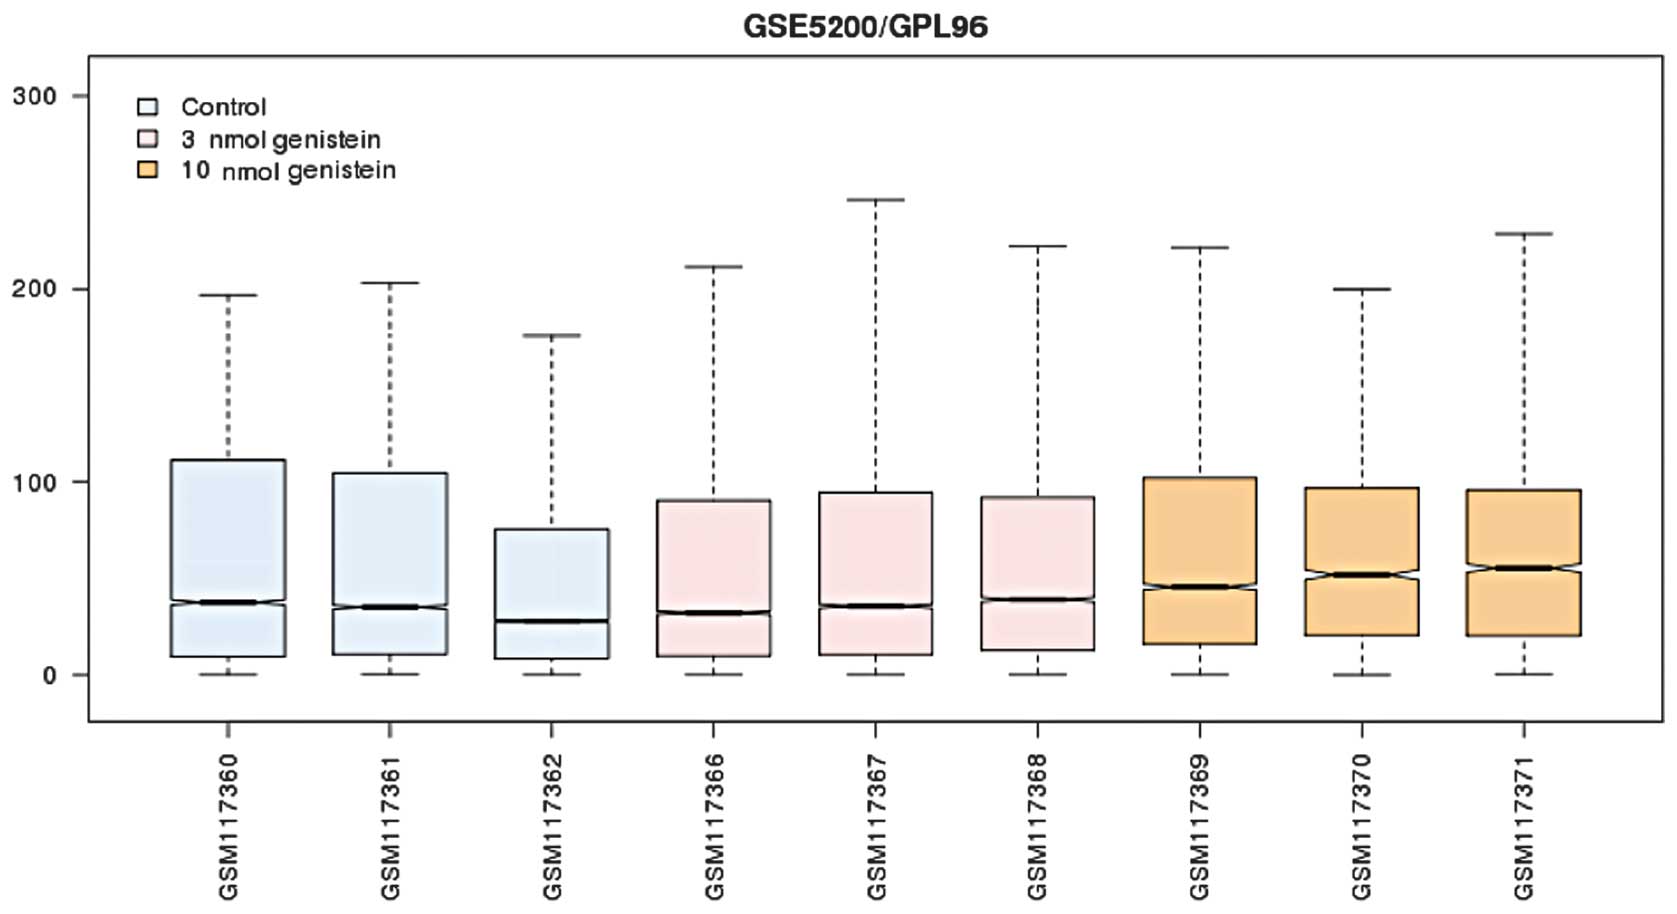
After preprocessing, the standardized expression
profile (Fig. 1) was subjected to
differential analysis. The results showed that 544 and 729 DEGs
were screened out in the 3 and 10 μmol/l genistein group,
respectively (P<0.05 and |logFC| >1). The number of DEGs in
the 10 μmol/l genistein group was markedly greater as compared with
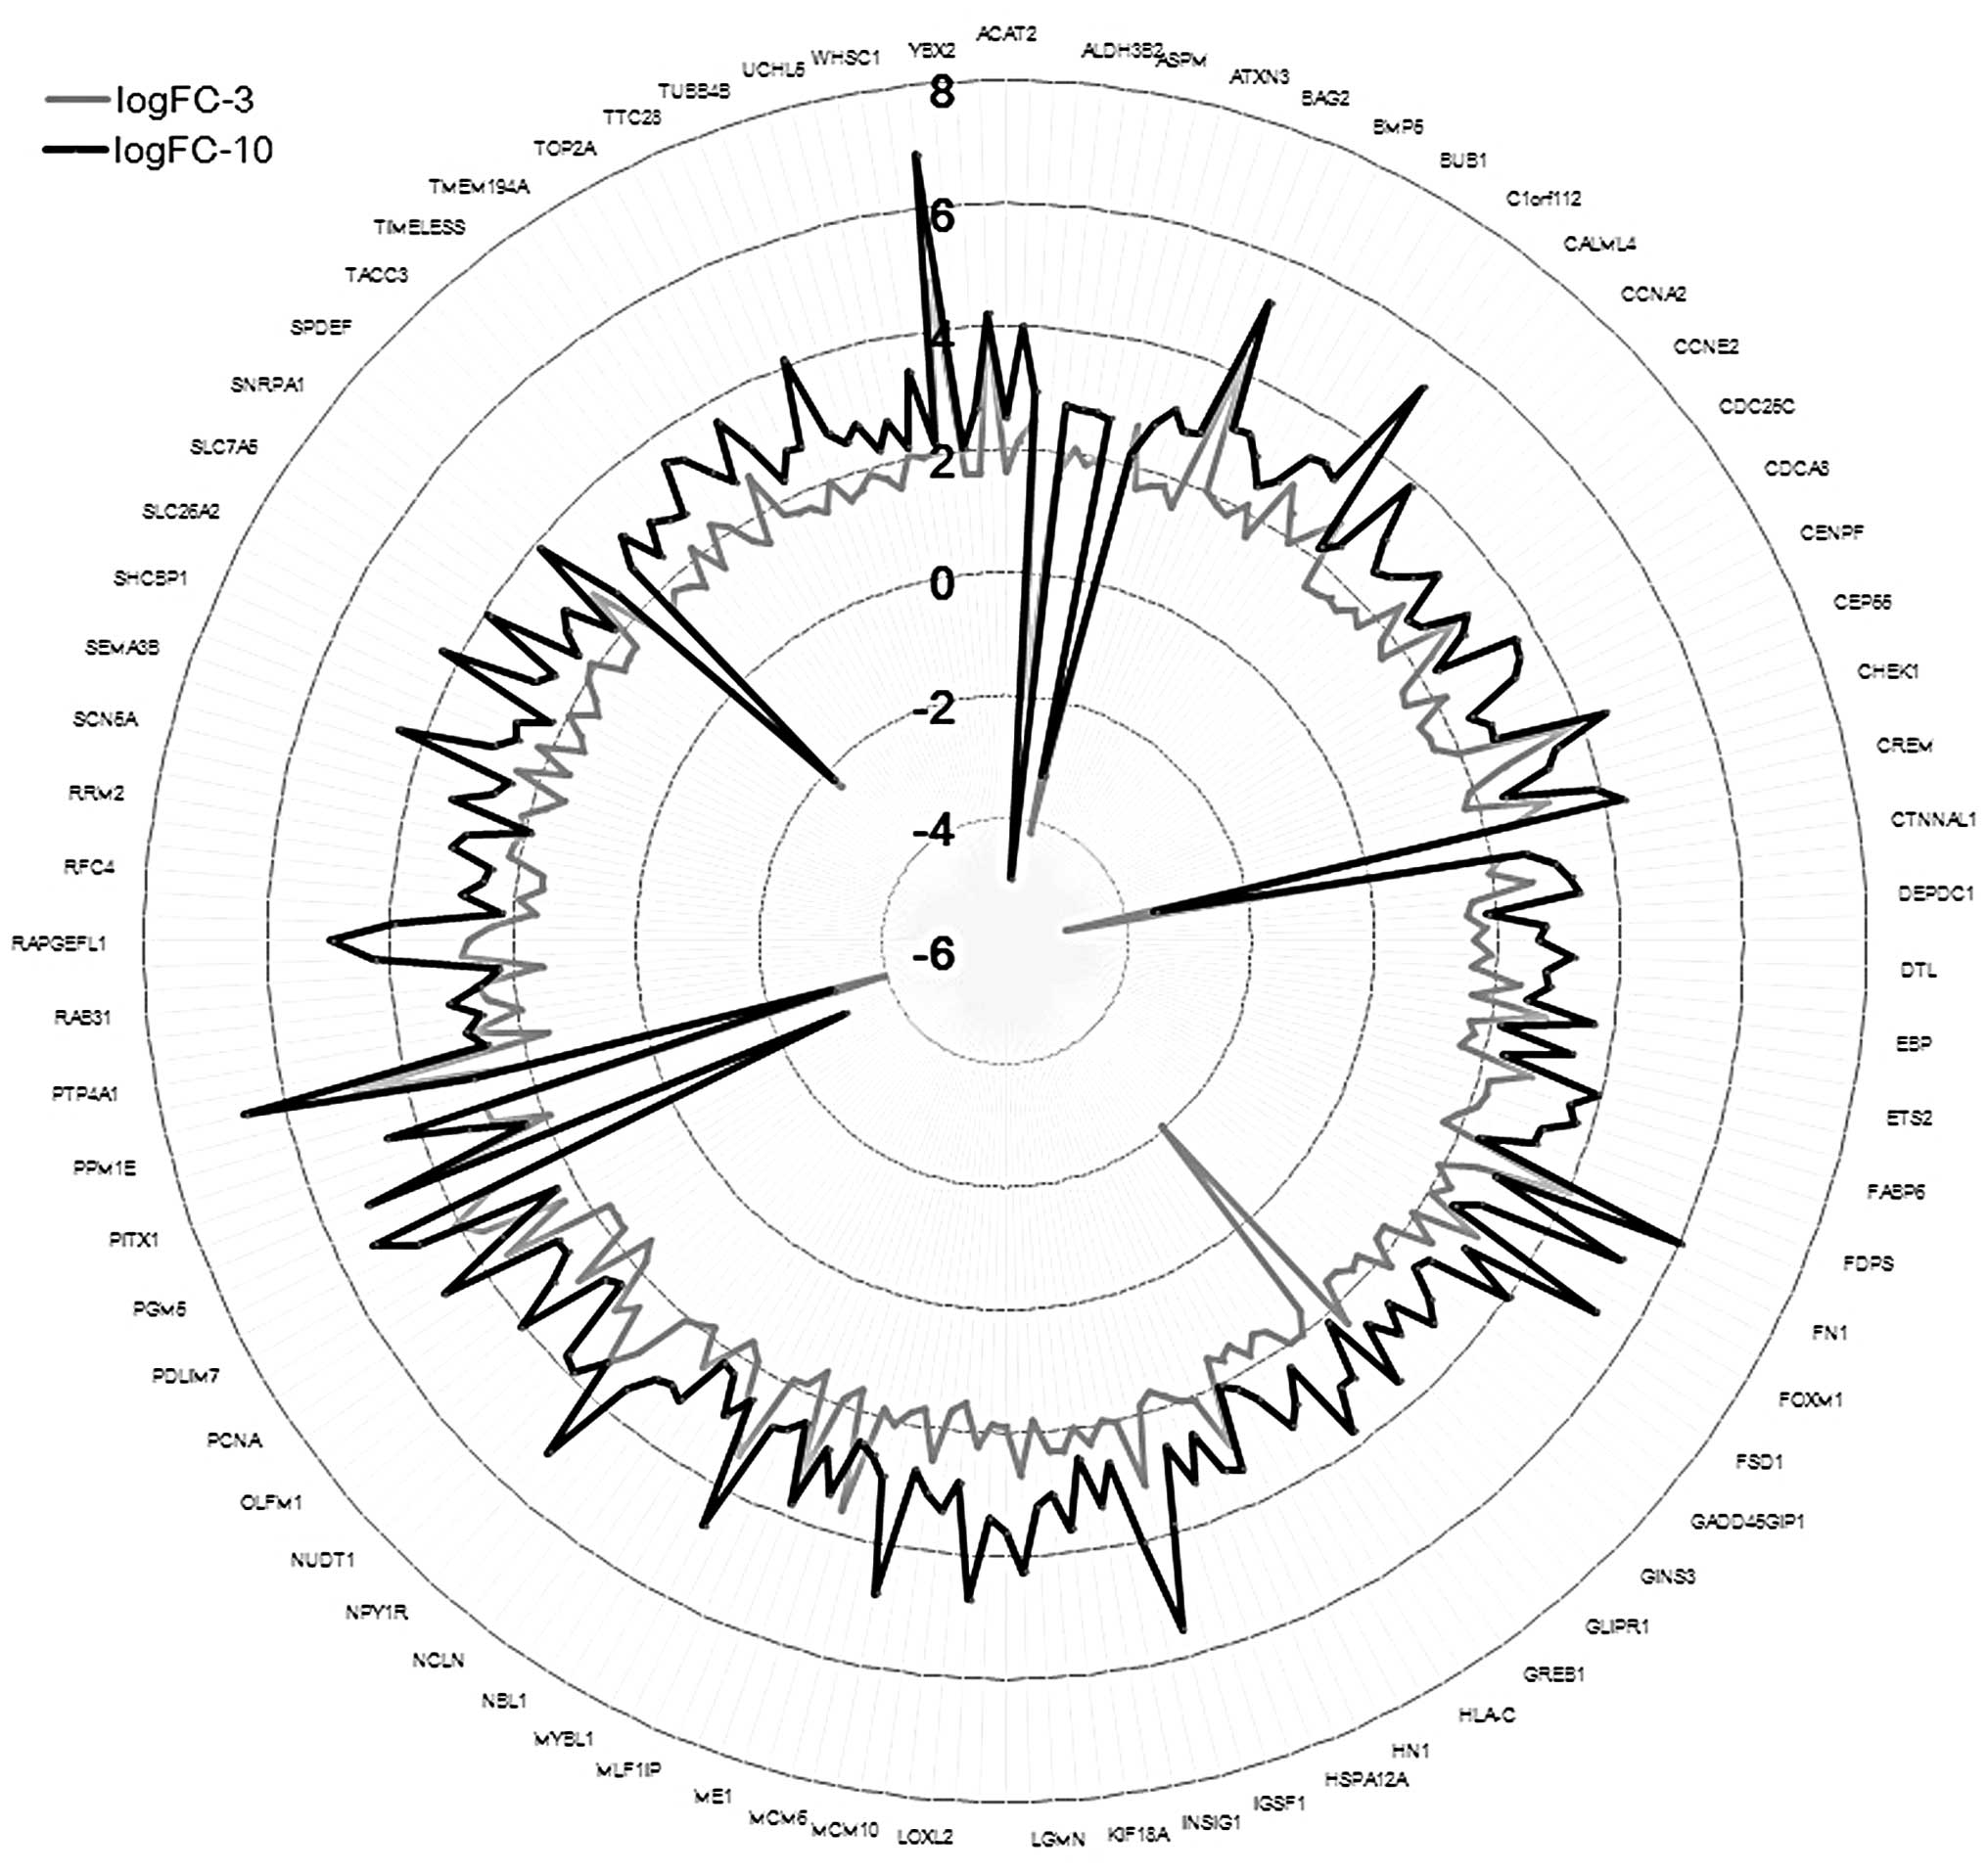
that of the 3 μmol/l genistein group. Furthermore, there were 224
DEGs that were present in both groups (Fig. 2). The number and the fold change of
expression values of the DEGs in the 10 μmol/l genistein group were
significantly higher as compared with the 3 μmol/l genistein
group.
Functional enrichment analysis of the
DEGs
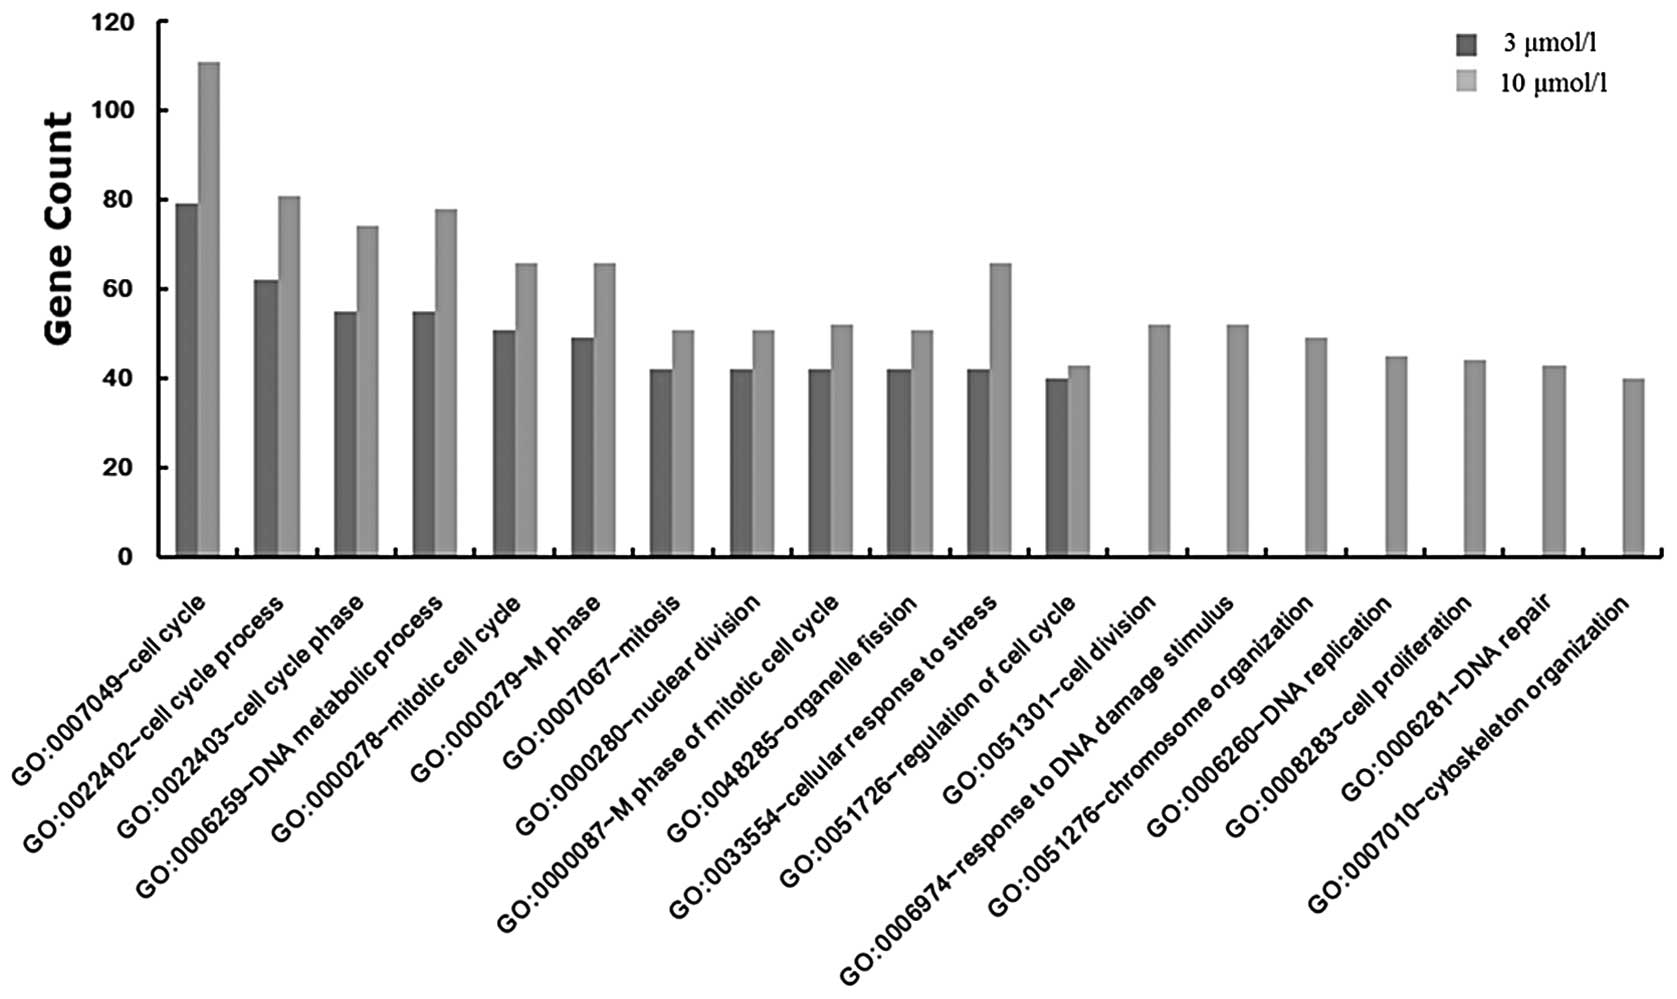
To determine the function of the DEGs in the two
groups treated with genistein, the DEGs were mapped to the COG
database. Twelve functional nodes were identified in the group
treated with 3 μmol/l genistein, and 19 functional nodes were
identified in the group treated with 10 μmol/l genistein (Fig. 3). In the 10 μmol/l genistein group,
there were seven functional nodes, which included cell division,
DNA damage response, chromosome organization, DNA replication,
cellular proliferation, DNA repair and cytoskeleton organization;
and 12 functional nodes that were shared in both groups. The most
significant function of the DEGs in the 3
(FDR=3.29×10⁻¹⁷) and 10 μmol/l genistein groups
(FDR=4.31×10⁻²⁶) was the cell cycle (GO:0007049).
Interaction networks of the samples
treated with genistein
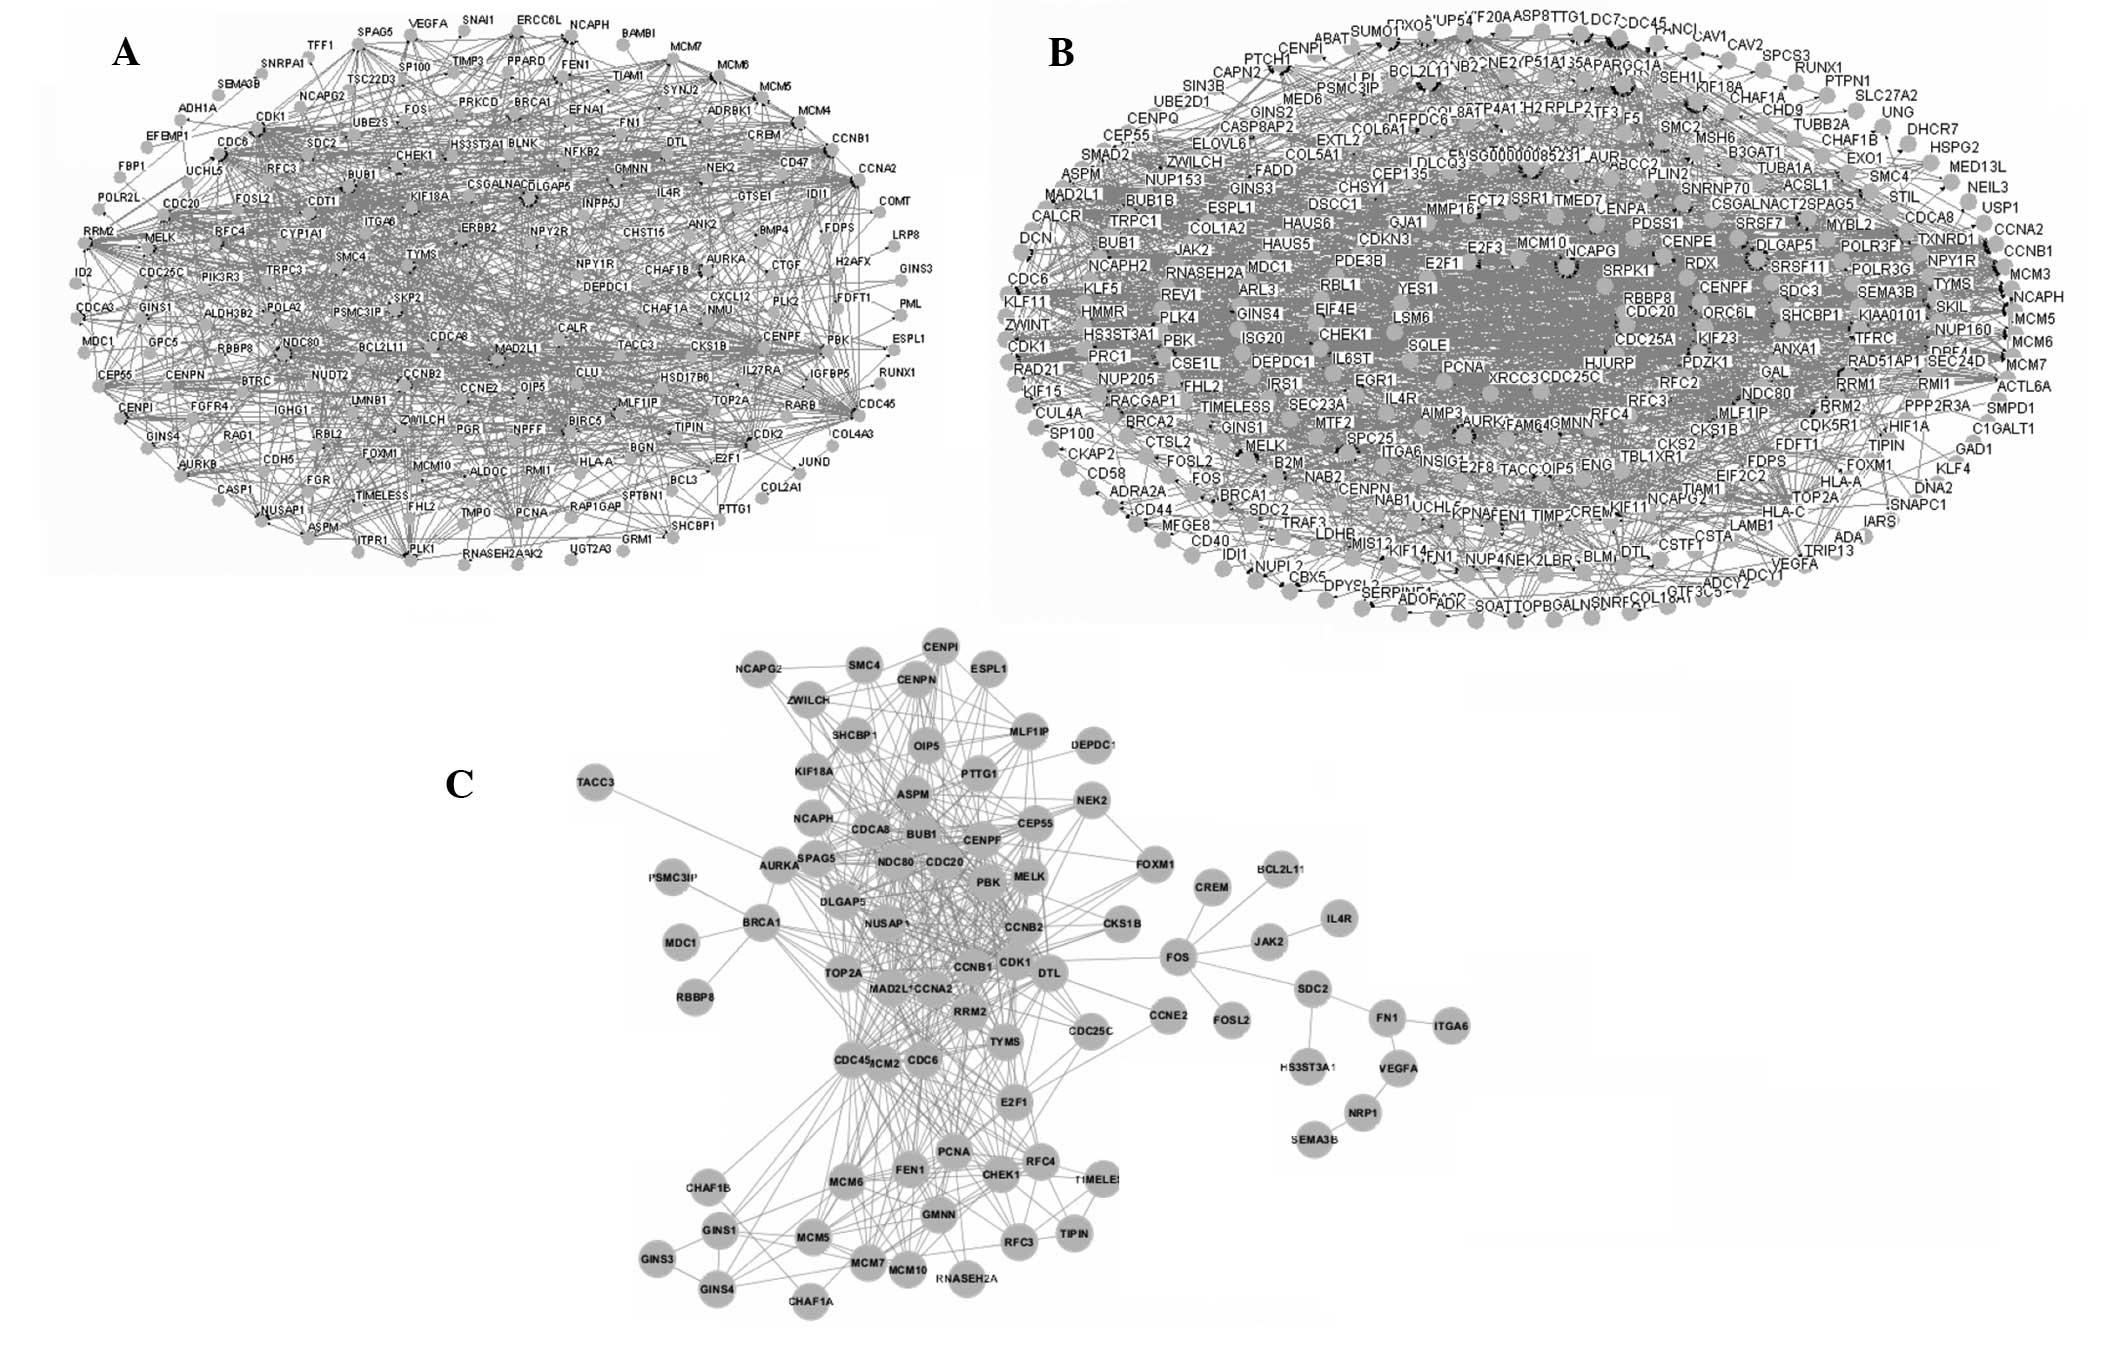
The interaction networks of the DEGs in the two
groups were constructed using Osprey software. The networks of the
groups treated with 3 and 10 μmol/l genistein are shown in Fig. 4A and B, respectively. These two
networks were merged and the overlapping network was extracted
(Fig. 4C). The overlapping network
consisted of 49 DEGs and 499 edges.
Functional enrichment analysis of the
genes in the overlapping network
In order to investigate the potential functions of
the DEGs, the 49 DEGs were subjected to functional enrichment
analysis using DAVID software. The results indicated that the 49
genes clustered into 15 functional terms (Table I), including the cell cycle
(FDR=4.02×10⁻³¹), nuclear division
(FDR=1.39×10⁻²⁷) and mitosis
(FDR=1.39×10⁻²⁷). The most significant function was the
cell cycle (GO:0007049, FDR=4.02×10⁻³¹), which contained
47 genes, including cell division cycle 20 (CDC20), spindle
checkpoint gene (BUB1), mini-chromosome maintenance (MCM) complex 2
and cyclin B1 (CCNB1).
 | Table IResult of functional enrichment of
differentially expressed genes in the overlapping network. |
Table I
Result of functional enrichment of
differentially expressed genes in the overlapping network.
| Term | Count | FDR |
|---|
| GO:0007049~ cell
cycle | 47 |
4.02×10⁻³¹ |
| GO:0000280~ nuclear
division | 30 |
1.39×10⁻²⁷ |
| GO:0007067~
mitosis | 30 |
1.39×10⁻²⁷ |
| GO:0000087~ M phase
of mitotic cell cycle | 30 |
2.39×10⁻²⁷ |
| GO:0048285~
organelle fission | 30 |
4.64×10⁻²⁷ |
| GO:0000279~ M
phase | 33 |
1.43×10⁻²⁶ |
| GO:0006260~ DNA
replication | 28 |
2.51×10⁻²⁶ |
| GO:0022403~ cell
cycle phase | 35 |
4.92×10⁻²⁶ |
| GO:0000278~ mitotic
cell cycle | 33 |
6.18×10⁻²⁵ |
| GO:0022402~ cell
cycle process | 36 |
9.46×10⁻²³ |
| GO:0051301~ cell
division | 29 |
2.00×10⁻²² |
| GO:0006259~ DNA
metabolic process | 33 |
1.14×10⁻²⁰ |
| GO:0051726~
regulation of cell cycle | 25 |
5.84×10⁻¹⁶ |
| GO:0006974~
response to DNA damage | 20 |
2.95×10⁻⁹ |
| GO:0033554~
cellular response to stress | 22 |
7.08×10⁻⁸ |
Pathway enrichment of the genes in the
overlapping network
In order to understand the pathway and function of
the DEGs in the overlapping network, the 49 DEGs underwent pathway
enrichment analysis using the WebGestalt software. The results
(Table II) indicated that three
pathways were significantly enriched, including the cell cycle
(FDR=1.52×10⁻¹⁶), DNA replication
(FDR=5.95×10⁻⁷) and oocyte meiosis
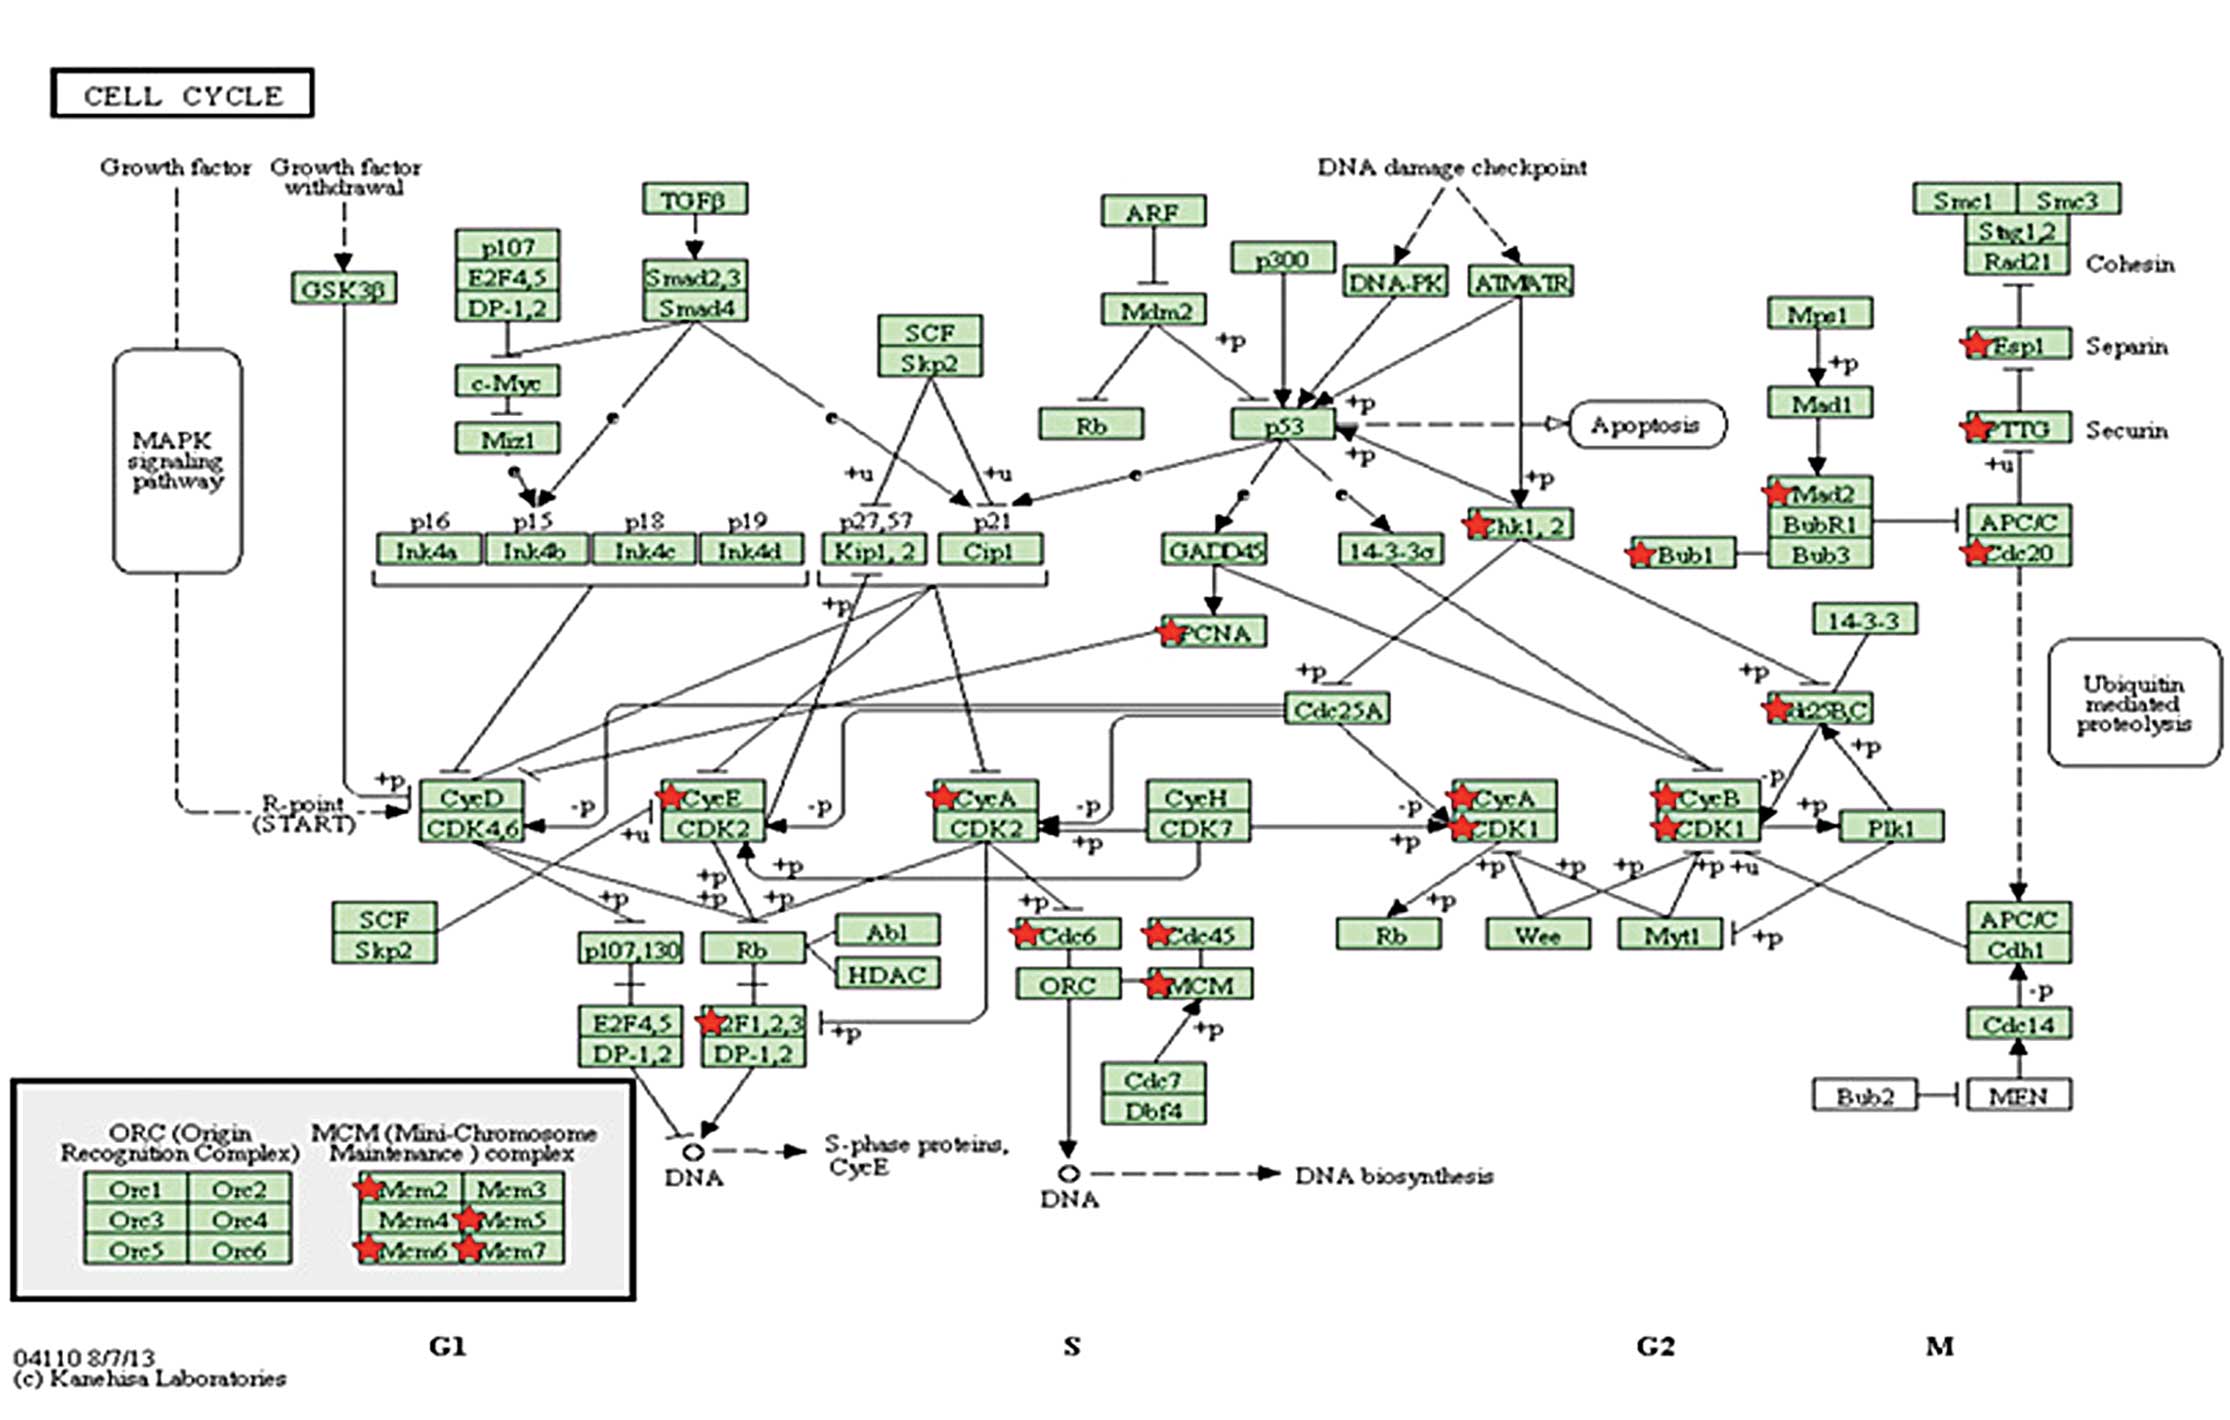
(FDR=3.16×10⁻⁵). The cell cycle was the most significant
pathway, containing 20 DEGs (Fig.
5), including CDC20, MCM2, CCNB1 and BUB1. These data indicated
that the DEGs were involved in different phases of the cell
cycle.
| Table IIResult of pathway enrichment of
differentially expressed genes in the overlapping network. |
Table II
Result of pathway enrichment of
differentially expressed genes in the overlapping network.
| Term | Count | FDR |
|---|
| hsa04110:Cell
cycle | 20 |
1.52×10⁻¹⁶ |
| hsa03030:DNA
replication | 9 |
5.95×10⁻⁷ |
| hsa04114:Oocyte
meiosis | 11 |
3.16×10⁻⁵ |
Discussion
Breast cancer is the most commonly diagnosed type of
cancer among females. Although certain genetic mutations have
demonstrated an association with the development of breast cancer,
such as p53 and BRCA1 (29,30),
there remain numerous unanswered questions regarding the etiology
of this disease (31).
In the present study, the gene expression profiles
of MCF 7 cells treated with 3 and 10 μmol/l genistein were
analyzed, respectively. The results showed that the number of DEGs
in the cell cycle was increased in the 10 μmol/l genistein group as
compared with the 3 μmol/l genistein group, and the function of
cell proliferation was enriched in the 10 μmol/l genistein group.
This suggested that a high concentration of genistein could
initiate more marked changes in the expression of the DEGs. The
most significant function of the DEGs in the overlapping network
was the cell cycle, involving 47 DEGs, including CDC20, BUB1, MCM2
and cyclin B1. These genes were also involved in the cell cycle
pathway, which was the most significant pathway in the pathway
enrichment analysis. CDC20 is an essential cell-cycle regulator
required for the completion of mitosis. CDC20 binds to and
activates the ubiquitin ligase activity of the anaphase-promoting
complex/cyclosome (APC/C), and enables the ubiquitination and
degradation of securin and cyclin B, thus promoting the onset of
anaphase and completion of mitotis (32). The mRNA and protein levels of CDC20
and BUB1 have been shown to be significantly higher in breast
cancer cell lines and in high-grade primary breast cancer tissues.
In addition, the upregulation of BUB1 protein is used as a marker,
as it is upregulated in ~80% of breast cancers in paraffin-embedded
tissues (33). Upregulation of
cyclin B1 has been associated with poor prognosis in hormone
receptor-positive, luminal B and basal-like breast cancers
(34). MCM-2 has been reported for
its use as a strongly independent prognostic marker in breast
cancer and non-small cell lung cancer (35,36),
in addition to the standard proliferation marker Ki-67. MCM2 and
BUB1 have additionally been identified to be involved in cell cycle
progression (37). Therefore, the
cell cycle may be important role in the development of breast
cancer. In this study, the expression levels of CDC20, BUB1, MCM2,
and cyclin B1 were upregulated in the 3 and 10 μmol/l genistein
groups, indicating the promoting effects of genistein on cancer
cell proliferation. However, inhibition effects of genistein on
cancer cell proliferation also exist and act via the cell
cycle.
Pathway enrichment analysis further confirmed the
participation of these DEGs in the cell cycle. Cell cycle arrest
caused by genistein occurs during different phases of the cell
cycle, including G2/M, G0/G1 and
G1/S phase. In a previous study, Cappelletti et
al (38) demonstrated that
genistein could restrain breast cancer cells to the G2/M
phase (38). The accumulation of
genistein-treated cells have additionally been shown to exist in
the S and G2/M phases of the cell cycle, and undergo
apoptosis (39). Genistein could
induce the up- and downregulation of apoptosis-associated genes,
including Bax-2, p21WAF1, Bcl-2 and p53 (40), and the ratio of Bax and Bcl-2 were
previously demonstrated to be important for the survival of cells
(41). Therefore, genistein could
inhibit the cell cycle in breast cancer, resulting in cellular
apoptosis. Notably, the GLIPR1 gene was downregulated in the 3
μmol/l genistein group, while upregulated in the 10 μmol/l
genistein group. GLIPR1, also termed RTVP1, encodes glioma
pathogenesis-related protein 1, which has p53-regulated
proapoptotic activities, and is downregulated in prostate and
bladder cancer cells (42). The
discrepancy in the GLIPR1 expression between the two genistein
groups indicated that the effects of genistein are dose-dependent,
and genestien only inhibits cancer at a high concentration.
In conclusion, the cell cycle may be an important
pathway based on the analysis of MCF-7 breast cancer cells treated
with 3 and 10 μmol/l genistein, respectively. This revealed that
the cell cycle may be an important pathway in the mechanisms
underlying the treatment of breast cancer with genistein. The
identified DEGs, which were involved in cell cycle, including
CDC20, BUB1, GLIPR1, MCM2, and CCNB1, could have a crucial function
in the development of breast cancer, and may become potential
targets or prognostic markers for breast cancer. Experimental
verification is required in future studies.
Acknowledgements
The authors would like to thank the Applied Basic
Research Program of Science & Technology Department of Sichuan
for funding this research (grant no. 2011JY0038).
References
|
1
|
Jemal A, Siegel R, Xu J and Ward E: Cancer
statistics, 2010. CA Cancer J Clin. 60:277–300. 2010. View Article : Google Scholar : PubMed/NCBI
|
|
2
|
Brenner H: Long-term survival rates of
cancer patients achieved by the end of the 20th century: a period
analysis. Lancet. 360:1131–1135. 2002. View Article : Google Scholar : PubMed/NCBI
|
|
3
|
Goldhirsch A, Glick JH, Gelber RD, Coates
AS and Senn HJ: Meeting highlights: International consensus panel
on the treatment of primary breast cancer. Seventh international
conference on adjuvant therapy of primary breast cancer. J Clin
Oncol. 19:3817–3827. 2001.PubMed/NCBI
|
|
4
|
Nathanson KL, Wooster R and Weber BL:
Breast cancer genetics: what we know and what we need. Nat Med.
7:552–556. 2001. View
Article : Google Scholar : PubMed/NCBI
|
|
5
|
Rahman N and Stratton MR: The genetics of
breast cancer susceptibility. Annu Rev Genet. 32:95–121. 1998.
View Article : Google Scholar
|
|
6
|
King MC, Marks JH and Mandell JB; New York
Breast Cancer Study Group. Breast and ovarian cancer risks due to
inherited mutations in BRCA1 and BRCA2. Science. 302:643–646. 2003.
View Article : Google Scholar : PubMed/NCBI
|
|
7
|
Dixon RA and Ferreira D: Genistein.
Phytochemistry. 60:205–211. 2002. View Article : Google Scholar : PubMed/NCBI
|
|
8
|
Marini H, Minutoli L, Polito F, et al:
Effects of the phytoestrogen genistein on bone metabolism in
osteopenic postmenopausal women: a randomized trial. Ann Intern
Med. 146:839–847. 2007. View Article : Google Scholar : PubMed/NCBI
|
|
9
|
Fritz WA, Coward L, Wang J and
Lamartiniere CA: Dietary genistein: perinatal mammary cancer
prevention, bioavailability and toxicity testing in the rat.
Carcinogenesis. 19:2151–2158. 1998. View Article : Google Scholar
|
|
10
|
Lamartiniere CA: Protection against breast
cancer with genistein: a component of soy. Am J Clin Nutr.
71(Suppl): 1705S–1709S. 2000.PubMed/NCBI
|
|
11
|
Hsieh CY, Santell RC, Haslam SZ and
Helferich WG: Estrogenic effects of genistein on the growth of
estrogen receptor-positive human breast cancer (MCF-7) cells in
vitro and in vivo. Cancer Res. 58:3833–3838. 1998.PubMed/NCBI
|
|
12
|
Messina MJ and Loprinzi CL: Soy for breast
cancer survivors: a critical review of the literature. J Nutr.
131(Suppl): 3095S–3108S. 2001.PubMed/NCBI
|
|
13
|
Ju YH, Allred CD, Allred KF, Karko KL,
Doerge DR and Helferich WG: Physiological concentrations of dietary
genistein dose-dependently stimulate growth of estrogen-dependent
human breast cancer (MCF-7) tumors implanted in athymic nude mice.
J Nutr. 131:2957–2962. 2001.PubMed/NCBI
|
|
14
|
Shioda T, Chesnes J, Coser KR, et al:
Importance of dosage standardization for interpreting
transcriptomal signature profiles: evidence from studies of
xenoestrogens. Proc Natl Acad Sci USA. 103:12033–12038. 2006.
View Article : Google Scholar : PubMed/NCBI
|
|
15
|
Fujita A, Sato J, de Rodrigues LO,
Ferreira CE and Sogayar MC: Evaluating different methods of
microarray data normalization. BMC Bioinformatics. 7:4692006.
View Article : Google Scholar : PubMed/NCBI
|
|
16
|
Troyanskaya O, Cantor M, Sherlock G, et
al: Missing value estimation methods for DNA microarrays.
Bioinformatics. 17:520–525. 2001. View Article : Google Scholar : PubMed/NCBI
|
|
17
|
Smyth GK: Limma: linear models for
microarray data. Bioinformatics and Computational Biology Solutions
Using R and Bioconductor. Gentleman R, Carey V, Dudoit S, Irizarry
R and Huber W: Springer; New York, NY: pp. 397–420. 2005,
View Article : Google Scholar
|
|
18
|
Tatusov RL, Natale DA, Garkavtsev IV, et
al: The COG database: new developments in phylogenetic
classification of proteins from complete genomes. Nucleic Acids
Res. 29:22–28. 2001. View Article : Google Scholar :
|
|
19
|
Altschul SF, Gish W, Miller W, Myers EW
and Lipman DJ: Basic local alignment search tool. J Mol Biol.
215:403–410. 1990. View Article : Google Scholar : PubMed/NCBI
|
|
20
|
Giot L, Bader JS, Brouwer C, et al: A
protein interaction map of Drosophila melanogaster. Science.
302:1727–1736. 2003. View Article : Google Scholar : PubMed/NCBI
|
|
21
|
Deng M, Zhao JY, Ju XD, Tu PF, Jiang Y and
Li ZB: Protective effect of tubuloside B on TNFalpha-induced
apoptosis in neuronal cells. Acta Pharmacol Sin. 25:1276–1284.
2004.PubMed/NCBI
|
|
22
|
Breitkreutz B-J, Stark C and Tyers M:
Osprey: a network visualization system. Genome Biol. 4:R222003.
View Article : Google Scholar : PubMed/NCBI
|
|
23
|
Willis RC and Hogue CW: Searching,
viewing, and visualizing data in the Biomolecular Interaction
Network Database (BIND). Curr Protoc Bioinformatics. Chapter 8(Unit
8): 92006.
|
|
24
|
Breitkreutz BJ, Stark C and Tyers M: The
GRID: the General Repository for Interaction Datasets. Genome Biol.
4:R232003. View Article : Google Scholar : PubMed/NCBI
|
|
25
|
Nam D and Kim SY: Gene-set approach for
expression pattern analysis. Brief Bioinform. 9:189–197. 2008.
View Article : Google Scholar : PubMed/NCBI
|
|
26
|
Huang da W, Sherman BT and Lempicki RA:
Systematic and integrative analysis of large gene lists using DAVID
bioinformatics resources. Nat Protoc. 4:44–57. 2009. View Article : Google Scholar : PubMed/NCBI
|
|
27
|
Zhang B, Kirov S and Snoddy J: WebGestalt:
an integrated system for exploring gene sets in various biological
contexts. Nucleic Acids Res. 33:W741–W748. 2005. View Article : Google Scholar : PubMed/NCBI
|
|
28
|
Duncan D, Prodduturi N and Zhang B:
WebGestalt2: an updated and expanded version of the Web-based Gene
Set Analysis Toolkit. BMC Bioinformatics. 11:P102010. View Article : Google Scholar
|
|
29
|
Coles C, Condie A, Chetty U, Steel CM,
Evans HJ and Prosser J: p53 mutations in breast cancer. Cancer Res.
52:5291–5298. 1992.PubMed/NCBI
|
|
30
|
Giancotti V: Breast cancer markers. Cancer
Lett. 243:145–159. 2006. View Article : Google Scholar : PubMed/NCBI
|
|
31
|
Ganz PA: Breast cancer, menopause, and
long-term survivorship: critical issues for the 21st century. Am J
Med. 118:136–141. 2005. View Article : Google Scholar
|
|
32
|
Yu H: Cdc20: A WD40 activator for a cell
cycle degradation machine. Mol Cell. 27:3–16. 2007. View Article : Google Scholar : PubMed/NCBI
|
|
33
|
Yuan B, Xu Y, Woo JH, et al: Increased
expression of mitotic checkpoint genes in breast cancer cells with
chromosomal instability. Clin Cancer Res. 12:405–410. 2006.
View Article : Google Scholar : PubMed/NCBI
|
|
34
|
Agarwal R, Gonzalez-Angulo AM, Myhre S, et
al: Integrative analysis of cyclin protein levels identifies cyclin
b1 as a classifier and predictor of outcomes in breast cancer. Clin
Cancer Res. 15:3654–3662. 2009. View Article : Google Scholar : PubMed/NCBI
|
|
35
|
Gonzalez MA, Pinder SE, Callagy G, et al:
Minichromosome maintenance protein 2 is a strong independent
prognostic marker in breast cancer. J Clin Oncol. 21:4306–4313.
2003. View Article : Google Scholar : PubMed/NCBI
|
|
36
|
Yang J, Ramnath N, Moysich KB, et al:
Prognostic significance of MCM2, Ki-67 and gelsolin in non-small
cell lung cancer. BMC Cancer. 6:2032006. View Article : Google Scholar : PubMed/NCBI
|
|
37
|
Sotiriou C, Neo SY, McShane LM, et al:
Breast cancer classification and prognosis based on gene expression
profiles from a population-based study. Proc Natl Acad Sci USA.
100:10393–10398. 2003. View Article : Google Scholar : PubMed/NCBI
|
|
38
|
Cappelletti V, Fioravanti L, Miodini P and
Di Fronzo G: Genistein blocks breast cancer cells in the G(2)M
phase of the cell cycle. J Cell Biochem. 79:594–600. 2000.
View Article : Google Scholar : PubMed/NCBI
|
|
39
|
Fioravanti L, Cappelletti V, Miodini P,
Ronchi E, Brivio M and Di Fronzo G: Genistein in the control of
breast cancer cell growth: insights into the mechanism of action in
vitro. Cancer Lett. 130:143–152. 1998. View Article : Google Scholar : PubMed/NCBI
|
|
40
|
Li Y, Upadhyay S, Bhuiyan M and Sarkar FH:
Induction of apoptosis in breast cancer cells MDA-MB-231 by
genistein. Oncogene. 18:3166–3172. 1999. View Article : Google Scholar : PubMed/NCBI
|
|
41
|
Salomons GS, Brady HJ, Verwijs-Janssen M,
et al: The Bax alpha:Bcl-2 ratio modulates the response to
dexamethasone in leukaemic cells and is highly variable in
childhood acute leukaemia. Int J Cancer. 71:959–965. 1997.
View Article : Google Scholar : PubMed/NCBI
|
|
42
|
Ren C, Li L, Yang G, et al: RTVP-1, a
tumor suppressor inactivated by methylation in prostate cancer.
Cancer Res. 64:969–976. 2004. View Article : Google Scholar : PubMed/NCBI
|