Introduction
Diabetes is caused by an absolute or relative
deficiency of insulin. It is one of the most prevalent of all
chronic diseases, which is characterized by high blood sugar and
multiple secondary complications. Obesity is a risk factor for
insulin resistance, a precursor of type 2 diabetes, which involves
a decreased response to insulin signaling in several peripheral
tissues including adipose, liver and muscle (1,2).
However, not all obese individuals are insulin-resistant (3).
Adipose tissue secretes numerous hormones and
cytokines that function to regulate food intake and nutrient
homeostasis, including insulin-like growth factor 2, leptin and
resistin (4), and its role in the
regulation of metabolism has been increasingly recognized in recent
years (5). Previous studies have
revealed a number of linkages between obesity and insulin
resistance. Obesity-associated chronic inflammation in adipose
tissue has a crucial role in the development of obesity-related
insulin resistance (6–9). Adipocyte-derived cytokines are
important in the pathogenesis of insulin resistance and type 2
diabetes (10). Hirosumi et
al (11) indicated that the
c-Jun amino-terminal kinase is a crucial mediator of obesity and
insulin resistance. However, the molecular mechanisms underlying
this effect remain elusive.
In the present study, the gene expression profiles
of adipose tissue samples obtained from insulin-sensitive and
insulin-resistant patients were compared with the aim of
identifying differentially expressed genes (DEGs). Bioinformatic
analysis, including interaction network analysis and functional
enrichment analysis, were performed to disclose the key biological
functions associated with insulin resistance. These findings may
advance the understanding of insulin resistance and benefit the
development of novel treatment strategies.
Materials and methods
Microarray data
Microarray data set GSE20950 (12) was downloaded from the Gene
Expression Omnibus, including 39 subcutaneous and omental adipose
samples, obtained from insulin-sensitive and insulin-resistant
obese patients undergoing gastric bypass surgery. The platform was
GPL570 [HG-U133_Plus_2] Affymetrix Human Genome U133 Plus 2.0 Array
(Affymetrix, Santa Clara, CA, USA). The probe annotation files were
also collected.
Raw data pre-treatment and differential
analysis
All of the adipose samples were divided into two
groups: The insulin-sensitive group and the insulin-resistant
group. Using software R, CEL raw expression data were
converted into gene expression values, which were then normalized
by the median method (13,14). DEGs between the two groups were
screened out with the limma package (15) and multiple testing corrections were
applied on the P-value with the Benjamin-Hochberg method (16). Only the genes with a false
discovery rate (FDR)<0.05 and |logFC(fold change)|>1 were
selected as DEGs.
Interaction network and functional
enrichment analysis
The interactions between DEGs were investigated with
Osprey (17), which is designed to
promote research into protein, protein interactions (PPIs) and
protein complexes, and which integrates information from the
Biomolecular Interaction Network Database (18) and the General Repository for
Interaction Datasets (19), and
contains >50,000 interactions.
Functional enrichment analysis was applied on the
DEGs in the network using WebGestalt (20,21).
P<0.05 was set as the threshold.
Functional interaction network and
pathway enrichment analysis
Based on the interaction network and functional
enrichment analysis result, a functional interaction network was
constructed.
Kyoto Encyclopedia of Genes and Genomes (KEGG)
(22) pathway analysis was applied
on the genes in the functional interaction network using the
Database for Annotation, Visualization and Integrated Discovery.
P<0.05 was set as the threshold.
Results
DEGs
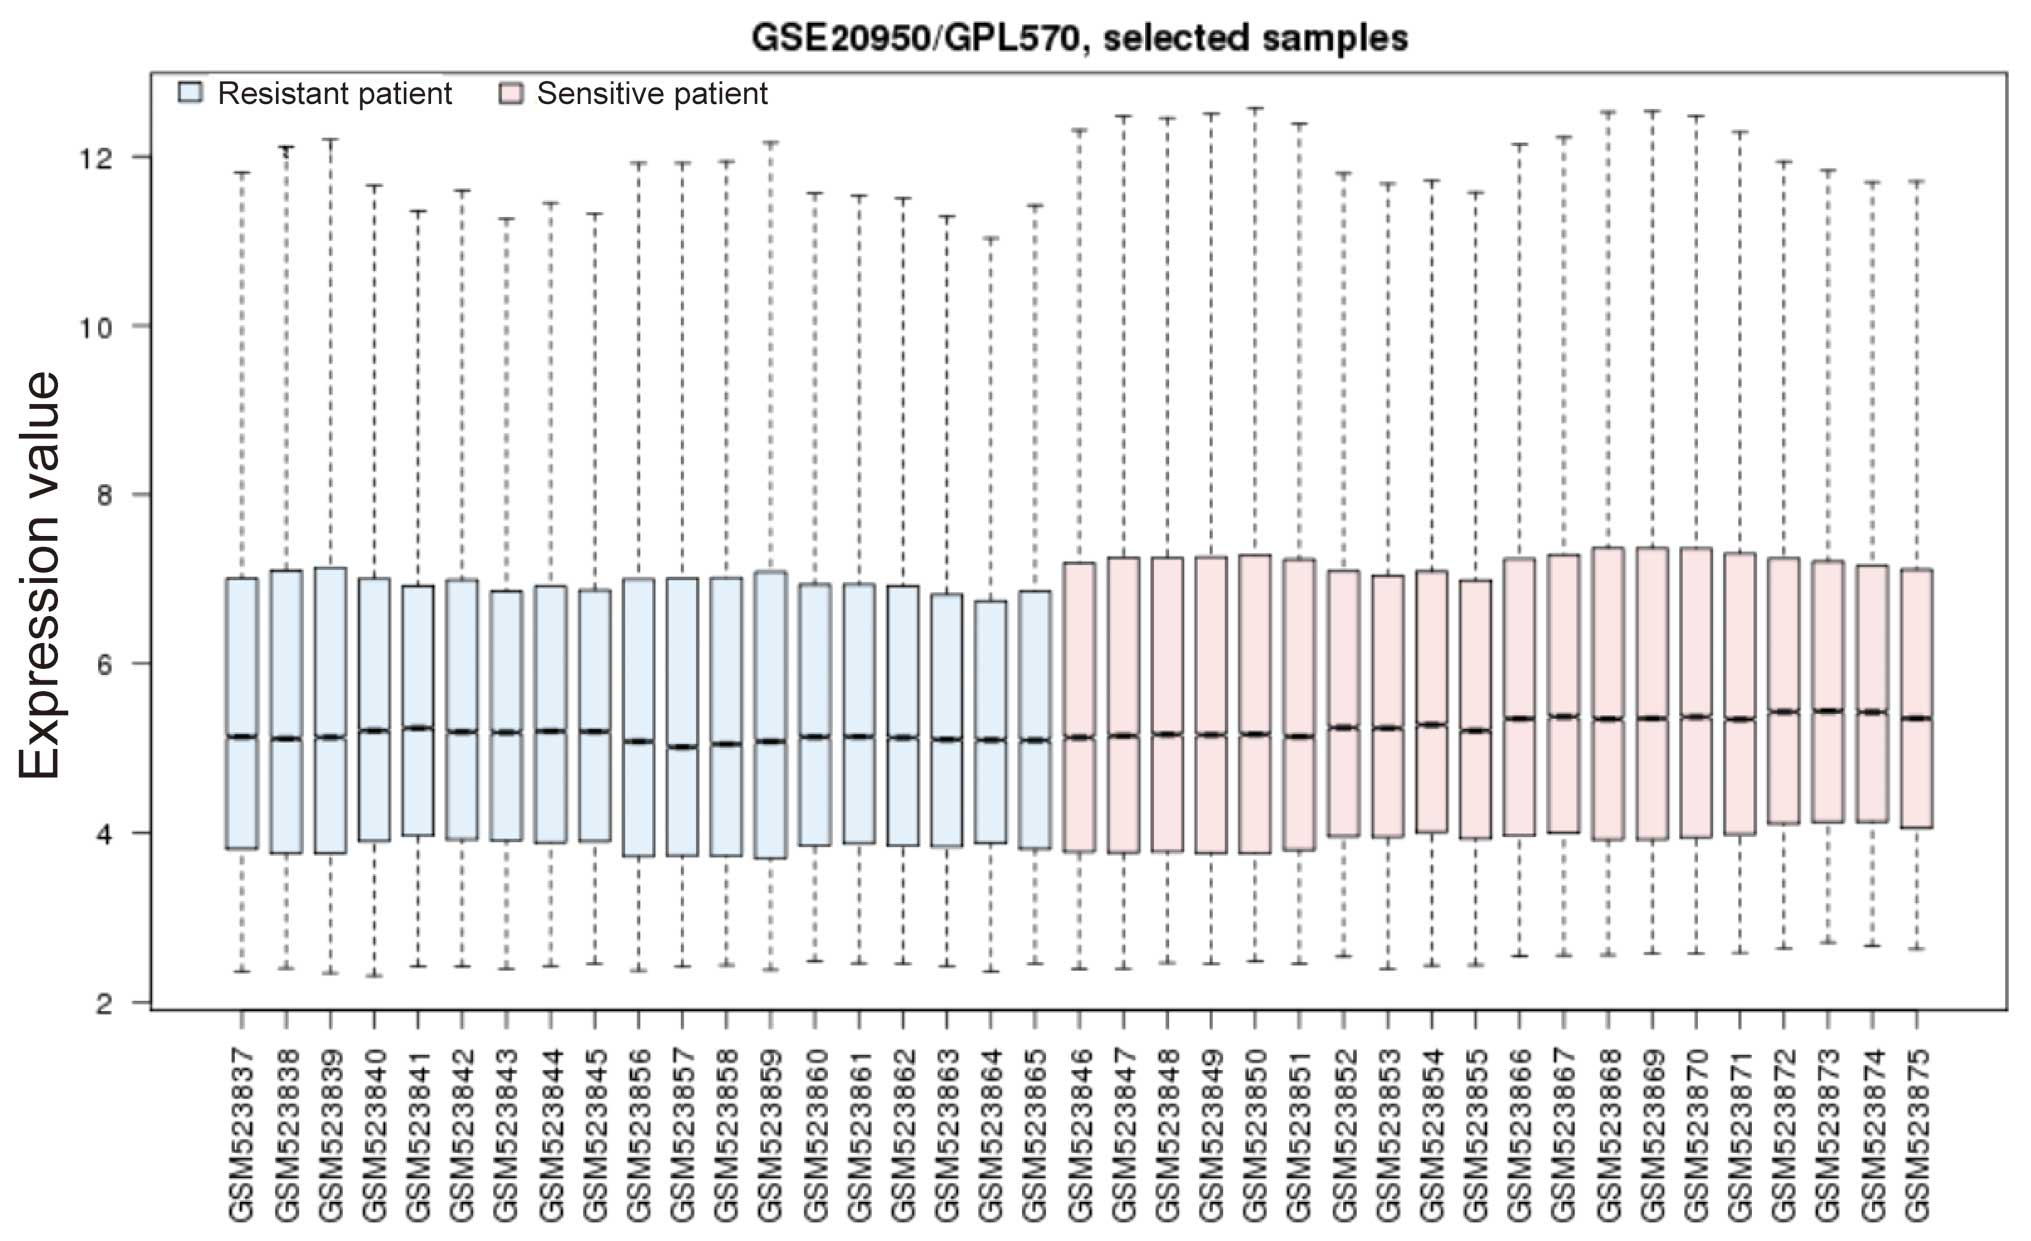
The normalized gene expression profiles are revealed
in Fig. 1. Differential analysis
was performed between the insulin-sensitive and insulin-resistant
groups. A total of 170 DEGs were identified in the
insulin-sensitive group, of which 8 were downregulated and 162 were
upregulated. This result suggested that numerous genes in the
adipose tissue obtained from insulin-resistant patients were
downregulated and thus contributed to insulin resistance.
Interaction correlation and relevant
biological functions
Interactions among DEGs were retrieved using Osprey.
In the present study, a total of 33 interactions were obtained
(Table I).
 | Table IInteractions between the DEGs. |
Table I
Interactions between the DEGs.
| Interactor 1 | Interactor 2 |
|---|
| TXN | PTEN |
| RAD23B | ZFAND5 |
| NOP16 | GART |
| ITGA2 | FLT4 |
| PIK3CB | FLT4 |
| MMP9 | PIK3CB |
| ETS1 | MMP9 |
| PTEN | PIK3CB |
| ETS1 | MCM8 |
| PTEN | YES1 |
| PTEN | IRS1 |
| IRS1 | LIPE |
| NDUFA7 | ATP5O |
| ZFYVE16 | PIK3CB |
| ITGA2 | COL8A1 |
| AZGP1 | PIP |
| HEYL | MAML1 |
| MMP9 | PTEN |
| NOP16 | POLR3E |
| FZD7 | SFRP1 |
| TGFBR2 | ZFYVE16 |
| ETS1 | PURA |
| TXN | MMP9 |
| MCM8 | PTEN |
| TXN | DLST |
| TXN | ATP5O |
| MCM8 | ANTXR2 |
| AGPAT5 | AGPAT9 |
| IRS1 | PIK3CB |
| DLST | ATP5O |
| NDUFA7 |
ENSG00000109390 |
| MCM8 | PURA |
| SMC3 | BCLAF1 |
Functional enrichment analysis was performed with
WebGestalt for all of the gene interactions and eight functional
terms were revealed (Table II).
Response to glucose stimulus was the most significant functional
term and three genes were included; neuronatin (NNAT), transforming
growth factor beta receptor II (TGFBR2) and phosphatase and tensin
homolog (PTEN).
| Table IIFunctional terms enriched in DEGs
from the interaction network. |
Table II
Functional terms enriched in DEGs
from the interaction network.
| Term | Count | P-value | Genes |
|---|
| GO:0009749~response
to glucose stimulus | 3 | 0.000444 | NNAT, TGFBR2,
PTEN |
|
GO:0006796~phosphate metabolic
process | 17 | 0.002208 | SGK2, PIK3CB, FLT4,
NDUFA7, PTPN4, PDK4, TGFBR2, WNK1, NDUFC1, PTEN, DUSP4, PDIK1L,
DUSP16, BMP2K, ATP5O, YES1, LIPE |
|
GO:0048008~platelet-derived growth factor
receptor signaling pathway | 3 | 0.008688 | ZFAND5, TIPARP,
PTEN |
| GO:0060021~palate
development | 3 | 0.023668 | TGFBR2, TIPARP,
PYGO2 |
|
GO:0046486~glycerolipid metabolic
process | 5 | 0.033067 | PIK3CB, AGPAT9,
CHPT1, PTEN, LIPE |
| GO:0051272~positive
regulation of cell motion | 4 | 0.036903 | ETS1, MMP9, ITGA2,
IRS1 |
| GO:0010033~response
to organic substance | 11 | 0.042616 | DUSP4, GATM, NNAT,
TGFBR2, ITGA2, EDEM3, IRS1, PTEN, PGGT1B, TTC3, GART |
| GO:0007167~enzyme
linked receptor protein signaling pathway | 7 | 0.042853 | ZFAND5, FLT4,
ZFYVE16, TGFBR2, TIPARP, IRS1, PTEN |
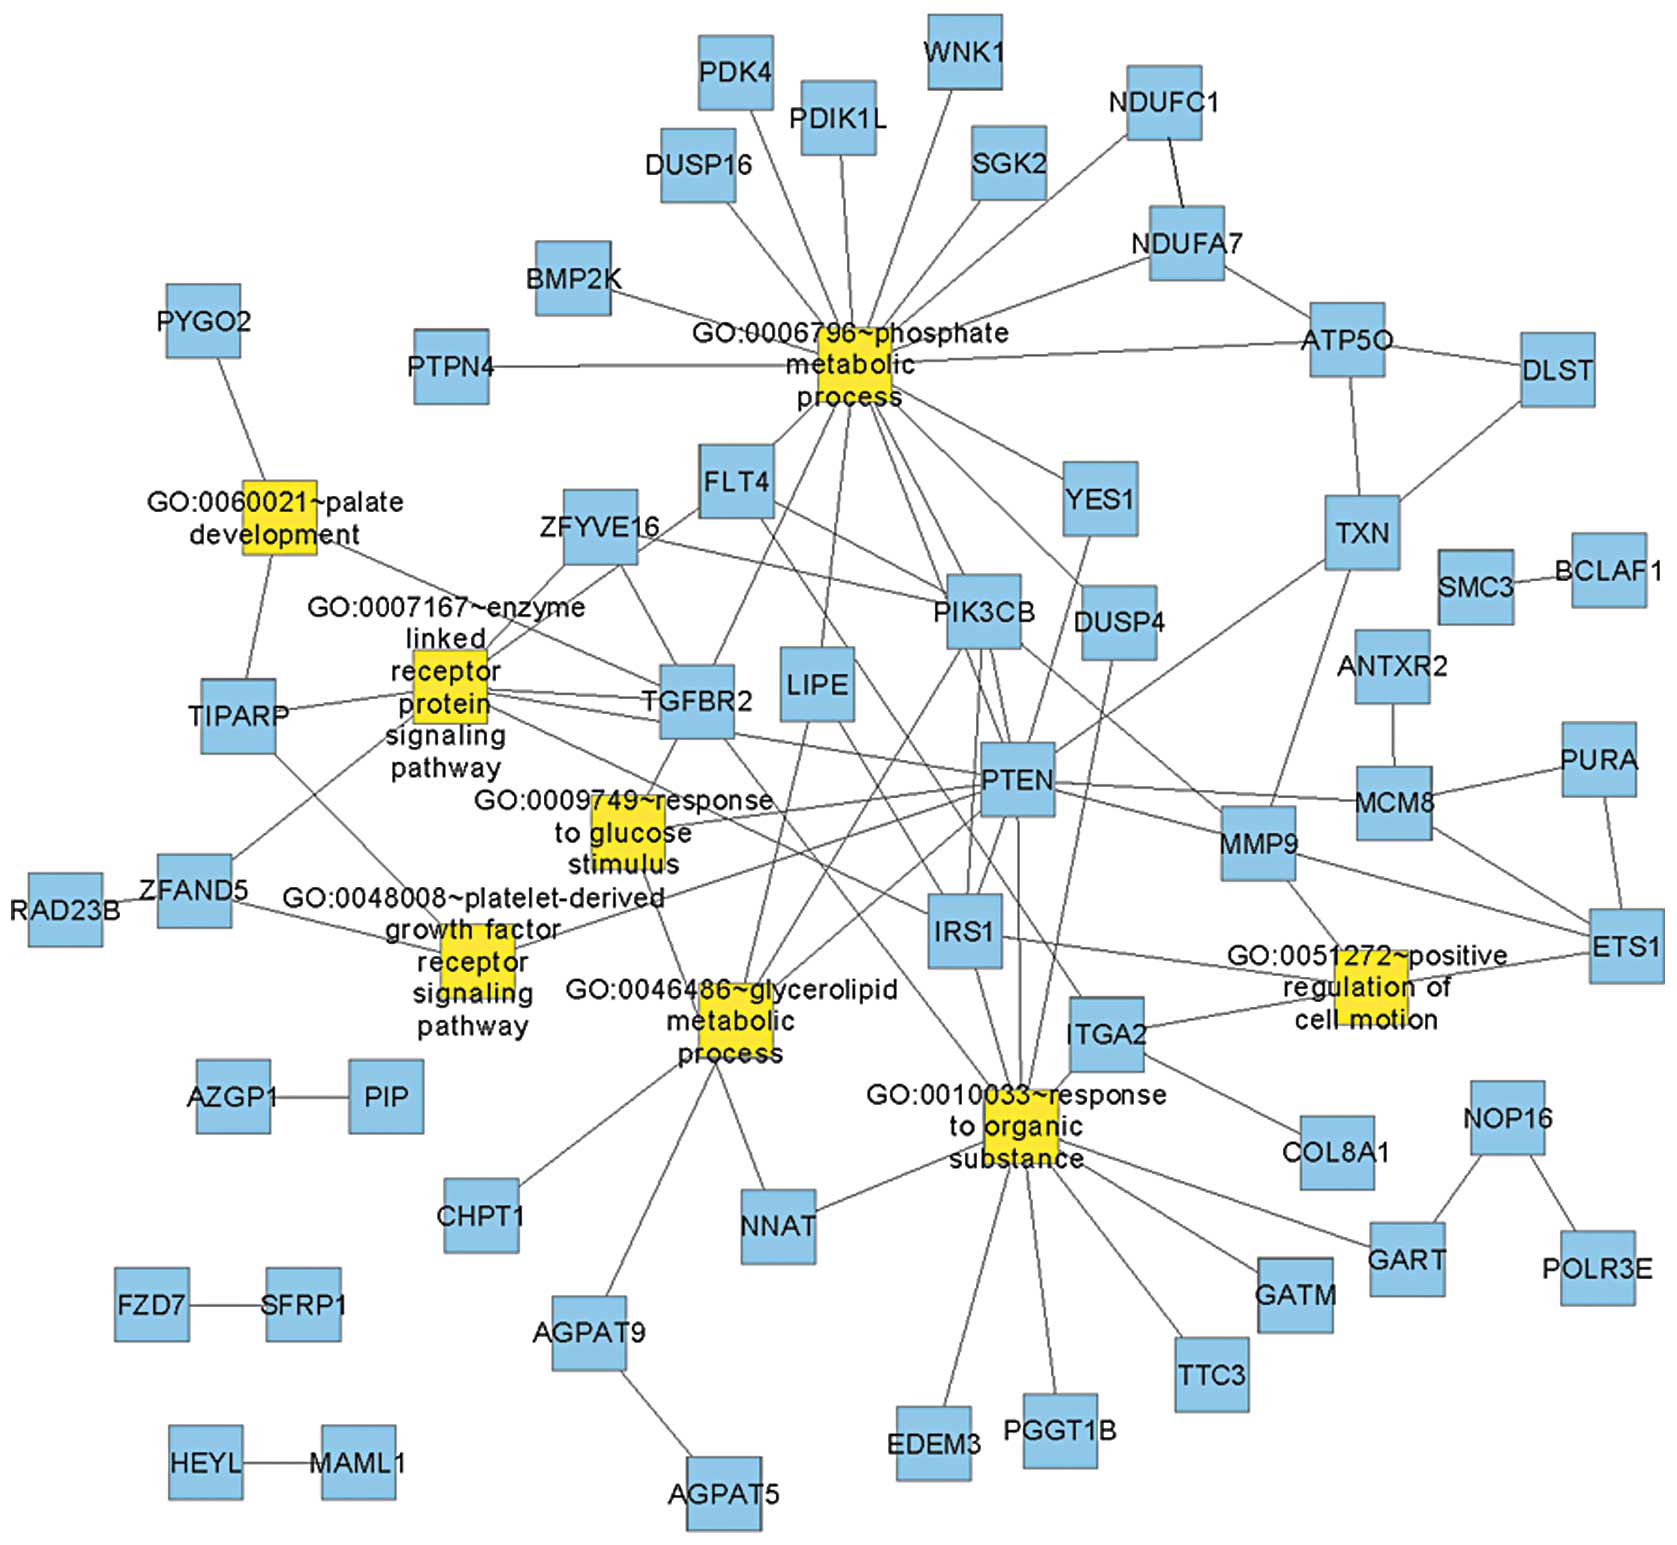
Functional interaction network and
significant pathways
The interaction network was integrated with the
functional enrichment analysis result to construct the functional
interaction network (Fig. 2).
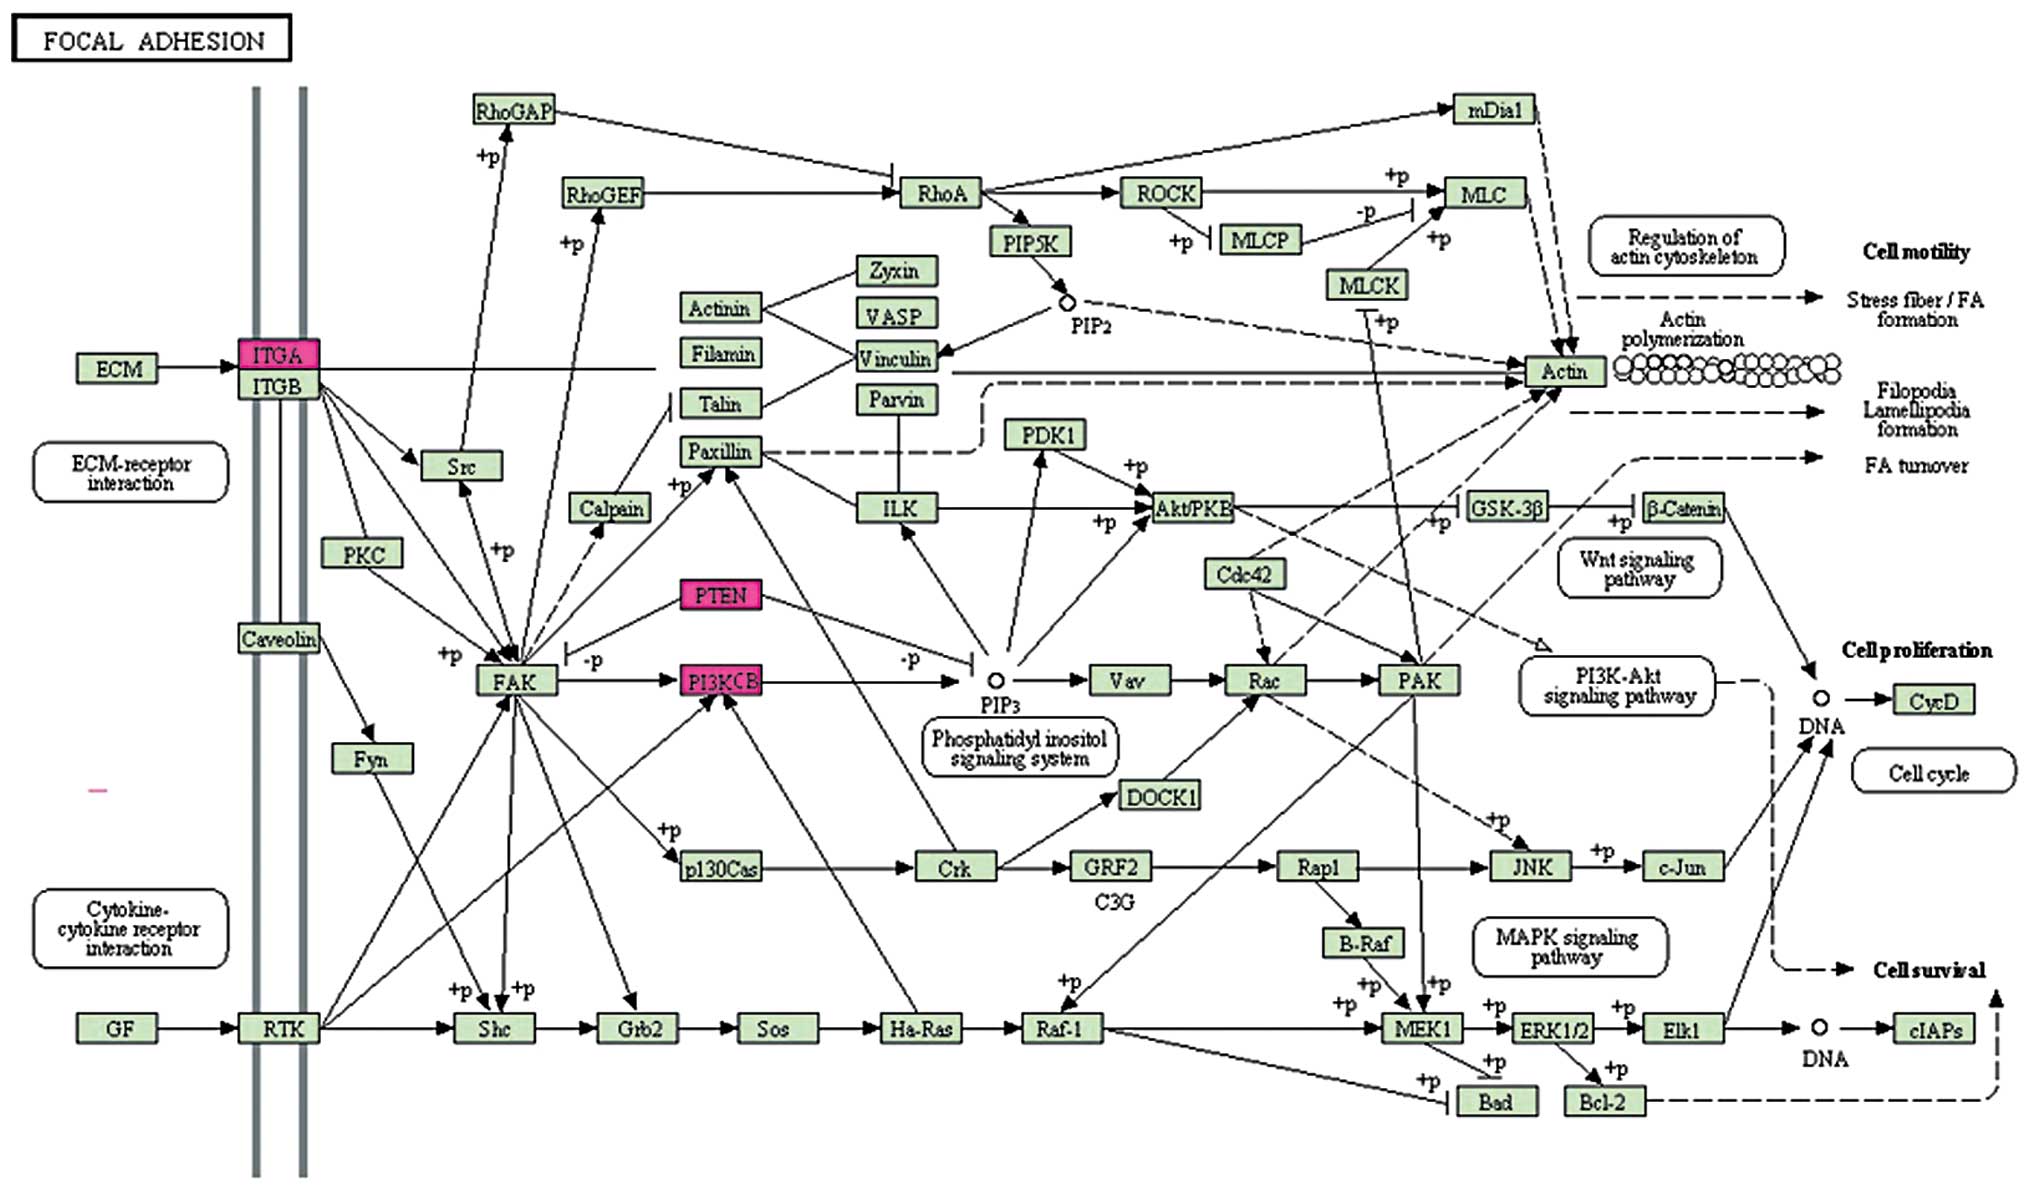
Pathway enrichment analysis revealed that focal
adhesion (hsa04510, P=0.03695) was over-represented in the genes
(Fig. 3). Three DEGs were included
in this pathway: Phosphatidylinositol-4, 5-bisphosphate 3-kinase
catalytic subunit β (PIK3CB), integrin α2 (ITGA2) and PTEN. Focal
adhesions are specific types of large macromolecular assemblies
through which mechanical force and regulatory signals are
transmitted. They serve as the mechanical linkages to the
extracellular cell matrix and as a biochemical signaling hub to
concentrate and direct numerous signaling proteins at sites of
integrin binding and clustering. As a result, focal adhesions may
lead to insulin-resistance and therefore require further
investigation.
Discussion
Adipose tissues have an important role in the
development of insulin resistance and thereby contribute to the
incidence of type 2 diabetes. However, not all obese individuals
exhibit insulin resistance. Therefore, understanding the underlying
mechanisms involved is important, as it may benefit the development
of novel therapeutic strategies for diabetes treatment. In the
present study, the transcriptome of adipose tissues obtained from
insulin-sensitive and insulin-resistant patients were compared with
the aim of identifying the key DEGs and the associated biological
functions. A total of 170 DEGs were obtained, the majority of which
were upregulated in the insulin-sensitive group. The interactions
among DEGs were retrieved and the functional enrichment analysis on
these DEGs revealed eight significant functional terms, the
majority of which were associated with metabolism and signaling
pathways. In the KEGG pathway analysis, focal adhesion was
identified to be significant.
The results revealed that response to glucose
stimulus was the most significant biological function. This was in
accordance with the role of adipose tissue in insulin resistance.
Three DEGs were included in this term: NNAT, TGFBR2 and PTEN.
TGFBR2 has previously been associated with obesity (23). It has been proposed that
upregulation of TGFBR2 induced by high extracellular glucose, may
contribute to distal tubular hypertrophy in diabetic nephropathy
(24). A study by Yang et
al (25) demonstrated that
TGF-β signaling in hepatocytes participates in steatohepatitis
through the regulation of cell death and lipid metabolism. PTEN is
a key negative regulator of insulin-stimulated glucose uptake in
vitro and in vivo (26). Lo et al (27) identified that an increase in PTEN
gene expression appears to be associated with the development of
insulin resistance. Butler et al (28) found that inhibition of PTEN
expression reversed hyperglycemia in diabetic mice. Nakashima et
al (29) reported that PTEN
negatively regulates insulin signaling in 3T3-L1 adipocytes. Tang
et al (30) further
indicated that PTEN suppresses insulin signaling through the
phosphatidylinositol 3-kinase/Akt pathway in 3T3-L1 adipocytes.
The focal adhesion pathway is closely associated
with the insulin signaling pathway. Cell adhesion and focal
adhesion kinases regulate insulin receptor substrate-1 expression
(31). Baron et al
(32) identified that p125Fak
focal adhesion kinase is a substrate for the insulin and
insulin-like growth factor-I tyrosine kinase receptors. Bisht et
al (33) reported that focal
adhesion kinase regulates insulin resistance in skeletal muscle.
Three DEGs were identified in this pathway, including PIK3CB, ITGA2
and PTEN. PIK3CB is an isoform of the catalytic subunit of
phosphoinositide 3-kinase (PI3K), which is important in the
signaling pathways involving receptors on the outer membrane of
eukaryotic cells. Le Stunff et al (34) identified a variant GATA-binding
site in the PIK3CB promoter is a Cis-acting expression
quantitative trait locus for this gene and attenuates insulin
resistance in obese children, confirming the involvement of this
gene in insulin resistance. In another study by Clément et
al (35) it was suggested that
the cis-regulatory rs361072 promoter variant of PIK3CB is
associated with insulin resistance.
In conclusion, the present study described the
molecular signatures of adipose tissues obtained from
insulin-resistant and insulin-sensitive obese patients. Through
comparative analysis, a number of DEGs and relevant biological
functions were revealed. These findings provided a theoretical
basis and direction for novel strategies for the therapeutic
management of diabetes.
References
|
1
|
Kalupahana NS, Moustaid-Moussa N and
Claycombe KJ: Immunity as a link between obesity and insulin
resistance. Mol Aspects Med. 33:26–34. 2012. View Article : Google Scholar
|
|
2
|
Liang CP, Han S, Senokuchi T and Tall AR:
The macrophage at the crossroads of insulin resistance and
atherosclerosis. Circ Res. 100:1546–1555. 2007. View Article : Google Scholar : PubMed/NCBI
|
|
3
|
Reaven G: All obese individuals are not
created equal: insulin resistance is the major determinant of
cardiovascular disease in overweight/obese individuals. Diabetes
Vasc Dis Res. 2:105–112. 2005. View Article : Google Scholar
|
|
4
|
Fukui Y and Motojima K: Expression of
resistin in the adipose tissue is modulated by various factors
including peroxisome proliferator-activated receptor alpha.
Diabetes Obes Metab. 4:342–345. 2002. View Article : Google Scholar : PubMed/NCBI
|
|
5
|
Guilherme A, Virbasius JV, Puri V and
Czech MP: Adipocyte dysfunctions linking obesity to insulin
resistance and type 2 diabetes. Nat Rev Mol Cell Biol. 9:367–377.
2008. View
Article : Google Scholar : PubMed/NCBI
|
|
6
|
Xu H, Barnes GT, Yang Q, et al: Chronic
inflammation in fat plays a crucial role in the development of
obesity-related insulin resistance. J Clin Invest. 112:1821–1830.
2003. View Article : Google Scholar : PubMed/NCBI
|
|
7
|
Dandona P, Aljada A and Bandyopadhyay A:
Inflammation: the link between insulin resistance, obesity and
diabetes. Trends Immunol. 25:4–7. 2004. View Article : Google Scholar
|
|
8
|
Shoelson SE, Herrero L and Naaz A:
Obesity, inflammation, and insulin resistance. Gastroenterology.
132:2169–2180. 2007. View Article : Google Scholar : PubMed/NCBI
|
|
9
|
Weisberg SP, Mccann D, Desai M, et al:
Obesity is associated with macrophage accumulation in adipose
tissue. J Clin Invest. 112:1796–1808. 2003. View Article : Google Scholar : PubMed/NCBI
|
|
10
|
Greenberg A and Mcdaniel M: Identifying
the links between obesity, insulin resistance and beta-cell
function: potential role of adipocyte-derived cytokines in the
pathogenesis of type 2 diabetes. Eur J Clin Invest. 32(Suppl 3):
24–34. 2002. View Article : Google Scholar : PubMed/NCBI
|
|
11
|
Hirosumi J, Tuncman G, Chang L, et al: A
central role for JNK in obesity and insulin resistance. Nature.
420:333–336. 2002. View Article : Google Scholar : PubMed/NCBI
|
|
12
|
Hardy OT, Perugini RA, Nicoloro SM, et al:
Body mass index-independent inflammation in omental adipose tissue
associated with insulin resistance in morbid obesity. Surg Obes
Relat Dis. 7:60–67. 2011. View Article : Google Scholar
|
|
13
|
Troyanskaya O, Cantor M, Sherlock G, et
al: Missing value estimation methods for DNA microarrays.
Bioinformatics. 17:520–525. 2001. View Article : Google Scholar : PubMed/NCBI
|
|
14
|
Fujita A, Sato J, Rodrigues L, Ferreira C
and Sogayar M: Evaluating different methods of microarray data
normalization. BMC Bioinformatics. 7:4692006. View Article : Google Scholar : PubMed/NCBI
|
|
15
|
Smyth GK: Limma: linear models for
microarray data. Bioinformatics and Computational Biology Solutions
using R and Bioconductor. Gentleman R, Carey V, Dudoit S, Irizarry
R and Huber W: Springer; New York: pp. 397–420. 2005, View Article : Google Scholar
|
|
16
|
Dudoit S, Shaffer JP and Boldrick JC:
Multiple hypothesis testing in microarray experiments. Stat Sci.
18:71–103. 2003. View Article : Google Scholar
|
|
17
|
Breitkreutz BJ, Stark C and Tyers M:
Osprey: a network visualization system. Genome Biol. 4:R222003.
View Article : Google Scholar : PubMed/NCBI
|
|
18
|
Willis RC and Hogue CW: Searching,
viewing, and visualizing data in the Biomolecular Interaction
Network Database (BIND). Curr Protoc Bioinformatics. 8:8.92006.
|
|
19
|
Breitkreutz B-J, Stark C and Tyers M: The
GRID: the general repository for interaction datasets. Genome Biol.
4:R232003. View Article : Google Scholar : PubMed/NCBI
|
|
20
|
Zhang B, Kirov S and Snoddy J: WebGestalt:
an integrated system for exploring gene sets in various biological
contexts. Nucleic Acids Res. 33:W741–W748. 2005. View Article : Google Scholar : PubMed/NCBI
|
|
21
|
Duncan D, Prodduturi N and Zhang B:
WebGestalt2: an updated and expanded version of the Web-based Gene
Set Analysis Toolkit. BMC Bioinformatics. 11(Suppl 4): P102010.
View Article : Google Scholar
|
|
22
|
Kanehisa M, Goto S, Sato Y, et al: KEGG
for integration and interpretation of large-scale molecular data
sets. Nucleic Acids Res. 40:D109–D114. 2012. View Article : Google Scholar :
|
|
23
|
Shoelson SE and Goldfine AB: Getting away
from glucose: fanning the flames of obesity-induced inflammation.
Nat Med. 15:373–374. 2009. View Article : Google Scholar : PubMed/NCBI
|
|
24
|
Yang YL, Guh JY, Yang ML, et al:
Interaction between high glucose and TGF-beta in cell cycle protein
regulations in MDCK cells. J Am Soc Nephrol. 9:182–193.
1998.PubMed/NCBI
|
|
25
|
Yang L, Roh YS, Song J, et al:
Transforming growth factor beta signaling in hepatocytes
participates in steatohepatitis through regulation of cell death
and lipid metabolism. Hepatology. 59:483–495. 2013. View Article : Google Scholar
|
|
26
|
Wong J, Kim P, Peacock J, et al: Pten
(phosphatase and tensin homologue gene) haploinsufficiency promotes
insulin hypersensitivity. Diabetologia. 50:395–403. 2007.
View Article : Google Scholar :
|
|
27
|
Lo YT, Tsao CJ, Liu IM, Liou SS and Cheng
JT: Increase of PTEN gene expression in insulin resistance. Horm
Metab Res. 36:662–666. 2004. View Article : Google Scholar : PubMed/NCBI
|
|
28
|
Butler M, Mckay RA, Popoff IJ, et al:
Specific inhibition of PTEN expression reverses hyperglycemia in
diabetic mice. Diabetes. 51:1028–1034. 2002. View Article : Google Scholar : PubMed/NCBI
|
|
29
|
Nakashima N, Sharma PM, Imamura T,
Bookstein R and Olefsky JM: The tumor suppressor PTEN negatively
regulates insulin signaling in 3T3-L1 adipocytes. J Biol Chem.
275:12889–12895. 2000. View Article : Google Scholar : PubMed/NCBI
|
|
30
|
Tang X, Powelka AM, Soriano NA, Czech MP
and Guilherme A: PTEN, but not SHIP2, suppresses insulin signaling
through the phosphatidylinositol 3-kinase/Akt pathway in 3T3-L1
adipocytes. J Biol Chem. 280:22523–22529. 2005. View Article : Google Scholar : PubMed/NCBI
|
|
31
|
Lebrun P, Baron V, Hauck CR, Schlaepfer DD
and Van Obberghen E: Cell adhesion and focal adhesion kinase
regulate insulin receptor substrate-1 expression. J Biol Chem.
275:38371–38377. 2000. View Article : Google Scholar : PubMed/NCBI
|
|
32
|
Baron V, Calléja V, Ferrari P, et al:
p125Fak focal adhesion kinase is a substrate for the insulin and
insulin-like growth factor-I tyrosine kinase receptors. J Biol
Chem. 273:7162–7168. 1998. View Article : Google Scholar : PubMed/NCBI
|
|
33
|
Bisht B, Goel H and Dey C: Focal adhesion
kinase regulates insulin resistance in skeletal muscle.
Diabetologia. 50:1058–1069. 2007. View Article : Google Scholar : PubMed/NCBI
|
|
34
|
Le Stunff C, Dechartres A, Mariot V, et
al: Association analysis indicates that a variant GATA-binding site
in the PIK3CB promoter is a Cis-acting expression quantitative
trait locus for this gene and attenuates insulin resistance in
obese children. Diabetes. 57:494–502. 2008. View Article : Google Scholar
|
|
35
|
Clément K, Stunff CL, Meirhaeghe A, et al:
In obese and non-obese adults, the cis-regulatory rs361072 promoter
variant of PIK3CB is associated with insulin resistance not with
type 2 diabetes. Mol Genet Metab. 96:129–132. 2009. View Article : Google Scholar
|