Introduction
Lung cancer is the most common cause of
cancer-related mortality worldwide. More than 90 million
individuals globally are at risk of developing lung cancer, and the
disease is suspected to remain a major health problem for many
years. The 5-year survival rate is ~10% (1). More than 75% of lung cancer cases are
diagnosed at late stages, as no practical method of screening the
large number of people at risk is available. The late-stage
diagnosis is the major contributing factor to the poor prognosis of
non-small-cell lung cancer (NSCLC), which accounts for 85% of all
types of lung cancer (2).
To date, cancer genomic studies have focused on the
protein-coding genome. However, it is increasingly evident that the
non-protein-coding genome also plays a significant role in
tumorigenesis (3). The most widely
studied class of non-coding RNAs are microRNAs (miRNAs), which are
small non-coding RNAs of approximately 22 nucleotides that mediate
post-transcriptional gene silencing by controlling the
translocation of mRNA into protein. miRNAs are estimated to
regulate the translation of more than 60% of protein-coding genes.
Since each miRNA species is capable of regulating multiple genes,
miRNAs are attractive markers for studies of coordinated gene
expression. In human cancer, the miRNA expression profile differs
between normal tissue and tumor tissue, and miRNAs act as oncogenes
or tumor suppressor genes and have key functions in tumorigenesis
(3). Previous studies have
reported differentially regulated miRNAs in diverse solid tumors,
including breast (4), lung
(5), prostate (6), colon (7) and ovarian (8) cancer.
In solid tumors, miRNAs are deregulated, suggesting
their involvement in crucial cellular pathways including cell-cell
adhesion and signaling, cell cycle regulation and apoptosis, which
play a significant role in the pathogenesis of cancer.
The majority of these studies were performed using
microarrays; however, next-generation sequencing (NGS) of small
RNAs provides an efficient platform for the investigation of the
ubiquitous and differentially expressed behavior of miRNAs
(9). Sequencing has the advantage
that all RNAs in a sample, not only those on the chip, may be
detected; thus, novel miRNAs that were not reported previously may
be identified. Furthermore, we aimed to investigate miRNA
regulatory molecules by obtaining information on differentially
expressed miRNA-mRNA pairs.
In the present study, we adopted the massively
parallel sequencing approach to profile miRNA and provide crucial
information with regard to the role of miRNAs in regulating
tumorigenesis in NSCLC.
Materials and methods
Study subjects
The present study used tissue specimens obtained
from the Bio-Resource Center of Asan Medical Center (Seoul, Korea)
that were donated by nine patients who underwent surgery for NSCLC
between March 2008 and March 2011. All of the paired NSCLC and
adjacent normal tissue specimens used in the current study were
acquired from surgical specimens. Cancer and normal tissue
specimens were grossly dissected and preserved in liquid nitrogen
immediately after surgery. Appropriate informed consent was
obtained from the participants, and the Institutional Review Board
of the Asan Medical Center (Seoul, Korea) approved the study (IRB
no. AMC IRB 2011-0711).
mRNA expression
Raw data were extracted as fragments per kilobase of
exon per million fragments mapped (FPKM) values for each gene from
each sample using TopHat and Cufflinks software (10). Data with zeroed FPKM values across
all samples and samples with zero values across more than 50% of
the genes were excluded. We added 1 to the FPKM value to facilitate
log10 transformation. Filtered data were logarithm transformed and
normalized using the quantile method.
Statistical significance of the expression data was
determined using fold changes and Student’s t-test or the paired
t-test, in which the null hypothesis was that no difference exists
between two groups. The false discovery rate (FDR) was controlled
by adjusting the P-value using the Benjamini-Hochberg algorithm.
Hierarchical clustering was performed using complete linkage and
Euclidean distance as a measure of similarity. All data analyses
and visualization of differentially expressed genes were conducted
using R 2.15.1 (www.r-project.org).
Biological functional annotation analysis of the
differentially expressed gene (DEG) list was performed using the
DAVID tool (http://david.abcc.ncifcrf.gov/). In the DAVID
annotation system, the modified Fisher’s exact P-value (EASE score)
was adopted to evaluate gene enrichment in annotation terms.
Additionally, a gene set enrichment analysis was
conducted for quality control-filtered expression data using GSEA-P
(http://www.broadinstitute.org/gsea/index.jsp), which
combines information from previously defined sets of genes
(MSigDB). Filtered genes were ranked according to the difference in
the log10 expression signal between the case and control using the
‘Diff_of_Classes’ metric option. The extent of association was
measured using a nonparametric, running-sum statistic termed the
enrichment score (ES), and the maximum ES (MES) over all gene sets
in the actual data set was rescored from the cases. The
significance of the MES score was calculated as the fraction of the
1,000 random permutations for phenotypes. From the analysis, a
normalized ES (NES), nominal P-value, FDR q-value adjusting for a
gene set size, and correlations between gene sets and actual data
were obtained.
miRNA expression
Raw data (the reads for each miRNA) were normalized
to the total reads of each individual sample as the standardized to
reads per million (RPM; miRNA counts / total count of each sample ×
1 million). We excluded miRNAs with zero values across >90% of
the samples and samples with zero values across >80% of the
miRNAs. We added 1 to the RPM value to facilitate log10
transformation. The remaining data processing was as for mRNA
analysis.
Integrative (mRNA-miRNA) analysis
We performed mRNA-miRNA data integration for matched
samples in each data set.
First, genes and miRNAs whose expression differed
significantly (absolute fold change ≥1.5 and P<0.05) in each
data set were identified. Next, putative mRNA-miRNA target pairs
that showed a regulatory association were extracted using mirBase
Targets from the Wellcome Trust Sanger Institute (http://microrna.sanger.ac.uk/targets/v5). This
approach assumes that the expression of a given miRNA is negatively
correlated with the expression of its mRNA targets. We identified
negative correlations between any putative miRNA-mRNA pair. For
miRNAs with a negative correlation with mRNA, the hypergeometric
test was performed to evaluate statistical significance at
P<0.05.
Gene ontology (GO) analysis
GO term enrichment analysis for the 696 candidate
genes whose regulatory miRNAs were identified was performed using
the ClueGo application (ver. 2.0.6) (11) in Cytoscape (ver. 3.0.0) (12). Default parameters were used, and
only GO terms with P<0.01 were selected.
Identification of negatively correlated
miRNA-mRNA target pairs associated with the cell cycle
The CluePedia application (ver. 1.0.7) (13) based on the miRBase software
(miRanda-miRNAs-v5-2012-07-19) (14) in Cytoscape was used to investigate
the interaction between miRNAs and cell-cycle-related genes
identified in the GO enrichment analysis. Among the
cell-cycle-related genes, the 100 mRNAs with the highest number of
miRNA targets were selected, and negative correlations between the
miRNAs and their target mRNAs were investigated.
Results
Baseline characteristics
Nine patients with completely resected NSCLC were
included in our study. All of the patients were male, and the
median age was 59 years (range, 45–68 years). The histology
consisted of five squamous cell carcinomas (55.6%) and four
adenocarcinomas (42.5%). The characteristics of the patients are
summarized in Table I.
 | Table IClinical characteristics of NSCLC
patients. |
Table I
Clinical characteristics of NSCLC
patients.
| Clinical
characteristics | NSCLC patients
(n=9) |
|---|
| Age, years (mean ±
SD) | 59 (45–68) |
| Male, n (%) | 9 (100) |
| Smoking (mean ±
SD) | 33±15.6 |
| Histological cell
type, n (%) |
| Squamous cell
carcinoma | 5 (55.6) |
| Adenocarcinoma | 4 (44.4) |
| TNM stage, n (%) |
| I | 4 (44.4) |
| II | 5 (55.6) |
| III | 0 (0) |
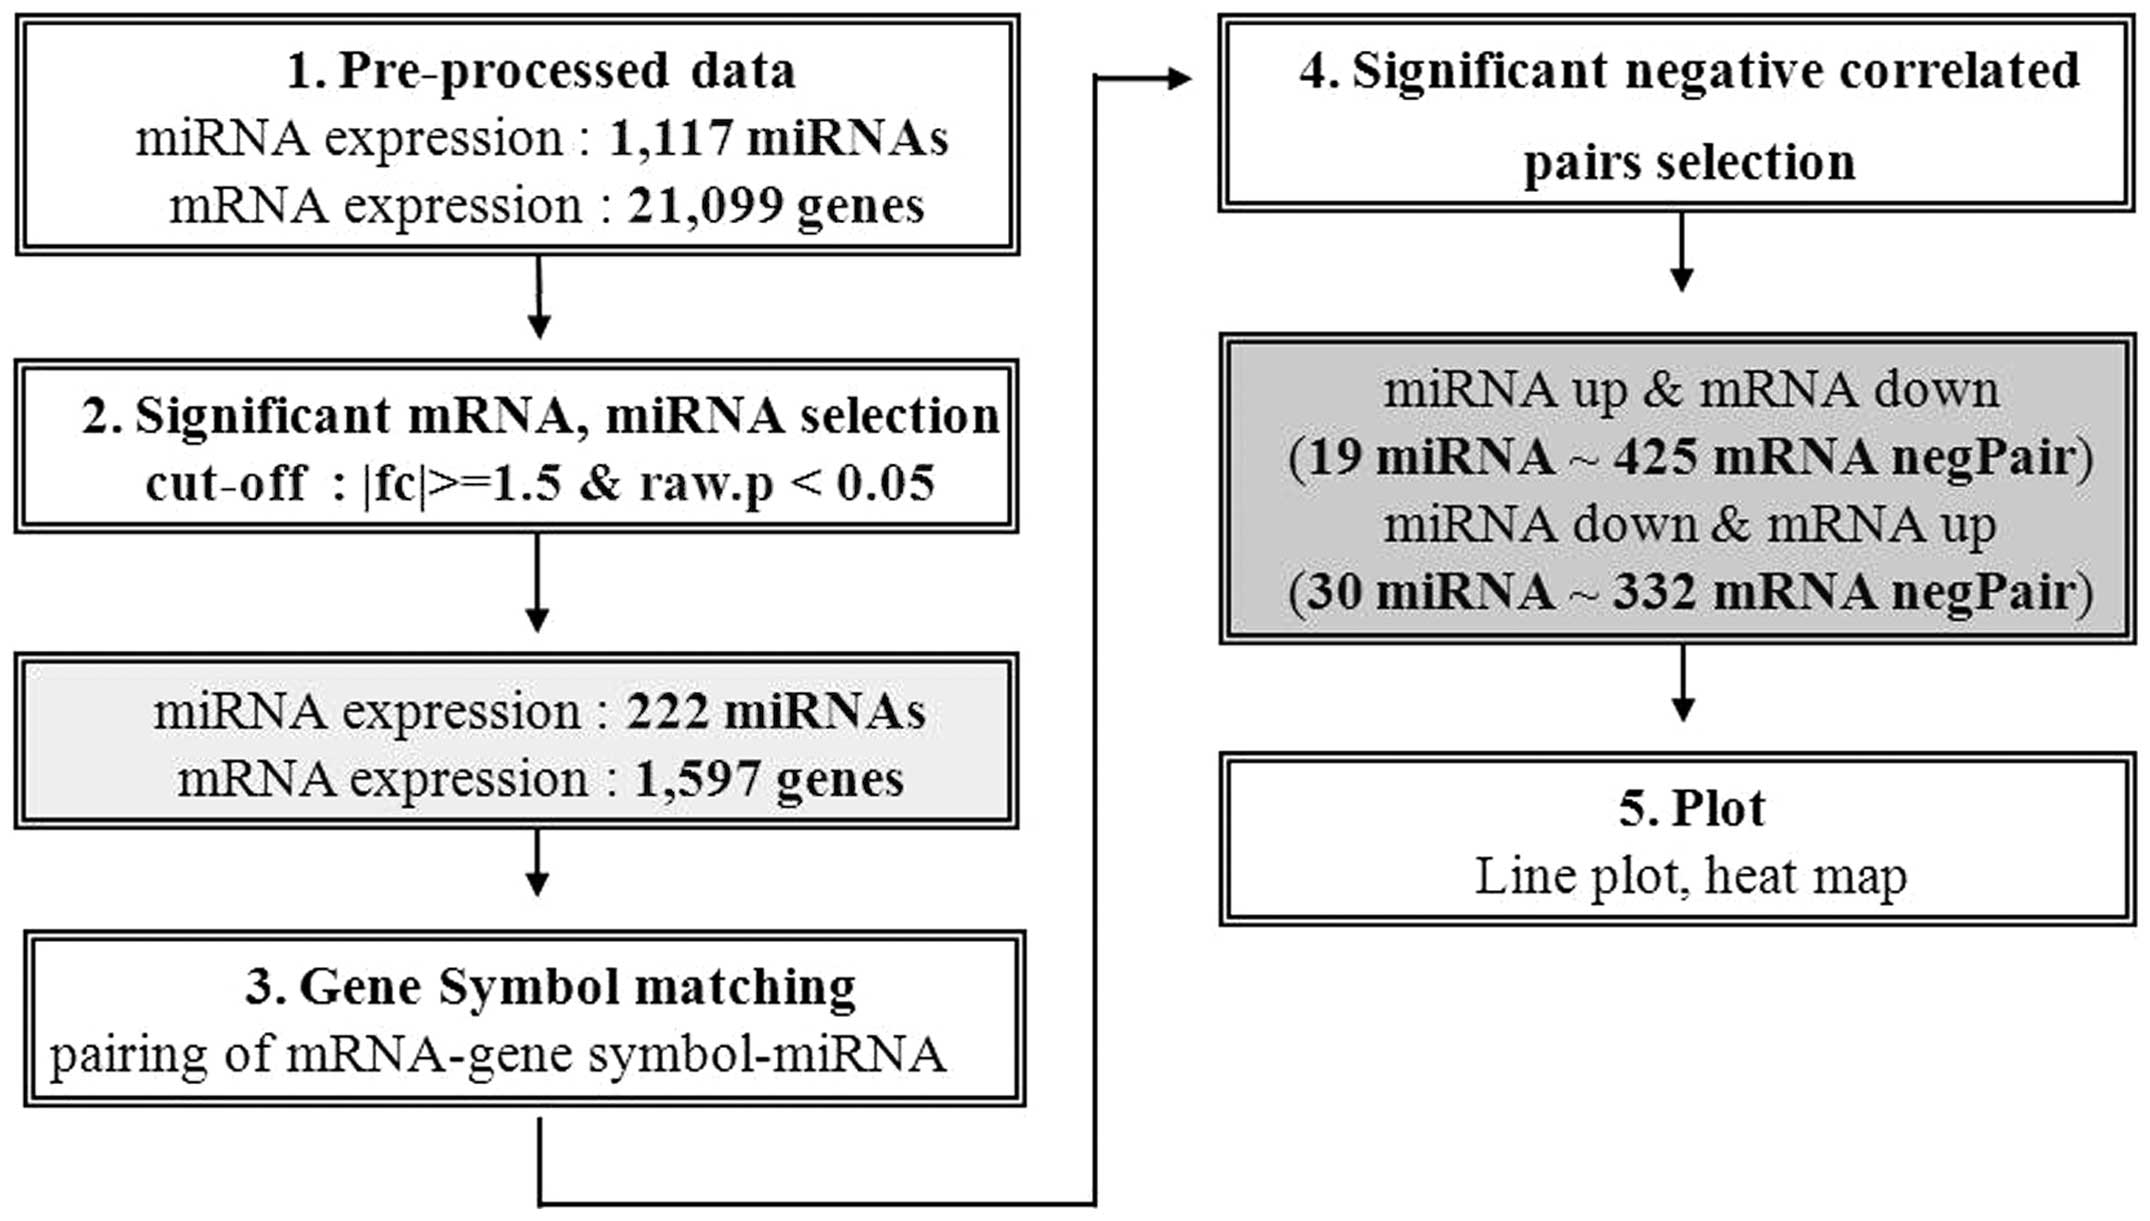
Expressed miRNAs and mRNA profiling
Overall, 1,117 miRNAs and 21,099 genes were
differentially expressed in NSCLC and non-cancerous lung tissue. Of
these, the differences in the expression levels of 222 miRNAs and
1,597 genes were statistically significant, as indicated by an
absolute fold change ≥1.5 and P<0.05. miR-205-5p and miR-196a-5p
were generally upregulated, and miR-133a and miR-139-5p were
generally downregulated. The miRNAs with the greatest degrees of
upregulation or downregulation in cancer tissue are listed in
Table II.
| Table IITop seven up- or downregulated
microRNAs in non-small-cell lung cancer. |
Table II
Top seven up- or downregulated
microRNAs in non-small-cell lung cancer.
| miRNA | Fold change (lung
cancer/normal tissue) | P-value |
|---|
| Upregulated |
| hsa-miR-205-5p | 18.8595 | 0.0306 |
| hsa-miR-196a-5p | 11.0968 | 0.0102 |
| hsa-miR-1246 | 9.2112 | 0.0111 |
| hsa-miR-577 | 8.4114 | 0.0006 |
| hsa-miR-301b | 7.6426 | 0.0004 |
| hsa-miR-182-5p | 7.4388 | 0.0015 |
| hsa-miR-196b-5p | 7.2126 | 0.0280 |
| Downregulated |
| hsa-miR-133a | −7.8252 | 0.0004 |
| hsa-miR-139-5p | −7.1165 | 0.0002 |
| hsa-miR-144-5p | −6.5923 | 1.41E-06 |
| hsa-miR-338-3p | −6.5742 | 0.0002 |
| hsa-miR-1 | −6.1193 | 0.0002 |
| hsa-miR-490-3p | −6.1072 | 0.0001 |
| hsa-miR-30a-3p | −5.5812 | 0.0001 |
miRNA-mRNA integrative genomic
analysis
We searched for negative correlations between
putative miRNA and mRNA pairs; 49 putative negative regulatory
miRNA-mRNA pairs were identified. Of these, 19 miRNAs were
upregulated and 425 mRNAs were downregulated. Conversely, 30 miRNAs
were downregulated and 332 mRNAs were upregulated. Fig. 1 shows the data analysis process.
Table III shows miRNAs that have
negatively correlated target mRNA. Table IV shows differentially expressed
miRNAs in NSCLC and their predicted target genes.
| Table IIImiRNAs with their putative target
genes. |
Table III
miRNAs with their putative target
genes.
| miRNA | miRNA fold change
(lung cancer/normal tissue) | miRNA P-value | P-value
(hypergeometric test) |
|---|
| hsa-miR-577 | 8.411 | 0.0006 | 0.0461 |
| hsa-miR-301b | 7.643 | 0.0004 | 0.0360 |
| hsa-miR-944 | 5.765 | 0.0422 | 0.0416 |
| hsa-miR-891a | 5.683 | 0.0229 | 0.0020 |
| hsa-miR-615-3p | 5.211 | 0.0064 | 0.0299 |
| hsa-miR-671-5p | 2.606 | 0.0119 | 3.83E-06 |
| hsa-miR-429 | 2.599 | 0.0429 | 0.0007 |
| hsa-miR-210 | 2.246 | 0.0334 | 9.27E-06 |
| hsa-miR-137 | 2.002 | 0.0412 | 0.0143 |
| hsa-let-7c | −2.044 | 0.0105 | 0.0046 |
| hsa-miR-338-3p | −6.574 | 0.0002 | 0.0442 |
| Table IVDifferentially expressed miRNAs in
non-small-cell lung cancer and their predicted target genes. |
Table IV
Differentially expressed miRNAs in
non-small-cell lung cancer and their predicted target genes.
| miRNA | miRNA fold
change | Target gene | Gene fold
change |
|---|
| miR-577 | 8.411 | GNG11 | −5.143 |
| | EFEMP1 | −4.578 |
| | SCEL | −3.625 |
| | GKN2 | −3.47 |
| | ATG16L2 | −2.723 |
| miR-301b | 7.643 | HOXA5 | −4.096 |
| | SPARCL1 | −4.028 |
| | HYAL1 | −3.869 |
| | SERPING1 | −3.825 |
| | ALOX5 | −3.33 |
| miR-944 | 5.765 | SYT15 | −3.305 |
| | SVEP1 | −2.314 |
| | OMD | −2.645 |
| | GATA6 | −2.089 |
| | CYB5A | −2.552 |
| miR-891a | 5.683 | IL1R1 | −5.836 |
| | CLIC5 | −5.621 |
| | SLC27A3 | −4.292 |
| | HOXA5 | −4.096 |
| | ITIH5 | −3.498 |
| miR-615-3p | 5.211 | SFTPC | −43.343 |
| | PTGDS | −7.008 |
| | C10orf116 | −6.789 |
| | ABI3BP | −6.529 |
| | TAGLN | −4.285 |
| miR-338-3p | −6.574 | HIST2H4B | 2.862 |
| | CEACAM1 | 2.705 |
| | SF3B4 | 2.652 |
| | ZNF238 | 2.477 |
| | MCM4 | 2.399 |
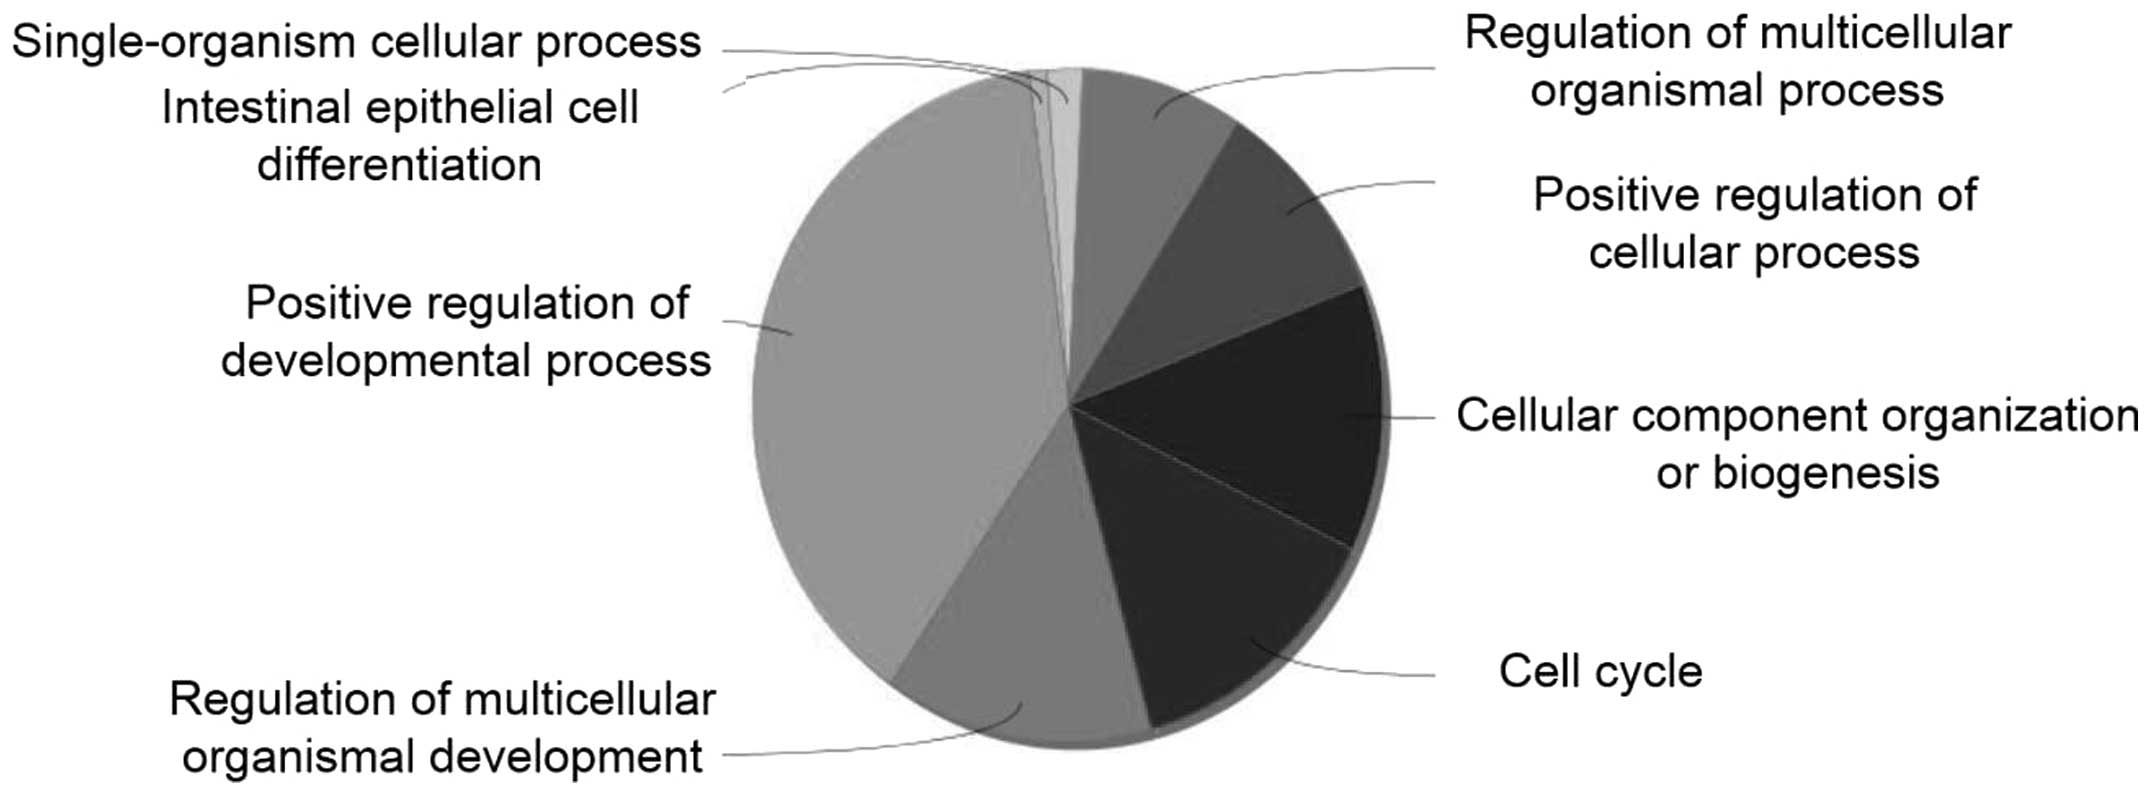
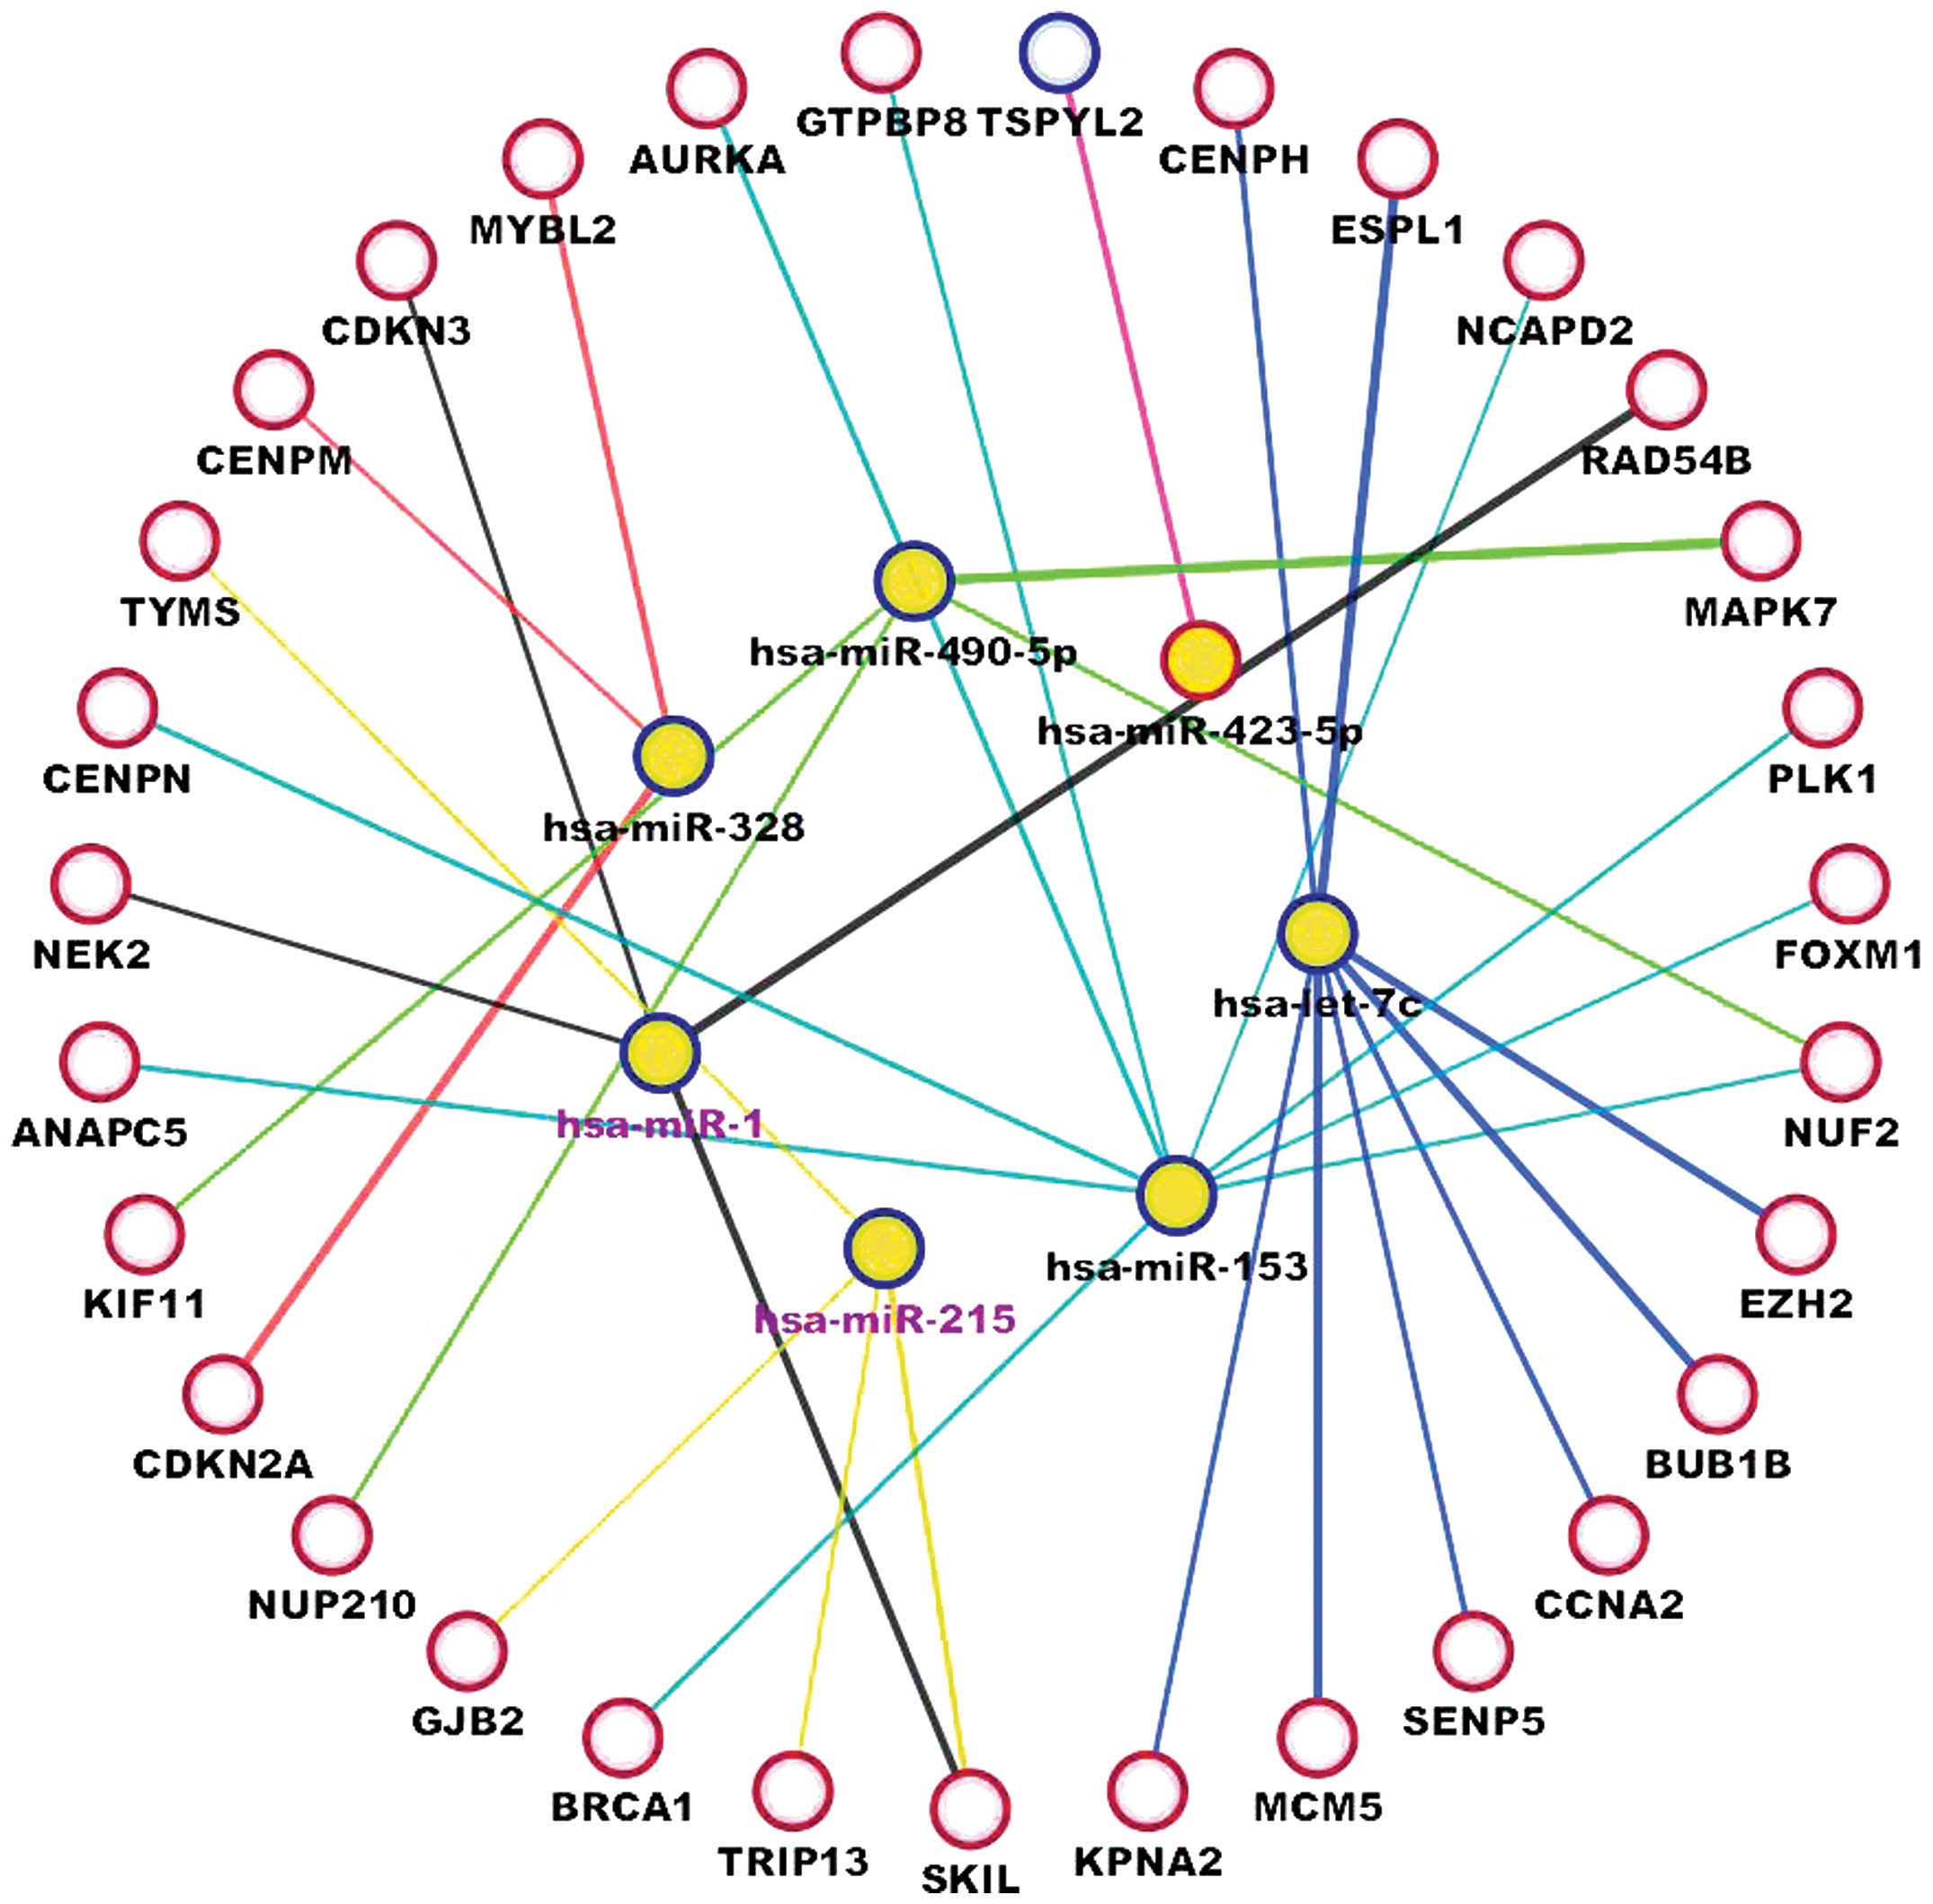
Physical interaction analysis
Fig. 2 shows the
enrichment analysis for 696 DEGs using the ClueGO application in
Cytoscape. The most relevant GO terms were positive regulation of a
developmental process, regulation of multicellular organismal
development and cell cycle regulation. Of these, deregulation of
the cell cycle underlies the uncontrolled cell proliferation that
characterizes the malignant phenotype. We analyzed the interaction
between miRNAs and cell-cycle-related genes. Seven miRNAs were
identified to have significant negative correlations with their
target mRNAs (Fig. 3), as follows:
Five miRNAs from the confirmed negative correlations between
differentially expressed miRNA-mRNA targets (hsa-miR-490-5p,
hsa-miR-423-5p, hsa-miR-328, hsa-miR-1 and hsa-let-7); hsa-miR-153,
which is expected to regulate forkhead box M1, a gene identified as
a putative hub in the protein-protein interaction network; and
hsa-miR-215, which interacts with cell-cycle-related genes in
miRcode (15).
Discussion
In the present study, we identified 222
significantly differentially expressed miRNAs using the massively
parallel sequencing approach in human lung cancer tissue compared
with normal lung tissue. Furthermore, we identified putative
negative regulatory miRNA-mRNA target pairs. Nineteen miRNAs were
upregulated, and 425 matched mRNAs were downregulated.
Additionally, 30 miRNAs were downregulated, and 332 matched mRNAs
were upregulated. miR-577, miR-301b, miR-944, miR-891a, miR-615-3p
and miR-338-3p were highly differentially expressed in the current
study.
We searched for putative target genes associated
with lung cancer. miR-577 was generally upregulated (fold
change=8.411) and negatively correlated with epidermal growth
factor-containing fibulin-like extracellular matrix protein 1
(EFEMP1, also known as fibulin-3). EFEMP1 belongs to the fibulin
family of widely expressed extracellular matrix proteins that
regulate cell proliferation. This family mediates cell-to-cell and
cell-to-matrix communication, as well as providing organization and
stabilization to extracellular matrix structures during
organogenesis and vasculogenesis. Several studies have demonstrated
that fibulin-3 and another fibulin family member, fibulin-5,
antagonize tumor angiogenesis in vivo (16), suggesting that concerted
deregulation of a set of antiangiogenic factors, including
fibulin-3 and tissue inhibitor of metalloproteinase 3, contributes
to tumor progression (17).
miR-301b is negatively correlated with homeobox A5
(HOXA5), which is known to be a tumor suppressor gene whose gene
product positively regulates the expression of the TP53 tumor
suppressor gene (18). Liu et
al suggested that microRNA-196a promotes NSCLC cell
proliferation and invasion by targeting HOXA5 (19). However, in our study, HOXA5 was
negatively regulated by both miR-301b and miR-891a. Additionally,
miR-301b was shown to be negatively correlated with secreted
protein acidic and rich in cysteine-like 1 (SPARCL1) and
hyaluronoglucosaminidase 1 (HYAL1). SPARCL1, also known as hevin,
belongs to the matricellular protein family. SPARCL1 is
downregulated in NSCLC (20).
Additionally, Yu et al (21) reported that SPARCL1 is likely to be
a significant negative regulator in the progression or metastasis
of colorectal cancer. HYAL1, which encodes a lysosomal
hyaluronidase, was downregulated in NSCLC tissue. Anedchenko et
al (22) reported that HYAL1
and HYAL2 genes are downregulated in NSCLC, a finding that is
consistent with our data.
miR-944 was negatively correlated with GATA binding
protein 6 (GATA6), which is a member of a small family of zinc
finger transcription factors that play a significant role in the
regulation of cellular differentiation and organogenesis. This
protein is expressed during early embryogenesis and localizes to
endo- and mesodermally derived cells during later embryogenesis,
thereby playing a significant role in lung development. Cheung
et al (23) reported that
lung adenocarcinoma progression is regulated in part by the lineage
transcription factor GATA6.
miR 338-3p was generally downregulated (fold
change=−6.574), and was negatively correlated with the putative
target genes carcinoembryonic antigen-related cell adhesion
molecule 1 (CEACAM1) and minichromosome maintenance protein 4
(MCM4). CEACAM1, a single-pass transmembrane type I glycoprotein,
belongs to the carcinoembryonic antigen family. In lung cancer,
accumulated immunohistochemical evidence indicates that epithelial
CEACAM1 expression is associated with tumor metastasis and
progression (24). Zhou et
al demonstrated that CEACAM1 mRNA levels in tumors were higher
those in adjacent tumor-free tissues, although not significantly
(24). Additionally, MCM4 is one
of six MCM proteins comprising the prereplicative complex that
binds to replication origins in the G1 phase of the cell cycle and
is essential for the initiation of DNA replication. Kikuchi et
al (25) reported that MCM4
expression was higher in lung cancer cells than in adjacent normal
bronchial epithelial cells (P<0.001), and high MCM4 expression
was correlated with poorer differentiation (P<0.001).
miR-210 is one of the most consistently reported
upregulated miRNAs in human lung cancer miRNA expression profiling
studies (1,26). In our study, miR-210 was
significantly differentially expressed (fold change=2.246; P=0.03).
miR-210 has a number of validated targets associated with the
regulation of mitochondrial metabolism, angiogenesis, cell cycle
regulation and X-chromosome inactivation (1), and miR-210 is upregulated by hypoxia
inducible factor 1α (HIF-1α) in response to hypoxic conditions.
Recently, miR-210 was reported to increase the radioresistance of
hypoxic cancer cells (27).
Our results were partly consistent with those of
previous studies of miRNA in lung cancer, and novel miRNAs that may
play an active role in cancer development were identified. Our
study used the NGS approach to profile miRNA expression in human
lung cancer tissue compared with matched normal lung tissue,
although only a small number of samples were used. As the
technology develops, the cost of sequencing is expected to decline,
making it possible for NGS to be widely used in the future. The
major advantages of NGS are its high-throughput capability, and
that it is precise, accurate and repeatable. Its application
includes new miRNA exploration, detection of miRNA, miRNA editing
and isomiR and target mRNA detection. NGS of small RNAs facilitates
the investigation of the ubiquitous and differentially expressed
behavior of miRNAs, and will therefore promote miRNA research.
The current study had several limitations. Few
samples were included, and no validation study was performed.
Additionally, our study compared tumor and non-cancerous tissue
only. The identification of markers associated with patient
survival, disease prognosis or response to a specific anticancer
drug is warranted. However, our results include overlapping miRNAs
that were reported previously.
In conclusion, significantly differentially
expressed miRNAs and mRNAs between lung cancer and normal tissue
were identified by means of massively parallel sequencing. These
miRNAs and their target genes may play a significant role in lung
cancer. Further studies are warranted to fully understand the
pathogenesis of NSCLC.
Acknowledgements
This study was supported by a grant from the
National R&D Program for Cancer Control (1020420) and the
Ministry for Health and Welfare and Basic Research Program through
the National Research Foundation of Korea (C1010458-01-01) funded
by the Ministry of Education, Republic of Korea.
References
|
1
|
Võsa U, Vooder T, Kolde R, et al:
Meta-analysis of microRNA expression in lung cancer. Int J Cancer.
132:2884–2893. 2013. View Article : Google Scholar
|
|
2
|
Jemal A, Bray F, Center MM, et al: Global
cancer statistics. CA Cancer J Clin. 61:69–90. 2011. View Article : Google Scholar : PubMed/NCBI
|
|
3
|
Esteller M: Non-coding RNAs in human
disease. Nat Rev Genet. 12:861–874. 2011. View Article : Google Scholar : PubMed/NCBI
|
|
4
|
Iorio MV, Ferracin M, Liu GC, et al:
MicroRNA gene expression deregulation in human breast cancer.
Cancer Res. 65:7065–7070. 2005. View Article : Google Scholar : PubMed/NCBI
|
|
5
|
Yanaihara N, Caplen N, Bowman E, et al:
Unique microRNA molecular profiles in lung cancer diagnosis and
prognosis. Cancer Cell. 9:189–198. 2006. View Article : Google Scholar : PubMed/NCBI
|
|
6
|
Porkka KP, Pfeiffer MJ, Waltering KK, et
al: MicroRNA expression profiling in prostate cancer. Cancer Res.
67:6130–6135. 2007. View Article : Google Scholar : PubMed/NCBI
|
|
7
|
Akao Y, Nakagawa Y and Naoe T:
MicroRNA-143 and -145 in colon cancer. DNA Cell Biol. 26:311–320.
2007. View Article : Google Scholar : PubMed/NCBI
|
|
8
|
Yang H, Kong W, He L, et al: MicroRNA
expression profiling in human ovarian cancer: miR-214 induces cell
survival and cisplatin resistance by targeting PTEN. Cancer Res.
68:425–433. 2008. View Article : Google Scholar : PubMed/NCBI
|
|
9
|
Sablok G, Milev I, Minkov G, et al:
isomiRex: web-based identification of microRNAs, isomiR variations
and differential expression using next-generation sequencing
datasets. FEBS Lett. 587:2629–2634. 2013. View Article : Google Scholar : PubMed/NCBI
|
|
10
|
Trapnell C, Roberts A, Goff L, et al:
Differential gene and transcript expression analysis of RNA-seq
experiments with TopHat and Cufflinks. Nature protocols. 7:562–578.
2012. View Article : Google Scholar : PubMed/NCBI
|
|
11
|
Bindea G, Mlecnik B, Hackl H, et al:
ClueGO: a Cytoscape plug-in to decipher functionally grouped gene
ontology and pathway annotation networks. Bioinformatics.
25:1091–1093. 2009. View Article : Google Scholar : PubMed/NCBI
|
|
12
|
Shannon P, Markiel A, Ozier O, et al:
Cytoscape: a software environment for integrated models of
biomolecular interaction networks. Genome Re. 13:2498–2504. 2003.
View Article : Google Scholar
|
|
13
|
Bindea G, Galon J and Mlecnik B: CluePedia
Cytoscape plugin: Pathway insights using integrated experimental
and in silico data. Bioinformatics. 29:661–663. 2013. View Article : Google Scholar : PubMed/NCBI
|
|
14
|
Kozomara A and Griffiths-Jones S: miRBase:
integrating microRNA annotation and deep-sequencing data. Nucleic
Acids Res. 39(Database issue): D152–D157. 2011. View Article : Google Scholar :
|
|
15
|
Xiao F, Zuo Z, Cai G, et al: miRecords: an
integrated resource for microRNA-target interactions. Nucleic Acids
Res. 37(Database issue): D105–D110. 2009. View Article : Google Scholar :
|
|
16
|
Albig AR, Neil JR and Schiemann WP:
Fibulins 3 and 5 antagonize tumor angiogenesis in vivo. Cancer Res.
66:2621–2629. 2006. View Article : Google Scholar : PubMed/NCBI
|
|
17
|
Yue W, Dacic S, Sun Q, et al: Frequent
inactivation of RAMP2, EFEMP1 and Dutt1 in lung cancer by promoter
hypermethylation. Clin Cancer Res. 13:4336–4344. 2007. View Article : Google Scholar : PubMed/NCBI
|
|
18
|
Raman V, Martensen SA, Reisman D, et al:
Compromised HOXA5 function can limit p53 expression in human breast
tumours. Nature. 405:974–978. 2000. View
Article : Google Scholar : PubMed/NCBI
|
|
19
|
Liu X, Lu K, Wang K, et al: MicroRNA-196a
promotes non-small cell lung cancer cell proliferation and invasion
through targeting HOXA5. BMC Cancer. 12:348. 2012. View Article : Google Scholar : PubMed/NCBI
|
|
20
|
Schraml P, Shipman R, Colombi M and Ludwig
CU: Identification of genes differentially expressed in normal lung
and non-small cell lung carcinoma tissue. Cancer Res. 54:5236–5240.
1994.PubMed/NCBI
|
|
21
|
Yu S, Yu J, Ge W, et al: SPARCL1, Shp2,
MSH2, E-cadherin, p53, ADCY-2 and MAPK are prognosis-related in
colorectal cancer. World J Gastroenterol. 17:2028–2036. 2011.
View Article : Google Scholar : PubMed/NCBI
|
|
22
|
Anedchenko EA, Dmitriev AA, Krasnov GS, et
al: Down-regulation of RBSP3/CTDSPL, NPRL2/G21, RASSF1A, ITGA9,
HYAL1 and HYAL2 genes in non-small cell lung cancer. Mol Biol.
42:965–976. 2008.(in Russian). View Article : Google Scholar
|
|
23
|
Cheung W, Zhao M, Liu Z, et al: Control of
alveolar differentiation by the lineage transcription factors GATA6
and HOPX inhibits lung adenocarcinoma metastasis. Cancer Cell.
23:725–738. 2013. View Article : Google Scholar : PubMed/NCBI
|
|
24
|
Zhou M, Du Y, Liu Y, et al: Clinical and
experimental studies regarding the expression and diagnostic value
of carcinoembryonic antigen-related cell adhesion molecule 1 in
non-small-cell-lung cancer. BMC Cancer. 13:3592013. View Article : Google Scholar
|
|
25
|
Kikuchi J, Kinoshita I, Shimizu Y, et al:
Minichromosome maintenance (MCM) protein 4 as a marker for
proliferation and its clinical and clinicopathological significance
in non-small cell lung cancer. Lung Cancer. 72:229–237. 2011.
View Article : Google Scholar
|
|
26
|
Guan P, Yin Z, Li X, et al: Meta-analysis
of human lung cancer microRNA expression profiling studies
comparing cancer tissues with normal tissues. J Exp Clin Cancer
Res. 31:542012. View Article : Google Scholar : PubMed/NCBI
|
|
27
|
Grosso S, Doyen J, Parks SK, et al:
MiR-210 promotes a hypoxic phenotype and increases radioresistance
in human lung cancer cell lines. Cell Death Dis. 4:e5442013.
View Article : Google Scholar : PubMed/NCBI
|