Introduction
Connective tissue growth factor (CTGF), also termed
CCN-2 (cysteine rich 61/connective tissue growth
factor/nephroblastoma), is a prototypical member of the CCN family.
CTGF, similar to other CCN family members, is recognized for its
diverse role in cellular processes, including cell proliferation,
development, adhesion, angiogenesis, migration and tumorigenesis
(1–4). Previous studies have indicated that
CTGF is activated by basic fibroblast growth factor (bFGF) and
vascular endothelial growth factor (VEGF) (3,4). One
of the principal regulators of CTGF production is transforming
growth factor β (TGF-β), which functions in tumor initiation and
progression (5,6).
In vitro studies have indicated that, when
the functional effect of CTGF is blocked by antagonists, the
proliferation and migration of endothelial cells is reduced
(7). Overproduction of CTGF is
implicated in fibroproliferative diseases such as pulmonary
fibrosis, systemic sclerosis and liver cirrhosis (8–12).
Due to diverse autocrine and paracrine actions, CTGF can have
negative effects on normal physiological functions, which
implicates CTGF as a potential target for therapeutic purposes
(8).
The gene expression of CTGF and its association with
cancer development has been studied in various cancers, including
colorectal cancer (CRC), and CTGF is considered a prognostic marker
in multiple types of human carcinoma (13–17).
However, a consensus has not been reached on the role of CTGF in
tumorigenesis. In studies by Jacobson and Cunningham (4), Zhen et al (18) and Ladwa et al (19), CTGF was demonstrated to produce
opposing effects in different tumor types, and even within the same
type of tumor, which can be categorized into three forms:
‘Oncogenic’, ‘tumor suppression’ and ‘complex’ with both
properties. Due to the aberrant expression levels in different
types of tumor, the overall role of the CCN protein family members
in cancer remains unclear (11,20–22).
Studies investigating polymorphisms in growth factor
and other genes demonstrate that they have the ability to induce
prominent changes in normal functions via the alteration of
transcription sites (23,24). Various genotypes that are changed
as a result of polymorphisms are involved in different pathological
conditions, and can provide information regarding the
susceptibility, severity and prognosis of disease (21). For example, CTGF polymorphisms have
been overrepresented in patients with systemic sclerosis, hepatic
fibrosis and diabetes mellitus nephropathy; however, there have
been few conclusive studies on the function of CTGF SNPs in disease
susceptibility (9,11,12).
Genetic variations in CTGF are rarely used in clinical
decision-making, as there are very few studies concerning CTGF
polymorphisms in cancer.
Tumor growth and size are important variables for
the prognosis of CRC. Various techniques have been introduced for
the analysis of tumor growth in different types of carcinoma, but a
single widely-accepted set of criteria for grading is required
(25). The majority of grading
systems stratify a tumor semi-quantitatively into 3–4 grades, in
which 1 indicates a high level of differentiation and 4 indicates
poor differentiation (26). The
infiltrative pattern of a tumor can be distinguished by its
invasive front, which can aid prognosis (27). The invasive front is a term used to
describe the level of tumor growth into adjacent tissues. The
invasive front can be categorized as expansive and infiltrative, in
which the infiltrative growth pattern has an irregular invasive
front and poorer prognosis, while the expansive growth pattern has
a smooth invasive front (28,29).
In 2008, a computer software-based technique for measuring the
invasiveness of tumors in CRC was introduced by Franzén et
al (30) in which they
quantitatively scored tumors on a scale of 1–5, and labelled the
measurement as the complexity index (CI). A grade 1 tumor was
defined as having a smooth invasive front, while a grade 5 tumor
was defined as having a highly irregular tumor front in addition to
separate tumor cells and cell clusters. This classification was
based on the fractile dimensions and the number of tumor cells
(30).
Tumor growth depends upon numerous proteins that are
important in maintaining the morphology of tissues and affect
invasion and metastasis (10,31).
Tumors present limitations with respect to therapy, due to their
infiltrative nature, which inhibits complete resection and
contributes to tumor recurrence and resistance to radio- and
chemotherapy (32). Previous
studies have demonstrated that the complexity index of a tumor is
associated with tumor wall penetration, progression and stage
(33,34). As the action of CTGF in the
metastasis, proliferation and migration of tumor cells is
well-established (2,35,36),
it was assumed in the current study that genetic variation is able
to cause changes in the tumor phenotype, which can affect the CI of
the tumor.
Polymorphic alleles of various growth factors such
as VEGF, TGF-β and bFGF have been well-defined with respect to
their potential role in CRC development (37–39).
Currently, a limited number of studies investigating the role of
CTGF in CRC have been published, and genetic variations in this
gene have yet to be studied in patients with CRC. The aim of the
current study was to assess the following SNPs in the CTGF gene in
patients diagnosed with CRC: rs6918698, rs1931002, rs9493150,
rs12526196, rs12527705, rs9399005 and rs12527379. This was then
compared with the normal healthy population, in addition to
comparing the SNPs in patients with different clinicopathological
parameters, including age, gender, tumor wall penetration, lymph
node metastasis, systemic metastasis, localization and tumor
differentiation. Five-year survival data from the patients
associated with genetic variations was produced, in order to gain
information regarding the role of CTGF and genotypes associated
with the risk of development of CRC.
Materials and methods
Patient material
A total of 112 formalin-fixed paraffin-embedded
(FFPE) samples from patients diagnosed with CRC at the Department
of Laboratory Medicine, section for Pathology, Örebro University
Hospital (Örebro, Sweden) between 2004 and 2009 were selected.
Rectal carcinoma samples were not used, as rectal carcinoma is
often treated with radiation prior to surgery, which can alter the
morphological and genetic characteristics of the tumor. Blood
samples from 112 blood and plasma donors were used as controls. An
initial screening of patient and control samples (n=67 of each) was
performed for seven known SNPs in CTGF (rs6918698, rs1931002,
rs9493150, rs12526196, rs9399005, rs12527379 and rs12527705).
Following evaluation of the results, samples that showed
significance or a trend toward significant association between
polymorphism and disease were processed, resulting in 112 CRC
samples and 112 normal blood samples. These samples (n=112) were
analyzed for the following SNPs: rs6918698, rs1931002, rs9493150,
rs12526196 and rs12527705. Two SNPs (rs9399005 and rs12527379) were
analyzed in 67 patient and 67 control samples. The samples were
collected from both males and females. The present study was
approved by the Ethical Review Board, EPN (Uppsala, Sweden).
DNA extraction
The tumor area was outlined by an experienced
morphologist (Hahn-Strömberg). Depending upon the size of the tumor
samples, 1–2 tissue punches of 2-mm diameter were obtained from the
tumor area in the FFPE blocks. Genomic DNA was extracted from this
area using a NucleoSpin® FFPE DNA kit (Macherey-Nagel
GmbH, Düren, Germany) according to the manufacturer’s instructions.
Genomic DNA from blood and plasma donors was extracted using a
NucleoSpin® Blood DNA Extraction kit (Macherey-Nagel
GmbH) and the concentration and quality of the DNA was analyzed
using a NanoDrop 1000 spectrophotometer (Thermo Fisher Scientific,
Wilmington, DE, USA).
Primer designin and optimization
Primers were designed using PyroMark Assay
DesignSoftware, version 2.0 (Qiagen, Hilden, Germany). The primers
were optimized by polymerase chain reaction (PCR) at different
temperatures and MgCl2 concentrations. The primer
sequences (forward, reverse and sequencing primers) and their
annealing temperatures are presented in Table I.
 | Table IForward, reverse and sequencing
primers used to analyze seven single nucleotide polymorphisms in
connective tissue growth factor. |
Table I
Forward, reverse and sequencing
primers used to analyze seven single nucleotide polymorphisms in
connective tissue growth factor.
| SNP number | Primers | Annealing
temperature (°C) | Amplicon length
(bp) |
|---|
| rs6918698 | F:
GGGGCAGATTTCCAAAACTCTTa
R: TGGATCCCTTTTTCTGGAAACA
S: AACATTGATGGCCACT | 54 | 112 |
| rs1931002 | F:
CCCATAGGCATGGTTATTTAAAGA
R: AGCAAACTTGGTAGCCAGTATGTa
S: TTTAGAAACTCTTTGGATGA | 54 | 116 |
| rs9493150 | F:
TCAGAGCATGGGTTCAAGATAAa
R: CAGGCTGTTTTCAAATGATAAATC
S: CCGATCTTTGCACCA | 53 | 111 |
| rs12526196 | F:
AGAGGAAAATCGTTCACCATTTTA
R: TACATGCAACACACATCGAATCTCa
S: AAGACAACACTGAATATACA | 52 | 113 |
| rs12527705 | F:
CAATGGTGCTCCTCATTTCTTa
R: GGATTCAAAGCAATAGACATGTAG
S: GCAATAGACATGTAGACCC | 52 | 94 |
| rs9399005 | F:
TGATGTGAAGGGTTGGAAACTAAa
R: TCAGTCTCCATTAACCCTGTTGTA
S: GCATTTGTACCTCTCTGG | 54 | 93 |
| rs12527379 | F:
AGCTTTCTCCCTCTCTCCTTTAA
R: CCTCTCTCTCTGCCATGTGTAGTTa
S: ATGTTGTTAATGGAATGC | 54 | 111 |
PCR
A master mix was prepared, containing the following
reagents: Reverse and forward primers (0.25 μM) (Biomers.net GmbH, Ulm, Germany) KAPA2G Buffer M (1X),
KAPA MgCl2 (1 mM), KAPA dNTP Mix (200 μM), KAPA2G Fast
HotStart DNA Polymerase (1 U) (KAPA2G Fast HotStart PCR kit,
KK5512; Kapa Biosystems, Inc., Wilmington, MA, USA) and genomic DNA
(90–100 μg). PCR reactions were conducted in an ABI 2720 Thermal
Cycler (Life Technologies, Carlsbad, CA, USA) in three steps as
follows: (i) Denaturation at 95°C for 10 min; (ii) 49 cycles with
denaturation at 94°C for 45 sec, annealing temperature (according
to optimized annealing temperature of primers) for 30 sec, and
extension at 72°C for 30 sec; (iii) an extension was completed at
72°C for 7 min.
Gel electrophoresis
High-resolution agarose (Sigma-Aldrich, St. Louis,
MO, USA) was added to 1X TBE (Tris base, acetic acid and EDTA)
buffer solution to produce a 2% solution of agarose. A MassRuler
Low Range DNA Ladder (Thermo Fisher Scientific, Pittsburgh, PA,
USA) was used to compare the amplicon sizes following agarose gel
separation. The PCR products were visualized using a UV
Transilluminator (Bio-Rad Laboratories AB, Sundbyberg, Sweden).
Polymorphism screening by
pyrosequencing
Pyrosequencing was performed using a PyroMark Q96 ID
sequencing and quantification platform (Qiagen AB, Sollentuna,
Sweden). A master mix solution of Streptavidin Sepharose High
Performance Beads (GE Healthcare, Uppsala, Sweden) was prepared by
diluting sepharose beads in ultra-pure Milli-Q water and 1X binding
buffer (1 mM/l EDTA, 0.1% Tween 20, 2 M/l NaCl, 10 mM/l Tris-HCl,
Milli-Q water; pH 7.6). The streptavidin solution was added to a
96-well PCR plate, followed by the addition of the amplified PCR
product from each sample. Another solution was prepared for the
sequencing primer by diluting it to 0.5 μM with 1X annealing buffer
(2 mM/l magnesium acetate, 20 mM/l Tris-acetate; pH 7.6) at a ratio
of 1:249 and adding it to a PSQ96 well plate. A PyroMark Q96 Vacuum
Workstation (Qiagen, Hilden, Germany) was used to purify the
biotinylated PCR product. Following purification, the PSQ96 plate
was heated at 80°C for 2 min and was left to cool at room
temperature for 10 min. The polymorphisms were analyzed using
PyroMark ID software, version 1.0 (Qiagen AB, Upsala, Sweden). The
substrate mixture, enzymes and dNTPs were added to the cartridge
according to calculation generated by the PyroMark Q 96 ID system
(Qiagen AB, Uppsala, Sweden). A PyroMark Gold Q96 Reagent kit
(Qiagen AB, Uppsala, Sweden) was used according to manufacturer’s
instructions.
CI
To calculate the CI, 64 tumor samples were randomly
selected for computer image analysis from one patient group used
for the CTGF SNP study. Slide preparations, including sectioning,
staining and image processing were performed using the methodology
as described by Franzén et al (30). In brief, images from the invasive
front of the tumor area were captured using a Leica DC200 digital
camera mounted on a Leica DMRXE microscope with 10X objective lens
(Leica Microsystems GmbH, Wetzlar, Germany). From each sample, an
average of 7 (range of 5–10) images were captured. The number of
images depended upon the length of the tumor-stromal area. Images
were adjusted so that the tumor area appeared black and the
background white. These images were used to calculate the number of
free tumor cells and tumor cell clusters. The black color was then
removed so that only the outline of tumor remained (40). Using the tumor outline image, the
fractile dimensions were calculated using various software
programs; Adobe Photoshop, version 7.0 (Adobe Systems, Inc., San
Jose, CA, USA) with the Fovea Pro (Reindeer Graphics, Inc.,
Asheville, NC, USA) was used for the black/white and the tumor
outline images, and ImageJ software (http://imagej.nih.gov/ij/) was used to calculate the
fractal dimension value. The CI (ranges 1–5) was obtained by
calculating the mean value of these parameters.
Statistical analysis
SPSS, version 20 (IBM SPSS, Armonk, NY, USA) was
used for statistical analysis. Continuous variables were measured
as the mean and standard deviations. Univariant binary logistic
regression was applied to determine different SNPs as risk factors
for CRC. The Pearson’s χ2 test was used where required
to assess the data trends. The CI association was measured using
the Fisher’s exact test. Survival was analyzed using the
Kaplan-Meier’s test. P≤0.05 was considered to indicate a
statistically significant difference.
Results
Genetic analysis
The allele frequencies and genotype distributions in
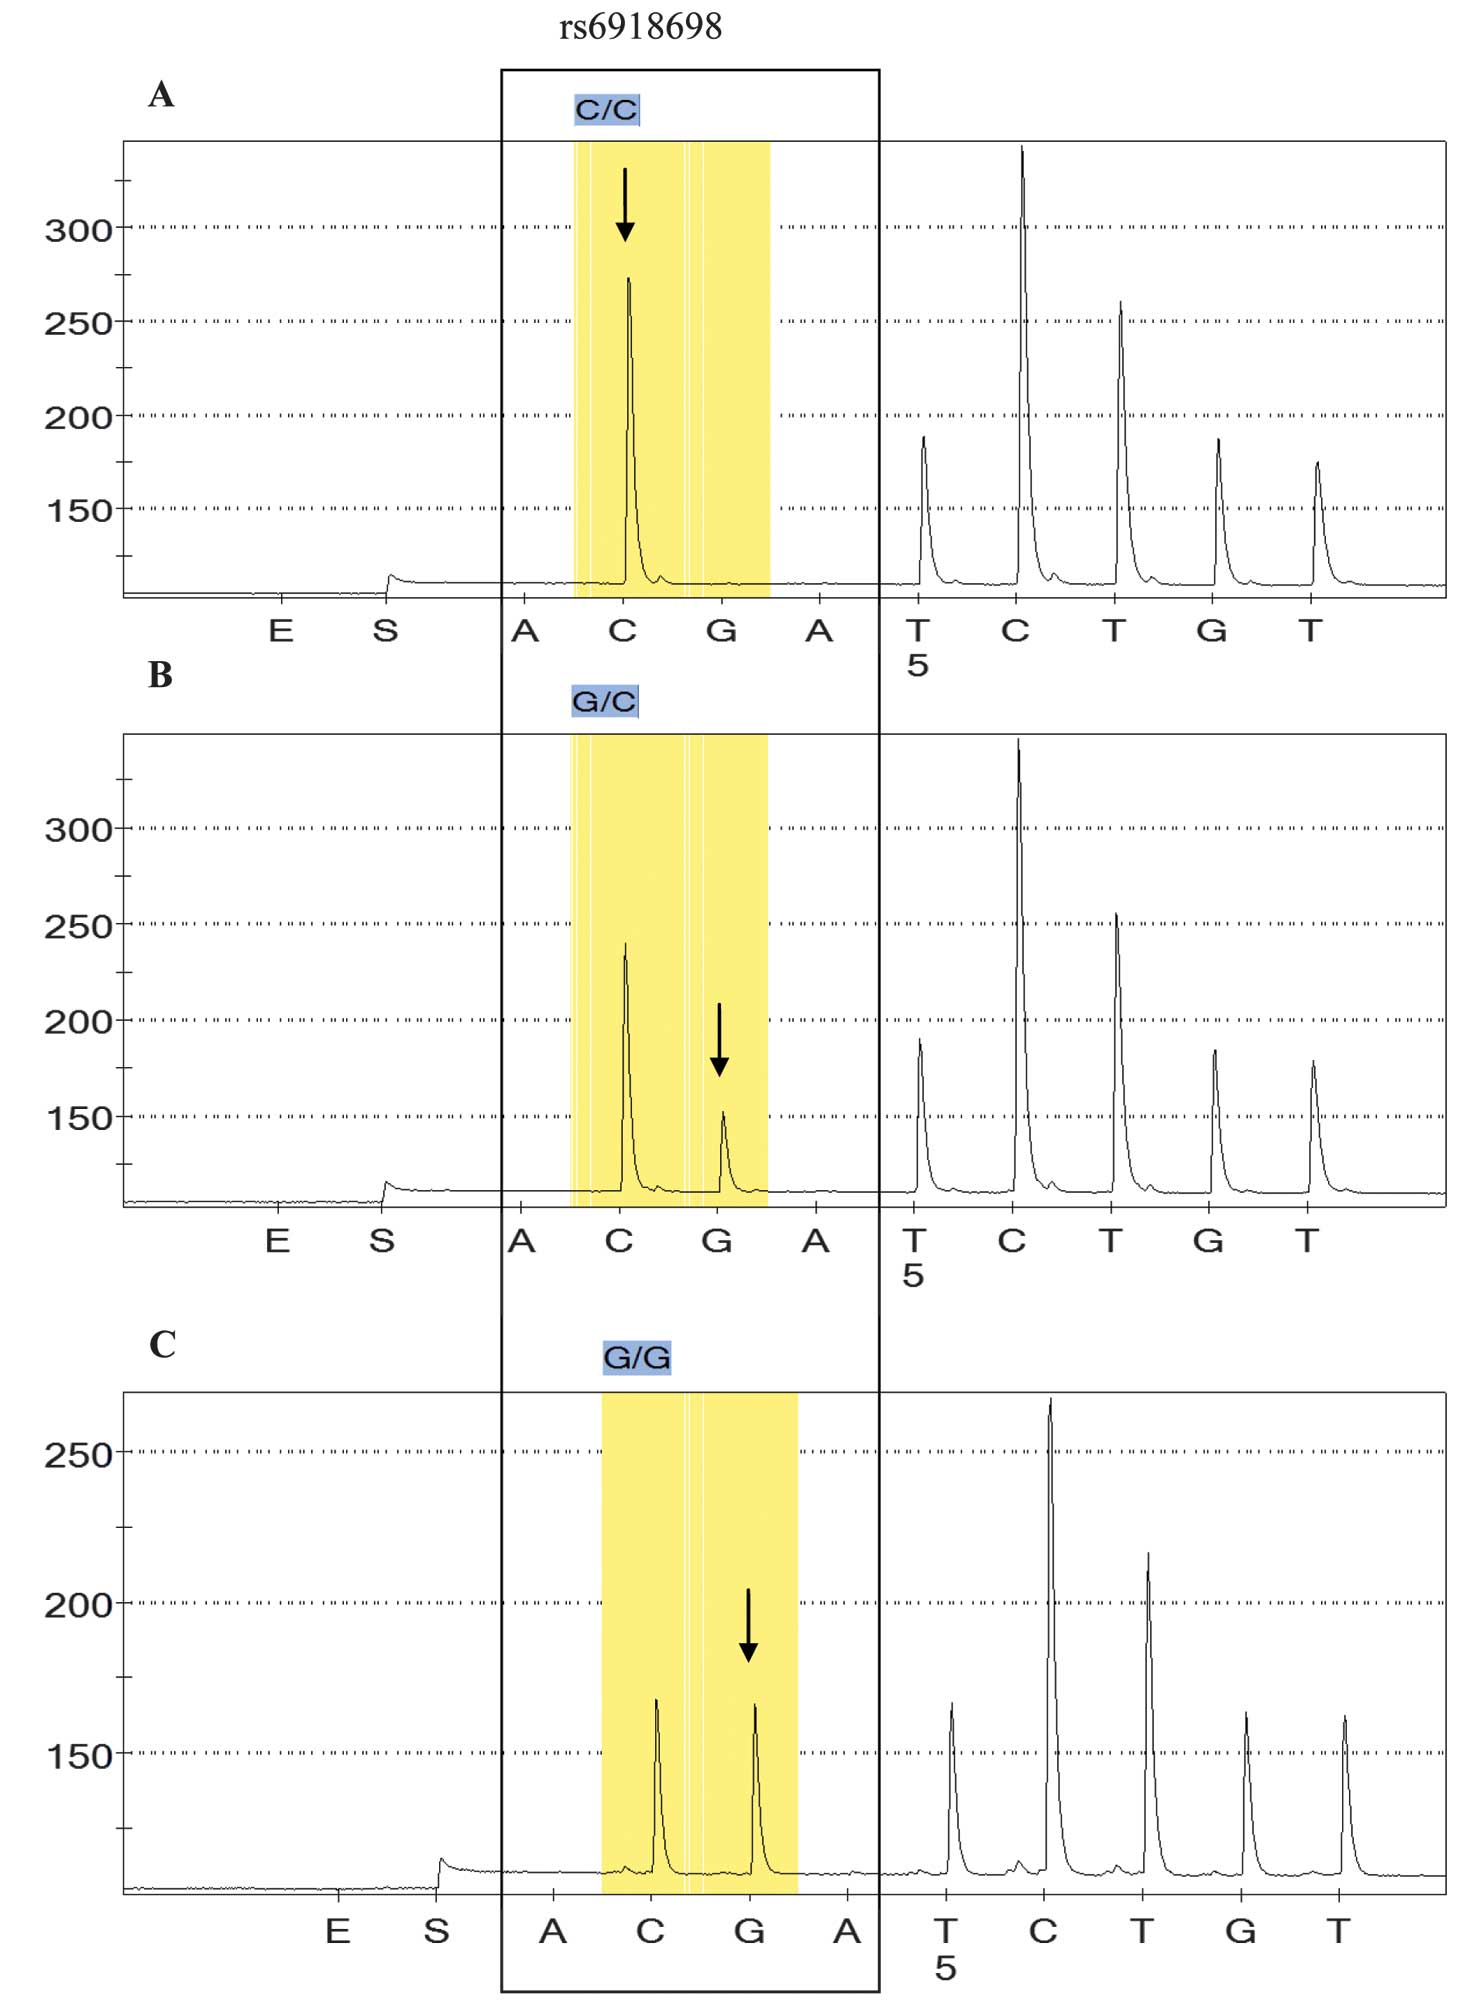
the patient and control samples are summarized in Table II. The association between CTGF
polymorphisms and occurrence of CRC was compared with the
clinicopathological parameters described below. A significant
difference in the number of samples with the rs6918698 GG genotype
was established between the CRC and the control group samples
(P=0.05; Table II). All three
genotypes in colon carcinoma sample (CC, GC and GG) were correlated
with respective genotypes in normal samples. GG genotype was
significantly different in tumor samples as compared with normal
samples (P=0.05). No significant difference was identified in
genotypic frequencies of GC between normal and CRC samples
(P=0.833). CC being a wild type, was considered as a referent.
Fig. 1 indicates the different
genotypes in rs6918698.
| Table IIGenotypes in connective tissue growth
factor and their association as risk factors for colorectal
cancer. |
Table II
Genotypes in connective tissue growth
factor and their association as risk factors for colorectal
cancer.
| CTGF SNPs | Genotype | Total CRC and
control samples (% all samples) | Control (%
controls) | CRC (% CRC) | P-value | OR | 95% CI |
|---|
| rs6918698 | CC | 64 (28.6) | 35 (31.2) | 29 (25.9) | 0 | 1.00 | (Referent) |
| GC | 115 (51.3) | 61 (54.5) | 54 (48.2) | 0.833 | 1.068 | 0.579–1.973 |
| GG | 45 (20.1) | 16 (14.3) | 29 (25.9) | 0.050 | 2.187 | 0.999–4.79 |
| rs1931002 | GG | 198 (88.4) | 98 (87.5) | 100 (89.3) | 0 | 1.00 | (Referent) |
| GA | 23 (10.3) | 13 (11.6) | 10 (8.9) | 0.524 | 0.75 | 0.316–1.8 |
| AA | 3 (1.3) | 1 (0.9) | 2 (1.8) | 0.585 | 1.96 | 0.175–21.966 |
| rs9493150 | CC | 129 (57.6) | 67 (59.8) | 62 (55.4) | 0 | 1.00 | (Referent) |
| GC | 81 (36.2) | 40 (35.7) | 41 (36.6) | 0.718 | 1.108 | 0.635–1.93 |
| GG | 14 (6.2) | 5 (4.5) | 9 (8) | 0.255 | 1.945 | 0.618–6.122 |
| rs12526196 | TT | 183 (81.7) | 94 (83.9) | 89 (79.5) | 0 | 1.00 | (Referent) |
| TC | 34 (15.2) | 18 (16.1) | 16 (14.3) | 0.866 | 0.939 | 0.451–1.954 |
| CC | 7 (3.1) | 0 (0) | 7 (6.2) | 0.999 | N/A | N/A |
| rs12527705 | TT | 162 (72.3) | 78 (69.6) | 84 (75.0) | 0 | 1.00 | (Referent) |
| AT | 57 (25.4) | 34 (30.3) | 23 (20.5) | 0.137 | 0.628 | 0.341–1.159 |
| AA | 5 (2.2) | 0 (0) | 5 (4.4) | 0.9999 | N/A | N/A |
| rs9399005 | GG | 63 (47) | 34 (50.7) | 29 (43.3) | 0 | 1.00 | (Referent) |
| GA | 61 (45.5) | 29 (43.3) | 32 (47.8) | 0.474 | 1.294 | 0.639–2.62 |
| AA | 10 (7.5) | 4 (6) | 6 (9) | 0.415 | 1.759 | 0.452–6.843 |
| rs12527379 | GG | 41 (30.6) | 17 (25.4) | 24 (35.8) | 0 | 1.00 | (Referent) |
| GA | 65 (48.5) | 37 (55.2) | 28 (41.8) | 0.123 | 0.536 | 0.243–1.183 |
| AA | 28 (20.9) | 13 (19.4) | 15 (22.4) | 0.683 | 0.817 | 0.31–2.152 |
For the rs1931002, rs9493150, rs12526196,
rs12527705, rs9399005 and rs12527379 SNPs, no significant
association was identified between patients and normal controls
(Table II). Clinicopathological
parameters, including age, gender, localization and tumor
differentiation were analyzed but did not present any significant
differences. Tumor penetration (T), lymph node involvement (N) and
distance metastasis (M) were also analyzed, but no significant
differences were identified (P=0.567, P=0.951 and P=1.00
respectively).
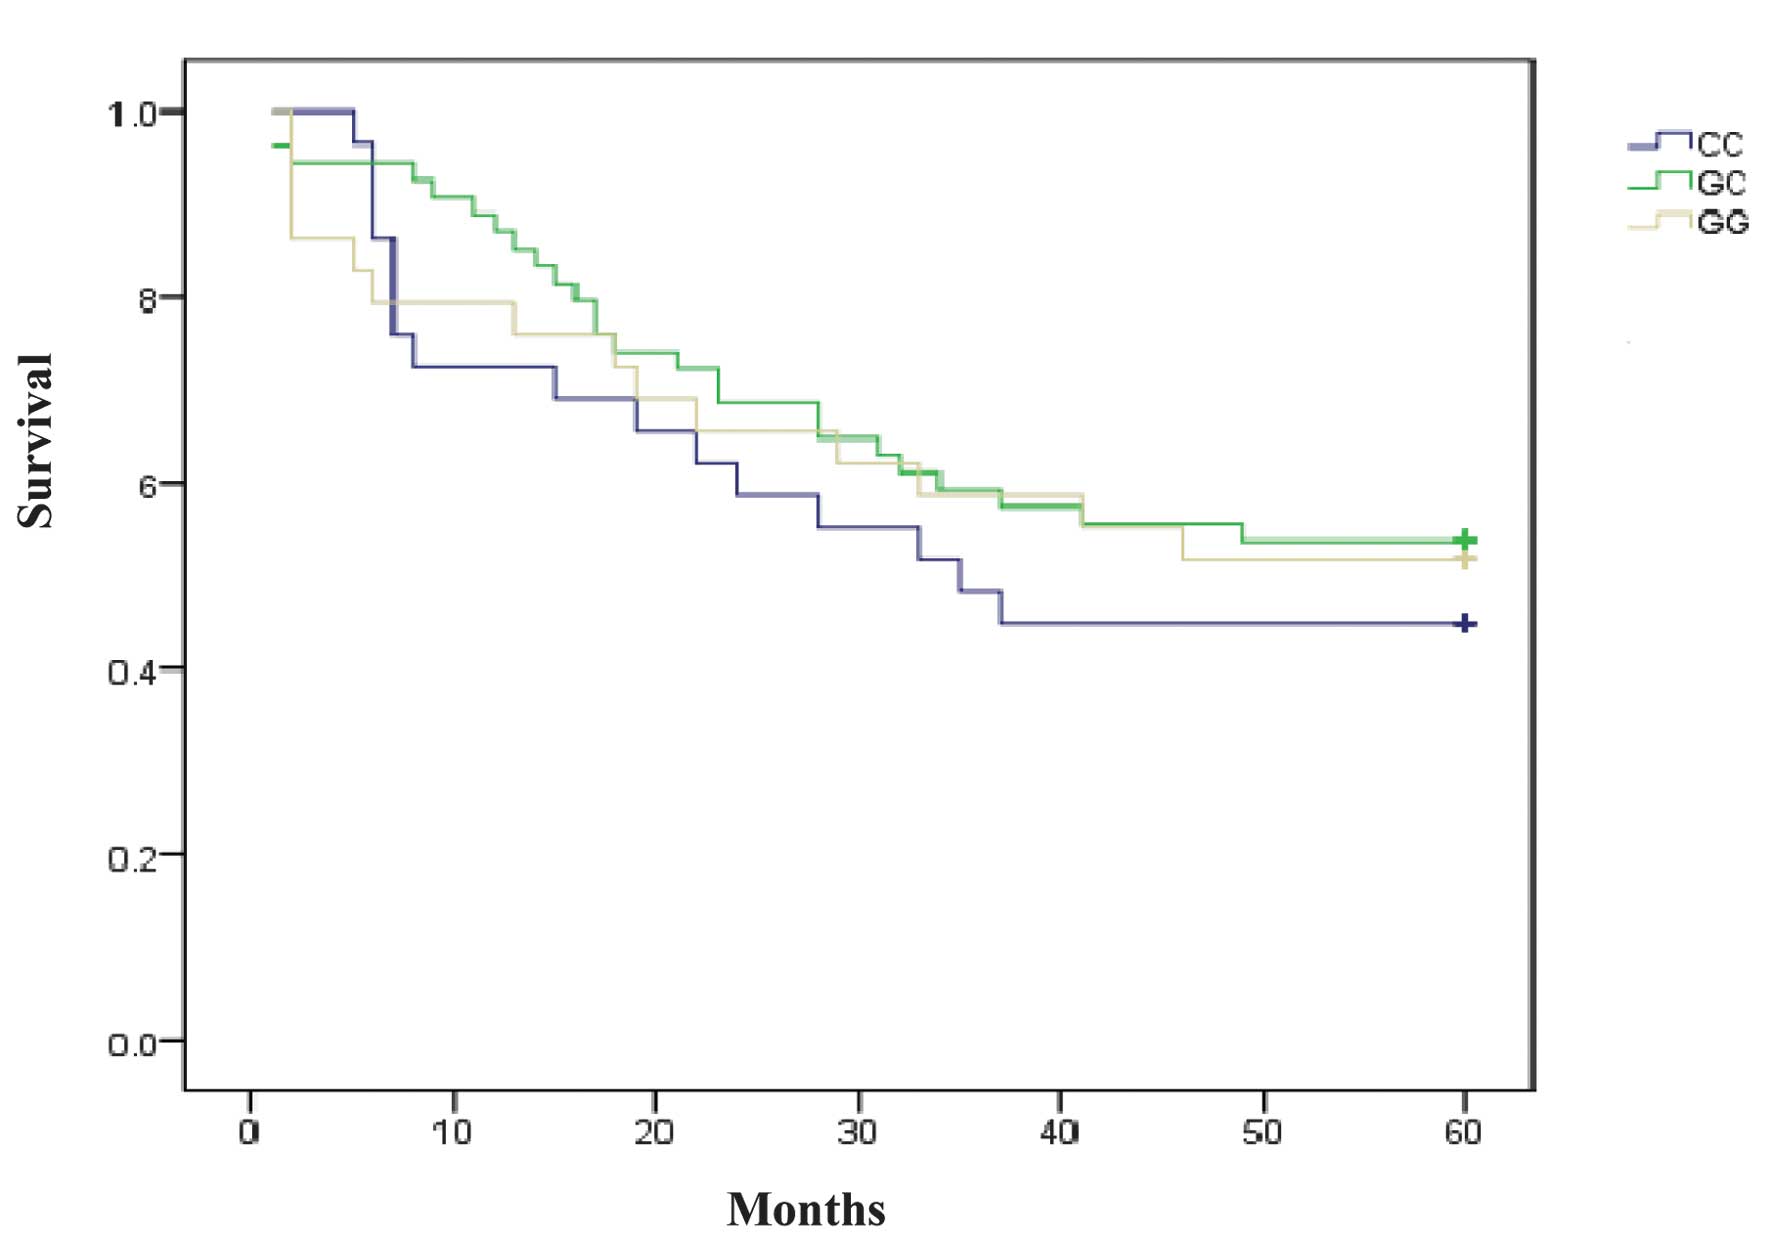
The 5-year survival data of the patients indicated
no significant association between the survival time and the CTGF
polymorphisms studied. Statistical results of the survival test
were as follows: rs6918698, P=0.668; rs1931002, P=0.367; rs9493150,
P=0.409; rs12526196, P=0.868; rs12527705, P=0.489; rs9399005,
P=0.123; and rs12527379, P=0.599 (Table III, Fig. 2).
| Table IIIAssociation between different single
nucleotide polymorphisms in connective tissue growth factor and
patient survival. |
Table III
Association between different single
nucleotide polymorphisms in connective tissue growth factor and
patient survival.
| CTGF SNPs | Genotype | Survival P-value
Kaplan-Meier’s test | P-value
Cox-regression test | OR | 95% CI |
|---|
| rs6918698 | CC | 0.668 | | 1.00 | Referent |
| GC | | 0.374 | 0.752 | 1.402–1.410 |
| GG | | 0.612 | 0.83 | 0.405–1.702 |
| rs1931002 | GG | 0.367 | | 1.00 | Referent |
| GA | | 0.174 | 0.445 | 0.139–1.428 |
| AA | | 0.911 | 1.119 | 0.155–8.104 |
| rs9493150 | CC | 0.409 | | 1.00 | Referent |
| GC | | 0.187 | 1.455 | 0.834–2.538 |
| GG | | 0.709 | 1.199 | 0.462–3.115 |
| rs12526196 | TT | 0.868 | | 1.00 | Referent |
| TC | | 0.62 | 0.817 | 0.368–1.815 |
| CC | | 0.901 | 1.067 | 0.383–2.971 |
| rs12527705 | TT | 0.489 | | 1.00 | Referent |
| AT | | 0.876 | 0.938 | 0.421–2.089 |
| AA | | 0.266 | 1.98 | 0.594–6.608 |
| rs9399005 | GG | 0.123 | | 1.00 | Referent |
| GA | | 0.48 | 0.772 | 0.377–1.583 |
| AA | | 0.132 | 2.182 | 0.791–6.021 |
| rs12527379 | GG | 0.599 | | | |
| GA | | 0.321 | 0.682 | 0.320–1.452 |
| AA | | 0.592 | 0.768 | 0.330–1.881 |
Patient clinicopathological data
SNPs in the CTGF gene were determined by
pyrosequencing. A total of 224 samples were used in the current
study, consisting 112 samples from patients diagnosed with CRC
between 2004 and 2009, and 112 samples from healthy blood and
plasma donors. Of the patients with CRC, 67 (60%) were male and 45
(40%) were female. There were 7 (6.2%) patients <60 years of age
and 105 (93.7%) that were >60. Regarding tumor wall penetration
(T), 4 (3.5%) were classified as T1; 18 (16%) T2; 76 (68%) T3; and
14 (12.5%) T4. For lymph node metastasis (N), 62 (55.3%) patients
presented N0 tumors; 32 (28.5%), N1; and 17 (15.1%), N2. With
regards to metastasis (M), 8 (7.1%) patients were classified as M1,
while the remaining 104 (92.8%) were at the Mx stage. For tumor
differentiation, 19 (16.9%) were low; 71 (63.4%) were moderate; and
18 (16%) were at the high differentiation stage.
The tumors were divided into two localizations;
right and left colon. There were 73 (65.1%) right-colon, and 39
(34.8%) left-colon tumors. The survival data demonstrated that 57
(50.8%) patients survived >5 years and 55 (49.1%) died within 5
years of CRC diagnosis (Tables
III and IV).
| Table IVClinicopathological data of the
patients diagnosed with colorectal cancer. |
Table IV
Clinicopathological data of the
patients diagnosed with colorectal cancer.
| Parameter
studied | N (% of total) |
|---|
| Age |
| ≤60 years | 7 (6.2) |
| >60 years | 105 (93.7) |
| Gender |
| Male | 67 (60) |
| Female | 45 (40) |
| Tumor
penetration |
| T1 | 4 (3.5) |
| T2 | 18 (16) |
| T3 | 76 (68) |
| T4 | 14 (12.5) |
| Lymph node
metastasis |
| N0 | 62 (55.3) |
| N1 | 32 (28.5) |
| N2 | 17 (15.1) |
| Metastasis |
| M1 | 8 (7.1) |
| Mx | 104 (92.8) |
|
Differentiation |
| Low | 19 (16.9) |
| Medium | 71 (63.4) |
| High | 18 (16) |
| Localization |
| Right colon | 73 (65.1) |
| Left colon | 39 (34.8) |
| Survival |
| Survived | 57 (50.8) |
| Died | 55 (49.1) |
SNP and HapMap comparison
When comparing the SNP frequencies to the HapMap
data (http://hapmap.ncbi.nlm.nih.gov/cgi-perl/snp_details_phase3?name=rs6918698&source=hapmap28_B36&tmpl=snp_details_phase3)
for the Central European population, a noticeable difference was
observed in genotype frequencies between the tumor, normal and
HapMap data in all SNPs (rs6918698, rs1931002, rs9493150,
rs12526196, rs12527705, rs9399005 and rs12527379 (Table V).
| Table VFrequencies of polymorphisms in
connective tissue growth factor from the sampled patients compared
with HapMap data for the central European population. |
Table V
Frequencies of polymorphisms in
connective tissue growth factor from the sampled patients compared
with HapMap data for the central European population.
| Tumor | Normal | HapMap |
|---|
|
|
|
|
|---|
| Genotype | Frequency | Number | Frequency | Number | Frequency | Number |
|---|
| SNP rs6918698 |
| CC | 0.26 | 29 | 0.31 | 35 | 0.21 | 13 |
| GC | 0.48 | 54 | 0.54 | 61 | 0.44 | 27 |
| GG | 0.26 | 29 | 0.14 | 16 | 0.35 | 22 |
| rs1931002 |
| GG | 0.89 | 100 | 0.87 | 98 | 0.72 | 47 |
| GA | 0.09 | 10 | 0.12 | 13 | 0.23 | 15 |
| AA | 0.018 | 2 | 0.01 | 1 | 0.05 | 3 |
| rs9493150 |
| CC | 0.55 | 62 | 0.6 | 67 | 0.5 | 56 |
| GC | 0.37 | 41 | 0.36 | 40 | 0.4 | 45 |
| GG | 0.08 | 9 | 0.04 | 5 | 0.1 | 12 |
| rs12526196 |
| TT | 0.80 | 89 | 0.84 | 94 | 0.89 | 100 |
| TC | 0.14 | 16 | 0.16 | 18 | 0.09 | 10 |
| CC | 0.06 | 7 | 0 | 0 | 0.02 | 2 |
| rs12527705 |
| TT | 0.75 | 84 | 0.70 | 78 | N/A | N/A |
| AT | 0.21 | 23 | 0.30 | 34 | N/A | N/A |
| AA | 0.04 | 5 | 0 | 0 | N/A | N/A |
| rs9399005 |
| GG | 0.43 | 29 | 0.51 | 34 | 0.56 | 63 |
| GA | 0.48 | 32 | 0.43 | 29 | 0.34 | 38 |
| AA | 0.09 | 6 | 0.06 | 4 | 0.106 | 12 |
| rs12527379 |
| GG | 0.36 | 24 | 0.25 | 17 | 0.33 | 37 |
| GA | 0.42 | 28 | 0.55 | 37 | 0.56 | 63 |
| AA | 0.22 | 15 | 0.19 | 13 | 0.11 | 13 |
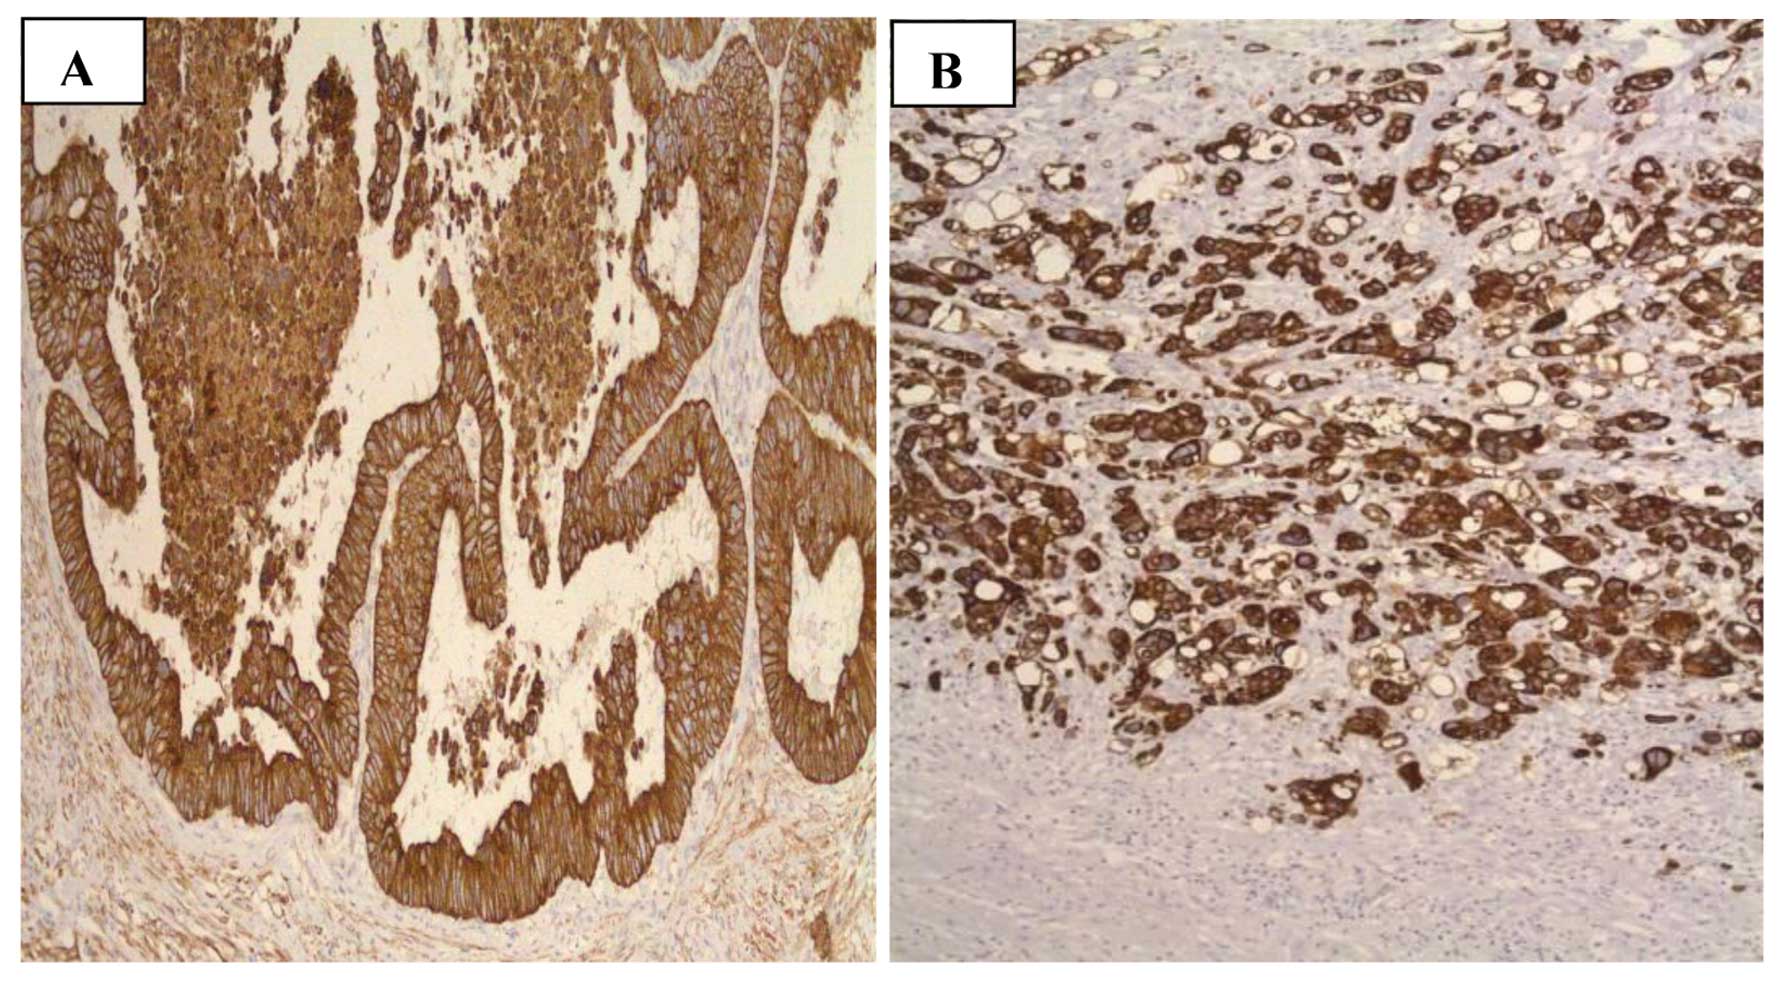
CI
To assess the CI, images of 64 tumor samples were
analyzed (Fig. 3) and the
clinicopathological parameters and genetic variation were compared
in the seven SNPs, rs6918698, rs1931002, rs9493150, rs12526196,
rs9399005, rs12527379 and rs12527705. The CI data was divided into
3 groups: Low (CI=1), medium (CI=2,3) and high (CI=4,5). A trend
was observed between the genetic variation at SNP rs6918698 and the
CI of the tumor (P=0.052). No significant association was
identified between the other six SNPs CI of tumor (Table VI). Associations of CI with
clinicopathological parameters and CTGF SNPs were as follows:
Gender, P=0.885; age, P=0.321; T, P=0.737; N, P=0.949; M, P=0.1;
localization, P=0.345; differentiation, P=0.280; rs6918698,
P=0.052; rs1931002, P=0.453; rs9493150, P=0.370; rs12526196,
P=0.285; rs12527705, P=889; rs9399005, P=0.959; and rs12527379,
P=0.506.
| Table VIAssociation of complexity index with
clinicopathological parameters of colorectal cancer and single
nucleotide polymorphisms in connective tissue growth factor. |
Table VI
Association of complexity index with
clinicopathological parameters of colorectal cancer and single
nucleotide polymorphisms in connective tissue growth factor.
| Parameters | Low CI (% of
total) | Medium CI (% of
total) | High CI (% of
total) | P-value |
|---|
| Gender |
| Male | 8 (12.5) | 22 (34.49) | 10 (15.6) | 0.885 |
| Female | 6 (9.4) | 13 (20.3) | 5 (7.8) | |
| Age |
| <60 years | 0 (0) | 4 (6.2) | 0 (0) | 0.321 |
| >60 years | 14 (21.9) | 31 (84.4) | 15 (23.4) | |
| Tumor stage
(T) |
| T1 | 1 (1.6) | 2 (3.1) | 0 (0) | 0.737 |
| T2 | 4 (6.2) | 4 (6.2) | 2 (3.1) | |
| T3 | 8 (12.5) | 25 (39.1) | 12 (18.8) | |
| T4 | 1 (1.6) | 4 (6.2) | 1 (1.6) | |
| Lymph node
metastasis (N) |
| N0 | 8 (12.5) | 20 (31.7) | 8 (12.5) | 0.949 |
| N1 | 3 (4.8) | 9 (14.3) | 3 (4.8) | |
| N2 | 2 (3.1) | 6 (9.5) | 4 (6.2) | |
| Metastasis (M) |
| Mx | 13 (20.3) | 32 (50.0) | 14 (21.9) | 1 |
| M1 | 1 (1.6) | 3 (4.7) | 1 (1.6) | |
| Localization |
| Right colon | 9 (14.1) | 24 (37.5) | 13 (20.3) | 0.345 |
| Left colon | 5 (7.8) | 11 (17.2) | 2 (3.1) | |
|
Differentiation |
| Low | 3 (4.8) | 3 (4.8) | 4 (6.3) | 0.280 |
| Medium | 7 (11.1) | 26 (41.3) | 8 (12.5) | |
| High | 4 (6.3) | 6 (9.5) | 2 (3.1) | |
| rs6918698 |
| CC | 3 (4.7) | 11 (17.2) | 3 (4.7) | 0.052 |
| GC | 3 (4.7) | 17 (26.6) | 10 (15.6) | |
| GG | 8 (12.5) | 7 (10.9) | 2 (3.1) | |
| rs1931002 |
| GG | 14 (21.9) | 35 (54.7) | 14 (21.9) | 0.453 |
| GA | 0 (0) | 0 (0) | 1 (1.6) | |
| rs9493150 |
| CC | 11 (17.2) | 19 (29.7) | 9 (14.1) | 0.370 |
| GC | 2 (3.1) | 13 (20.3) | 6 (9.4) | |
| GG | 1 (1.6) | 3 (4.7) | 0 (0) | |
| rs12526196 |
| TT | 13 (20.3) | 27 (42.2) | 13 (20.3) | 0.285 |
| TC | 1 (1.6) | 6 (9.4) | 0 (0) | |
| CC | 0 (0) | 2 (3.1) | 2 (3.1) | |
| rs12527705 |
| TT | 9 (14.1) | 25 (39.1) | 11 (17.2) | 0.889 |
| AT | 4 (6.2) | 9 (14.1) | 3 (4.7) | |
| AA | 1 (1.6) | 1 (1.6) | 1 (1.6) | |
| rs9399005 |
| GG | 5 (7.8) | 15 (23.4) | 6 (9.4) | 0.959 |
| GA | 7 (10.9) | 17 (26.6) | 8 (12.5) | |
| AA | 2 (3.1) | 3 (4.7) | 1 (1.6) | |
| rs12527379 |
| GG | 8 (12.5) | 11 (17.2) | 4 (6.2) | 0.506 |
| GA | 4 (6.2) | 16 (25.0) | 7 (10.9) | |
| AA | 2 (3.1) | 8 (12.5) | 4 (6.2) | |
Discussion
CTGF is a multicellular protein involved in
promoting endothelial cell growth, adhesion and angiogenesis. CTGF
has been studied for its role in various diseases such as
sclerosis, kidney fibrosis, hepatic fibrosis, and numerous cancers,
including CRC (9,12,17,19,22).
Previously, only gene expression of CTGF has been analyzed in CRC,
thus very little is known about the role of CTGF polymorphisms in
this disease (19). In the current
study, seven SNPs (rs6918698, rs1931002, rs9493150, rs12526196,
rs12527705, rs9399005 and rs12527379) were investigated in the CTGF
gene and correlated to the different clinicopathological
parameters. Notably, it was demonstrated that the GG genotype of
rs6918698 was significantly associated with an increased
susceptibility to developing CRC (P=0.05). The other two genotypes,
GC and CC in SNP rs6918698, indicated no statistical significance.
It may be hypothesized that the C allele is a protective, and
substitution with the G allele leads to an increased risk for
disease development. Similar results were indicated by Fonseca
et al (41) who
demonstrated that CTGF gene expression is greater when the C is
substituted for a G allele in systemic sclerosis (41). This effect may be due to the
association between certain genotypes being more frequently
involved in transcription and stabilization of mRNA than others in
different genes. Previous studies have shown the differential
expression of polymorphic variants of the same genes (e.g.
myeloperoxidase G463A and TGFβ C1815T) (42–44).
Similar findings were made by Ladwa et al (19) indicating that gene polymorphisms
can change their gene expression behavior.
The polymorphisms rs1931002, rs9493150, rs12526196,
rs12527705, rs9399005 and rs12527379 were not observed to be
correlated with cancer risk, as most of the SNPs produced silent
mutations. Polymorphisms in coding regions likley alter the protein
function, whereas polymorphisms in the gene regulatory regions may
have an effect on gene expression. Pivovarova et al
(22) studied SNP rs9493150 in
pancreatic fibrosis but did not observe any correlation with
disease development. Similar results were obtained in a study by
Kovalenko et al (45) on
liver fibrosis, in which the rs9493150 and rs9399005 polymorphisms
were not associated with the disease. These studies support the
current findings indicating that these are silent polymorphisms. In
a French population study, SNP rs9399005 was demonstrated to be
significantly associated with systemic sclerosis (9). However, in the current study, this
SNP was not observed to be significantly associated with the
development of CRC, suggesting that this SNP performs a specific
role in sclerosis, but not in CRC. The difference in this finding
may be due to the different sample populations and methods used for
analysis. Similar results were produced in a study by Dessein et
al (12), in which CTGF SNPs
(rs12526196 and rs1931002) were indicated to serve a significant
function in hepatic fibrosis. However, SNP rs12527705 did not
present any significant association with tumor growth in CRC in the
current study. The resulting proteins of these polymorphisms may
have a significant function in fibrosis in organs such as the
liver, but are not associated with angiogenesis and tumor growth in
CRC.
CTGF has been reported to be involved in binding
with TGFβ, thereby enhancing its signalling (45). This demonstrates that polymorphisms
are more strongly associated with certain diseases compared with
others. In the present study, a high frequency of the rs6918698 GG
genotype was identified in patients diagnosed with CRC, but the
same SNP studied by Granel et al (9) and Robinson et al (6) was indicated to not be associated with
fibrosis, which supports the idea that polymorphisms have different
functions in different diseases.
The frequencies of all the SNP genotypes, in the
tumor and normal samples, were compared with the HapMap data of the
Central European population (CEU) in the current study. All the
studied SNPs presented different frequencies to the CEU data, which
may be due to the different population samples; the current study
used samples from a Swedish population.
As descibed in earlier studies, little is still
known about the role of CCN proteins in cancer, and the results are
controversial, thus the role of CTGF in cancer remains undefined.
CTGF has an important role in the angiogenesis of breast cancer,
and is overexpressed in esophageal adenocarcinoma and CRC (13,17,19,46).
Paradoxically, studies by Lin et al (47) and Chang et al (48) indicated that CTGF inhibits
metastasis and that overexpression is associated with high survival
and good prognosis in lung adenocarcinoma (47,48).
In esophageal carcinoma, this overproduction increases the
β-catenin/T-cell factor signalling while opposite results are
observed in CRC (47,49). As this divergence is not yet
understood, further studies are required.
In the present study, the CI was assessed in 64
tumor samples. The results indicated a trend toward a significant
association between CTGF rs6918698 genotype variation and tumor
growth pattern (P=0.052). This demonstrates that genetic variation
at rs6918698 has an affect on the phenotype of tumors. Previous
studies have indicated that when a tumor metastasizes, its
phenotype changes; more aggressive tumors have a more irregular
invasive front with high CI (33,34);
however, conflicting outcomes have been observed by other
researchers (40,50). In the present study, polymorphism
rs6918698 was associated with a high risk of developing CRC, which
indicates its importance in this disease. To confirm any
association between rs6918698 genotypes and the growth patterns of
tumors, further studies are required in which a larger number of
samples must be examined. In the current study, there was no
significant association or trend between CI and the remaining six
CTGF polymorphisms. All the SNPs were evaluated for any possible
association with clinicopathological parameters, including age,
gender, tumor wall penetration, lymph node and systemic metastasis,
localization and tumor differentiation. No statistically
significant correlations were identified with any of these
parameters.
Previous studies have demonstrated that
integrin-TGFβ is involved in cancer development and fibrosis, and
that CTGF is a downstream effector of TGFβ (13,51).
It has been indicated that fibrosis can lead to cancer development
in various tissues (52), and so
polymorphisms in these genes that have an important role in
fibrosis should be studied further to clarify their role in cancer
development.
In conclusion, the present study was, to the best of
our knowledge, the first study conducted in which the association
between CTGF polymorphisms, CI and CRC was analyzed. The results,
however, did not indicate any significant association between CI,
CTGF polymorphism and tumor progression, but a trend was detected
between genetic variation at rs6918698 and tumor growth pattern.
Another notable finding was that the occurrence of the SNP
rs6918698 GG genotype indicated a higher risk of developing CRC.
This polymorphism and its association with growth pattern should be
investigated in future experiments, using different populations, a
larger sample size and different types of tumor, for further
understanding of the importance of CTGF SNPs in cancer. This SNP
may be a valuable marker in determining risk and progression of
different malignant diseases, and a critical step in the future
treatment of CRC that could be targeted for chemotherapy.
Acknowledgements
The current study was funded by the Lions Cancer
Research Foundation (Uppsala, Sweden), Örebro University Hospital
Research Council and Nyckelfonden, Örebro University Hospital
(Örebro, Sweden).
References
|
1
|
Brigstock DR: The connective tissue growth
factor/cysteine-rich 61/nephroblastoma overexpressed. Endocr Rev.
20:189–206. 1999.PubMed/NCBI
|
|
2
|
Dhar A and Ray A: The CCN family proteins
in carcinogenesis. Exp Oncol. 32:2–9. 2010.PubMed/NCBI
|
|
3
|
Shimo T, Nakanishi T, Nishida T, et al:
Connective tissue growth factor induces the proliferation,
migration, and tube formation of vascular endothelial cells in
vitro, and angiogenesis in vivo. J Biochem. 126:137–145. 1999.
View Article : Google Scholar : PubMed/NCBI
|
|
4
|
Jacobson A and Cunningham JL: Connective
tissue growth factor in tumor pathogenesis. Fibrogenesis Tissue
Repair. 5(Suppl 1): S82012. View Article : Google Scholar : PubMed/NCBI
|
|
5
|
Chen YQ, Sloan-Lancaster J, Berg DT, et
al: Differential mechanisms of plasminogen activator inhibitor-1
gene activation by transforming growth factor-beta and tumor
necrosis factor-alpha in endothelial cells. Thromb Haemost.
86:1563–1572. 2001.
|
|
6
|
Robinson PM, Smith TS, Patel D, et al:
Proteolytic processing of connective tissue growth factor in normal
ocular tissues and during corneal wound healing. Invest Ophthalmol
Vis Sci. 53:8093–8103. 2012. View Article : Google Scholar : PubMed/NCBI
|
|
7
|
Brigstock DR: Regulation of angiogenesis
and endothelial cell function by connective tissue growth factor
(CTGF) and cysteine-rich 61 (CYR61). Angiogenesis. 5:153–165. 2002.
View Article : Google Scholar
|
|
8
|
Moussad EE and Brigstock DR: Connective
tissue growth factor: what’s in a name? Mol Genet Metab.
71:276–292. 2000. View Article : Google Scholar : PubMed/NCBI
|
|
9
|
Granel B, Argiro L, Hachulla E, et al:
Association between a CTGF gene polymorphism and systemic sclerosis
in a French population. J Rheumatol. 37:351–358. 2010. View Article : Google Scholar
|
|
10
|
Wang X, Wan F, Pan J, et al: Tumor size: a
non-neglectable independent prognostic factor for gastric cancer. J
Surg Oncol. 97:236–240. 2008. View Article : Google Scholar
|
|
11
|
Wang B, Carter RE, Jaffa MA, et al;
DCCT/EDIC Study Group. Genetic variant in the promoter of
connective tissue growth factor gene confers susceptibility to
nephropathy in type 1 diabetes. J Med Genet. 47:391–397. 2010.
View Article : Google Scholar : PubMed/NCBI
|
|
12
|
Dessein A, Chevillard C, Arnaud V, et al:
Variants of CTGF are associated with hepatic fibrosis in Chinese,
Sudanese, and Brazilians infected with schistosomes. J Exp Med.
206:2321–2328. 2009. View Article : Google Scholar : PubMed/NCBI
|
|
13
|
Koliopanos A, Friess H, di Mola FF, et al:
Connective tissue growth factor gene expression alters tumor
progression in esophageal cancer. World J Surg. 26:420–427. 2002.
View Article : Google Scholar : PubMed/NCBI
|
|
14
|
Zhou ZQ, Cao WH, Xie JJ, et al: Expression
and prognostic significance of THBS1, Cyr61 and CTGF in esophageal
squamous cell carcinoma. BMC Cancer. 9:2912009. View Article : Google Scholar : PubMed/NCBI
|
|
15
|
Liu L, Li Z, Feng G, You W and Li J:
Expression of connective tissue growth factor is in agreement with
the expression of VEGF, VEGF-C, -D and associated with shorter
survival in gastric cancer. Pathol Int. 57:712–718. 2007.
View Article : Google Scholar : PubMed/NCBI
|
|
16
|
Chen PP, Li WJ, Wang Y, et al: Expression
of Cyr61, CTGF, and WISP-1 correlates with clinical features of
lung cancer. PLoS One. 2:e5342007. View Article : Google Scholar : PubMed/NCBI
|
|
17
|
Chien W, O’Kelly J, Lu D, et al:
Expression of connective tissue growth factor (CTGF/CCN2) in breast
cancer cells is associated with increased migration and
angiogenesis. Int J Oncol. 38:1741–1747. 2011.PubMed/NCBI
|
|
18
|
Zhen Y, Ye Y, Yu X, et al: Reduced CTGF
expression promotes cell growth, migration, and invasion in
nasopharyngeal carcinoma. PLoS One. 8:e649762013. View Article : Google Scholar : PubMed/NCBI
|
|
19
|
Ladwa R, Pringle H, Kumar R and West K:
Expression of CTGF and Cyr61 in colorectal cancer. J Clin Pathol.
64:58–64. 2011. View Article : Google Scholar
|
|
20
|
Lin BR, Chang CC, Chen RJ, et al:
Connective tissue growth factor acts as a therapeutic agent and
predictor for peritoneal carcinomatosis of colorectal cancer. Clin
Cancer Res. 17:3077–3088. 2011. View Article : Google Scholar : PubMed/NCBI
|
|
21
|
Bidwell J, Keen L, Gallagher G, et al:
Cytokine gene polymorphism in human disease: on-line databases.
Genes Immun. 1:3–19. 1999. View Article : Google Scholar
|
|
22
|
Pivovarova O, Fisher E, Dudziak K, et al:
A polymorphism within the connective tissue growth factor (CTGF)
gene has no effect on non-invasive markers of beta-cell area and
risk of type 2 diabetes. Dis Markers. 31:241–246. 2011. View Article : Google Scholar : PubMed/NCBI
|
|
23
|
Poli F, Boschiero L, Giannoni F, et al:
Tumour necrosis factor-alpha gene polymorphism: implications in
kidney transplantation. Cytokine. 12:1778–1783. 2000. View Article : Google Scholar : PubMed/NCBI
|
|
24
|
Awad MR, El-Gamel A, Hasleton P, et al:
Genotypic variation in the transforming growth factor-beta1 gene:
association with transforming growth factor-beta1 production,
fibrotic lung disease, and graft fibrosis after lung
transplantation. Transplantation. 66:1014–1020. 1998. View Article : Google Scholar : PubMed/NCBI
|
|
25
|
Bylund JR, Gayheart D, Fleming T, et al:
Association of tumor size, location, R.E.N.A.L., PADUA and
centrality index score with perioperative outcomes and
postoperative renal function. J Urol. 188:1684–1689. 2012.
View Article : Google Scholar : PubMed/NCBI
|
|
26
|
Compton CC: Colorectal carcinoma:
diagnostic, prognostic, and molecular features. Mod Pathol.
16:376–388. 2003. View Article : Google Scholar : PubMed/NCBI
|
|
27
|
Jung CK, Kang YG, Bae JS, et al: Unique
patterns of tumor growth related with the risk of lymph node
metastasis in papillary thyroid carcinoma. Mod Pathol.
23:1201–1208. 2010. View Article : Google Scholar : PubMed/NCBI
|
|
28
|
Jass JR: The pathological classification
of colorectal cancer. Ann Acad Med Singapore. 16:469–473.
1987.PubMed/NCBI
|
|
29
|
Jass JR, Atkin WS, Cuzick J, et al: The
grading of rectal cancer: historical perspectives and a
multivariate analysis of 447 cases. Histopathology. 41:59–81.
2002.PubMed/NCBI
|
|
30
|
Franzén LE, Hahn-Strömberg V, Edvardsson H
and Bodin L: Characterization of colon carcinoma growth pattern by
computerized morphometry: definition of a complexity index. Int J
Mol Med. 22:465–472. 2008.PubMed/NCBI
|
|
31
|
Ohene-Abuakwa Y and Pignatelli M: Adhesion
molecules as diagnostic tools in tumor pathology. Int J Surg
Pathol. 8:191–200. 2000. View Article : Google Scholar
|
|
32
|
Lee HK, Bier A, Cazacu S, et al:
MicroRNA-145 is downregulated in glial tumors and regulates glioma
cell migration by targeting connective tissue growth factor. PLoS
One. 8:e546522013. View Article : Google Scholar : PubMed/NCBI
|
|
33
|
Mannan A and Hahn-Strömberg V: K-ras
mutations are correlated to lymph node metastasis and tumor stage,
but not to the growth pattern of colon carcinoma. APMIS.
120:459–468. 2012. View Article : Google Scholar : PubMed/NCBI
|
|
34
|
Hahn-Strömberg V, Edvardsson H, Bodin L
and Franzén L: Tumor volume of colon carcinoma is related to the
invasive pattern but not to the expression of cell adhesion
proteins. APMIS. 117:205–211. 2009. View Article : Google Scholar : PubMed/NCBI
|
|
35
|
Gao YB, Xiang ZL, Zhou LY, et al: Enhanced
production of CTGF and IL-11 from highly metastatic hepatoma cells
under hypoxic conditions: an implication of hepatocellular
carcinoma metastasis to bone. J Cancer Res Clin Oncol. 139:669–679.
2013. View Article : Google Scholar : PubMed/NCBI
|
|
36
|
Xie H, Zhao Y, Caramuta S, Larsson C and
Lui WO: miR-205 expression promotes cell proliferation and
migration of human cervical cancer cells. PLoS One. 7:e469902012.
View Article : Google Scholar : PubMed/NCBI
|
|
37
|
Heinzle C, Gsur A, Hunjadi M, et al:
Differential effects of polymorphic alleles of FGF receptor 4 on
colon cancer growth and metastasis. Cancer Res. 72:5767–5777. 2012.
View Article : Google Scholar : PubMed/NCBI
|
|
38
|
Zhong R, Liu L, Zou L, et al: Genetic
variations in the TGFβ signaling pathway, smoking and risk of
colorectal cancer in a Chinese population. Carcinogenesis.
34:936–942. 2013. View Article : Google Scholar : PubMed/NCBI
|
|
39
|
Jang MJ, Jeon YJ, Kim JW, et al:
Association of VEGF and KDR single nucleotide polymorphisms with
colorectal cancer susceptibility in Koreans. Mol Carcinog. 52(Suppl
1): E60–69. 2013. View Article : Google Scholar
|
|
40
|
Hahn-Strömberg V, Edvardsson H, Bodin L
and Franzén L: Disturbed expression of E-cadherin, beta-catenin and
tight junction proteins in colon carcinoma is unrelated to growth
pattern and genetic polymorphisms. APMIS. 116:253–262. 2008.
View Article : Google Scholar : PubMed/NCBI
|
|
41
|
Fonseca C, Lindahl GE, Ponticos M, et al:
A polymorphism in the CTGF promoter region associated with systemic
sclerosis. N Engl J Med. 357:1210–1220. 2007. View Article : Google Scholar : PubMed/NCBI
|
|
42
|
Greenawalt DM, Sieberts SK, Cornelis MC,
et al: Integrating genetic association, genetics of gene
expression, and single nucleotide polymorphism set analysis to
identify susceptibility Loci for type 2 diabetes mellitus. Am J
Epidemiol. 176:423–430. 2012. View Article : Google Scholar : PubMed/NCBI
|
|
43
|
Katakami N, Kume S, Kaneto H, et al:
Association of myeloperoxidase G-463A gene polymorphism with
diabetic nephropathy. Endocr J. 60:457–471. 2012.
|
|
44
|
Guo H, Bao Z, Li J, et al: Molecular
characterization of TGF-β type I receptor gene (Tgfbr1) in Chlamys
farreri, and the association of allelic variants with growth
traits. PLoS One. 7:e510052012. View Article : Google Scholar
|
|
45
|
Kovalenko E, Tacke F, Gressner OA, et al:
Validation of connective tissue growth factor (CTGF/CCN2) and its
gene polymorphisms as noninvasive biomarkers for the assessment of
liver fibrosis. J Viral Hepat. 16:612–620. 2009. View Article : Google Scholar : PubMed/NCBI
|
|
46
|
Davies SR, Davies ML, Sanders A, et al:
Differential expression of the CCN family member WISP-1, WISP-2 and
WISP-3 in human colorectal cancer and the prognostic implications.
Int J Oncol. 36:1129–1136. 2010.PubMed/NCBI
|
|
47
|
Lin BR, Chang CC, Che TF, et al:
Connective tissue growth factor inhibits metastasis and acts as an
independent prognostic marker in colorectal cancer.
Gastroenterology. 128:9–23. 2005. View Article : Google Scholar : PubMed/NCBI
|
|
48
|
Chang CC, Lin MT, Lin BR, et al: Effect of
connective tissue growth factor on hypoxia-inducible factor 1alpha
degradation and tumor angiogenesis. J Natl Cancer Inst. 98:984–995.
2006. View Article : Google Scholar : PubMed/NCBI
|
|
49
|
Deng YZ, Chen PP, Wang Y, et al:
Connective tissue growth factor is overexpressed in esophageal
squamous cell carcinoma and promotes tumorigenicity through
beta-catenin-T-cell factor/Lef signaling. J Biol Chem.
282:36571–36581. 2007. View Article : Google Scholar : PubMed/NCBI
|
|
50
|
Victoria HS, Henrik E, Lennart B and
Lennart F: Claudin 1 and claudin 7 gene polymorphisms and protein
derangement are unrelated to the growth pattern and tumor volume of
colon carcinoma. Int J Biomed Sci. 6:96–102. 2010.PubMed/NCBI
|
|
51
|
Margadant C and Sonnenberg A:
Integrin-TGF-beta crosstalk in fibrosis, cancer and wound healing.
EMBO Rep. 11:97–105. 2010. View Article : Google Scholar : PubMed/NCBI
|
|
52
|
Radisky DC, Kenny PA and Bissell MJ:
Fibrosis and cancer: do myofibroblasts come also from epithelial
cells via EMT? J Cell Biochem. 101:830–839. 2007. View Article : Google Scholar : PubMed/NCBI
|