Introduction
The majority of erectile dysfunction (ED) cases are
associated with oxidative stress (OS) and occur due to certain
factors that result in insufficient blood supply, including
diabetes mellitus, smoking, hypercholesterolemia, hypertension and
artery injury (1–3). As a prevalent physiopathological
mechanism, OS increases the risk of various diseases, such as ED,
in males. Previous studies have demonstrated that endothelial
dysfunction, including restricted vasodilation, hemodynamic events
and endothelial integrity damage, played a crucial role in the
pathophysiology of ED (4,5). OS was hypothesized to participate in
the pathogenesis of endothelial dysfunction (5,6);
however, to date, studies have primarily focused on nitric oxide
(NO) synthesis and reductase activity. While the mRNA expression
levels of individual candidate genes have been previously reported,
the map of gene regulation in OS-induced endothelial dysfunction
remains to be fully elucidated (7). Microarray technology has
high-throughput capability, allowing genome-wide analysis to be
performed, as well as providing a less biased and more effective
screening approach (8).
The aim of the present study was to investigate the
regulation status of systematic genes in OS-induced endothelial
dysfunction through the exposure of cavernosal endothelial cells
(CECs) to xanthine/xanthine oxidase (X/XO). Differentially
expressed genes were further verified in CECs, as well as the
corpora cavernosa of normal and ED rats, in order to examine the
effects of OS in ED. This study is fundamental for the
identification of the dysregulated gene expression in OS-induced
endothelial dysfunction and its implication on the development of
ED.
Materials and methods
CEC preparation
The present study was approved by the ethics
committee of the Animal Care and Use Committee of School of
Medicine, Shanghai Jiao Tong University (Shanghai, China). A total
of six Sprauge-Dawley rats (age, two months) were purchased from
the Chinese Academy of Sciences (Beijing, China). The corpora
cavernosa of ED rats were cut into 1-mm3 sections and
digested by sterile-filtered collagenase type II (C6885,
CAS:9001-12-1; Sigma-Aldrich, St. Louis, MO, USA). The cell
suspension was then cultured with endothelial cell growth medium 2
(Lonza Group, Ltd., Basal, Switzerland) at 37°C and 5%
CO2. Magnetic activated cell sorting (MACS; Miltenyi
Biotec, Bergisch Gladbach, Germany) was used to process cells for
the subsequent incubation with mouse anti-rat CD31 (Abcam,
Cambridge, MA, USA) and anti-mouse immunoglobulin G microbeads
(Miltenyi Biotec) to obtain CECs. Trypan blue (0.4%; Sigma-Aldrich)
staining for 3 min was used to detect the survival of primary
cultured cells. The following two methods were used to determine
the CEC purity: i) Flow cytometric analysis (FACSCalibur) with FACS
Comp 3.1 software (machine and software from BD Biosciences,
Franklin Lakes, NJ, USA) was performed to detect the fluorescence
expression on the CEC surface. The negative control was treated
with a mouse homotypic polyclonal immunoglobulin G (ab37356; Abcam,
Cambridge, MA, USA) and the blank control was treated with
phosphate-buffered saline; and ii) anti-von Willebrand factor (vWF;
Abcam) immunofluorescence analysis was performed using a negative
control to identify the CEC purity.
Primary cultured corpora CECs were divided into two
groups. In treated group, OS in CECs (1××106)were
induced using 200 μM/l xanthine (Sigma-Aldrich) and 60 mU/l
xanthine oxidase (X/XO; Sigma-Aldrich) incubation for 48 h. These
two groups of primary cultured cells were used for microarray
analysis.
CEC RNA preparation
Total RNA of CECs was extracted using
TRIzol® reagent (Invitrogen Life Technologies, Carlsbad,
CA, USA), according to the manufacturer’s instructions, and was
further purified using an RNeasy mini kit (Qiagen, Shanghai, China)
and RNase-Free DNase set (Qiagen). RNA integrity numbers (RINs)
were calculated using an Agilent 2100 Bioanalyzer system (Agilent
Technologies, Inc., Santa Clara, CA, USA) to determine the
integrity of the RNA samples.
Microarray analysis
An oligonucleotide microarray (4×44K) with
>41,000 rat genome gene 60-mer oligonucleotides, containing the
whole rat genome, was obtained from Agilent Technologies, Inc.
Purified RNA was amplified and used to synthesize the first and
second strands of cDNA with the primer of T7 oligo(dT) (Agilent
Technologies, Inc.). Next, cRNA was obtained from the
double-stranded cDNA using a T7 Enzyme Mix (Agilent Technologies,
Inc.) and synthesized back to DNA using random primers (CapitalBio
Corporation, Beijing, China) following purification. Subsequently,
DNA production, from the RNAs of primary cultured cells, was
labeled using cyanine dye (2′-deoxycytidine 5′-triphosphate;
Agilent Technologies, Inc.) with random primers and Klenow enzyme
(Agilent Technologies, Inc.). Following labeling, the treated and
normal CEC samples were separately hybridized into the microarrays
and incubated for 17 h at 42°C. Following hybridization, the slides
were washed in staining dishes (Cat no. 121; Thermo Fisher
Scientific, Waltham, MA, USA) with Gene Expression Wash Buffer kit
(Cat no. 5188-5327; Agilent Technologies, Inc.) according to the
manufacturer’s instructions and then scanned using an Agilent
microarray scanner (G2565CA; Agilent Technologies, Inc.).
During microarray scanning, the microarray scanner
converted the fluorescence signal intensities into digital signals,
and the signals from each spot were captured and extracted from the
local background of total signal intensities. The raw data were
analyzed using the Feature Extraction software 10.7 and normalized
using the Gene Spring software 11.0 (Agilent Technologies, Inc.).
Quantile algorithms were used to normalize the data and the
uniformized data were qualified in analysis, allowing for
comparisons between the microarrays. Subsequently, the genes were
scored according to their normalized signal values. In order to
identify the differentially expressed genes in the treated CEC
group compared with the normal control group, fold-changes in the
signal intensities of the genes were compared with the local
background according to the following data-screening criteria: Gene
signal intensities with a fold-change of >0.5 or <2.0 were
omitted, while the differentially expressed genes were affirmed
when the fold-change in the signal intensities of the treated CEC
group compared with the normal control group was <0.5 or >2.0
(9). Next, the differentially
expressed genes were further analyzed using the online SBC analysis
system (SAS; version 8.0; Shanghai Biotechnologies Corporation,
Shanghai, China). SAS was used to facilitate the systematic
identification and categorization of differentially expressed genes
into signaling pathways through enrichment analysis of individual
probes representing certain genes and pathways (10,11).
Furthermore, SAS was used to investigate the association among the
specified genes and sets of functional genes that were part of
biologically relevant networks, according to a public
bioinformatics databases, including the Kyoto Encyclopedia of Genes
and Genomes (KEGG) (12) and the
Database for Annotation, Visualization and Integrated Discovery
(13), using a hypergeometric
distribution to conduct statistical analysis.
ED rat model and cavernosal tissue
preparation
As previously described (14), the rats in the ED group (n=6) were
anesthetized with intraperitoneal injection of sodium pentobarbital
(30 mg/kg; Sinopharm Chemical Reagen, Shanghai, China). An incision
was then made in the lower abdomen, followed by isolation and
triple ligation of the bilateral internal iliac arteries, which was
sustained for 12 weeks to establish the ED rat model. In order to
eliminate the interruption of compensatory mechanisms for erectile
function, the rats were subjected to a high-fat diet (10% egg yolk,
8% lard, 0.2% propylthiouracil, 0.5% bile salt and 4.8% salt) for
12 weeks to induce hyperlipidemia (15). The ED (n=6) and normal control rats
(n=3) were kept in a specific-pathogen-free environment. Evaluation
of the erectile function was performed using the intracavernosal
pressure (ICP) test, as previously described (16–18).
The rats were sacrificed by an intraperitoneal lethal injection of
sodium pentobarbital (60 mg/kg) and their corpora cavernosa were
obtained and ground into powder using liquid nitrogen. Total RNA of
these two groups of cavernosal tissues were extracted and used for
the in vivo validation of differentially expressed
genes.
Functional categories and in vivo
validation of differentially expressed genes
According to the gene microarray analysis and
pathway category results, four cell signaling transduction pathways
were selected for verification analysis, including the
cytokine-cytokine receptor interaction, nitrogen metabolism,
coagulation cascades and cell adherens. Among these signaling
pathways, Cxcl12, Tgfbr1, Asns, Bdkrb1 and Cdh3 genes were randomly
selected and further verified by reverse transcription-quantitative
polymerase chain reaction (RT-qPCR). The primers used in RT-qPCR
were designed with the Premier 5.0 software and confirmed using
Basic Local Alignment Search Tool analysis. GAPDH and β-actin were
used as the internal control genes for the ED rat model and
cultured CECs, respectively (Table
I). cDNA was obtained using a RevertAid First Strand CDNA
Synthesis kit (Fermentas, Waltham, MA, USA) for reverse
transcription and a reverse transcription instrument (Mastercycler
Gradient; Eppendorf, Hauppauge, NY, USA). Next, 20 μl
SYBR® Premix Ex Taq (Takara Bio, Inc., Otsu, Japan) was
added and RT-qPCR was performed using a Realplex Mastercycler Ep
Gradient S (Eppendorf) as follows: initial step of 60 sec at 95°C,
followed by 40 cycles of 5 sec at 95°C and 15 sec at annealing
temperatures (Table I). The
relative expression levels of targeted genes were normalized to the
expression levels of the internal control genes.
 | Table ISequences of primers used in reverse
transcription-quantitative polymerase chain reaction. |
Table I
Sequences of primers used in reverse
transcription-quantitative polymerase chain reaction.
| Genes | Primer sequences | Melting temperature
(°C) | Annealing temperature
(°C) | Amplified fragment
length (bp) |
|---|
| Cxcl12 | F,
5′-CATCAGTGACGGTAAGC-3′ | 54.6 | 55 | 120 |
| R,
5′-AGGGCACAGTTTGGAG-3′ | 54.1 | | |
| Tgfbr1 | F,
5′-GGCTTAGTATTCTGGG-3′ | 51.6 | 54.5 | 108 |
| R,
5′-TTCTTCAACGGATGG-3′ | 48.1 | | |
| Asns | F,
5′-AAACCAAATGGCAAAGT-3′ | 47.4 | 54 | 111 |
| R,
5′-CTCAAAGCCTGGGAAG-3′ | 54.1 | | |
| Bdkrb1 | F,
5′-CAGCCCTCTAACCGAAGC-3′ | 59.6 | 60 | 83 |
| R,
5′-CGATACAGCAGGTCCCAGTC-3′ | 61.9 | | |
| Cdh3 | F,
5′-CTATTAGCGTCATCTCC-3′ | 52.2 | 53 | 108 |
| R,
5′-CCTCGGCTGTTGTG-3′ | 52.9 | | |
| GAPDH | F,
5′-GCCTTCCGTGTTCCTA-3′ | 54.1 | 54 | 110 |
| R,
5′-AGACAACCTGGTCCTCA-3′ | 54.6 | | |
| β-actin | F,
5′-TCTGTGTGGATTGGTGGCTCTA-3′ | 60.1 | 60 | 135 |
| R,
5′-CTGCTTGCTGATCCACATCTG-3′ | 59.8 | | |
Statistical analysis
All the experimental data are presented as the mean
± standard deviation. Student’s t-test was used to analyze the
differences between the groups. In addition, the differentially
expressed genes of the treated CECs compared with the normal
control cells were summarized (fold-change, <0.5 or >2.0).
Analysis of the summarized oxidative injury-associated gene
information was then performed for the various signaling pathways
using SAS 3.0 software and differences in the results were
identified using the categorized signaling pathways in the gene
ontology (GO) and KEGG analysis. For the analysis of the RT-qPCR
results, the following equations were used: ΔCt = Ct −
internal control (Cti), and ΔΔCt = rat model
(ΔCt) + normal control (ΔCt). The relative
gene expression levels were calculated using the 2−ΔΔCt
method (19) and compared.
P<0.05 was considered to indicate a statistically significant
difference.
Results
Identification of CECs and RNA
quality
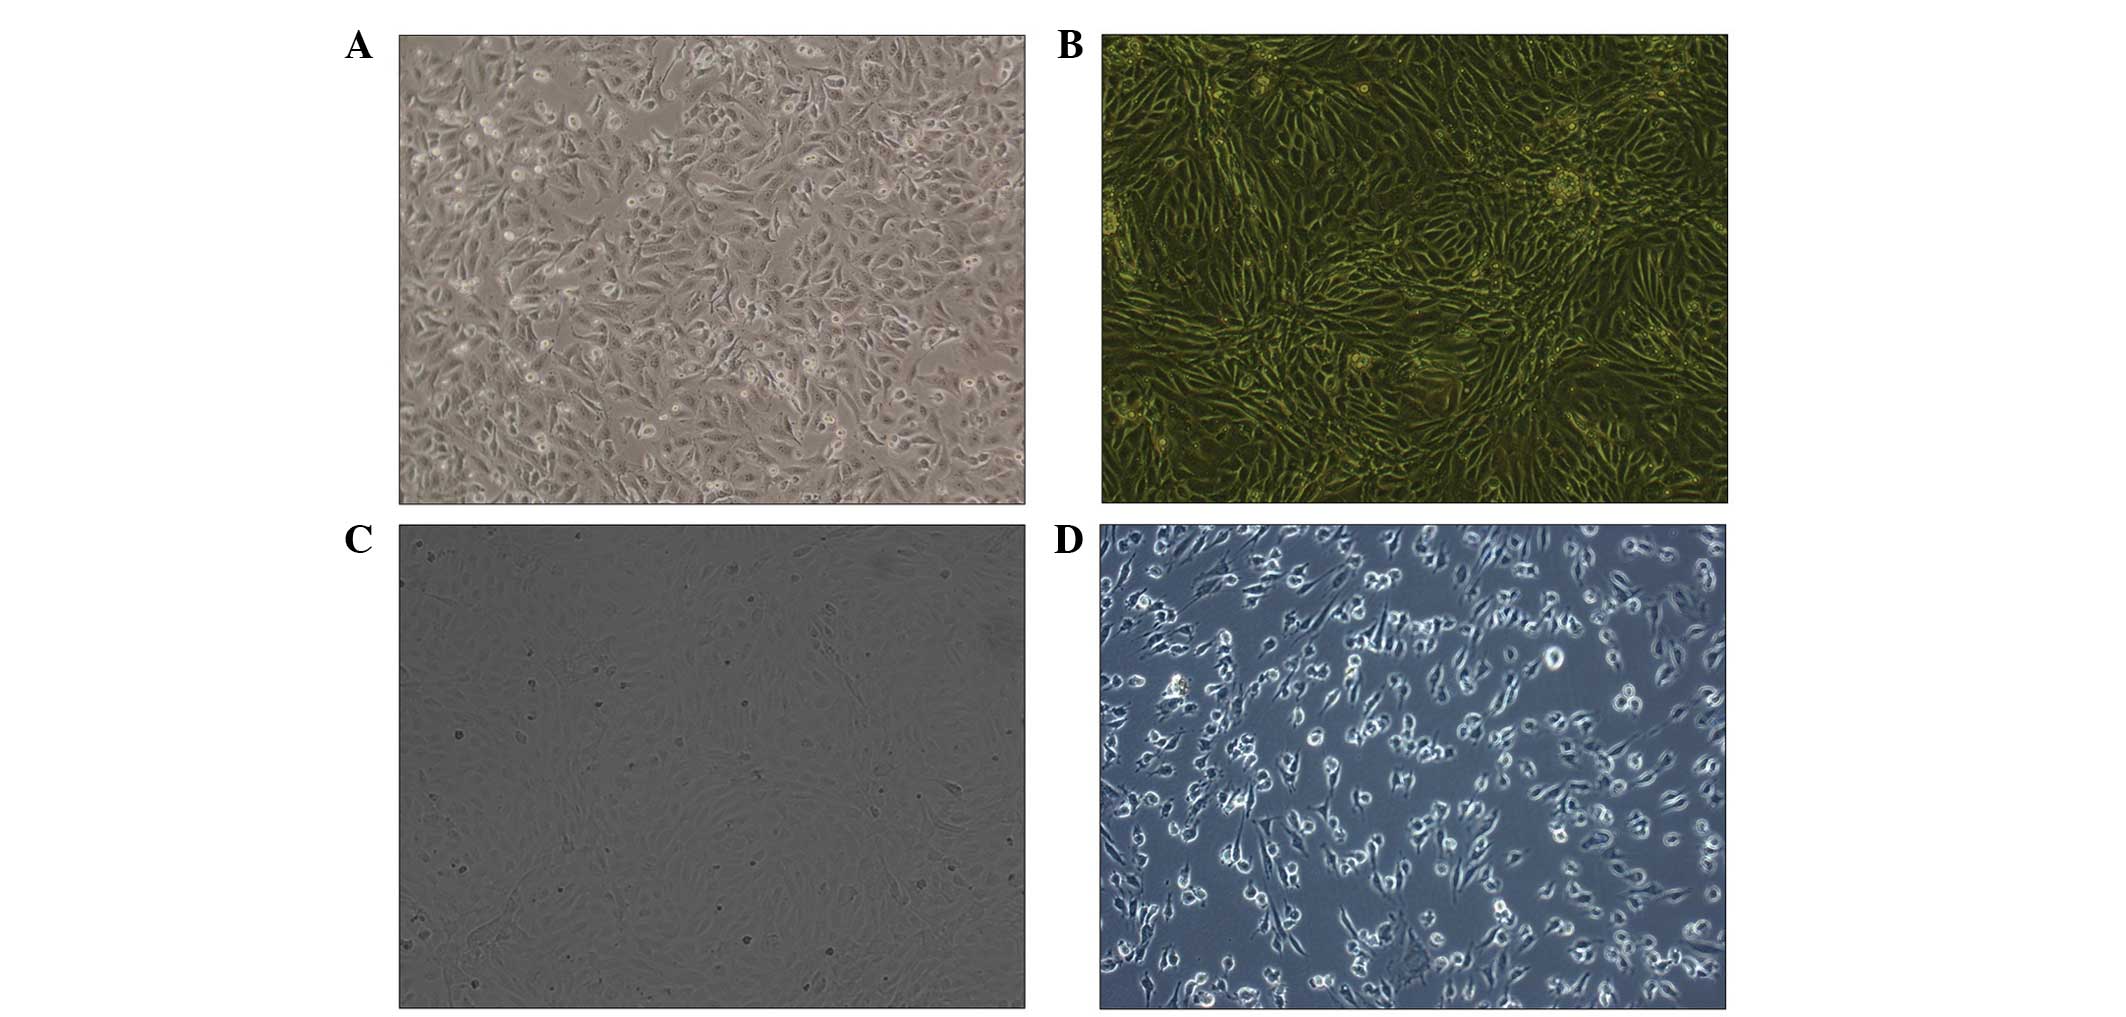
Differential staining techniques were used to
identify CECs, determine their survival rates and purity, as well
as confirm the induction of OS. As shown in Fig. 1A, trypan blue staining revealed
that the morphology of CECs was favorable, while the survival rate
was found to be 99%. The purity of the cell samples was determined
by the positive rate of anti-vWF and found to be 96% (Fig. 1B) compared with the negative
control cells (Fig. 1C). In
addition, the purity of CD31 cells was determined by flow cytometry
and found to be 92.7% (data not shown). Furthermore, the integrity
of RNA extracted from the CECs and the corpora cavernosa of ED rats
was demonstrated by RIN values of >0.7. In addition, the optical
density 260/280 ratio was found to be 1.9–2.05 for the CEC and rat
groups.
Screening for differentially expressed
genes
Out of the total genes tested (41012), the normal
and treated groups of the primary cultured cells were found to
express 13,090 (31.92%) and 12,039 (29.35%) of these genes,
respectively. A fold-change of 2.0 was considered to indicate
differentially expressed genes compared with the control group. A
total of 2,480 genes were found to be differentially expressed
between the X/XO-treated and normal control groups. In total, 1,454
genes were upregulated and 1,026 genes were downregulated in the
X/XO-treated group. The detailed expression profiles of the most
differentially expressed genes are illustrated in Table II.
| Table IIThe most downregulated and upregulated
genes in the treated cavernosal endothelial cell group. |
Table II
The most downregulated and upregulated
genes in the treated cavernosal endothelial cell group.
| A, Downregulated
genes |
|---|
|
|---|
| Gene ID | Fold change | Symbol | Chromosome | Description |
|---|
| 311311 | 0.0301 | Meis2 | 3 | Meis homeobox 2 |
| 290409 | 0.0325 | Olfm4 | 15 | Olfactomedin 4 |
| 292138 | 0.0327 | Eno4 | 1 | Similar to enolase
(46.6 kD; 2J223) |
| 310178 | 0.0328 | Myo10 | 2 | Myosin X |
| 79430 | 0.0339 | Clcnkb | 5 | Chloride channel
Kb |
| 83579 | 0.0374 | Gnb5 | 8 | Guanine nucleotide
binding protein, β-polypeptide 5 |
| 83469 | 0.0378 | Lrp4 | 3 | Low density
lipoprotein receptor-associated protein 4 |
| 353227 | 0.0387 | Zbtb16 | 8 | Zinc finger and BTB
domain containing 16 |
| 302983 | 0.0409 | Mapk8ip3 | 10 | Mitogen-activated
protein kinase 8 interacting protein 3 |
| 362061 | 0.0479 | Cryz | 2 | Crystallin ζ |
| 362911 | 0.0510 | Mal2 | 7 | Mal, T-cell
differentiation protein 2 |
| 290989 | 0.0559 | Catsper3 | 17 | Cation channel,
sperm-associated 3 |
| 315883 | 0.0582 | Plscr2 | 8 | Phospholipid
scramblase 2 |
| 685846 | 0.0587 | Adam34 | 16 | A disintegrin and
metallopeptidase domain 34 |
| 64896 | 0.0644 | Nolc1 | 1 | Nucleolar and
coiled-body phosphoprotein 1 |
| 309486 | 0.0650 | Tctn3 | 1 | Tectonic family
member 3 |
| 171576 | 0.0674 | Bub1b | 3 | Budding uninhibited
by benzimidazole 1 homolog mitotic check point serine/threonine
kinase B |
| 302746 | 0.0700 | Mageb3 | X | Melanoma antigen
family B, 3 |
| 293808 | 0.0713 | Olr375 | 1 | Olfactory receptor
375 |
| 309430 | 0.0714 | Dmrt2 | 1 | Doublesex and mab-3
associated transcription factor 2 |
| 362867 | 0.0743 | Mybpc1 | 7 | Myosin binding
protein C, slow type |
| 683313 | 0.0786 | LOC683313 | - | Similar to keratin
complex 2, basic, gene 6a |
| 360718 | 0.0807 | Popdc2 | 11 | Popeye
domain-containing 2 |
| 307545 | 0.0816 | Elp2 | 18 | Elongation protein
2 homolog (S. cerevisiae) |
| 682105 | 0.0840 | Reep2 | - | Receptor accessory
protein 2 |
| 367012 | 0.0842 | Ddi1 | 8 | DNA-damage
inducible 1, homolog 1 (S. cerevisiae) |
| 293897 | 0.0851 | Dkk1 | 1 | Dickkopf homolog 1
(Xenopus laevis) |
| 365894 | 0.0887 | Trim33 | 2 | Tripartite
motif-containing 33 |
| 503269 | 0.0923 | Rab17 | 9 | RAB17, member RAS
oncogene family |
| 24772 | 0.1626 | Cxcl12 | 4 | Chemokine (C-X-C
motif) ligand 12 (stromal cell-derived factor 1) |
| 116777 | 0.2532 | Cdh3 | 19 | Cadherin 3, type 1,
P-cadherin |
|
| B, Upregulated
genes |
|
| Gene ID | Fold change | Symbol | Chromosome | Description |
|
| 85430 | 26.6004 | Herpud1 | 19 |
Homocysteine-inducible, endoplasmic
reticulum stress-inducible, ubiquitin-like domain member 1 |
| 25617 | 24.0456 | Hspa5 | 3 | Heat shock protein
5 |
| 25211 | 23.6140 | Lyz2 | 7 | Lysozyme 2 |
| 501624 | 16.4694 | Bex4 | X | Brain expressed
gene 4 |
| 298961 | 15.4885 | Agr2 | 6 | Anterior gradient
homolog 2 (Xenopus laevis) |
| 295827 | 15.1051 | Olr597 | 3 | Olfactory receptor
597 |
| 362196 | 15.0231 | Chac1 | 3 | ChaC, cation
transport regulator homolog 1 |
| 310738 | 14.6384 | Ngf | 2 | Nerve growth factor
(β polypeptide) |
| 691491 | 13.8911 | LOC691491 | - | Similar to Discs
large homolog 5 (placenta and prostate DLG) (discs large protein
P-dlg) |
| 304423 | 13.2743 | Tyw1 | 12 | tRNA-yW
synthesizing protein 1 homolog (S. cerevisiae) |
| 363288 | 13.2692 | Kif1a | 9 | Kinesin family
member 1A |
| 25059 | 13.1816 | Hk2 | 4 | Hexokinase 2 |
| 65155 | 12.7013 | Alas1 | 8 | Aminolevulinate,
δ-, synthase 1 |
| 685504 | 12.2517 | Clgn | 19 | Calmegin |
| 83477 | 12.0425 | Bcl10 | 2 | B-cell CLL/lymphoma
10 |
| 295750 | 11.6351 | Olr484 | 3 | Olfactory receptor
484 |
| 307302 | 11.3526 | Cep120 | 18 | Centrosomal protein
120 kDa |
| 59322 | 10.8133 | Cnksr2 | X | Connector enhancer
of kinase suppressor of Ras 2 |
| 297417 | 10.1839 | Gfpt1 | 4 | Glutamine
fructose-6-phosphate transaminase 1 |
| 29393 | 10.1525 | Col1a1 | 10 | Collagen, type I, α
1 |
| 59295 | 10.0863 | Nucb2 | 1 | Nucleobindin 2 |
| 24908 | 10.0724 | Dnajb9 | 6 | DnaJ (Hsp40)
homolog, subfamily B, member 9 |
| 405265 | 10.0530 | Olr995 | 7 | Olfactory receptor
995 |
| 362096 | 9.7722 | Setx | 3 | Senataxin |
| 116595 | 9.5982 | Nrxn2 | 1 | Neurexin 2 |
| 304376 | 9.5251 | Nyap1 | 12 | Neuronal
tyrosine-phosphorylated phosphoinositide-3-kinase adaptor 1. |
| 29215 | 9.3834 | Arg2 | 6 | Arginase type
II |
| 290997 | 9.3682 | Uimc1 | 17 | Ubiquitin
interaction motif containing 1 |
| 313255 | 9.3223 | Cip98 | 5 | CASK-interacting
protein CIP98 |
| 364755 | 9.0523 | Ero1lb | 17 | ERO1-like β (S.
cerevisiae) |
| 29591 | 4.5276 | Tgfbr1 | 5 | Transforming growth
factor, β receptor 1 |
| 25612 | 6.4865 | Asns | 4 | Asparagine
synthetase |
| 81509 | 2.7644 | Bdkrb1 | 6 | Bradykinin receptor
B1 |
Screening for signaling pathways in
relevant databases
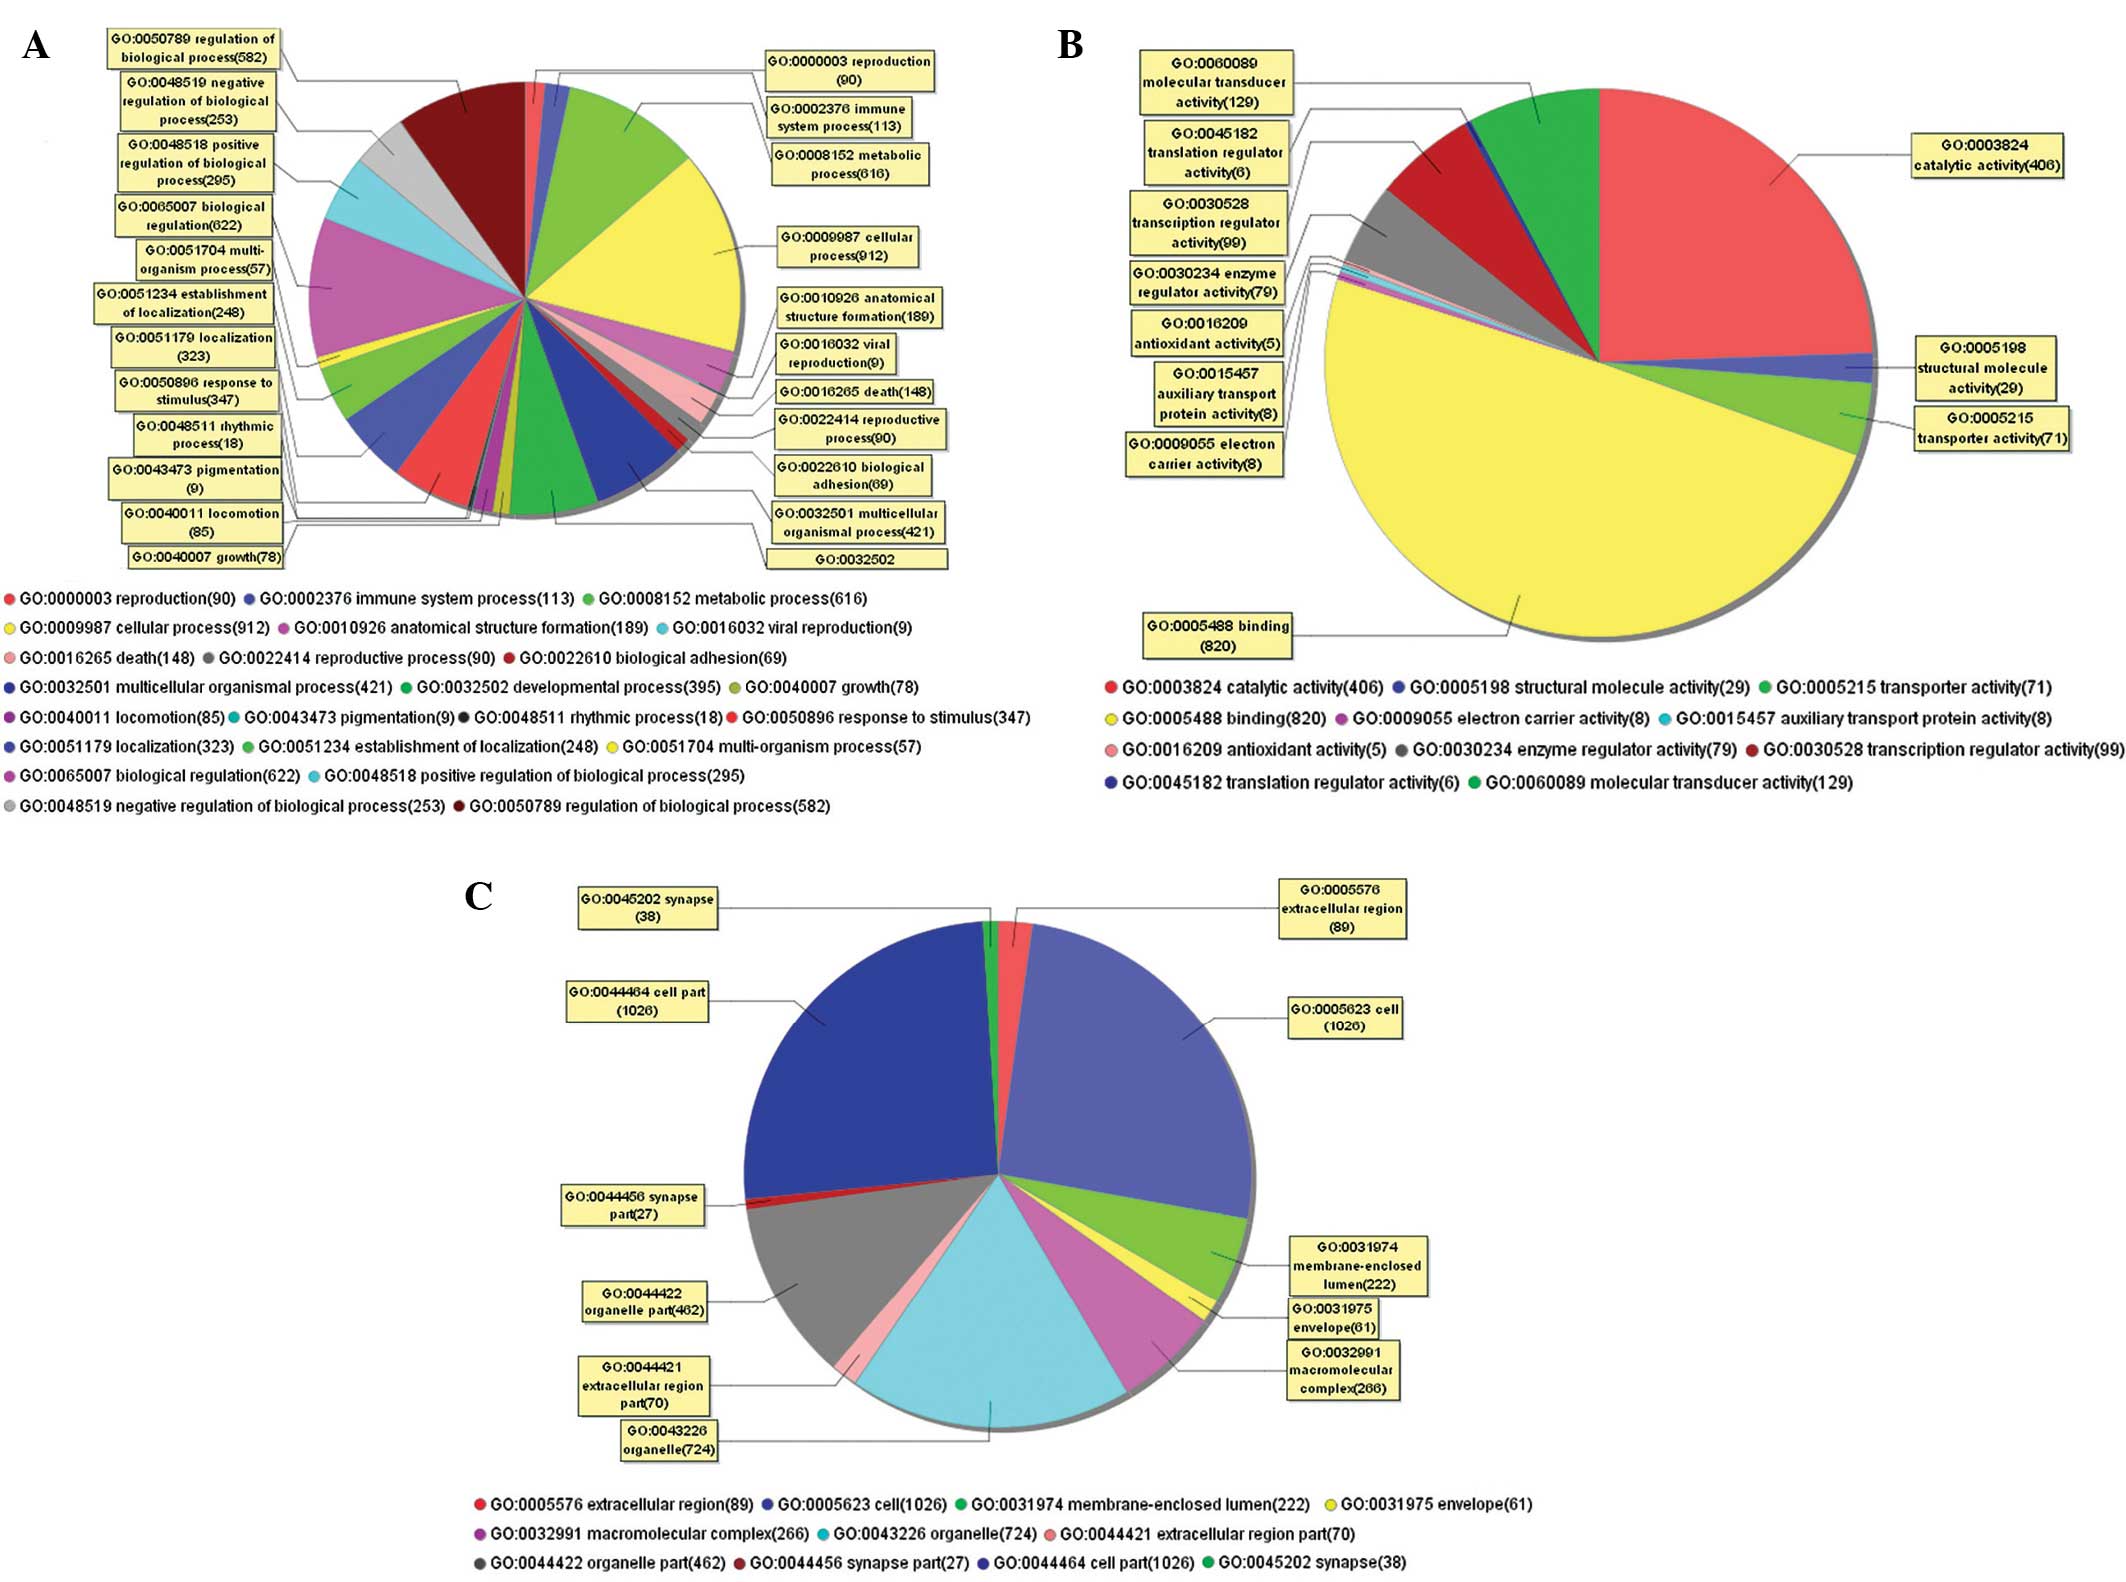
GO analysis was performed and the differentially
expressed genes were further categorized according to biological
processes, molecular functions and cellular components. In the
differentially expressed genes associated with biological
processes, the cellular and metabolic processes were found to
account for 30.1%. In the molecular function categorization, 54% of
differentially expressed genes were associated with binding,
particularly protein binding (72.3%). In the analysis of cellular
components, the cell part and cell were the most prevalent gene
types (Fig. 2).
ED rat model establishment
ICP testing revealed a significantly lower peak in
the ED rat model group (3.21±1.20 mmHg) compared with the control
rat group (32.89±6.42 mmHg; P<0.05). Furthermore, the duration
of erection was markedly shorter in the ED rats compared with the
normal control rats, indicating that erectile dysfunction was
induced in the ED rat model group.
Differentially expressed gene
verification in vivo
The expression levels of Cxcl12, Tgfbr1, Asns,
Bdkrb1 and Cdh3 genes were analyzed using RT-qPCR (Fig. 3). The results revealed that the
gene expression levels of Cxcl12 and Cdh3 were significantly
downregulated in the ED rat group compared with the normal control
rat group (0.16- and 0.25-fold change, respectively; P=0.000294 and
P=0.0001, respectively). By contrast, Tgfbr1 expression was
significantly upregulated in the ED rat group (4.53-fold; P=0.028).
The gene expression levels of Asns and Bdkrb1 were slightly
increased in the ED rat group; however, the increase was not
statistically significant compared with the normal control rat
group. All the variation trends were consistent with the variations
observed in the microarray results.
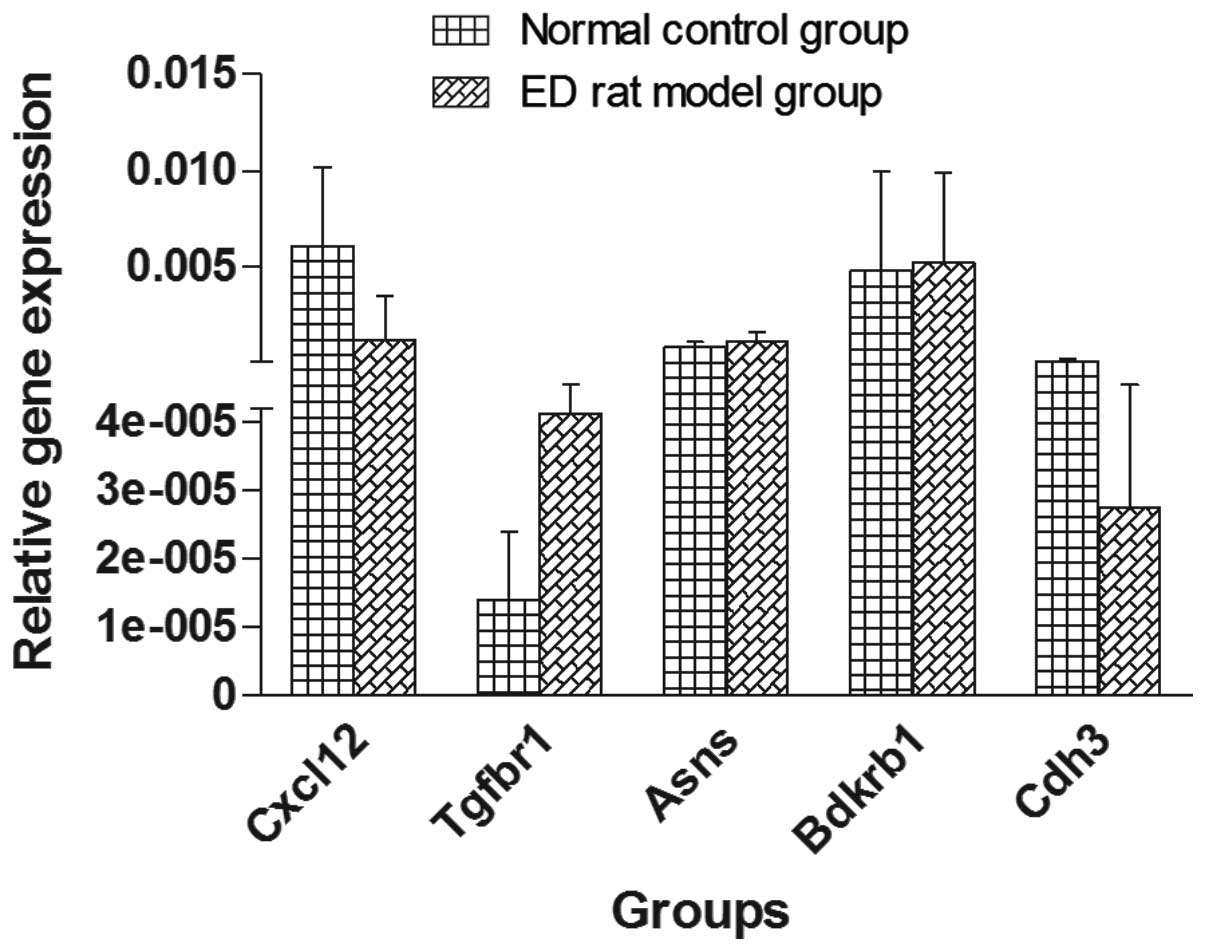 | Figure 3Reverse transcription-quantitative
polymerase chain reaction was performed to determine the relative
gene expression of five selected genes. Relative gene expression
levels in ED rat models compared with those of the normal control
group, respectively, were as follows: Cxcl12, 0.00123 vs. 0.00606;
and Cdh3, 0.0000275 vs. 0.0000818, were decreased; whereas Tgfbr1,
0.0000413 vs. 0.000014; Asns, 0.00113 vs. 0.000834; and Bdkrb1,
0.00519 vs. 0.00478, were increased. Trends in genes expression
were comparable to those of the gene microarrays. ED, erectile
dysfunction. |
Discussion
Artery injury or ligation, diabetes mellitus,
smoking, dyslipidemia and hypertension are closely associated with
ED and may also induce OS (1,2).
Previous studies have demonstrated that OS and endothelial
dysfunction were independent risk factors in the development of ED;
however, associations among these three factors had not been widely
explored. The pathogenic effect of OS in CECs and the associated
endothelial dysfunction have been hypothesized to result in
subsequential ED.
The results of the present study indicated that OS
may lead to endothelial dysfunction through the upregulation or
downregulation of cell signaling pathways involved in the secretion
of inflammatory factors, NO metabolism, coagulation cascades and
the expression of cell-surface adhesion molecules.
The genes validated in the present study were found
to be differentially expressed in the aforementioned pathways.
Genes associated with inflammatory factor reactions included
Cxcl12, which was downregulated (0.16-fold), and Tgfbr1, which was
upregulated (4.53-fold). Farouk et al (20) performed a genome-wide association
study, which suggested that Cxcl12 was a potential target for
atherosclerosis, vascular thrombosis and other diseases associated
to endothelial dysfunction. In addition, Ho et al (21) reported that increased levels of
stromal cell-derived factor 1 restored endothelial progenitor cells
and increased local blood flow and perfusion, which may improve the
symptoms of peripheral vascular disease and facilitate the recovery
of injured tissue (22). Sengupta
et al (23) studied the
gene expression network in diabetes mellitus and identified that
Tgfbr1 was able to induce OS. In addition, the authors verified
that Tgfbr1 interacted with β-catenin, which gave rise to
endothelial dysfunction via the Smad pathway. In the present study,
the NO metabolism-associated gene, Asns, was found to be
upregulated (6.49-fold difference). Fujita et al (22) also found Asns to be upregulated in
impaired oxidative energy metabolism in a study on mitochondrial
DNA mutation associations with mitochondrial dysfunction.
Furthermore, these authors verified that mutated mitochondrial DNA
promoted Asns expression through enhancing ATF4 gene expression. In
the present study, Bdkrb1, which is associated with coagulation
cascades, was found to be upregulated (2.76-fold) in ED rats.
Bachvarov et al (24) also
demonstrated that Bdkrb1 was upregulated in response to tissue
injury or inflammation (25),
while Kakoki et al (26)
found that Bdkrb1 played an important role in relieving DNA damage
and apoptosis, as well as maintaining the morphology and function
of the kidneys. The present study also identified that the Cdh3
gene, which is associated with adhesion molecules, was
downregulated (0.25-fold) in ED rats. Faraldo et al
(27) previously reported that
Cdh3 participated in the regulation of cell growth and
differentiation. In addition, Yagi et al (28) proposed that cadherin was essential
in the calcium-dependent cell-cell adhesion membrane glycoprotein
at the adhesion junction, which also implied that functional
proteins may be affected if the gene was misregulated.
In the present study, the candidate genes were found
to be closely associated with OS, while the signaling pathways that
these genes participate in were also found to be intimately
co-associated with the pathogenesis of OS. Four signaling pathways
and their key genes were selected for further verification and the
results supported the effect of these OS-associated signaling
pathways in endothelial dysfunction, which were also found to be
differentially regulated in ED rats.
The trends of the candidate genes selected were
consistent with the microarray analysis results; however, certain
limitations are present in the current study. Bilateral internal
iliac artery-ligation with hyperlipidemia may not fully reflect the
morphological changes observed in the majority of ED patients,
since morphological evidence from patients was not presented. In
addition, various signaling pathways and differentially expressed
genes were identified; however, only a minority of these were
further investigated. Future functional verification is, therefore,
required to confirm the conclusions of the present study and
further elucidate the mechanisms of OS in ED.
In conclusion, the results of the present study
identified and verified the dysregulation of OS-associated genes
and signaling pathways in CECs and rats. These results indicated
that the mechanisms of OS-induced endothelial dysfunction may
proceed via the regulation of the identified genes and signaling
pathways, which may also be involved in the development of ED.
Further functional verification is required in order to elucidate
the underlying mechanisms and signaling pathways associated with OS
in ED.
Acknowledgements
This study was supported by major scientific and
technological issues from the Science and Technology Commission of
Shanghai Municipality, P.R. China (grant no. 08411951800).
References
|
1
|
Barrett-Connor E: Heart disease risk
factors predict erectile dysfunction 25 years later (the Rancho
Bernardo Study). Am J Cardiol. 96:3M–7M. 2005. View Article : Google Scholar
|
|
2
|
Mulhall J, Teloken P, Brock G and Kim E:
Obesity, dyslipidemias and erectile dysfunction: a report of a
subcommittee of the sexual medicine society of North America. J Sex
Med. 3:778–786. 2006. View Article : Google Scholar : PubMed/NCBI
|
|
3
|
Zhang Q, Radisavljevic ZM, Siroky MB and
Azadzoi KM: Dietary antioxidants improve arteriogenic erectile
dysfunction. Int J Androl. 34:225–235. 2011. View Article : Google Scholar
|
|
4
|
Costa C and Virag R: The
endothelial-erectile dysfunction connection: an essential update. J
Sex Med. 6:2390–2404. 2009. View Article : Google Scholar : PubMed/NCBI
|
|
5
|
Musicki B, Liu T, Lagoda GA, et al:
Hypercholesterolemia induced erectile dysfunction: endothelial
nitric oxide synthase (eNOS) uncoupling in the mouse penis by NAD
(P)H oxidase. J Sex Med. 7:3023–3032. 2010. View Article : Google Scholar : PubMed/NCBI
|
|
6
|
Morano S, Gatti A, Mandosi E, et al:
Circulating monocyte oxidative activity is increased in patients
with type 2 diabetes and erectile dysfunction. J Urol. 177:655–659.
2007. View Article : Google Scholar : PubMed/NCBI
|
|
7
|
Azadzoi KM, Golabek T, Radisavljevic ZM,
Yalla SV and Siroky MB: Oxidative stress and neurodegeneration in
penile ischaemia. BJU Int. 105:404–410. 2010. View Article : Google Scholar
|
|
8
|
Sullivan CJ, Teal TH, Luttrell IP, Tran
KB, Peters MA and Wessells H: Microarray analysis reveals novel
gene expression changes associated with erectile dysfunction in
diabetic rats. Physiol Genomics. 23:192–205. 2005. View Article : Google Scholar : PubMed/NCBI
|
|
9
|
Tusher VG, Tibshirani R and Chu G:
Significance analysis of microarrays applied to the ionizing
radiation response. Proc Natl Acad Sci USA. 98:5116–5121. 2001.
View Article : Google Scholar : PubMed/NCBI
|
|
10
|
Agresti A: A survey of exact inference for
contingency tables. Stat Sci. 7:131–153. 1992. View Article : Google Scholar
|
|
11
|
Storey JD, Taylor JE and Siegmund D:
Strong control, conservative point estimation and simultaneous
conservative consistency of false discovery rates: a unified
approach. J R Stat Soc Series B. 66:187–205. 2004. View Article : Google Scholar
|
|
12
|
Nakaya A, Katayama T, Itoh M, et al: KEGG
OC: a large-scale automatic construction of taxonomy-based ortholog
clusters. Nucleic Acids Res. 41:D353–D357. 2013. View Article : Google Scholar :
|
|
13
|
Huang DW, Sherman BT and Lempicki RA:
Systematic and integrative analysis of large gene lists using DAVID
Bioinformatics Resources. Nature Protoc. 4:44–57. 2009. View Article : Google Scholar
|
|
14
|
Abe Y, Hotta Y, Okumura K, Kataoka T,
Maeda Y and Kimura K: Temporal changes in erectile function and
endothelium-dependent relaxing response of corpus cavernosal smooth
muscle after ischemia by ligation of bilateral internal iliac
arteries in the rabbit. J Pharmacol Sci. 120:250–253. 2012.
View Article : Google Scholar : PubMed/NCBI
|
|
15
|
Lee MC, El-Sakka AI, Graziottin TM, Ho HC,
Lin CS and Lue TF: The effect of vascular endothelial growth factor
on a rat model of traumatic arteriogenic erectile dysfunction. J
Urol. 167:761–767. 2002. View Article : Google Scholar : PubMed/NCBI
|
|
16
|
Albersen M, Fandel TM, Zhang H, et al:
Pentoxifylline promotes recovery of erectile function in a rat
model of postprostatectomy erectile dysfunction. Eur Urol.
59:286–296. 2011. View Article : Google Scholar :
|
|
17
|
Wang J, Wang Q, Liu B, Li D, Yuan Z and
Zhang H: A Chinese herbal formula, Shuganyiyang capsule, improves
erectile function in male rats by modulating Nos-CGMP mediators.
Urology. 79:241.e1–241.e6. 2012. View Article : Google Scholar
|
|
18
|
Albersen M, Lin G, Fandel TM, et al:
Functional, metabolic, and morphologic characteristics of a novel
rat model of type 2 diabetes-associated erectile dysfunction.
Urology. 78:476.e1–476.e8. 2011. View Article : Google Scholar
|
|
19
|
Livak KJ and Schmittgen TD: Analysis of
relative gene expression data using real-time quantitative PCR and
the 2 (−Delta Delta C(T)) method. Methods. 25:402–408. 2001.
View Article : Google Scholar
|
|
20
|
Farouk SS, Rader DJ, Reilly MP and Mehta
NN: CXCL12: a new player in coronary disease identified through
human genetics. Trends Cardiovasc Med. 20:204–209. 2010. View Article : Google Scholar : PubMed/NCBI
|
|
21
|
Ho TK, Shiwen X, Abraham D, Tsui J and
Baker D: Stromal-cell-derived factor-1 (SDF-1)/CXCL12 as potential
target of therapeutic angiogenesis in critical leg ischaemia.
Cardiol Res Pract. 2012:1432092012.PubMed/NCBI
|
|
22
|
Lau TT and Wang DA: Stromal cell-derived
factor-1 (SDF-1): homing factor for engineered regenerative
medicine. Expert Opin Biol Ther. 11:189–197. 2011. View Article : Google Scholar : PubMed/NCBI
|
|
23
|
Sengupta U, Ukil S, Dimitrova N and
Agrawal S: Expression-based network biology identifies alteration
in key regulatory pathways of type 2 diabetes and associated
risk/complications. PLoS One. 4:e81002009. View Article : Google Scholar : PubMed/NCBI
|
|
24
|
Fujita Y, Ito M, Nozawa Y, Yoneda M,
Oshida Y and Tanaka M: CHOP (C/EBP homologous protein) and ASNS
(asparagine synthetase) induction in cybrid cells harboring MELAS
and NARP mitochondrial DNA mutations. Mitochondrion. 7:80–88. 2007.
View Article : Google Scholar : PubMed/NCBI
|
|
25
|
Bachvarov DR, Hess JF, Menke JG, Larrivée
JF and Marceau F: Structure and genomic organization of the human
B1 receptor gene for kinins (BDKRB1). Genomics. 33:374–381. 1996.
View Article : Google Scholar : PubMed/NCBI
|
|
26
|
Kakoki M, McGarrah RW, Kim HS and Smithies
O: Bradykinin B1 and B2 receptors both have protective roles in
renal ischemia/reperfusion injury. Proc Natl Acad Sci USA.
104:7576–7581. 2007. View Article : Google Scholar : PubMed/NCBI
|
|
27
|
Faraldo MM, Teulière J, Deugnier MA, et
al: beta-Catenin regulates P-cadherin expression in mammary basal
epithelial cells. FEBS Lett. 581:831–836. 2007. View Article : Google Scholar : PubMed/NCBI
|
|
28
|
Yagi T and Takeichi M: Cadherin
superfamily genes: functions, genomic organization, and neurologic
diversity. Genes Dev. 14:1169–1180. 2000.PubMed/NCBI
|