Introduction
Ovarian cancer is the most lethal gynecological
malignancy worldwide. According to the International Agency for
Research on Cancer for 2008, ~225,500 individuals were diagnosed
with ovarian cancer and 140,200 cases were fatal (1). Epithelial ovarian cancer accounts for
~90% of all ovarian malignancies, and the majority of patients are
asymptomatic until the later stages of the disease, contributing to
the high levels of mortality associated with this disease (2,3). The
precise factors that initiate ovarian carcinogenesis remain
unclear, however it is generally accepted that ovarian cancer has
numerous etiological factors, including genetic alteration,
hormonal factors and some life-style factors (4,5).
Despite rapid advancement of medical and surgical
treatments, as well as the development of novel drugs and
chemotherapy regimens for patients with ovarian cancer, the
prognosis has not significantly improved. The average five-year
survival rate of patients with advanced stage ovarian cancer ranges
between 20 and 30% (6). The
pathogenesis of ovarian carcinoma is a multi-step process,
including oncogene activation and/or inactivation of tumor
suppressor genes (7). Ovarian
cancer has been widely studied; however, the search for specific
gene alterations has been insufficient and the identification of
molecular markers that are present in ovarian carcinoma cells,
which may serve as reliable biomarkers, remains limited.
Astrocyte-elevated gene (AEG)-1, also known as
metadherin and LYRIC/3D3, was originally cloned and characterized
as a human immunodeficiency virus-1-inducible gene, in primary
human fetal astrocytes (8,9). Elevated expression of AEG-1 has been
observed in various types of human cancer, including breast,
esophageal, hepatocellular, colorectal, prostate and ovarian cancer
(10–15). Furthermore, previous studies have
shown that AEG-1 has an important role in cell growth and
proliferation, angiogenesis, chemoresistance, invasion, and
metastasis by activating numerous signaling pathways (16–18),
such as phosphoinositide 3-kinase (PI3K)-Akt (11,14)
nuclear factor-κB (19), and
mitogen activated protein kinase (MAPK) and Wnt pathways (12). Notably, AEG-1 itself is a
downstream target molecule of oncogenic Ha-ras and c-myc, and
mediates their growth promoting effects (20). However, studies regarding the
underlying mechanisms of AEG-1 in ovarian cancer are lacking.
In the present study, immunohistochemistry (IHC) was
used to investigate the expression of AEG-1 in patients with
ovarian cancer and its association with certain clinical
parameters. In addition, the effect of AEG-1 on ovarian cancer
cells was also evaluated.
Materials and methods
Cell lines and culture conditions
SKOV-3 human ovarian cancer cells from the American
Type Culture Collection (Manassas, VA, USA) were cultured in
RPMI-1640 medium (Gibco Life Technologies, Carlsbad, CA, USA)
supplemented with 10% fetal bovine serum (FBS; Gibco Life
Technologies Carlsbad, CA, USA), 100 U/ml penicillin (KeyGen,
Nanjing, China), and 100 mg/l streptomycin (KeyGen), in a
humidified atmosphere containing 5% CO2 at 37°C.
Patients and tissues
Formalin-fixed and paraffin-embedded tissue samples
from 138 patients with epithelial ovarian tumors were obtained from
the archives of the Department of Pathology, Zhongda Hospital,
Southeast University (Nanjing, China). The tumor samples included
epithelial ovarian cancer (n=73), borderline tumor (n=10) and
benign cystadenoma (n=55). In addition, 10 normal ovaries from
hysterectomy specimens were resected for non-ovarian disease, in
Zhongda Hospital (Nanjiing, China), and were analyzed by IHC. None
of the patients had received chemotherapy prior to surgery.
The age of the patients with ovarian cancer ranged
between 38 and 82 years, with a median age of 56 years. Tumor
staging was conducted according to the International Federation of
Gynecology and Obstetrics (FIGO) system (21). Tumors were assessed according to
the Silverberg grading system. The clinicopathological features of
the patients with ovarian cancer, including age, histological type,
differentiation degree, lymph node metastasis and clinical stage
are summarized in Table I. The
study was approved by the Ethics Committee of Zhongda Hospital
Affiliated to Southeast University, and conducted in accordance
with the principles defined in the Declaration of Helsinki.
Informed consent was exempted by the board due to the retrospective
nature of the research. All information regarding the human
material used in the present study was managed using anonymous
numerical codes.
 | Table IResults of immunohistochemistry and
clinicopathological characteristics of the patients. |
Table I
Results of immunohistochemistry and
clinicopathological characteristics of the patients.
| | Astrocyte-elevated
gene-1 | |
|---|
| |
| |
|---|
| Characteristic | Cases (n) | Low expression no.
(%) | High expression no.
(%) | P-value |
|---|
| Total | | | | <0.001 |
| Benign
cystadenomas | 55 | 48 | 7 | |
| Borderline
tumors | 10 | 7 | 3 | |
| Carcinomas | 73 | 21 | 52 | |
| Age (years) | | | | 0.193 |
| ≤55 | 33 | 12 | 21 | |
| >55 | 40 | 9 | 31 | |
| Histological
type | | | | 0.214 |
| Serous | 55 | 13 | 42 | |
| Mucinous | 8 | 4 | 4 | |
| Other | 10 | 4 | 6 | |
| Differentiation
degree (Silveberg) | | | | 0.004 |
| G1 | 7 | 5 | 2 | |
| G2 | 30 | 11 | 19 | |
| G3 | 36 | 5 | 31 | |
| Lymph node
metastasis | | | | 0.009 |
| No | 54 | 20 | 34 | |
| Yes | 19 | 1 | 18 | |
| Clinical stage | | | | 0.006 |
| I | 17 | 10 | 7 | |
| II | 15 | 4 | 11 | |
| III/IV | 41 | 7 | 34 | |
Antibodies
Rabbit monoclonal anti-AEG-1 antibody was obtained
from Epitomics (dilution 1:1,000; Burlingame, CA, USA). Rabbit
polyclonal anti-AKT, anti-phospho-AKT (Ser473), anti-extracellular
signal-regulated kinase (ERK1/2), anti-phospho-ERK1/2 (Tyr204),
anti-glycogen synthase kinase (GSK)/3β, anti-phospho-GSK3β (Ser9),
anti-forkhead box (FOXO) 3α and anti-phospho-FOXO3α (Ser253)
antibodies were obtained from Signalway Antibody (College Park,
Maryland, USA). All were diluted to 1:1,000. Rabbit polyclonal
anti-β-actin was purchased from ZSGB-Bio (Beijing, China).
Small interfering (si)RNA
transfection
A pcDNA3.1 vector overexpressing human AEG-1 was
generated by subcloning the PCR-amplified human AEG-1 coding
sequence into the pcDNA3.1 vector (Ambion, Austin, TX, USA). To
silence endogenous AEG-1, the AEG-1 siRNA oligonucleotides (sense
5′-GUUACCACCGAGCAACUUADTDT-3′ and antisense
5′-UAAGUUGCUCGGUGGUAACDTDT-3′) were synthesized by Biomics
Biotechnologies (Biomic, Nantong, China). The control cells were
transfected with universal negative control (NC) siRNA (Biomics,
Jiang Su, China). The siRNA transfection of the SKOV3 cells was
performed in six-well plates using Lipofectamine® 2000
(Invitrogen Life Technologies, Invitrogen, CA, USA), according to
the manufacturer’s instructions.
Immunohistochemical staining
Immunohistochemical staining was performed to study
protein expression levels in all of the tissue samples, using the
Ultrasensitive S-P kit and diaminobenzidine (Maixin-Bio Co.,
Fuzhou, China). Briefly, unstained 4 μm tissue sections were cut
from the selected paraffin blocks and deparaffinized by routine
techniques (22). Antigen
retrieval was performed by placing the slides in boiling citric
acid buffer (KeyGen) at pH 6.0 for 10 min, the slides were then
treated with 3% hydrogen peroxide (Maixin-Bio Co., Fuzhou, China)
to quench the endogenous peroxidase activity, followed by
incubation with 10% normal goat serum (Maixin-Bio Co.) to block the
non-specific binding. The slides were then incubated with a primary
antibody specifically targeting AEG-1 (dilution 1:200; Epitomics,
Burlingame, CA, USA) overnight at 4°C. The sections were then
washed with PBS and incubated with a biotin-labeled secondary
antibody (Maixin-Bio Co.), followed by horseradish
peroxidase-conjugated streptavidin (Maixin-Bio Co.) for 10 min. The
slides were then exposed to a 3,3′-diaminobenzidine
tetrahydrochloride substrate kit (ZSGB-Bio) and counterstained with
hematoxylin (KeyGen).
Staining assessment and scoring
The AEG-1 expression levels were classified
semi-quantitatively, based on the proportion of positively stained
tumor cells and the intensity of the staining. The proportion of
positive cells was scored as follows: 0, no positive tumor cells;
1, <10% positive tumor cells; 2, 10–50% positive tumor cells;
and 3, >50% positive tumor cells. The intensity of staining was
graded according to the following criteria: 0, no staining; 1, weak
staining; 2, moderate staining; and 3, strong staining. The
staining intensity score was multiplied by the percentage of
positive tumor cells to calculate the protein expression levels. A
score of ≥4 was considered to indicate high AEG-1 expression,
whereas a score of ≤3 was considered to indicate low expression.
The stained sections were scored in duplicate by two independent
investigators who were blinded to the histopathological features,
and patient data of the samples.
Western blotting
Total cellular proteins were extracted using lysis
buffer [50 mmol/l Tris, pH 7.4, 150 mmol/l NaCl, 1% Triton X-100,
1% deoxycholic phenylmethylsulfonyl fluoride, 1 mg/ml of aprotinin,
5.0 mm sodium pyrophosphate, 1.0 g/ml leupeptin, 0.1 mm
phenylmethylsulfonyl fluoride, and 1 mm/l of DTT (KeyGen)]. The
protein samples (40 μg) were then separated by 10% SDS-PAGE and
electrophoretically transferred onto polyvinylidene difluoride
membranes (Beyotime Institute of Biotechnology, Haimen, China). The
membranes were then incubated with the primary antibodies:
Anti-AEG-1, anti-AKT, anti-phospho-AKT (Ser473), anti-ERK1/2,
anti-phospho-ERK1/2 (Tyr204), anti-GSK3β, anti-phospho-GSK3β
(Ser9), anti-FOXO3a and antiphospho-FOXO3a (Ser253), in 5%
milk/Tris-buffered saline-Tween® 20 (TBST) for 24 h at
4°C. Following washing with TBST, the membranes were incubated with
secondary antibody for 1 h at room temperature. The bands were
visualized using enhanced chemiluminescence detection reagents (GE
Healthcare Life Sciences, Uppsala, Sweden). Protein levels were
quantified by density analysis using Quantity One software version
4.6 (Bio-Rad Laboratories, Inc., Hercules, CA, USA).
RNA extraction and reverse transcription
quantitative polymerase chain reaction (RT-qPCR)
Total RNA was extracted from the cultured cells
using TRIzol® reagent (Invitrogen Life Technologies),
according to the manufacturer’s instructions. A total of 1 μg RNA
from each sample was reverse transcribed into cDNA using random
hexamers (Beyotime Institute of Biotechnology). PCR amplification
was carried out in a total volume of 25 μl, containing 0.5 μl each
primer, 12 ml SYBR® Green qPCR Master Mix (Takara
Biotechnology, Dalian, China) and 2 μl 1:12.5 diluted cDNA.
Generation of standard curves and qPCR were carried out using an
ABI7500 Real-Time PCR instrument (Applied Biosystems Life
Technologies, Foster City, CA, USA). The sequences of the primers
used were as follows: AEG-1, forward 5′-AAATAGCCAGCCTATCAAGACTC-3′,
reverse 5′-TTCAGACTTGGTCTGTGAAGGAG-3′; and GAPDH, forward
5′-AAGGTCGGAGTCACCGGATT-3′, and reverse
5′-CTGGAAGATGGTGATGGGATT-3′. Expression data were normalized to the
geometric mean of the housekeeping gene GAPDH, in order to control
the variability in expression levels. The cycle threshold (Ct)
values were measured and gene expression levels were analyzed using
the 2−ΔΔCT method (23).
Cell proliferation assay
Cell growth was analyzed using the Cell Counting
kit-8 (Beyotime Institute of Biotechnology, Haimen, China),
according to the manufacturer’s instructions. Briefly,
2.0×10³ cells were plated in each well of a 96-well
plate. The cells were incubated at 37°C in an atmosphere containing
5% CO2. The media in each well was then substituted with
100 ml fresh medium, containing 10% Cell Counting kit-8, and the
cultures were incubated at 37°C for 1 h. The absorbance value was
determined using an automatic plate reader (Molecular Devices,
Sunnyvale, CA, USA) at a wavelength of 450 nm. All assays were
carried out in triplicate.
Flow cytometry analysis
Detection of apoptosis and cell cycle distribution
by flow cytometry was performed using the Cell Cycle and Apoptosis
Analysis kit (Beyotime Institute of Biotechnology). The transfected
cells were harvested by trypsinization and fixed with cold 70%
ethanol at 4°C for 24 h. Staining was performed according to the
manufacturer’s instructions. Flow cytometry (BD Biosciences, San
Jose, CA, USA) was performed immediately after staining.
Adhesion assay
Microtiter wells were coated with Matrigel™ Basement
Membrane Matrix (BD Biosciences) at 37°C for 4 h, and then blocked
for 1 h at 37°C with 0.5% bovine serum albumin in
phosphate-buffered saline. The cells were seeded in triplicate at a
density of 4×10⁴ cells/well. The adherent cells were
stained and examined using Cell Counting kit-8. The absorbance
value was determined using an automatic plate reader (Molecular
Devices) at 450 nm.
Transwell® invasion assay
The Transwell® migration assay was
carried out using 24-well BioCoat™ cell culture inserts with 8 μm
pores (BD Biosciences) coated with a 1:5 dilution of Matrigel™.
Briefly, the Matrigel™ was allowed to rehydrate for 2 h at 37°C.
The cells (1×10⁵) were suspended in 200 μl RPMI-1640 (1%
FBS) and seeded in triplicate into the upper chamber, and 800 μl
RPMI-1640 (10% FBS) was added to the lower chamber. The invasion
assay was performed at 37°C in a 5% CO2 humidified
incubator for 24 h. Following the 24 h incubation, the cells on the
upper surface of the membrane were wiped off, whereas the cells on
the lower side were fixed with 4% paraformaldehyde and stained with
0.1% crystal violet (Beyotime Institute of Biotechnology). The
number of cells was counted in five random fields per well, under a
light microscope (Olympus Corporation, Tokyo, Japan).
Statistical analysis
All statistical analyses were carried out using SPSS
version 17.0 statistical software package (SPSS, Inc., Chicago, IL,
USA). The χ2 test was used to analyze the association
between AEG-1 expression levels and clinicopathological
characteristics of the patients. Bivariate correlations between
variables were calculated by Spearman’s correlation coefficients.
Differences in patient survival were determined using the
Kaplan-Meier method and the log-rank test. Cox regression analysis
(proportional hazard model) was used for the multivariate analysis
of independent prognostic factors. P<0.05 was considered to
indicate a statistically significant difference.
Results
AEG-1 expression in ovarian tissues
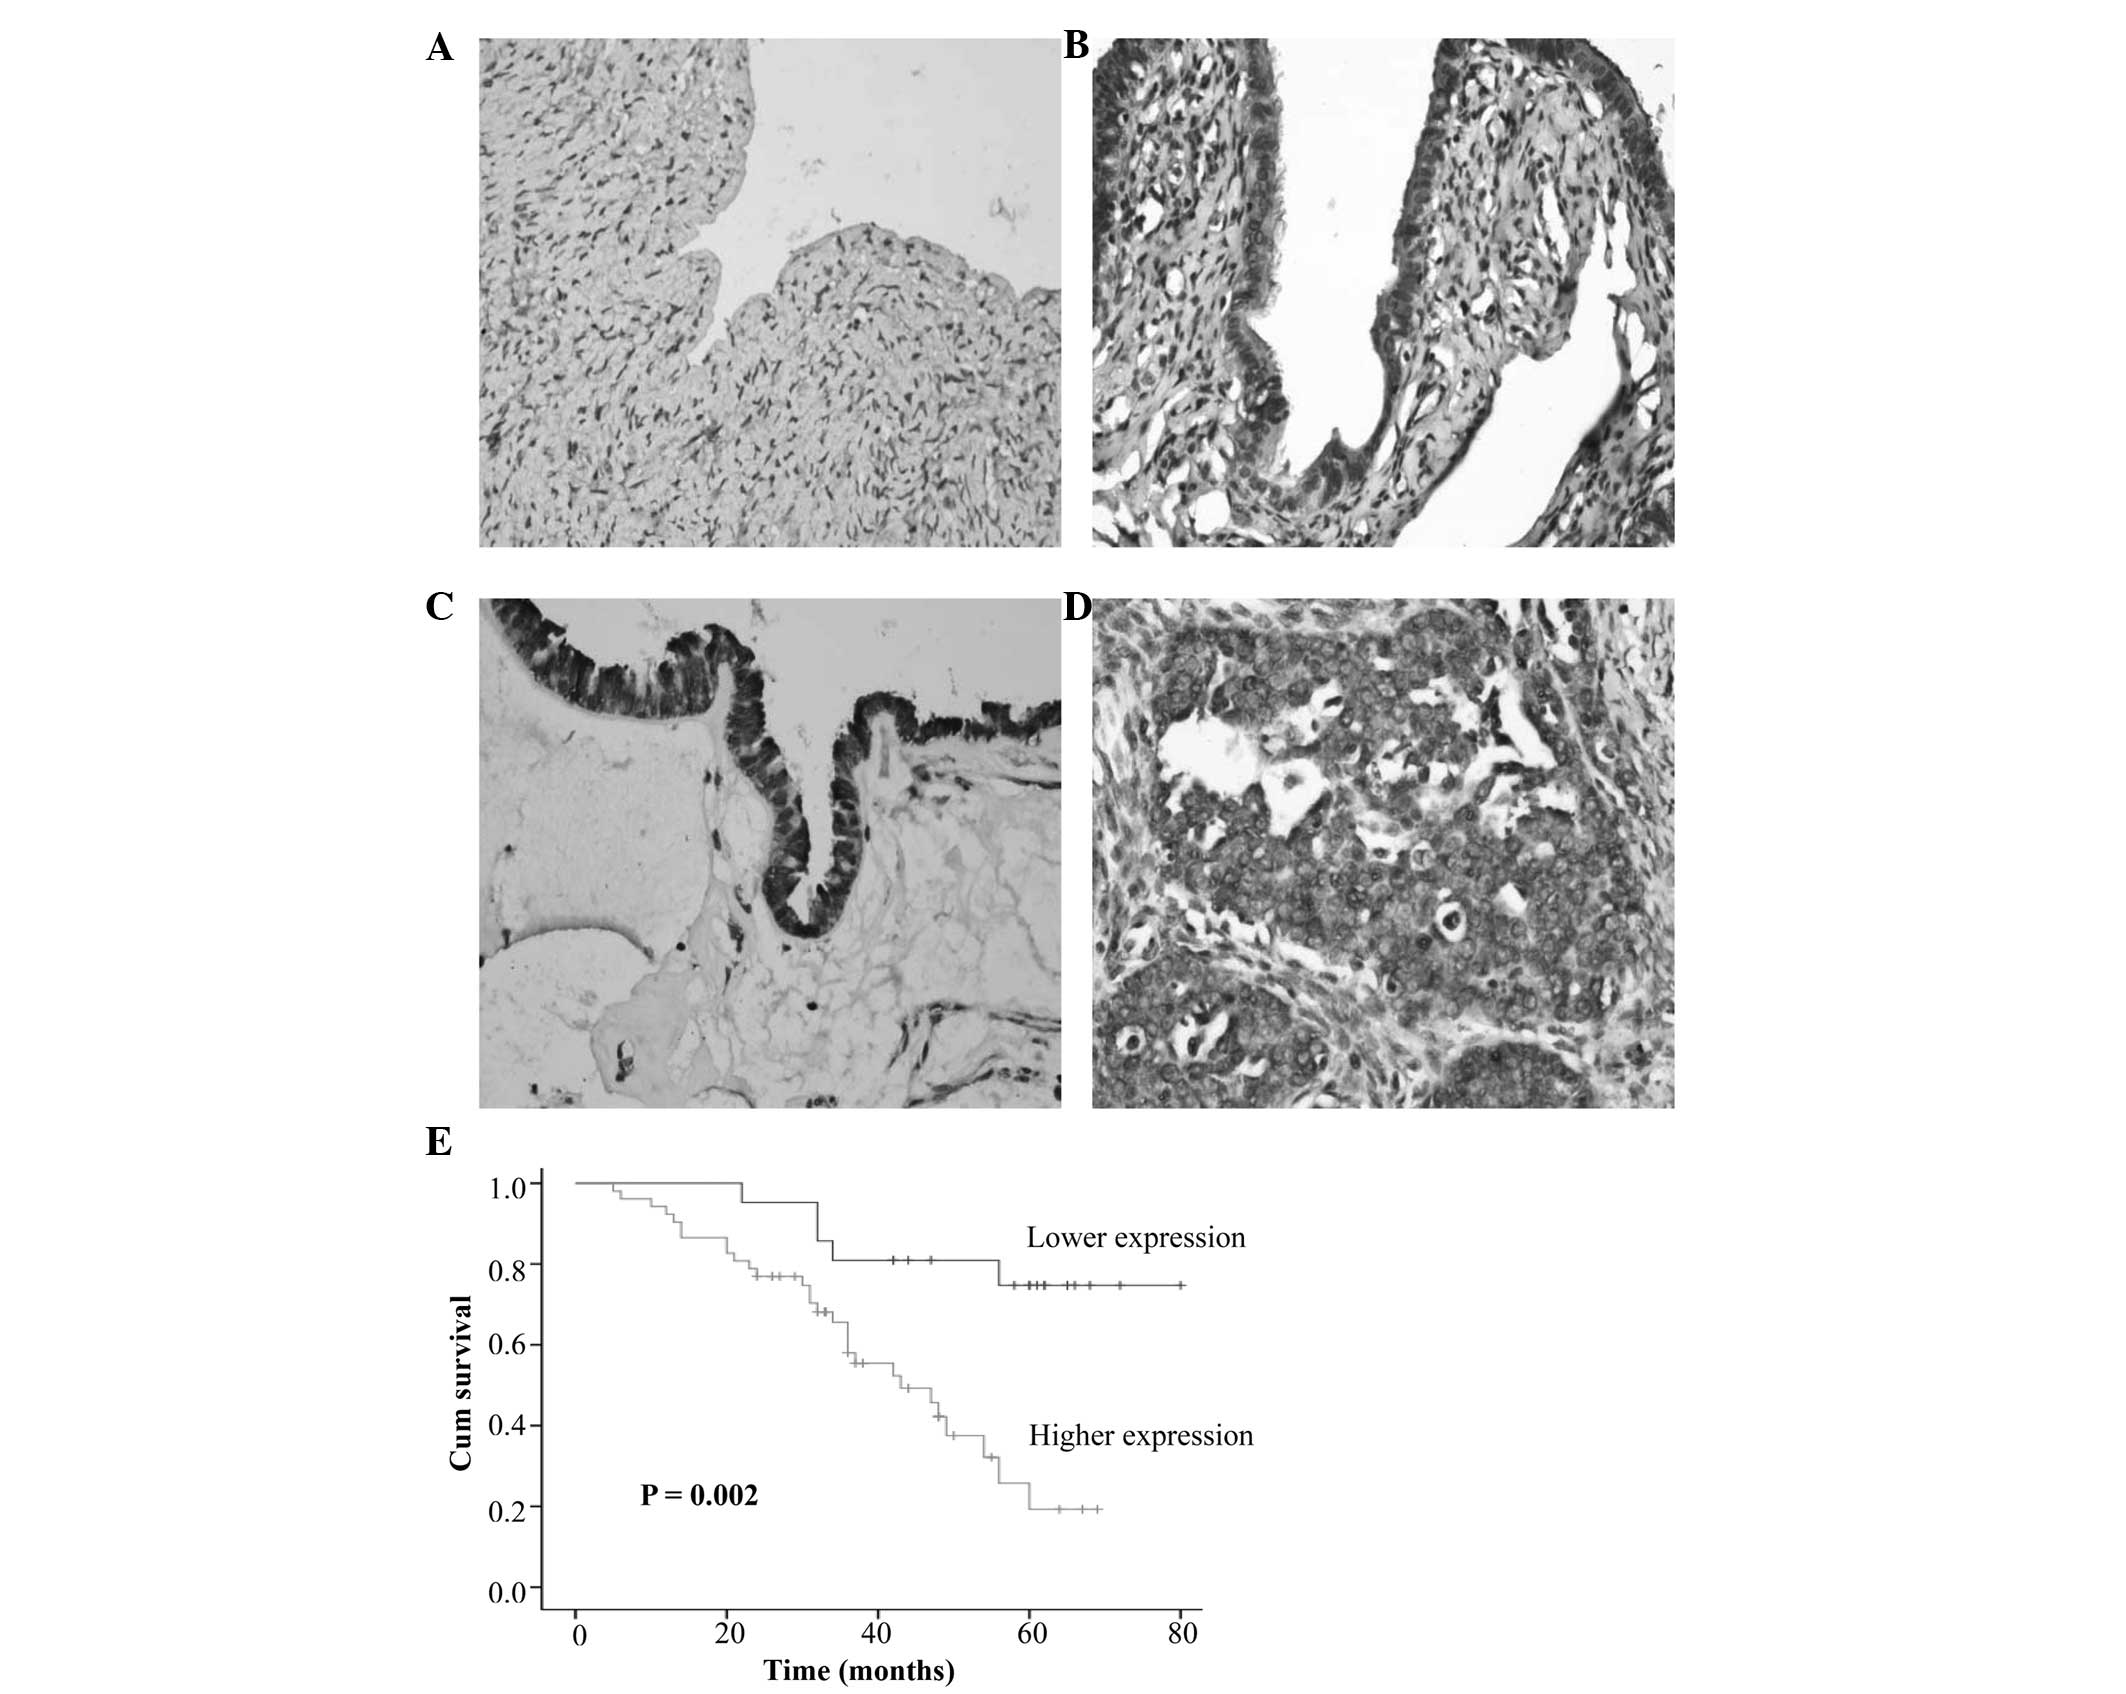
Immunoreactivity for AEG-1 was examined primarily in
the cytoplasm of ovarian surface epithelial and tumor cells. The
normal ovarian tissue exhibited very little or no AEG-1
immunoreactivity (Fig. 1A).
Whereas, high expression of AEG-1 was detected in benign
cystadenomas (12.7%), borderline tumors (30.0%), and ovarian
carcinomas (71.2%) (P<0.001, Table
I, Fig. 1B–D). AEG-1
expression was significantly associated with the degree of
differentiation (P=0.004), lymph node metastasis (P=0.009) and
clinical staging (P=0.006), however, it was not associated with age
(P=0.193) or histological type (P=0.214). Spearman correlation
analysis was further performed to confirm the correlation between
AEG-1 expression and clinicopathological features. As shown in
Table II, Spearman correlations
of AEG-1 expression levels to degree of differentiation, lymph node
metastasis and clinical staging were 0.370 (P=0.001), 0.308
(P=0.008) and 0.349 (P=0.002), respectively. These results suggest
that high expression levels of AEG-1 may be closely associated with
the clinical progression of ovarian cancer.
| Table IISpearman correlation analysis between
astrocyte elevated gene-1 (AEG-1) and clinicopathological
factors. |
Table II
Spearman correlation analysis between
astrocyte elevated gene-1 (AEG-1) and clinicopathological
factors.
| AEG-1
expression |
|---|
|
|
|---|
| Variable | Spearman
correlation (P) |
|---|
| Age (years) | 0.150 (0.207) |
| Histological
type | −0.189 (0.110) |
| Differentiation
degree | 0.370 (0.001) |
| Lymph node
metastasis | 0.308 (0.008) |
| Clinical stage | 0.349 (0.002) |
Association between AEG-1 expression and
prognosis
Follow-up information was available on all 73
patients with ovarian carcinoma for periods ranging between 5 and
80 months (average=40.6). Survival curves for patients with ovarian
carcinomas were stratified according to AEG-1 protein expression
(Fig. 1E). Univariate analysis
using the Kaplan-Meier method indicated an inverse correlation
between AEG-1 expression and survival rate of patients with ovarian
carcinoma (P=0.002). Multivariate analysis using Cox proportional
hazard model indicated that AEG-1 expression (P=0.036) and FIGO
staging (P=0.020) were independent prognostic factors for the
overall survival of the patients with ovarian cancer (Table III).
| Table IIIMultivariate analysis of
clinicopathological variables for the overall survival of the
patients with ovarian cancer. |
Table III
Multivariate analysis of
clinicopathological variables for the overall survival of the
patients with ovarian cancer.
| Variable | Relative risk (95%
confidence interval) | P-value |
|---|
| Age (years) | 1.026
(0.980–1.074) | 0.272 |
| Histological
type | 0.773
(0.462–1.292) | 0.326 |
| Differentiation
degree | 0.912
(0.395–2.108) | 0.830 |
| Lymph node
metastasis | 1.202
(0.485–2.977) | 0.691 |
| Clinical stage | 2.268
(1.141–4.508) | 0.020 |
| Astrocyte-elevated
gene-1 | 3.037
(1.067–8.670) | 0.036 |
Effects of AEG-1 on cell
proliferation
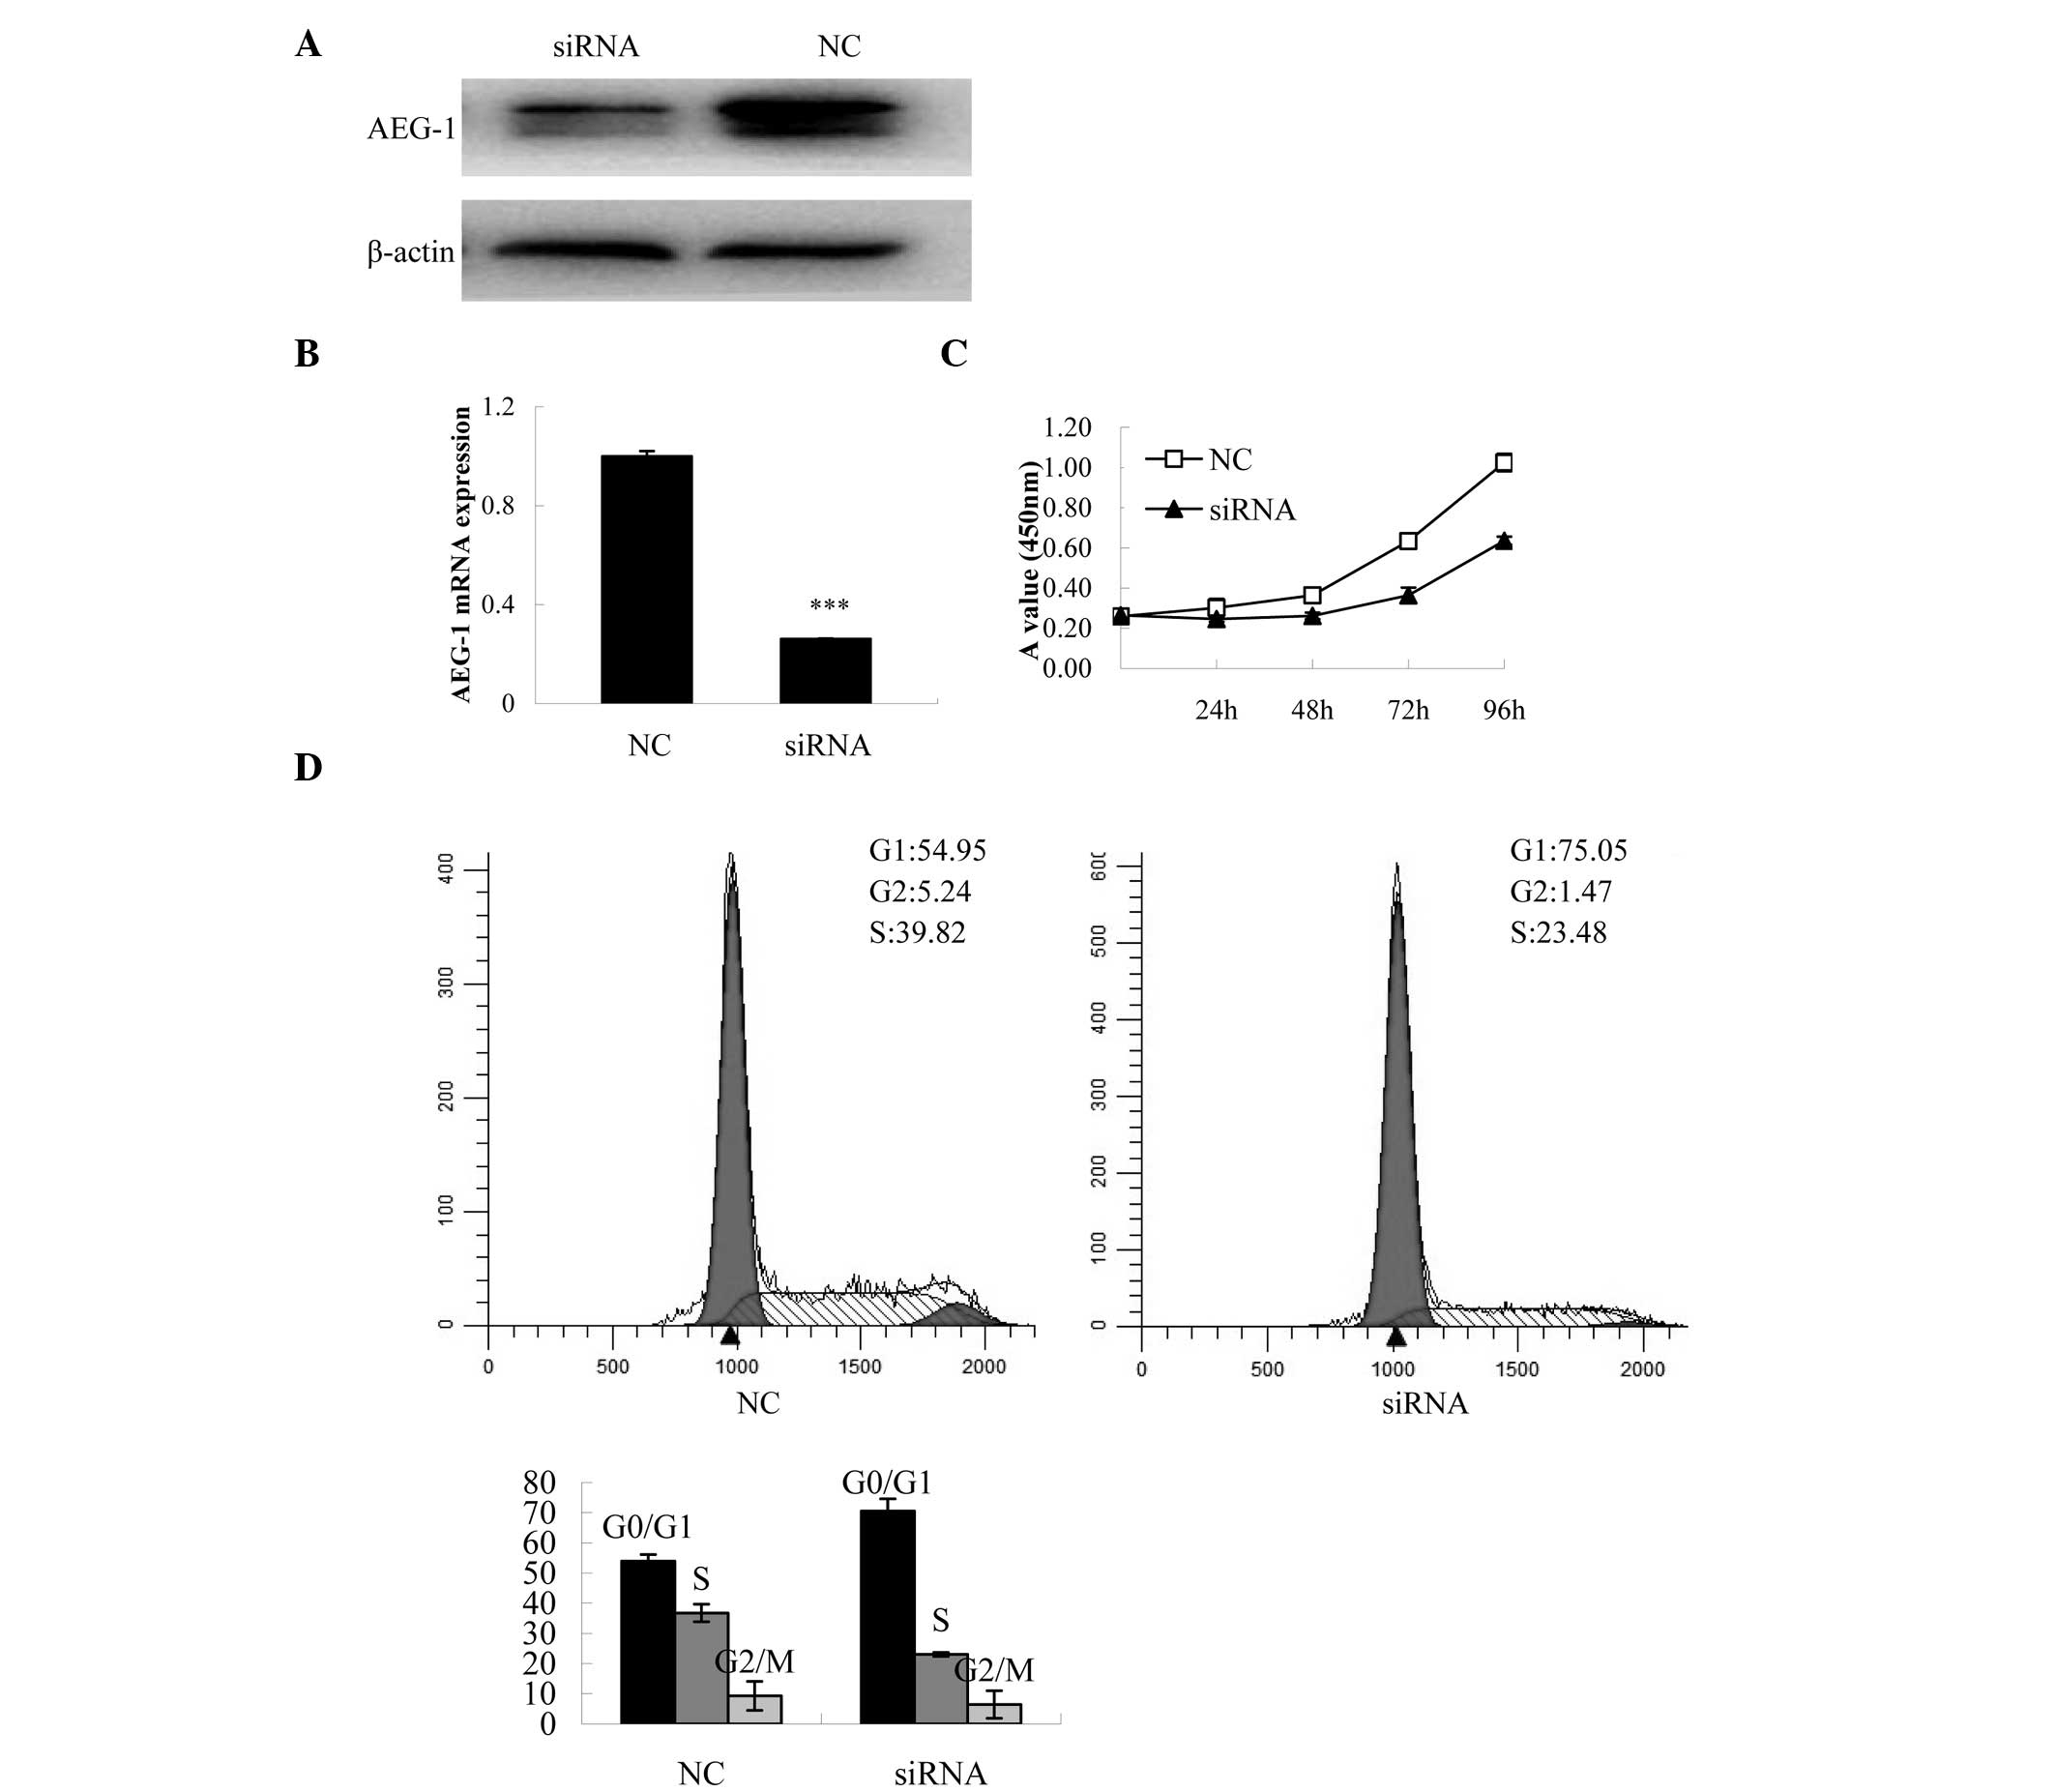
To further investigate the biological role of AEG-1
expression on the progression of ovarian cancer, the impact of
AEG-1 expression on ovarian cancer cell proliferation was evaluated
in AEG-1 knockdown cells. The protein and mRNA expression levels of
AEG-1 were decreased in the AEG-1-siRNA-transfected cells, as
compared with the NC-transfected cells (Fig. 2A and B). Transfection with
AEG-1-siRNA significantly decreased cell proliferation in the
SKOV-3 cells at 96 h, as compared with the control group (P=0.001,
Fig. 2C). To determine the
mechanisms involved in the inhibition of proliferation, cell cycle
distribution was analyzed using flow cytometry. Knockdown of AEG-1
expression resulted in an increased number of cells in the
G0/G1 phase.
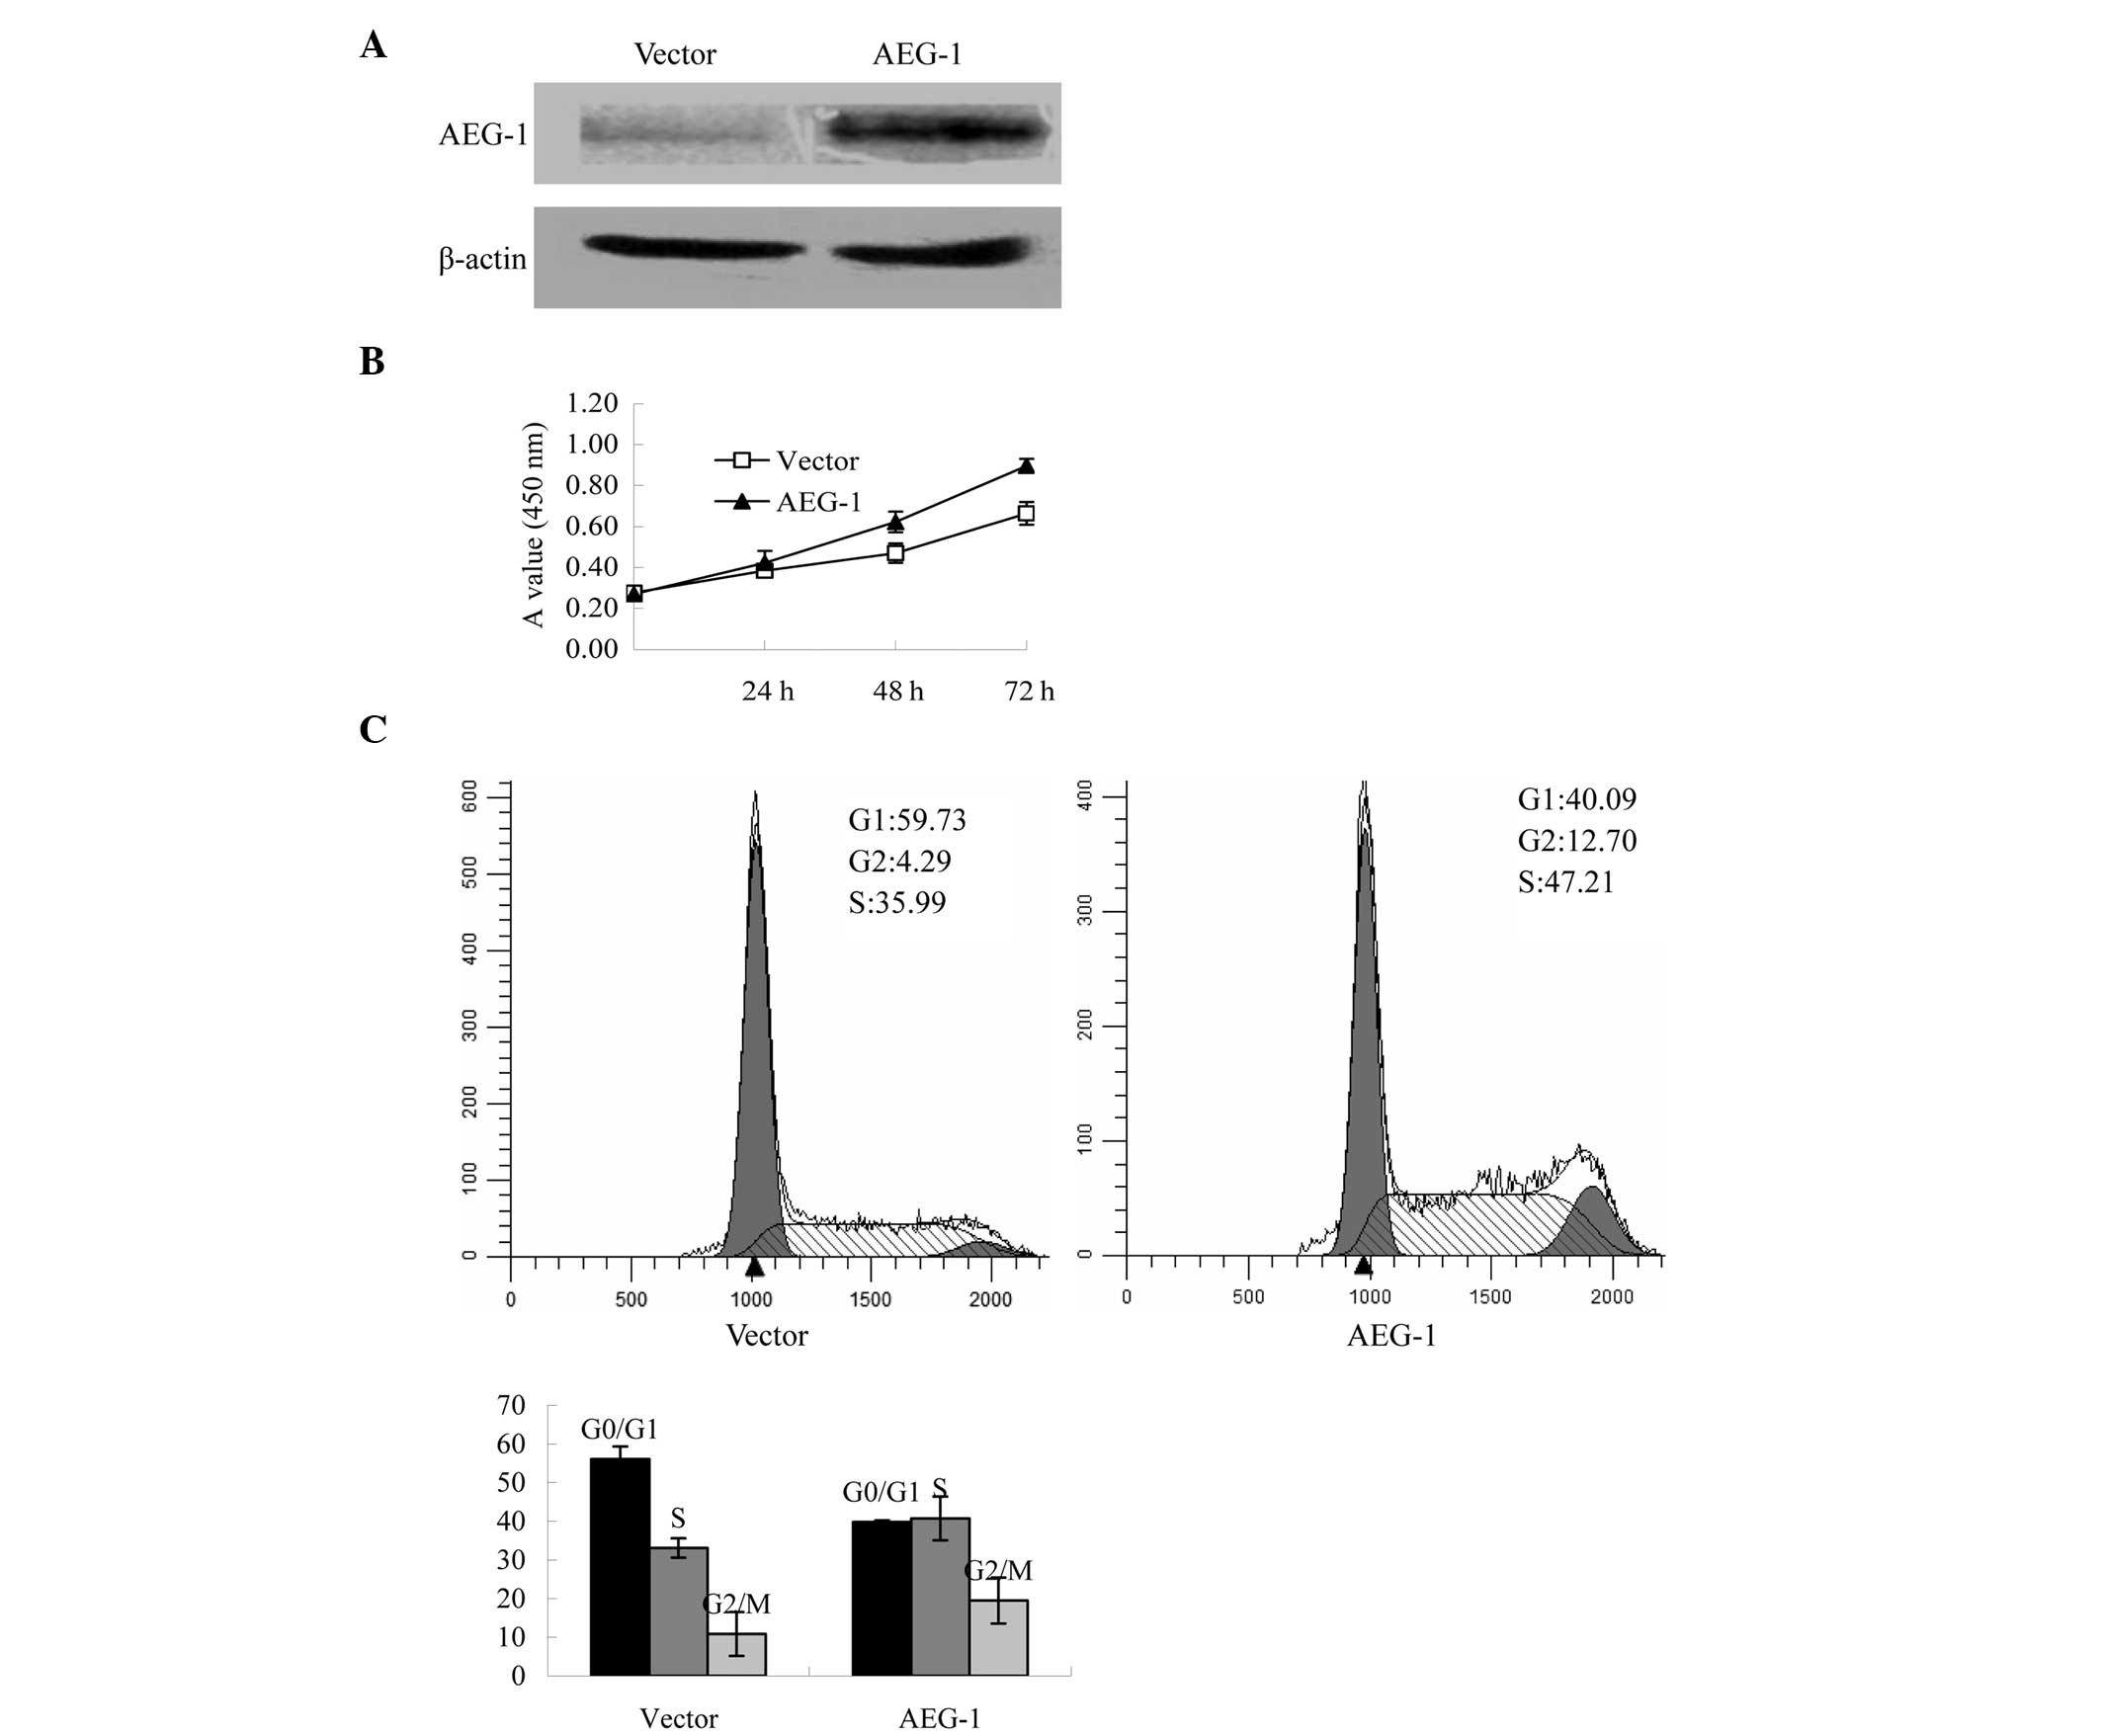
Furthermore, the impact of AEG-1 expression on
ovarian cancer proliferation was also evaluated in the cells
overexpressing AEG-1. Following transfection, western blot analysis
was performed to analyze the protein expression levels of AEG-1.
The protein expression levels of AEG-1 were increased in the
AEG-1-transfected cells, as compared with the pcDNA3.1-transfected
control cells (Fig. 3A). The cell
proliferation assay indicated that AEG-1-transfected cells grew
faster, as compared with those transfected with the vector control
by day 3 after plating (P<0.001, Fig. 3B). Furthermore, exogenous
overexpression of AEG-1 reduced the population of cells within the
G0/G1 phase of the cell cycle (Fig. 3C).
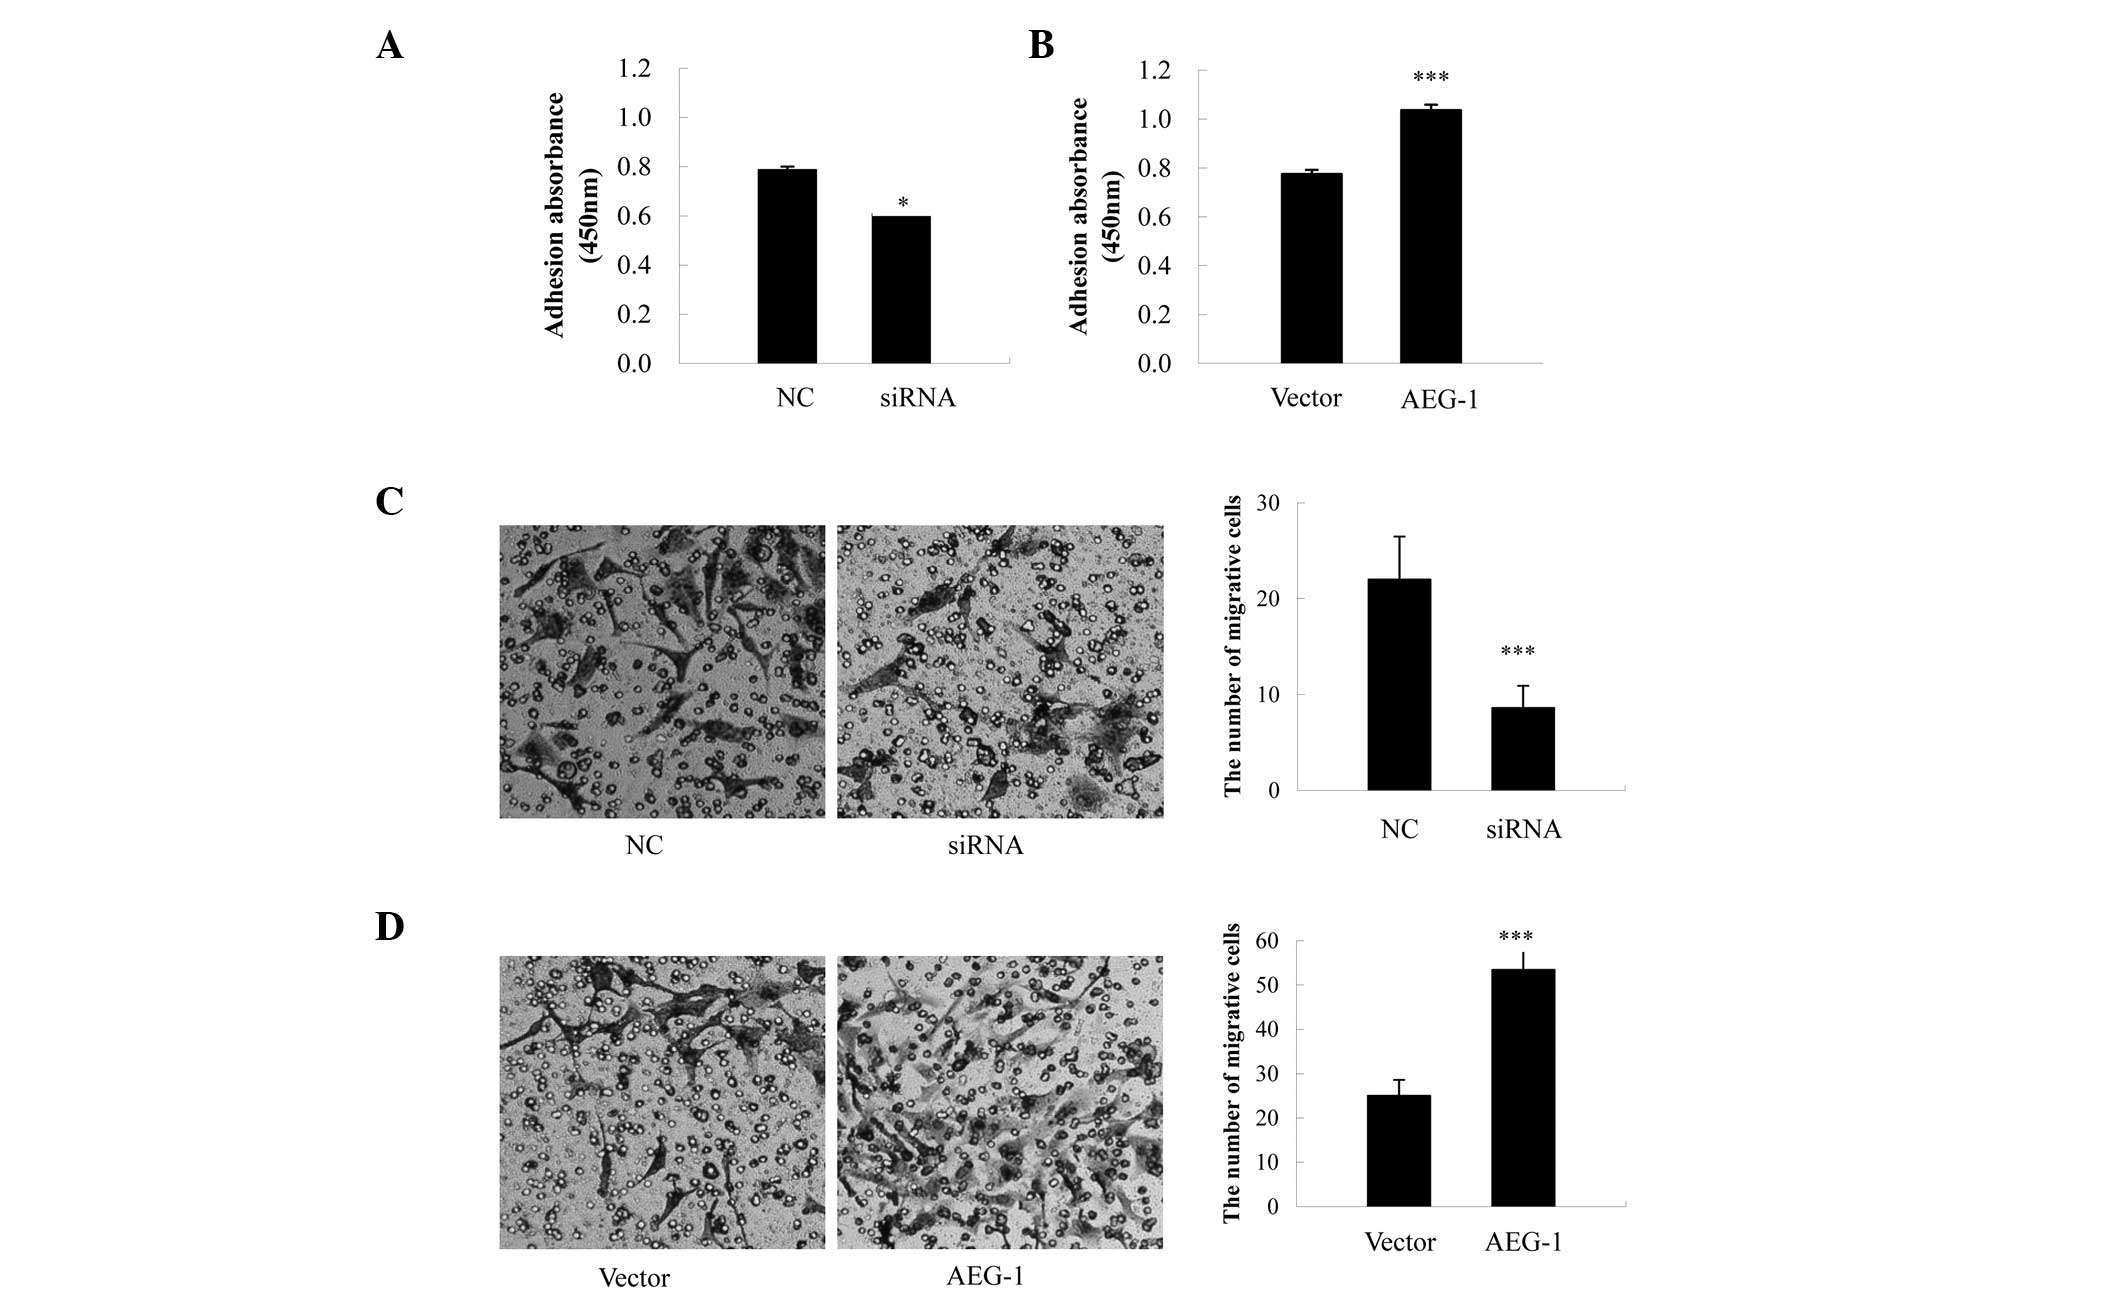
Effects of AEG-1 on cell adhesion
To explore the effects of AEG-1 on cell adhesion, an
adhesion assay was performed using Matrigel™, which contains the
majority of the components of the extracellular matrix. The
adhesive capabilities of the AEG-1-siRNA-transfected cells were
significantly reduced, as compared with the NC-transfected cells
(P=0.021, Fig. 4A), whereas cell
adhesion was significantly increased in the AEG-1-transfected
cells, as compared with the vector control cells (P<0.001,
Fig. 4B).
Effects of AEG-1 on cell invasion
Transwell® assays were carried out, in
order to determine the effects of AEG-1 on the invasive abilities
of the ovarian cancer cells. In the AEG-1-siRNA-transfected cells,
there was a ~60.9% reduction in the number of invading cells, as
compared with the NC-transfected cells (P<0.001, Fig. 4C), whereas the AEG-1-transfected
cells exhibited a 2.1-fold increase in the number of invading
cells, as compared with the pcDNA3.1-transfected cells (P<0.001,
Fig. 4D).
Downstream signaling activated by
AEG-1
Signaling pathways activated by AEG-1 were analyzed
by determining the protein expression levels of various forms of
ERK1/2, FOXO3a, AKT, and GSK3β by western blot analysis. The
protein expression levels of phosphorlyated FOXO3a and ERK1/2 were
decreased in the AEG-1 knockdown cells, whereas the expression
levels of phosphorylated ERK1/2 and phosphorylated FOXO3a in the
AEG-1-overexpressing cells were increased, as compared with the
vector control cells (Fig. 5).
There were no significant changes in the expression levels of total
FOXO3a and ERK1/2. In addition, AEG-1 deregulation did not affect
the expression levels of phosphorylated AKT and phosphorylated
GSK3β.
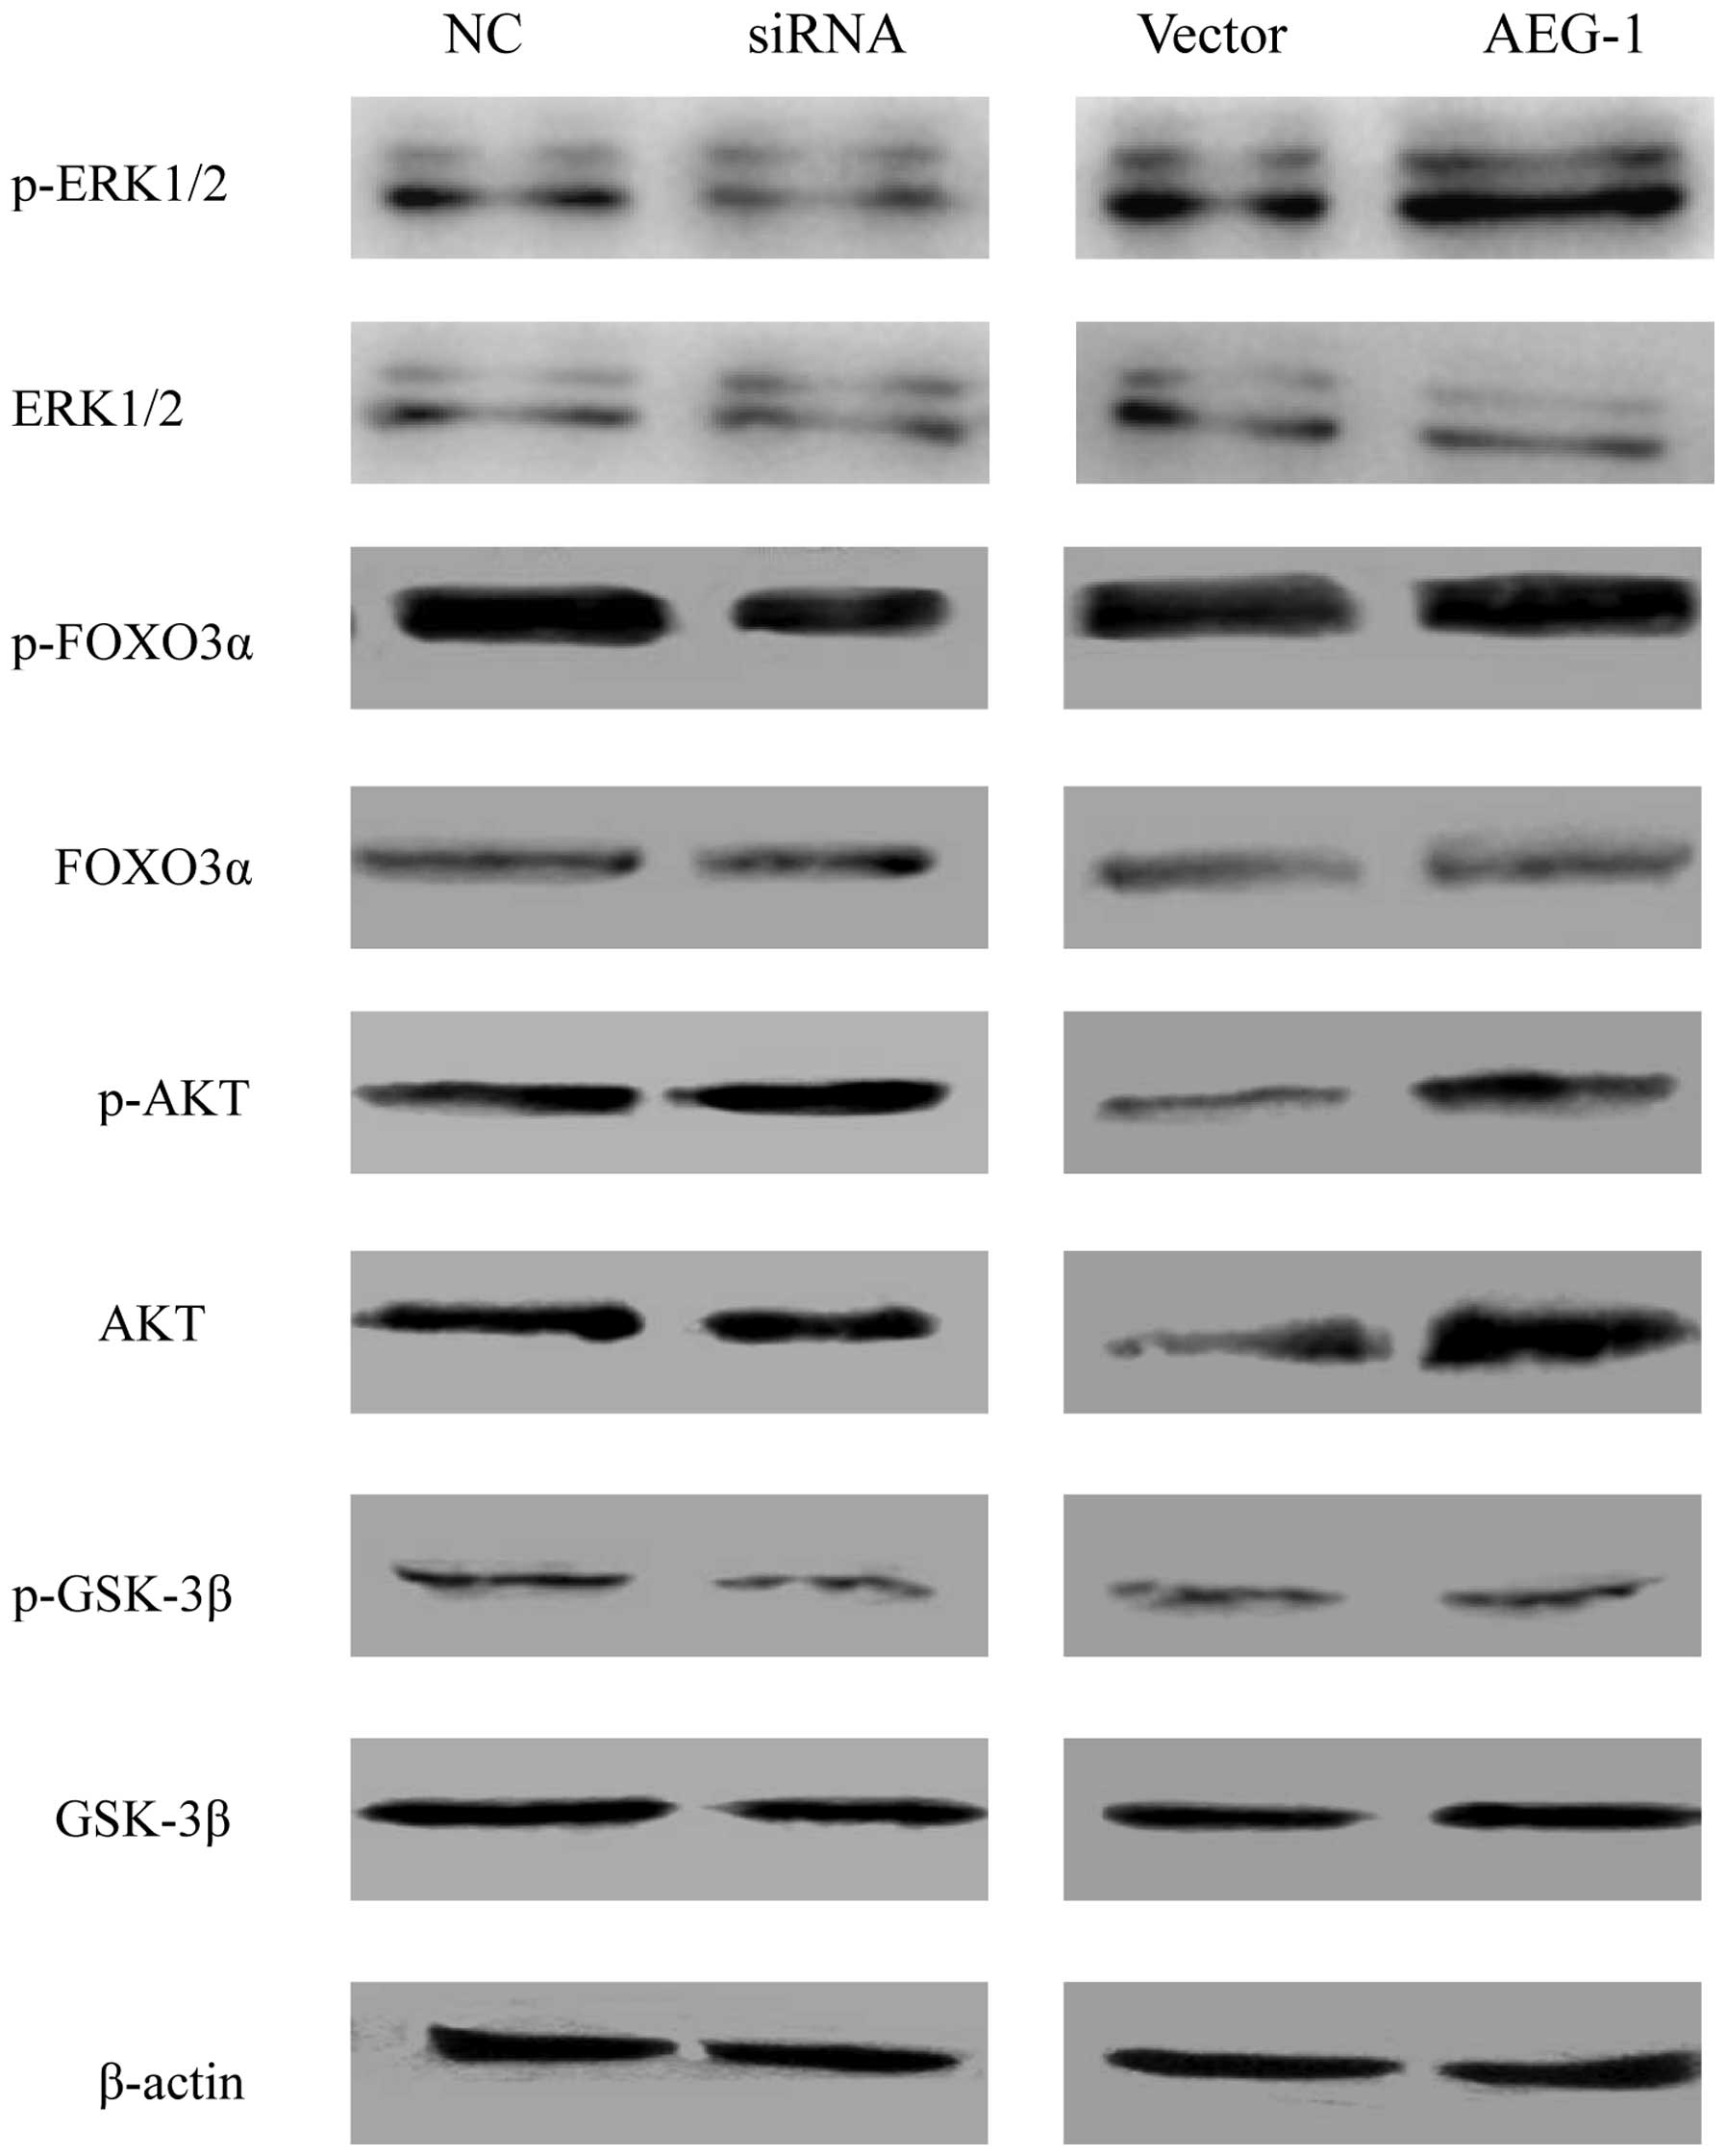 | Figure 5Expression analysis of various forms
of ERK1/2, FOXO3α, AKT, and GSK3β proteins by western blotting.
Protein expression levels were normalized to β-actin expression
levels in each sample. NC, negative control; siRNA, small
interfering RNA; ERK, extracellular signal-regulated kinase; FOXO3,
forkhead box O3; GSK, glycogen synthase kinase; p-,
phosphorylated-; AEG-1, astrocyte-elevated gene-1. |
Discussion
The present study determined the expression levels
of AEG-1 in 73 ovarian cancer specimens using IHC, and correlated
the expression with the clinicopathological characteristics of the
patients. AEG-1 was shown to be overexpressed in 71.2% of ovarian
cancer specimens, whereas very little or no immunoreactivity was
detected in the normal ovarian tissue. The protein expression
levels of AEG-1 in the histological sections were closely
correlated with the degree of differentiation, lymph node
metastasis and clinical staging. These results suggest that
upregulated expression of AEG-1 in ovarian cancer may facilitate
the increased malignant phenotype of the tumor. In addition,
patients with higher AEG-1 expression also had a shorter overall
survival, as compared with the patients with lower expression. A
multivariate analysis also indicated that AEG-1 may be an
independent prognostic factor for the overall survival of patients
with ovarian cancer. These results indicate that AEG-1 may
represent a valuable biomarker for the prediction of ovarian cancer
prognosis.
The results of the present study are concordant with
the results of previous studies examining the role of AEG-1 in the
progression of ovarian cancer (15,24).
In these previous studies, AEG-1 was shown to be overexpressed in
metastatic tissues from patients with ovarian cancer. In addition,
the overexpression of AEG-1 was correlated with peritoneal
dissemination, lymph node metastasis, FIGO stage, histological
grade, presence of residual tumor and tumor recurrence in ovarian
cancer (15,24). Meng et al (24), demonstrated that patients with high
AEG-1 expression had significantly poorer overall survival, as
compared with patients with low expression, which was similar to
the findings of the present study. In addition, AEG-1 has been
reported to be overexpressed in other cancer types, including liver
cancer, breast cancer, esophageal squamous cell carcinoma, gastric
cancer and non-small cell lung cancer (10–12,25,26),
in which overexpression of AEG-1 was often observed in more
aggressive tumor subgroups, and is therefore considered to have
diagnostic value.
The present study demonstrated that an increasing
frequency of overexpression of AEG-1 was observed from benign
(cystadenoma) to borderline tumors, and to malignant carcinomas.
This is the first time this has been reported in ovarian cancer, to
the best of our knowledge. This finding has however been reported
in other cancer types, such as colorectal and breast cancer
(13,27). These data suggest that AEG-1 may
have an important role in the tumorigenic process of human cancers,
including ovarian cancer.
Recently, numerous studies have shown that AEG-1 is
associated with biological processes including cancer cell
proliferation, apoptosis, migration, and metastasis (16–19).
However, thus far, there have been few reports regarding the
regulation and function of AEG-1 in ovarian cancer. Therefore, the
present study investigated the gain or loss of AEG-1 function,
through exogenous overexpression or AEG-1 knockdown by siRNA, in
ovarian cancer cells. Exogenous overexpression of AEG-1 in ovarian
cancer cells significantly enhanced cell proliferation and reduced
the G0/G1 cell population. Conversely,
silencing AEG-1 expression resulted in a clear inhibition of cell
growth and induced a cell cycle arrest at the
G0/G1 phase. In addition, upregulation of
AEG-1 in ovarian cancer cells resulted in improved adhesive and
invasive capabilities, whereas, downregulation of AEG-1 reduced
adhesion and inhibited invasion of the cells. These data not only
support the finding that AEG-1 overexpression is associated with
poor prognosis in ovarian cancer, but also implicate an association
between the function of AEG-1 and the pathogenesis of ovarian
cancer. These results may lead to the development of a novel
therapeutic strategy against ovarian cancer. Concordant with the
findings of the present study, these observations have also been
reported in hepatocellular carcinoma, neuroblastoma, malignant
glioma cells and colorectal carcinoma (12,28–31).
In recent years, the function of AEG-1 has been
intensively investigated; however, the molecular mechanisms
underlying its oncogenic role remain unclear. There has been
abundant evidence demonstrating that numerous major cellular
signaling pathways, including PI3K/AKT, ERK1/2, and p38MAPK, may
have important roles in the ability of AEG-1 to execute the
identified biological functions in various cancers. Through
activation of the PI3K/AKT signaling pathway, AEG-1 overexpression
could block the serum starvation-induced cell death through
phosphorylation of GSK3β, Bcl-2-associated death promoter and mouse
double minute 2 homolog, and reduction of p53 and p21/mda-6
expression (32). In esophageal
squamous cancer cells, AEG-1 was shown to decrease the expression
of p27Kip1 and upregulate the expression of cyclin D1, through the
AKT/FOXO3a pathway (11).
Activation of AKT by AEG-1 in breast cancer cells resulted in a
downregulation of the transcriptional activity of FOXO1, and
reduction of two key cell-cycle inhibitors: p27Kip1 and p21Cip1
(33). In hepatocellular
carcinoma, AEG-1 has been shown to increase phosphorylation of MAPK
molecules, including ERK1/2 and p38MAPK, which subsequently
activates Wnt-mediated signaling and consequently leads to
increased tumor angiogenesis (12). The present study demonstrated that
AEG-1 knockdown could decrease the phosphorylation levels of ERK1/2
and FOXO3a, without affecting the expression levels of
phosphorylated AKT and GSK3β. Therefore, it may be speculated that
the effects of AEG-1 on the proliferation and tumorigenicity of
ovarian cancer cells may be associated with the activity of ERK1/2
and FOXO3a. However, although numerous signaling pathways involved
in mediating the molecular functions of AEG-1 have been elucidated,
it remains unclear what direct interactions occur between AEG-1 and
other proteins, and how they contribute to the downstream effects
of AEG-1. A future aim may be to identify the interacting partners
of AEG-1, using numerous methods.
In conclusion, the present study identified that the
expression levels of AEG-1 were highly increased in ovarian cancer
tissue. Furthermore, AEG-1 protein expression was significantly
correlated with survival and malignant metastasis of ovarian
cancer. The present study further elucidates the molecular
mechanisms underlying invasion and metastasis of ovarian cancer.
These data suggest that AEG-1 may represent a valuable biomarker
for the prediction of ovarian cancer prognosis, and an attractive
molecular target for novel anticancer therapeutic agents.
References
|
1
|
Jemal A, Bray F, Center MM, Ferlay J, Ward
E and Forman D: Global cancer statistics. CA Cancer J Clin.
61:69–90. 2011. View Article : Google Scholar : PubMed/NCBI
|
|
2
|
Poveda A: Ovarian cancer: is the news good
enough? Int J Gynecol Cancer. 15:298–306. 2005. View Article : Google Scholar : PubMed/NCBI
|
|
3
|
Seidman JD, Horkayne-Szakaly I, Haiba M,
Boice CR, Kurman RJ and Ronnett BM: The histologic type and stage
distribution of ovarian carcinomas of surface epithelial origin.
Int J Gynecol Pathol. 23:41–44. 2004. View Article : Google Scholar
|
|
4
|
Cheng W, Liu J, Yoshida H, Rosen D and
Naora H: Lineage infidelity of epithelial ovarian cancers is
controlled by HOX genes that specify regional identity in the
reproductive tract. Nat Med. 11:531–537. 2005. View Article : Google Scholar : PubMed/NCBI
|
|
5
|
Zhou B, Yang L, Wang L, et al: The
association of tea consumption with ovarian cancer risk: A
meta-analysis. Am J Obstet Gynecol. 197:594. e1–e6. 2007.
View Article : Google Scholar
|
|
6
|
Siegel R, Naishadham D and Jemal A: Cancer
statistics 2012. CA Cancer J Clin. 62:10–29. 2012. View Article : Google Scholar : PubMed/NCBI
|
|
7
|
Saad AF, Hu W and Sood AK:
Microenvironment and pathogenesis of epithelial ovarian cancer.
Horm Cancer. 1:277–290. 2010. View Article : Google Scholar
|
|
8
|
Su ZZ, Kang DC, Chen Y, et al:
Identification and cloning of human astrocyte genes displaying
elevated expression after infection with HIV-1 or exposure to HIV-1
envelope glycoprotein by rapid subtraction hybridization, RaSH.
Oncogene. 21:3592–3602. 2002. View Article : Google Scholar : PubMed/NCBI
|
|
9
|
Kang DC, Su ZZ, Sarkar D, Emdad L, Volsky
DJ and Fisher PB: Cloning and characterization of HIV-1-inducible
astrocyte elevated gene-1, AEG-1. Gene. 353:8–15. 2005. View Article : Google Scholar : PubMed/NCBI
|
|
10
|
Li J, Zhang N, Song LB, et al: Astrocyte
elevated gene-1 is a novel prognostic marker for breast cancer
progression and overall patient survival. Clin Cancer Res.
14:3319–3326. 2008. View Article : Google Scholar : PubMed/NCBI
|
|
11
|
Yu C, Chen K, Zheng H, et al:
Overexpression of astrocyte elevated gene-1 (AEG-1) is associated
with esophageal squamous cell carcinoma (ESCC) progression and
pathogenesis. Carcinogenesis. 30:894–901. 2009. View Article : Google Scholar : PubMed/NCBI
|
|
12
|
Yoo BK, Emdad L, Su ZZ, et al: Astrocyte
elevated gene-1 regulates hepatocellular carcinoma development and
progression. J Clin Invest. 119:465–477. 2009. View Article : Google Scholar : PubMed/NCBI
|
|
13
|
Song H, Li C, Li R and Geng J: Prognostic
significance of AEG-1 expression in colorectal carcinoma. Int J
Colorectal Dis. 25:1201–1209. 2010. View Article : Google Scholar : PubMed/NCBI
|
|
14
|
Kikuno N, Shiina H, Urakami S, et al:
Knockdown of astrocyte-elevated gene-1 inhibits prostate cancer
progression through upregulation of FOXO3a activity. Oncogene.
26:7647–7655. 2007. View Article : Google Scholar : PubMed/NCBI
|
|
15
|
Li C, Liu J, Lu R, et al: AEG -1
overexpression: a novel indicator for peritoneal dissemination and
lymph node metastasis in epithelial ovarian cancers. Int J Gynecol
Cancer. 21:602–608. 2011. View Article : Google Scholar : PubMed/NCBI
|
|
16
|
Hu G, Chong RA, Yang Q, et al: MTDH
activation by 8q22 genomic gain promotes chemoresistance and
metastasis of poor-prognosis breast cancer. Cancer Cell. 15:9–20.
2009. View Article : Google Scholar :
|
|
17
|
Yoo BK, Chen D, Su ZZ, et al: Molecular
mechanism of chemoresistance by astrocyte elevated gene-1. Cancer
Res. 70:3249–3258. 2010. View Article : Google Scholar : PubMed/NCBI
|
|
18
|
Emdad L, Lee SG, Su ZZ, et al: Astrocyte
elevated gene-1 (AEG-1) functions as an oncogene and regulates
angiogenesis. Proc Natl Acad Sci USA. 106:21300–21305. 2009.
View Article : Google Scholar : PubMed/NCBI
|
|
19
|
Emdad L, Sarkar D, Su ZZ, et al:
Activation of the nuclear factor kappaB pathway by astrocyte
elevated gene-1: implications for tumor progression and metastasis.
Cancer Res. 66:1509–1516. 2006. View Article : Google Scholar : PubMed/NCBI
|
|
20
|
Lee SG, Su ZZ, Emdad L, Sarkar D and
Fisher PB: Astrocyte elevated gene-1 (AEG-1) is a target gene of
oncogenic Ha-ras requiring phosphatidylinositol 3-kinase and c-Myc.
Proc Natl Acad Sci USA. 103:17390–17395. 2006. View Article : Google Scholar : PubMed/NCBI
|
|
21
|
Scully RE: Histological Typing of Ovarian
Tumors. World Health Organization International Histological
Classification of Tumours. Springer; Berlin, Germany: 1999
|
|
22
|
Berg D, Malinowsky K, Reischauer B, Wolff
C and Becker KF: Use of formalin-fixed and paraffin-embedded
tissues for diagnosis and therapy in routine clinical settings.
Methods Mol Biol. 785:109–122. 2011. View Article : Google Scholar : PubMed/NCBI
|
|
23
|
Schefe JH, Lehmann KE, Buschmann IR, Unger
T and Funke-Kaiser H: Quantitative real-time RT-PCR data analysis:
current concepts and the novel ‘gene expression’s CT difference’
formula. J Mol Med (Berl). 84:901–910. 2006. View Article : Google Scholar
|
|
24
|
Meng F, Luo C, Ma L, Hu Y and Lou G:
Clinical significance of astrocyte elevated gene-1 expression in
human epithelial ovarian carcinoma. Int J Gynecol Pathol.
30:145–150. 2011. View Article : Google Scholar : PubMed/NCBI
|
|
25
|
Jian-bo X, Hui W, Yu-long H, et al:
Astrocyte-elevated gene-1 overexpression is associated with poor
prognosis in gastric cancer. Med Oncol. 28:455–462. 2011.
View Article : Google Scholar
|
|
26
|
Ke ZF, Mao X, Zeng C, He S, Li S and Wang
LT: AEG-1 expression characteristics in human non-small cell lung
cancer and its relationship with apoptosis. Med Oncol. 30:3832013.
View Article : Google Scholar : PubMed/NCBI
|
|
27
|
Su P, Zhang Q and Yang Q:
Immunohistochemical analysis of Metadherin in proliferative and
cancerous breast tissue. Diagn Pathol. 5:382010. View Article : Google Scholar : PubMed/NCBI
|
|
28
|
Lee SG, Jeon HY, Su ZZ, et al: Astrocyte
elevated gene-1 contributes to the pathogenesis of neuroblastoma.
Oncogene. 28:2476–2484. 2009. View Article : Google Scholar : PubMed/NCBI
|
|
29
|
Emdad L, Sarkar D, Lee SG, et al:
Astrocyte elevated gene-1: A novel target for human glioma therapy.
Mol Cancer Ther. 9:79–88. 2010. View Article : Google Scholar : PubMed/NCBI
|
|
30
|
Liu L, Wu J, Ying Z, et al: Astrocyte
elevated gene-1 upregulates matrix metalloproteinase-9 and induces
human glioma invasion. Cancer Res. 70:3750–3759. 2010. View Article : Google Scholar : PubMed/NCBI
|
|
31
|
Zhang F, Yang Q, Meng F, et al: Astrocyte
elevated gene-1 interacts with β-catenin and increases migration
and invasion of colorectal carcinoma. Mol Carcinog. 52:603–610.
2013. View
Article : Google Scholar
|
|
32
|
Lee SG, Su ZZ, Emdad L, Sarkar D, Franke
TF and Fisher PB: Astrocyte elevated gene-1 activates cell survival
pathways through PI3K-Akt signaling. Oncogene. 27:1114–1121. 2008.
View Article : Google Scholar
|
|
33
|
Li J, Yang L, Song L, et al: Astrocyte
elevated gene-1 is a proliferation promoter in breast cancer via
suppressing transcriptional factor FOXO1. Oncogene. 28:3188–3196.
2009. View Article : Google Scholar : PubMed/NCBI
|