Introduction
Familial combined hyperlipidemia (FCHL), the most
common genetic form of hyperlipidemia, is characterized by
significant familial clustering and premature coronary heart
disease (1). FCHL is a common
inherited disorder of lipid metabolism with a prevalence of
0.5–2.0%, accounting for 10% of the cases of premature coronary
heart disease worldwide (2).
Therefore, the research and treatment of FCHL has significance for
human health. Multiple hyperlipemic phenotypes have been
characterized in the same individual and in the same family, which
can be detected by elevated very-low-density lipoproteins (VLDL)
and low-density lipoproteins (LDL) or apolipoprotein B (apoB)
(3,4).
To date, studies have focused on the molecular
mechanisms of FCHL development in order to reveal biomarkers for
clinical treatment. The FCHL locus has been mapped to human
chromosome 1q21–q23. This region includes retinoid X receptor γ
(RXRG), a nuclear factor member of the RXR superfamily, which is
critical in lipid homeostasis (1).
Sentinelli et al (1) have
identified five polymorphisms in the RXRG gene (rs1128977,
rs2651860, rs2134095, rs283696 and rs10918169). Hsieh et al
(5) suggested that one single
nucleotide polymorphism (SNP) in the RXRG gene, (rs3818569 now
merged into rs1128977) has a positive correlation with the
development of diabetic retinopathy. The rs2651860 SNP was
significantly associated with increased levels of LDL-cholesterol
and of apoB in T-allele carriers (1). A total of three SNPs in
RXRÎ3 exhibited a significant association with HIV
lipodystrophy (6).
In previous years, multiple candidate genes have
been identified as associated with the FCHL phenotype. The upstream
transcription factor 1 (USF1) is a transcription factor, which
regulates the expression of a number of genes involved in glucose
and lipid metabolism, and provides an adequate candidate for FCHL
(7). Preliminary functional data
suggested that the USF1 risk haplotype may affect the expression
profiles in fat biopsy samples from individuals with FCHL (8). The lipoprotein lipase (LPL) gene is
also a noteworthy candidate for FCHL. The decreased activity of LPL
in subjects with FCHL has been identified and positive associations
have been reported between FCHL and genetic variants in the LPL
promoter and exon (9). In brief,
these candidate gene studies may provide a theoretical foundation
for FCHL treatment.
In the present study, the aim was to analyze the
FCHL samples and control samples with a series of biological
information technology services, with the purpose of revealing the
mechanism underlying the development of FCHL. Gene-set enrichment
analysis was performed and a protein-protein interaction (PPI)
network was constructed. Functional genes and signaling pathways in
FCHL were used to establish a theoretical foundation for future
research. Present findings may provide a basis for understanding
the pathogenesis of FCHL in the future.
Materials and methods
Data sources
The transcription profile of GSE1010 was obtained
from the NCBI Gene Expression Omnibus (GEO) database (http://www.ncbi.nlm.nih.gov/geo/), which is based
on the Affymetrix Human Genome U133A Array GPL96 (Affymetrix, Santa
Clara, CA, USA). There were a total of 24 RNA specimens
(lymphoblastic cells), including 12 FCHL samples and 12 control
specimens.
Screening of differentially expressed
genes (DEGs)
The linear models for microarray data package
(10) in the R programming
language was used to identify DEGs. The original expression
datasets were normalized using the normalize within arrays method
and normalize between arrays method (11). Following normalization, the
expression value was used to construct a linear model in order to
identify the DEGs (12). P<0.05
was set as the cut-off criteria.
Kyoto Encyclopedia of Genes and Genomes
(KEGG) pathway analysis based on the PPI network
The KEGG pathway enrichment analysis of DEGs was
performed using EnrichNet (http://www.enrichnet.org/) (13). EnrichNet is an analysis approach
based on the PPI networks. EnrichNet calculates the overlap between
the known KEGG pathways and constructed PPI networks, in order to
acquire the PPI enriched KEGG pathway. In the present study, PPI
networks of DGEs were constructed via the Search tool for the
retrieval of interacting genes/proteins (STRING; http://www.string-db.org/) (14) database and the similarity between
the PPI networks and the KEGG pathways were calculated via
EnrichNet. The similarity was presented as an XD-score. The higher
the XD-score value, the higher the similarity is, indicating an
increased possibility of a KEGG pathway enriched with DEGs. In
order to notarize the criteria of the XD-score, the classical
overlap-based Fisher test was used to calculate the significance
score (q-value) via EnrichNet and linear regression analysis
between the q-value and XD-score was performed. An XD-score lower
than the threshold value of 0.79, corresponding to a q-value of
0.05 was considered to indicate significance.
Construction of the PPI network combined
with the KEGG pathway
For the enriched KEGG pathways, the integrated PPI
combined with the KEGG pathways was constructed via EnrichNet,
based on the PPI network of the DEGs. Briefly, the PPI network was
presented via Cytoscape (http://cytoscape.org/) (15) and then integrated with the PPI
associated with the significant KEGG pathways, exhibiting the
distribution and mutual connection association of the significant
KEGG pathways in the integrated PPI network.
Protein complexes predicted via
ClusterONE
ClusterONE is a graph-clustering algorithm, which is
used for forecasting the potential protein complexes in the
weighted PPI (16). The weight of
the PPI was set as the score provided by STRING.
Subsequently, the predicted protein complexes were
verified. A protein complex enriched into a KEGG pathway, a protein
domain or a cellular component was identified as a potential
protein with function. The protein domain and cellular component
were analyzed via the database for annotation, visualization and
integrated discovery (17) based
on the InterPro (http://www.ebi.ac.uk/interpro/) (18) database and the gene ontology (GO)
cellular component to conduct enrichment analysis.
GO enrichment analysis of the PPI
network
GO gene annotation of the PPI network was performed
via EnrichNet. GO terms were classified into biological process
(BP) and molecular function (MF). The Pearson correlation
coefficient was 0.8 and the threshold value for the XD-score was
1.68.
Results
Identification of DEGs
To identify the specific DEGs between human FCHL
tissues and healthy controls, the publicly available microarray
dataset, GSE1010 was obtained from the GEO database. The gene
expression profiling data were preprocessed using the Affy package
and were normalized by the median method. At P<0.05, a total of
879 DEGs were identified, including 394 upregulated and 485
downregulated genes, of which the 10 most predominant upregulated
and downregulated genes are listed in Table I.
 | Table IIdentification of differentially
expressed genes associated with familial combined hyperlipidemia
with P<0.05. |
Table I
Identification of differentially
expressed genes associated with familial combined hyperlipidemia
with P<0.05.
| Gene symbol | P-value |
Log2FC |
|---|
| SSX4B///SSX4 | 5.06E-05 | −0.818 |
| TAS2R10 | 6.16E-05 | −1.004 |
| FBXO2 | 6.61E-05 | −0.357 |
| ASMT | 1.16E-04 | −0.578 |
| BMP7 | 1.50E-04 | −0.394 |
| PCSK1 | 1.55E-04 | −0.750 |
| PSD3 | 3.55E-04 | −0.392 |
| GTF2H3 | 5.54E-04 | −0.525 |
| BTNL8 | 5.67E-04 | −0.619 |
| VIL1 | 7.08E-04 | −0.592 |
| RBM12B | 4.92E-05 | 0.556 |
| TFF1 | 1.84E-04 | 0.470 |
| KANSL1L | 1.88E-04 | 0.651 |
| SOX11 | 2.13E-04 | 0.590 |
| UMPS | 5.59E-04 | 0.569 |
| RAP1GAP | 6.81E-04 | 0.380 |
| C2orf83 | 7.06E-04 | 0.418 |
| SDC4 | 7.14E-04 | 0.181 |
| MAST2 | 9.48E-04 | 0.407 |
| AFF2 | 1.06E-03 | 0.223 |
Construction of the PPI network of
DEGs
PPI networks of the DEGs were constructed via
STRING. Subsequently, the KEGG pathway enrichment analysis of DEGs
in the PPI networks was performed using EnrichNet. The PPI network
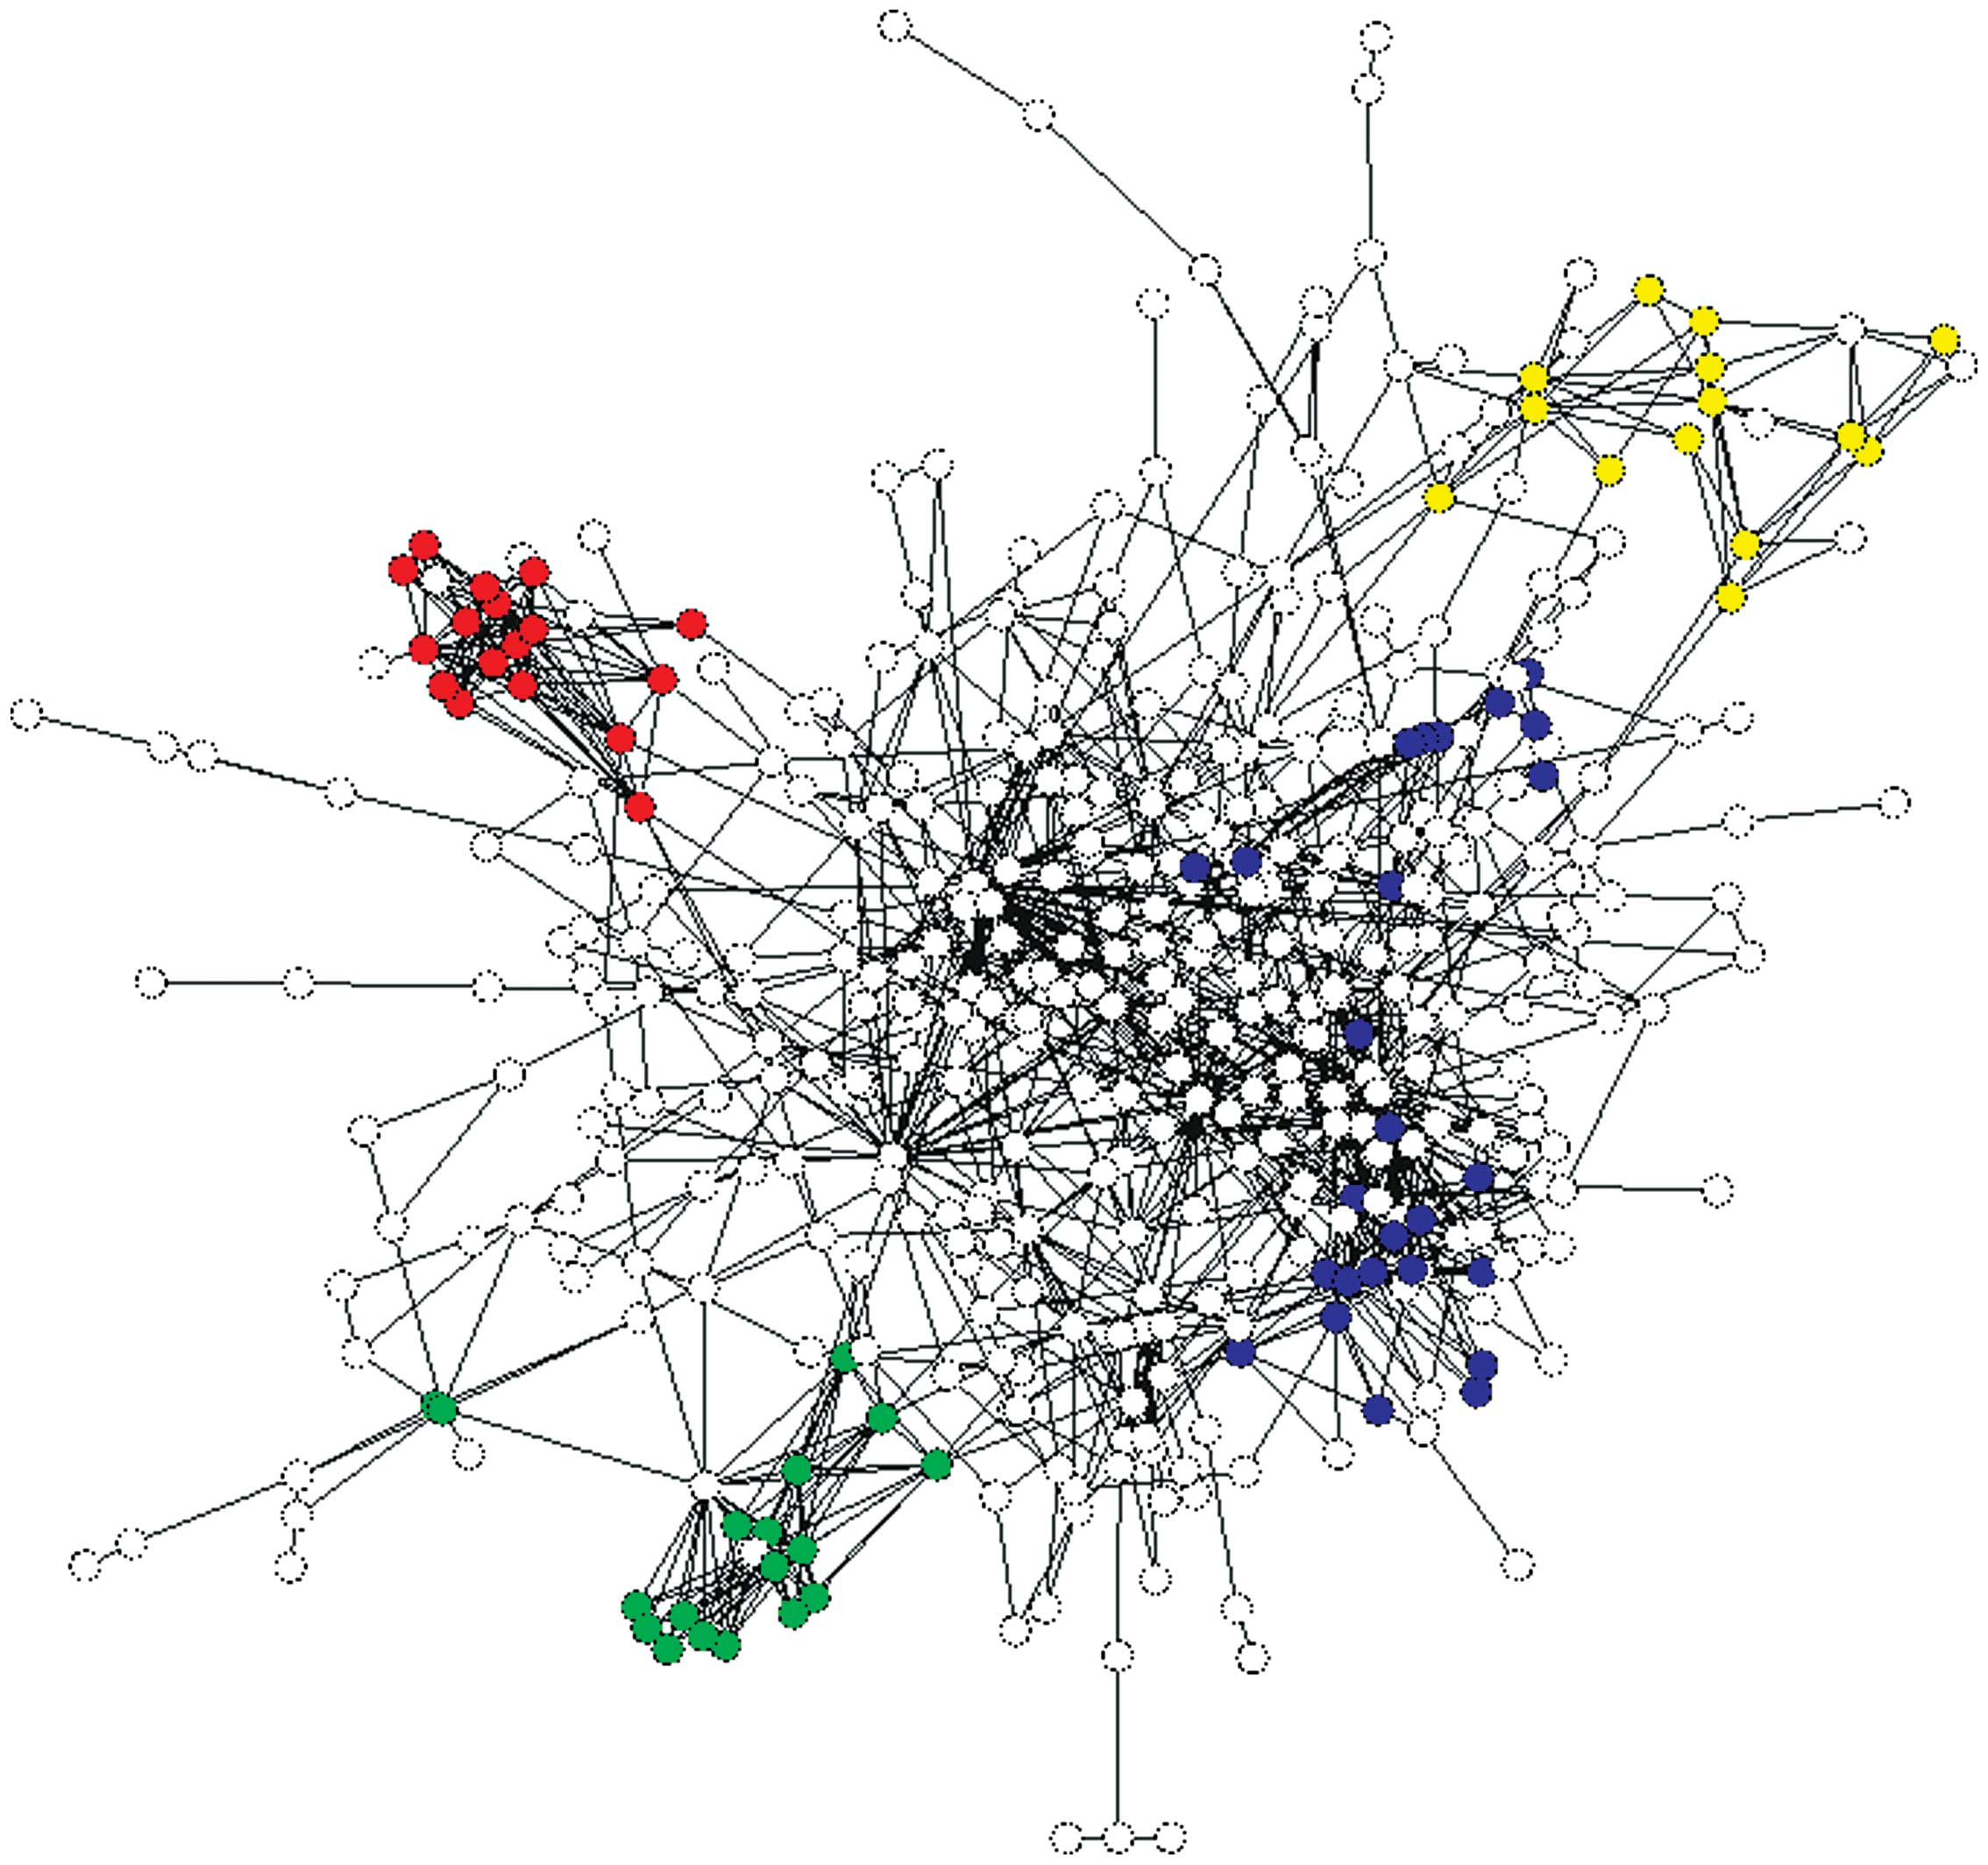
included 431 nodes and 1,124 associations (Fig. 1). The predominant four KEGG
pathways were identified (Table
II), including one carbon pool by folate (hsa00670;
XD-score=1.064), α-linolenic acid metabolism (hsa00592;
XD-score=0.976), asthma (hsa05310; XD-score=0.928), with an
XD-score≥079 and glycosphingo-lipid biosynthesis-globo series
(hsa00603, XD-score=0.762). The enrichment of the glycosphingolipid
biosynthesis pathway may be undervalued by EnrichNet. The DEGs
involved in the four main KEGG pathways are in color within the
diagram of the PPI network (Fig.
1).
| Table IIMain KEGG pathways of differentially
expressed genes. |
Table II
Main KEGG pathways of differentially
expressed genes.
| KEGG pathway | XD-score | Fisher q-value | Gene listb |
|---|
| hsa00670 | 1.064 | 0.331 | MTHFS, MTHFR,
SHMT1 |
| hsa00592 | 0.976 | 0.331 | PLA2G2E, PLA2G3,
PLA2G12A |
| hsa05310 | 0.928 | 0.301 | FCER1A, HLA-DPA1,
HLA-DRB1, IL3, CD40 |
| hsa00603 | 0.762a | 0.460 | ST8SIA1,
B3GALNT1 |
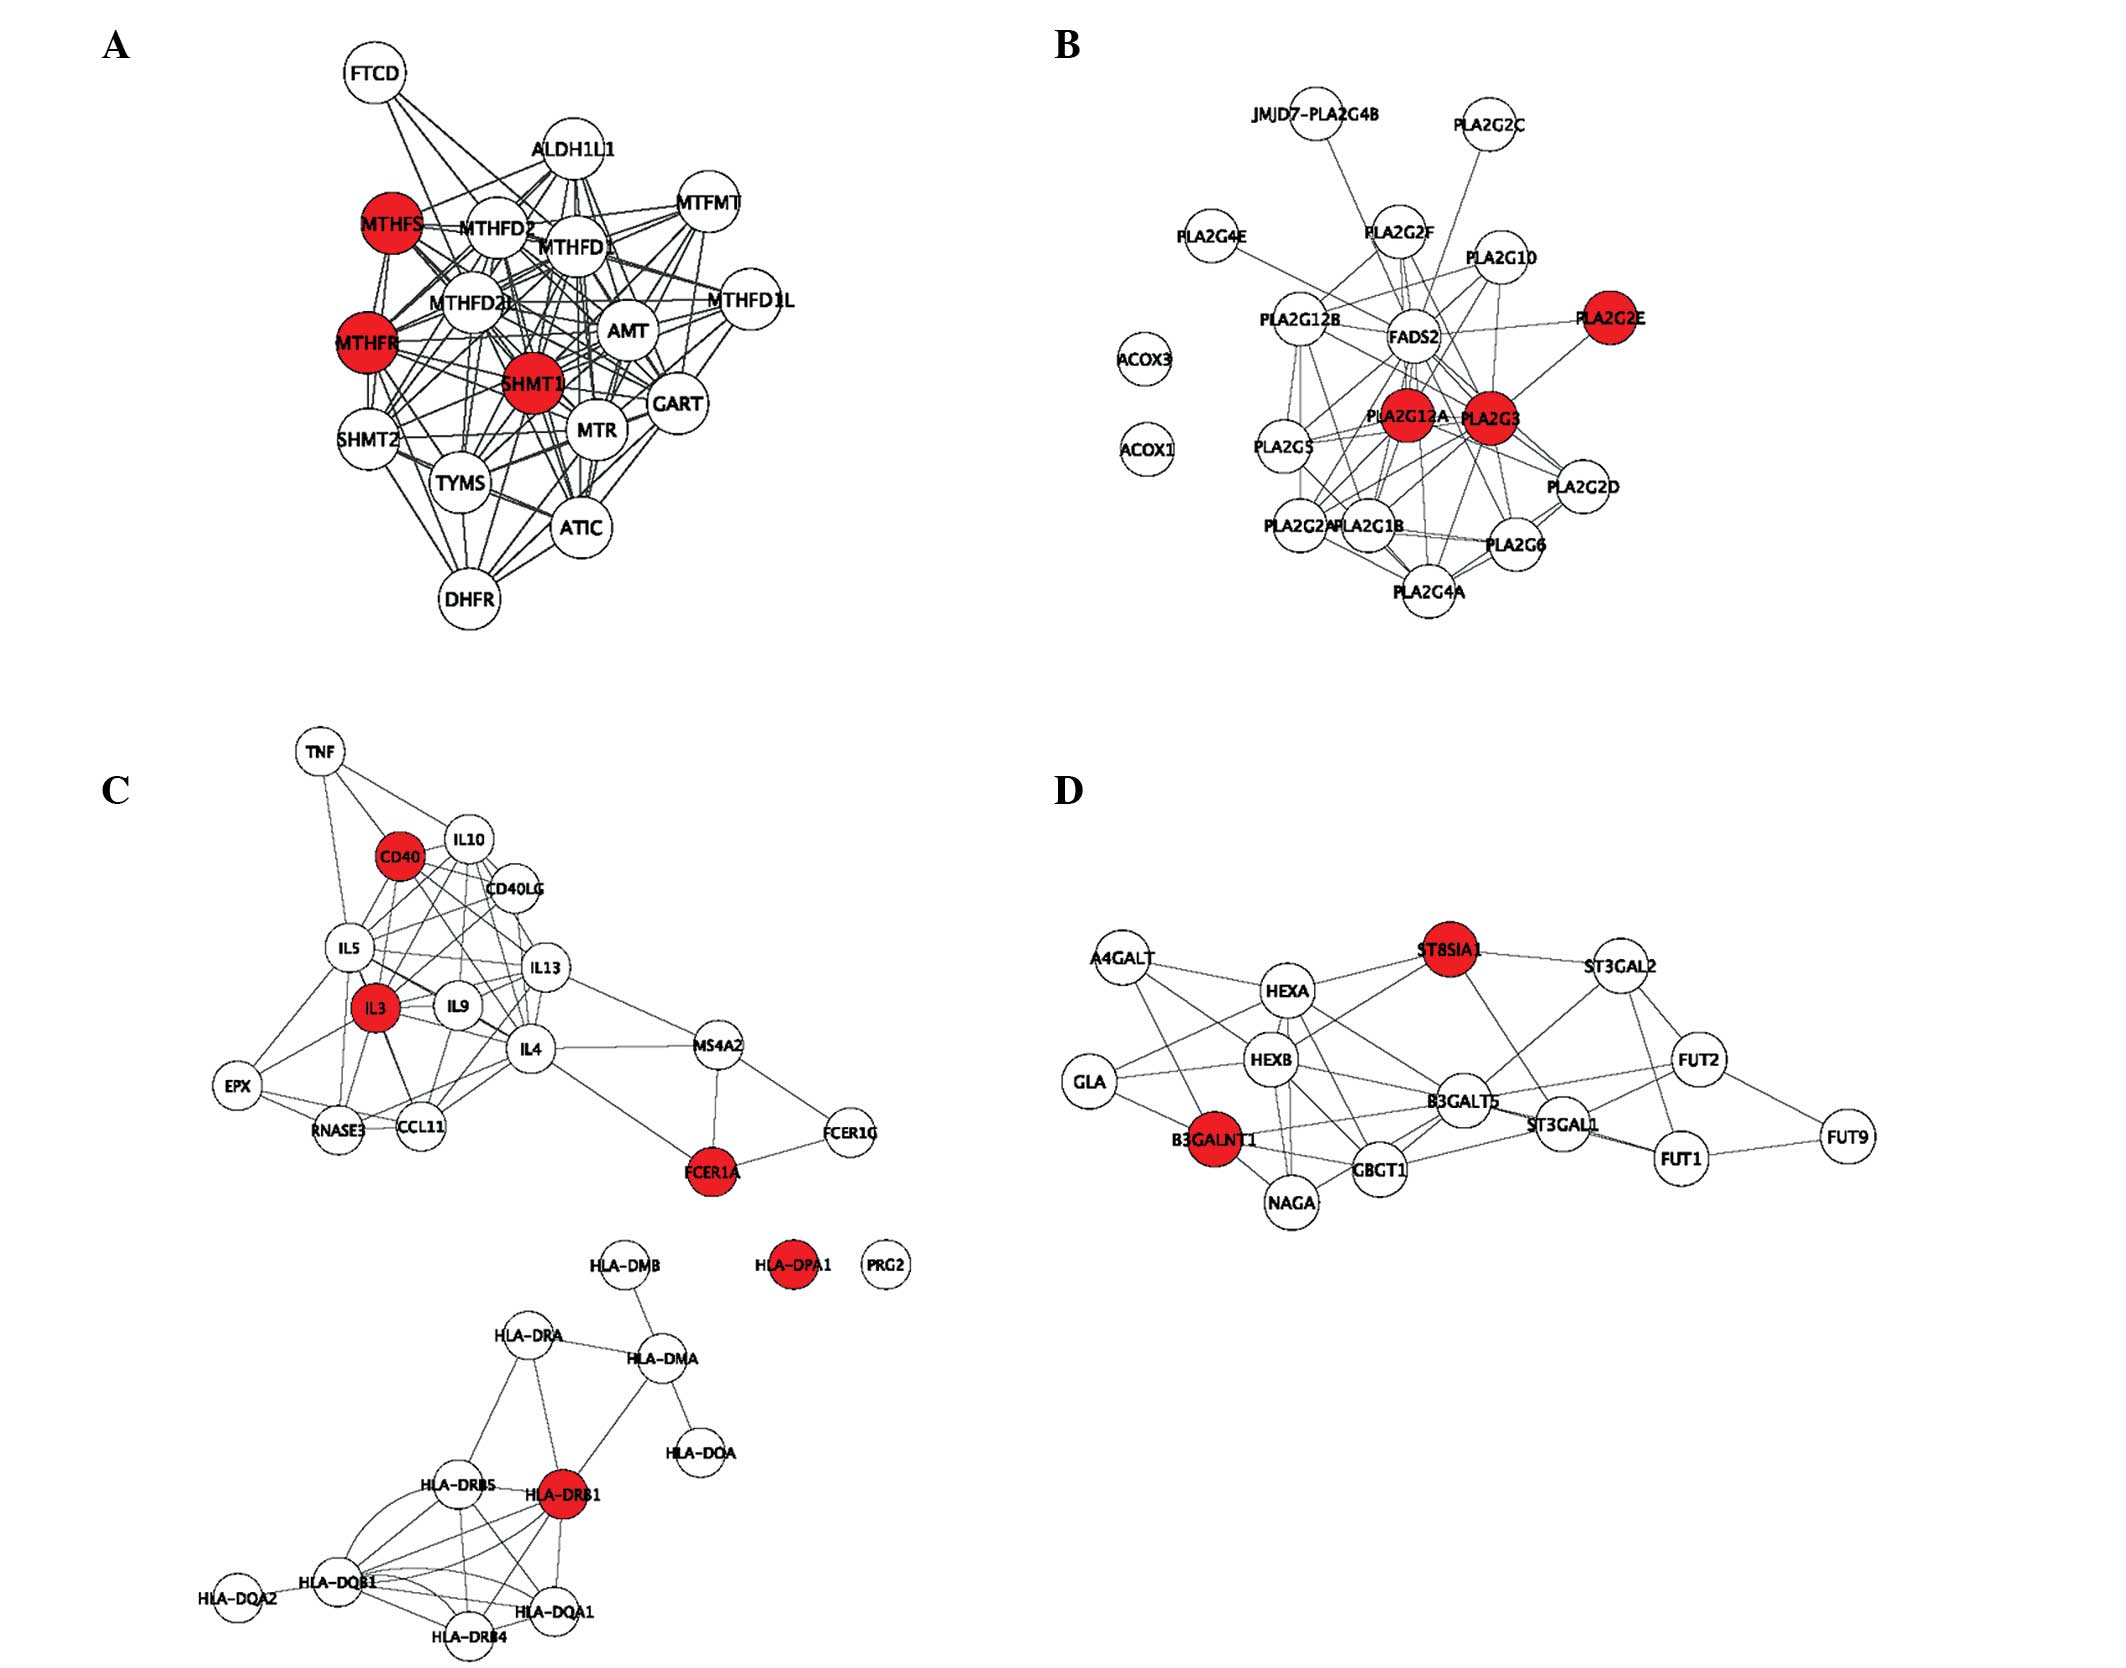
PPI network of DEGs involved in the KEGG
pathway
The PPI network of DEGs involved in the main four
KEGG pathways is shown in Fig. 2,
in which the red nodes represent the DEGs. A number of DEGs were
located in the center of the PPI network. SHMT1 had a high
betweenness value (0.0382) in hsa00670 and it was ranked fifth in
all nodes. (Fig. 2A).
Additionally, the KEGG pathway of hsa00670 is shown in Fig. 3. SHMT1 encodes serine
hydroxymethyltransferase 1, represented as EC 2.1.2.1 (Fig. 3) and is important in this pathway
as it catalyzes the hydrolysis of tetrahydrofolate (THF) into 5,
10-methylene-THF. DEGs in other pathways with high betweenness
included PLA2G and PLA2G12A in hsa00592 (Fig. 2B), HLA-DRB1 in hsa05310 (Fig. 2C) and B3GALNT1 in hsa00603
(Fig. 2D).
ClusterONE prediction of protein
complexes and its validation
At P<0.01, a total of 10 protein complexes were
predicted via ClusterONE (Table
III). The genes of Complexes 1–5 exhibited overlap with the
four main KEGG pathways, indicating that these genes were
differentially enriched in the four KEGG pathways. At the same
time, the protein domain classification of DEGs involved in
Complexes 1–5 demonstrated that these DEGs were from the same
enzyme or signaling molecules and were regulatory in the
corresponding KEGG pathway. In addition, the cellular components of
these DEGs was consistent.
| Table IIIPredicted protein complexes via
ClusterONE. |
Table III
Predicted protein complexes via
ClusterONE.
| Rank | Protein
domains | Relevant
pathway | Cellular
componenta | Gene count | Qualityb | P-value |
|---|
| 1 | Phospholipase
A2 | hsa00592 | Extracellular
region (63%) | 20 | 0.878 | 4.84E-08 |
| 2 | THF dehydrogenase;
formyl transferase; SHMT; | hsa00670 | Mitochondrion
(44%) | 18 | 0.891 | 1.79E-07 |
| 3 | Sialyltransferase;
GTF, family 31; GTF, family 11; GH, family 20 | hsa00603 | Golgi apparatus
(76%) | 17 | 0.756 | 2.77E-06 |
| 4 | Four-helical
cytokine, core; IL-4; IL-17; TNF 2; Peroxidases heam-ligand binding
site; Toll-IL R MHC class I, α chain, α1 and α2 | hsa05310 | Extracellular space
(52%) | 27 | 0.598 | 3.72E–06 |
| 5 | Immunoglobulin
C-Type | hsa05310 | MHC class II
protein complex (100%) | 9 | 0.793 | 5.98E-04 |
| 6 | GPCR,
rhodopsin-like superfamily | NA | Integral to plasma
membrane (75%) | 12 | 0.578 | 7.86E-04 |
| 7 | NA | NA | Synaptic vesicle
(43%) | 8 | 0.701 | 0.001 |
| 8 | NA | NA | NA | 6 | 0.645 | 0.005 |
| 9 | NA | NA | NA | 6 | 0.625 | 0.007 |
| 10 | 3′5′-cyclic
nucleotide PDE; adenylyl cyclase class-3/4/guanylyl cyclase,
conserved site | NA | NA | 7 | 0.711 | 0.007 |
Complex 6 revealed no KEGG pathway enrichment, but
these DEGs were members of the G protein-coupled receptor (GPCR)
family, of which 75% were localized in the cell membrane.
Approximately 43% of the DEGs of Complex 7 were localized in the
synaptic vesicles and the DEGs of Complex 10 were enriched in
protein domains without the determined localization. It was
difficult to determine whether Complex 7 and 10 may have biological
functions. In addition, the function of Complexes 8 and 9 was not
verified, which may be due to an error with ClusterONE.
GO gene annotation of DEGs
GO gene annotation of DEGs revealed 12 BP GO terms
(Table IV), including four GO
terms associated with bone cell proliferation (GO: 0048762
mesenchymal cell differentiation, GO: 0032331 negative regulation
of chondrocyte differentiation, GO: 0045667 regulation of
osteoblast differentiation and GO: 0030278 regulation of
ossification) and one GO term associated with blood (GO: 0071425
hemopoietic stem cell proliferation). The enriched GO terms
associated with bone cells were consistent with the phenomenon that
hyperlipidemia causes bone lesions in experimental and clinical
settings.
| Table IVGO gene annotation of differentially
expressed genes via EnrichNet. |
Table IV
GO gene annotation of differentially
expressed genes via EnrichNet.
| GO (biological
process) | XD-score | Fisher q-value | Gene count |
|---|
| GO:0048762
(mesenchymal cell differentiation) | 4.033 | 0.018 | 5 |
| GO:0032331
(negative regulation of chondrocyte differentiation) | 2.303 | 0.162 | 4 |
| GO:0045885
(positive regulation of survival gene product expression) | 2.303 | 0.162 | 4 |
| GO:0060445
(branching involved in salivary gland morphogenesis) | 2.303 | 0.162 | 4 |
| GO:0007567
(parturition) | 2.233 | 0.280 | 3 |
| GO:0090009
(primitive streak formation) | 2.233 | 0.280 | 3 |
| GO:0060740
(prostate gland epithelium morphogenesis) | 2.233 | 0.280 | 3 |
| GO:0045667
(regulation of osteoblast differentiation) | 2.105 | 0.194 | 3 |
| GO:0030278
(regulation of ossification) | 1.988 | 0.317 | 3 |
| GO:0010039
(response to iron ion) | 1.933 | 0.208 | 3 |
| GO:0071425
(hemopoietic stem cell proliferation) | 1.783 | 0.332 | 3 |
| GO:0018298
(protein-chromophore linkage) | 1.783 | 0.332 | 3 |
Discussion
The present study used the EnrichNet online database
to analyze RNA samples from patients with FCHL. Initially, the PPI
network was constructed for DEGs, subsequently PPI and KEGG
pathways were compared in the database (or GO gene annotation) and
the KEGG pathway enrichment in DEGs (or GO terms) were identified.
KEGG pathway analysis identified four important KEGG pathways,
including one carbon pool by folate (hsa00670), α-linolenic acid
metabolism (hsa00592), asthma (hsa05310) and the glycosphingolipid
biosynthesis-globo series (hsa00603). The one carbon pool by folate
pathway consists of the folic acid synthesis of folate THF
biosynthesis and the C1-unit conversion process. THF, a carrier of
the one-carbon group, acts as a coenzyme DNA-synthesis of nucleic
acid and a lack of THF can lead to anemia (19). The α-linolenic acid metabolism KEGG
pathway is associated with fatty acid α-linolenic acid metabolism.
α-linolenic acid can reduce cholesterol levels in the blood
(20) and alleviate the effect of
hyperlipidemia (21,22). The asthma pathway enriched by DEGs
of patients with hyperlipidemia may be associated with evidence
suggesting that hyperlipidemia may cause asthma-associated
complications (23).
Glycosphingolipid synthesized via the glycosphingolipid
biosynthesis-globo series pathway may accumulate in the artery wall
and precipitate, which is an established feature of atherosclerosis
(24). When this pathway is
inhibited, the cholesterol content in the blood is reduced and the
degree of atherosclerosis is alleviated (25). The important effect of
glycosphingolipid on hyperlipidemia has been discussed previously
(26).
Parhami (27)
summarized the effects of hyperlipemia on osteoporosis as several
patients with atherosclerosis also suffer from osteoporosis. This
review suggests that hyperlipemia is the cause of osteoporosis.
Further studies have also discussed the association between
pathological changes of bone tissue and hyperlipidemia (28,29).
For example, although Complex 6 exhibited no KEGG pathway
enrichment, these DEGs were identified as members of the GPCR
family, of which 75% were localized in the cell membrane. GPCRs
have provided novel opportunities for structure-based drug design
strategies targeting this protein family (30).
GO function analysis identified 12 enriched BP
terms, of which one term was associated with hematopoiesis and four
terms were associated with bone cell differentiation. This finding
was in accordance with hyperlipidemia and bone lesions in clinical
and experimental settings. To date, clinical trials for the
treatment of ischemic heart disease and heart failure using bone
marrow cells have rapidly increased (31). Baldán et al (32) have demonstrated that diet-induced
atherosclerosis is impaired when atherosclerotic-susceptible mice
are transplanted with ATP-binding cassette sub-family G member 1
(Abcg1)−/− bone marrow. The demonstration that
Abcg1−/− macrophages undergo accelerated apoptosis
provides a mechanism to explain the decrease in atherosclerotic
lesions. Drechsler et al (33) provided evidence that
hypercho-lesterolemia-induced neutrophilia is multifactorial and
that neutrophils infiltrate arteries primarily during early stages
of atherosclerosis, which also supports the present results.
In conclusion, the current study identified 897 DEGs
and analyzed their functions. Additionally, bioinformatics methods
were used to analyze the overlapping DEGs with known genes of the
KEGG pathways. Subsequently, the enriched GO terms of DEGs were
analyzed. The present study may provide a basis for improved
understanding of FCHL. However, experimental studies are required
to confirm these findings.
References
|
1
|
Sentinelli F, Minicocci I, Montali A, et
al: Association of RXR-Gamma gene variants with Familial combined
hyper-lipidemia: Genotype and haplotype analysis. J Lipids.
2013:5179432013. View Article : Google Scholar
|
|
2
|
Wojciechowski AP, Farrall M, Cullen P, et
al: Familial combined hyperlipidaemia linked to the apolipoprotein
AI-CIII-AIV gene cluster on chromosome 11q23q-q24. Nature.
349:161–164. 1991. View
Article : Google Scholar : PubMed/NCBI
|
|
3
|
Ayyobi AF, McGladdery SH, McNeely MJ,
Austin MA, Motulsky AG and Brunzell JD: Small, dense LDL and
elevated apolipoprotein B are the common characteristics for the
three major lipid phenotypes of familial combined hyperlipidemia.
Arterioscler Thromb Vasc Biol. 23:1289–1294. 2003. View Article : Google Scholar : PubMed/NCBI
|
|
4
|
Sniderman A and Ribalta J: How should FCHL
be defined and how should we think about its metabolic bases? Nutr
Metab Cardiovasc Dis. 11:259–273. 2001.
|
|
5
|
Hsieh C, Pei D, Hung Y and Hsiao F:
Association between retinoid-X receptor-gamma genetic polymorphisms
and diabetic retinopathy. Genet Mol Res. 10:3545–3551. 2011.
View Article : Google Scholar : PubMed/NCBI
|
|
6
|
Pushpakom SP, Owen A, Back DJ and
Pirmohamed M: RXRγ gene variants are associated with HIV
lipodystrophy. Pharmacogenet Genomics. 23:438–441. 2013. View Article : Google Scholar : PubMed/NCBI
|
|
7
|
Wang Y, Xue F, Liu L and He Z: Pathway
analysis detect potential mechanism for familial combined
hyperlipidemia. Eur Rev Med Pharmacol Sci. 17:1909–1915.
2013.PubMed/NCBI
|
|
8
|
Pajukanta P, Lilja HE, Sinsheimer JS, et
al: Familial combined hyperlipidemia is associated with upstream
transcription factor 1 (USF1). Nat Genet. 36:371–376. 2004.
View Article : Google Scholar : PubMed/NCBI
|
|
9
|
Coon H, Myers RH, Borecki IB, et al:
Replication of linkage of Familial combined hyperlipidemia to
chromosome 1q with additional heterogeneous effect of
apolipoprotein AI/C-III/A-IV locus The NHLBI Family Heart Study.
Arterioscler Thromb Vasc Biol. 20:2275–2280. 2000. View Article : Google Scholar : PubMed/NCBI
|
|
10
|
Smyth GK: Limma: Linear Models for
Microarray Data. Bioinformatics and Computational Biology Solutions
Using R and Bioconductor. Gentleman R, Carey V, Huber W, Irizarry R
and Dudoit S: Springer; New York, NY: pp. 397–420. 2005, View Article : Google Scholar
|
|
11
|
Ritchie ME, Silver J, Oshlack A, et al: A
comparison of background correction methods for two-colour
microarrays. Bioinformatics. 23:2700–2707. 2007. View Article : Google Scholar : PubMed/NCBI
|
|
12
|
Smyth GK: Linear models and empirical
bayes methods for assessing differential expression in microarray
experiments. Stat Appl Genet Mol Biol. 3:32004.
|
|
13
|
Glaab E, Baudot A, Krasnogor N, Schneider
R and Valencia A: EnrichNet: network-based gene set enrichment
analysis. Bioinformatics. 28:i451–i457. 2012. View Article : Google Scholar : PubMed/NCBI
|
|
14
|
Jensen LJ, Kuhn M, Stark M, et al: STRING
8-a global view on proteins and their functional interactions in
630 organisms. Nucleic Acids Res. 37:D412–D416. 2009. View Article : Google Scholar
|
|
15
|
Shannon P, Markiel A, Ozier O, et al:
Cytoscape: a software environment for integrated models of
biomolecular interaction networks. Genome Res. 13:2498–2504. 2003.
View Article : Google Scholar : PubMed/NCBI
|
|
16
|
Nepusz T, Yu H and Paccanaro A: Detecting
overlapping protein complexes in protein-protein interaction
networks. Nat Methods. 9:471–472. 2012. View Article : Google Scholar : PubMed/NCBI
|
|
17
|
Dennis G Jr, Sherman BT, Hosack DA, et al:
DAVID: database for annotation, visualization and integrated
discovery. Genome Biol. 4:P32003. View Article : Google Scholar
|
|
18
|
Hunter S, Jones P, Mitchell A, et al:
InterPro in 2011: new developments in the family and domain
prediction database. Nucleic Acids Res. 40:D306–D312. 2012.
View Article : Google Scholar :
|
|
19
|
Locasale JW: Serine, glycine and
one-carbon units: cancer metabolism in full circle. Nat Rev Cancer.
13:572–583. 2013. View
Article : Google Scholar : PubMed/NCBI
|
|
20
|
Almario RU, Vonghavaravat V, Wong R and
Kasim-Karakas SE: Effects of walnut consumption on plasma fatty
acids and lipoproteins in combined hyperlipidemia. Am J Clin Nutr.
74:72–79. 2001.PubMed/NCBI
|
|
21
|
Alessandri C, Pignatelli P, Loffredo L, et
al: Alpha-linolenic acid-rich wheat germ oil decreases oxidative
stress and CD40 ligand in patients with mild hypercholesterolemia.
Arterioscler Thromb Vasc Biol. 26:2577–2578. 2006. View Article : Google Scholar : PubMed/NCBI
|
|
22
|
Zhao G, Etherton TD, Martin KR, West SG,
Gillies PJ and Kris-Etherton PM: Dietary α-linolenic acid reduces
inflammatory and lipid cardiovascular risk factors in
hypercholesterolemic men and women. J Nutr. 134:2991–2997.
2004.PubMed/NCBI
|
|
23
|
Al-Shawwa B, Al-Huniti N, Titus G and
Abu-Hasan M: Hypercholesterolemia is a potential risk factor for
asthma. J Asthma. 43:231–233. 2006. View Article : Google Scholar : PubMed/NCBI
|
|
24
|
Nakou E, Babageorgakas P, Bouchliou I, et
al: Statin-induced immunomodulation alters peripheral invariant
natural killer T-cell prevalence in hyperlipidemic patients.
Cardiovasc Drugs Ther. 26:293–299. 2012. View Article : Google Scholar : PubMed/NCBI
|
|
25
|
Bietrix F, Lombardo E, van Roomen CP, et
al: Inhibition of glycosphingolipid synthesis induces a profound
reduction of plasma cholesterol and inhibits atherosclerosis
development in APOE*3 Leiden and low-density lipoprotein
receptor−/−mice. Arterioscler Thromb Vasc Biol. 30:931–937. 2010.
View Article : Google Scholar : PubMed/NCBI
|
|
26
|
Hara A and Taketomi T: Characterization
and changes of glycosphingolipids in the aorta of the Watanabe
hereditable hyperlipidemic rabbit. J Biochem. 109:904–908.
1991.PubMed/NCBI
|
|
27
|
Parhami F: Possible role of oxidized
lipids in osteoporosis: could hyperlipidemia be a risk factor?
Prostaglandins, leukotrienes and essential fatty acids. 68:373–378.
2003. View Article : Google Scholar
|
|
28
|
Solomon DH, Avorn J, Canning CF and Wang
PS: Lipid levels and bone mineral density. Am J Med. 118:14142005.
View Article : Google Scholar
|
|
29
|
Schmiedl A, Schwille P, Bonucci E, Erben
R, Grayczyk A and Sharma V: Nephrocalcinosis and hyperlipidemia in
rats fed a cholesterol-and fat-rich diet: association with
hyperoxaluria, altered kidney and bone minerals and renal tissue
phospholipid-calcium interaction. Urol Res. 28:404–415. 2000.
View Article : Google Scholar
|
|
30
|
Rosenbaum DM, Cherezov V, Hanson MA, et
al: GPCR engineering yields high-resolution structural insights
into β2-adrenergic receptor function. Science. 318:1266–1273. 2007.
View Article : Google Scholar : PubMed/NCBI
|
|
31
|
Liao J, Chen X, Li Y, et al: Transfer of
bone-marrow-derived mesenchymal stem cells influences vascular
remodeling and calcification after balloon injury in hyperlipidemic
rats. J Biomed Biotechnol. 2012:1652962012. View Article : Google Scholar : PubMed/NCBI
|
|
32
|
Baldán Á, Pei L, Lee R, et al: Impaired
development of atherosclerosis in hyperlipidemic Ldlr−/− and
ApoE−/− mice transplanted with Abcg1−/−bone marrow. Arterioscler
Thromb Vasc Biol. 26:2301–2307. 2006. View Article : Google Scholar
|
|
33
|
Drechsler M, Megens RT, van Zandvoort M,
Weber C and Soehnlein O: Hyperlipidemia-triggered neutrophilia
promotes early atherosclerosis. Circulation. 122:1837–1845. 2010.
View Article : Google Scholar : PubMed/NCBI
|