Introduction
Hepatic failure (HF) is caused by a variety factors,
which induce liver cell damage and liver dysfunction. HF is one of
the most severe conditions observed in hospital emergencies. Severe
HF can cause hepatic encephalopathy, hepatorenal syndrome and
hemorrhaging (1,2). The mortality rate of HF is between
~70 and 80% (3,4). High levels of ammonia in the blood
may be an important cause of liver abnormalities or failure
(5).
It was demonstrated between 2005 and 2011, at The
First Affiliated Hospital of Zhengzhou University (Zhengzhou,
China), that treating patients with liver failure with
ammonia-lowering drugs resulted in remission, reduced patient
mortality and improved patient prognosis (6). Our previous study established a
chronic hyperammonemia attack rat model and demonstrated that the
enzymatic indicators of liver damage were significantly increased
(5,7). Pathological investigations
demonstrated that hyperammonemia induces liver cell damage, not by
inflammation or necrosis, but by cell apoptosis. Excessive
hyperammonemia may be important for the regulation of the
developmental process of hepatocyte apoptosis and liver damage
(7–9).
However, the toxicity of high blood ammonia varies
in different cell types (9). At
the same concentration of blood ammonia, the growth of McCoy, MDCK,
HeLa and BHK cell lines are markedly inhibited, however, the 293,
HDF, Vero and PQXB1/2 cell lines are affected less, revealing that
the effect of ammonia on cells is cell type-specific. Liver failure
caused by elevated blood ammonia can damage neurons or glial cells,
leading to hepatic encephalopathy (10). The damage and toxicity of high
blood ammonia to liver cells remains to be elucidated. Further
investigation into the effect of high blood ammonia on liver cell
injury and its underlying mechanism is important in understanding
liver failure.
Materials and methods
Experimental cells
The present study was approved by the Committee of
Ethics in Animal Experiments of the First Affiliated Hospital of
Zhengzhou University (Henan, China). Liver cells were collected
from six healthy female Sprague-Dawley rats between 6 and 8 weeks
old, weighing 230 g. The rats were obtained from Henan Experimental
Animal Center (Certificate of Conformity: SCXK (Henan) 2005-0001;
Zhengzhou University). The rats were housed in a room with a 12 h
light/12 h dark cycle (22±2°C), and were given ad libitum
access to standard food and water. The rats were treated in
compliance with the Institutional Guidelines of Zhengzhou
University. BCG-823 gastric cancer cells, 9706 esophageal carcinoma
cells and A549 lung cancer cells were donated from Chao Han
(Clinical Pharmacology Laboratory).
Liver cell culture
Six rats were housed in a room with a rotating 12 h
light and 12 h dark cycle. The temperature was 22 ± 2°C, and the
rats were given standard water and food ad libitum. All
procedures were approved by the Committee of Ethics in Animal
Experiments at Zhengzhou University (Henan, China) and all animals
were provided humane care in compliance with the institutional
guidelines of Zhengzhou University. Sodium pentobarbital anesthesia
is used. The animals were decapitated, submerged in 75% alcohol
(Solarbio Science & Technology Co., Ltd., Beijing, China) for
2–3 min and the liver tissues were separated using PBS (Solarbio
Science & Technology Co., Ltd.) at 4°C. Following the removal
of capsule and fabric composition, the livers were cut into small
sections (1 mm3) using a one-sided blade and cleaned
twice with PBS at 4°C to remove fragments from the cutting process.
The small tissue sections were added to 15 ml collagenase IV in
0.05% Dulbecco’s modified Eagle’s medium (DMEM; Solarbio Science
& Technology Co., Ltd.) and digested for 30 min in a 37°C
incubator. Clockwise agitation was performed every 5–10 min and,
following digestion, the tissue sections were pipetted, filtered
using a 120 mesh strainer (Solarbio Science & Technology Co.,
Ltd.) and cleaned with 5 ml PBS. The cell suspension (~20 ml) was
collected separately into two micro-centrifuge tubes (Solarbio
Science & Technology Co., Ltd.), prior to centrifugation for 2
min at 40 × g three times. Percoll separation liquid (5 ml;
Solarbio Science & Technology Co., Ltd.) and the cell
suspension were added to every sample (5:3 ratio), and centrifuged
for 10 min at 118–161 × g. The cell suspension (5×10⁵
cells/ml) required careful addition onto the surface of the
separation liquid using a pipette. The purified liver cell
suspension (2–3 ml) was pipetted from the bottom of the tube into 5
ml DMEM and stained with 0.4% trypan blue (Solarbio Science &
Technology Co., Ltd.). For subsequent experiments, the required
survival rate of cells was >90%.
The rat liver cells, which were anchorage-dependent,
were cultured in RPMI-1640 medium (Solarbio Science &
Technology Co., Ltd.) containing 10% fetal bovine serum (FBS)
(Solarbio Science & Technology Co., Ltd.) in an 37°C incubator
(5% CO2 and 80% humidity). The cells were passaged every
2–3 days once confluence of 80% had been reached. When the cultured
cells grew against the wall of flask, the logarithmic growth phase
cells were collected for further investigation.
Determination of modeling concentration
using an MTT colorimetric assay
The rat liver cells (105 cells/ml) were
seeded into 96-well culture plates with RPMI-1640 medium
supplemented with 10% FBS (100 μl/well). Following growth to
the appropriate density (5×10⁵ cells/ml),
NH4Cl solution was added to the cells at a final
concentration of 5, 10, 20, 40, 80 or 100 mM, and the cells were
divided into a cell culture free group and a normal control group
(four wells per group). The BCG-823 gastric cancer cells, 9706
esophageal carcinoma cells and A549 lung cancer cells were cultured
in NH4Cl solution at identical concentrations
(5×10⁵cells/ml). After 24 h, 20 μL MTT (5 mg/ml
PBS) was added to the wells. Following incubation for 4 h at 37°C,
the supernatant was discarded. Dimethyl sulfoxide (200 μl)
was added to each well and mixed thoroughly in the dark. Finally,
the optical density (OD) was measured at 490 nm using an enzymatic
analyzer (NanoDrop 2000; Thermo Fisher Scientific, Waltham, MA,
USA). Inhibition of cell proliferation was calculated using the
following formula: Inhibition ratio = 1 − OD mean value of trial
group / control group) × 100%. The half maximal inhibitory
concentration (IC50) was calculated using
IC50 software (Calcusyn 2.0; Biosoft, Cambridge,
UK).
The rat liver cells were divided into six groups
(four wells per group) in 96-well culture plates (Suzhou ConRem
Biomedical Technology Co., Ltd., Suzhou, China). A control group
remained untreated and the cells in the NH4Cl treatment
group were cultured in 2.5, 5, 10, 20, 40 or 50 mm NH4Cl
(Solarbio Science & Technology Co., Ltd.). In the EGTA group, 2
mM EGTA (Solarbio Science & Technology Co., Ltd.) was added at
the same time as the NH4Cl. Another three groups were
treated with 0.1, 0.01 or 0.001 μmol/l BAPTA-acetoxymethyl
ester (BAPTA-AM; Solarbio Science & Technology Co., Ltd.) 40–60
min at 37°C prior to NH4Cl treatment. Continue to
develop for 6 h, the MTT assay was then performed, as described
above.
Determination of cell survival and cell
growth using an MTT colorimetric assay
The rat liver cells (105 cells/ml) were
seeded into 96-well culture plates (100 μl/well) with
RPMI-1640 medium supplemented with 10% FBS (100 μl/well).
Following growth to the appropriate density (5×10⁵
cells/ml), NH4Cl solution was added at a final
concentration of 2.5, 5, 10, 20, 40 or 50 mM and the cells were
divided into a cell culture free group and a control group (PBS;
four wells per group). The cells were cultured for 24 and 48 h,
respectively, and the medium was replaced every 6 h. In the
BAPATA-AM groups, BAPATA-AM was added 40–60 min prior to treatment
with NH4Cl at a final concentration of 0.01 μM.
By contrast, in the EGTA groups, the EGTA and NH4Cl were
added at the same time at a final concentration of 2 mM. The other
treatments performed were as described above. The inhibition of
cell proliferation was calculated using the following formula:
Inhibition ratio = 1 − mean OD of trial group / control group) ×
100%.
Determination of cell apoptosis using
flow cytometry
The rat liver cells (2 ml; 1×10⁵/ml) were
uniformly seeded into 6-well culture plates. Following 18–24 h
culture, NH4Cl solution was added at concentrations of
0, 1, 5, 10 or 20 mM, and the cells were cultured for a further 24
h. The liver cells were collected by trypsin enzyme-digesting
(Solarbio Science & Technology Co., Ltd.) without EDTA and the
cell suspension samples (5×10⁵ cells) were obtained for
detection. Following washing twice with PBS, the rat liver cells
were resuspended (5×10⁵ cells/ml) in 2 ml binding buffer
(Solarbio Science & Technology Co., Ltd.) and incubated with
fluorescein isothiocyanate at room temperature for 20 min in the
dark, prior to being centrifuged for 5 min at 118 × g. The cells
were resuspended in 2 ml binding buffer and 2 μl propidium
iodide (500 mg/ml; Solarbio Science & Technology Co., Ltd.) was
added for 20 min in the dark, prior to being centrifuged for 5 min
at 118 × g. The collected cells were resuspended in 2 ml PBS. The
quantity of apoptotic cells was measured by flow cytometry (XL-MCL;
BD Biosciences, Franklin Lakes, NJ, USA) immediately following
staining (excitation wavelength, 488 nm; emission wavelength, 530
nm).
Rat liver cells (2 ml; 1×10⁵ cells/ml)
were uniformly seeded into 6-well culture plates. Following 18–24 h
culture at 37°C, NH4Cl solution was added at a final
concentration of 0, 2, 10, 20 or 40 mM and the cells were cultured
for a further 6 h. In the BAPATA-AM groups, BAPATA-AM was added for
40–60 min at 37°C prior to treatment with NH4Cl at a
final concentration of 0.01 μM. Flow cytometry was then
performed, as described above.
Determination of mitochondrial
permeability transition pore (MPTP)
Rat liver cells (2 ml; 1×10⁵ cells/ml)
were uniformly seeded into 6-well culture plates. Following 18–24 h
culture, NH4Cl solution was added at a final
concentration of 0 or 10 mM. In the BAPATA-AM groups, BAPATA-AM was
added 40–60 min prior to treatment with NH4Cl at a final
concentration of 0.01 μM and cultured for a further 24 h
with the medium changed every 6 h. The liver cells were collected
using trypsin enzyme-digesting without EDTA, centrifuged for 5 min
at 118 × g and the supernatant was discarded. Following a single
wash with PBS, the cell samples were washed twice with 37°C
preheated cleaning buffer, containing stain fluid (Solarbio Science
& Technology Co., Ltd.) and neutralization liquid (1:100;
GenMed Scientifics Inc., Shanghai, China) for 20 min at 37°C in the
dark. Following washing, MPTP was measured by flow cytometry
(XL-MCL), which was analyzed once every 10 min with at least 10,000
cells assessed at each time point (excitation wavelength, 488 nm;
emission wavelength, 530 nm).
Determination of the expression of target
proteins by western blot analysis
Cell protein extraction
The rat liver cells (2 ml; 1×10⁵
cells/ml) were uniformly seeded into 6-well culture plates.
Following 18–24 h culture, NH4Cl solution was added at a
final concentration of 0, 1, 5, 10 and 20 mmol/l and cultured for a
further 24, 48 or 72 h. The culture media was discarded and the
cell samples were washed gently with pre-cooled PBS (4°C; 0.01 M;
pH 7.2–7.3) three times. Following washing, 200 μl
phenylmethanesulfonyl fluoride (PMSF)-based lysis solution
containing 50 mmol/l Tris-HCl, (pH8.0), 150 mmol/l NaCl, 1%
TritonX-100 and 100 μg/ml PMSF, was added for 30 min on ice.
The cells were transferred rapidly into microcentrifuge tubes to
centrifuge at 14,000 rpm for 8 min at 4°C. The supernatant was
collected and stored at −20°C.
Determination of protein
concentrations
According to the number of protein standards and the
number of samples, bicinchoninic acid (BCA) working fluid was
prepared with reagent A and reagent B (50:1; Solarbio Science &
Technology Co., Ltd.). A lyophilized standard panel was firstly
diluted into 10 mg/ml stock-solution containing 1 ml NaCl (0.9%),
and further diluted to 25–2,000 μg/ml for the standard
curve. Standard marker (25 μl; Solarbio Science &
Technology Co., Ltd.) and the sample were added into 96-well plates
with 200 μl BCA working fluid. Following mixing, the 96-well
plate was covered and incubated for 30 min at 37°C and subsequently
cooled to room temperature. The protein concentration was
calculated using a Nanodrop 2000.
Determination of the protein
expression levels of poly (ADP-ribose) polymerase (PARP) and
cytochrome c (Cyt C)
Protein samples (30 μg) were adjusted to an
identical volume and 4 μl 6X loading buffer was added prior
to samples being heated for denaturation (95°C). The proteins were
separated on 12% sodium dodecyl sulphate polyacrylamide gel
electrophoresis gels, transferred onto a polyvinylidene difluoride
membrane and the membrane was blocked with blocking buffer
(membranes and buffer from Solarbio Science & Technology Co.,
Ltd.) at 4°C for 1 h. The membrane was incubated with primary
antibodies against Cyt C (1:3,000; Bioss, Shanghai, China) rat
monoclonal PARP (1:3,000; sc-71851, Santa Cruz Biotechnology,
Dallas, TX, USA) overnight at 4°C and then a horseradish peroxidase
enzyme-labeled secondary antibody (1:1,000) at 37℃ for 1 h. The
protein expression levels were determined using an Odyssey CLX
system (LI-COR Biosciences, Lincoln, NE, USA).
Determination of the mRNA expression
levels of calmodulin (CaM) and CaM-dependent kinase (CaMK)II by
reverse transcription quantitative polymerase chain reaction
(RT-qPCR)
RNA extraction
Rat liver cells (2 ml; 1×10⁵ cells/ml)
were uniformly seeded into 6-well culture plates. Following 18–24 h
culture, NH4Cl solution was added at a final
concentration of 0, 1, 5, 10 or 20 mmol/l and further cultured for
12, 24 or 48 h. The supernatant was discarded. TRIzol reagent (1
ml; Invitrogen Life Technologies, Carlsbad, CA, USA) was added and
the cells were incubated for 5 min on ice, prior to pipetting. The
cells were transferred to Eppendorf tubes, 0.2 ml chloroform was
added and shaken rapidly for 15 min, incubated for 5 min at room
temperature and centrifuged for 10 min at 161 × g at 4°C. The upper
colorless aqueous phase, which included the RNA, occupied ~50% of
the homogenate. The supernatant (400 μl) was carefully
transferred to a separate Eppendorf tube and 0.5 ml isopropyl
alcohol was added for 10 min at room temperature, prior to being
centrifuged for 10 min at 161 × g at 4°C. Small milky sediments,
containing RNA, were collected at the bottom of the tube. The
supernatant was discarded and the RNA was washed with precooled 75%
ethanol, centrifuged for 5 min at 161 × g at 4°C and the
supernatant was discarded. The RNA was dried in a sterile
environment using a vacuum and subsequently dissolved in 20
μl diethylpyrocarbonate (DEPC) to determine the purity and
concentration of the RNA by Nanodrop. The samples were stored at
−80°C.
RT of RNA to cDNA
The extracted RNA was dissolved in 11 μl DEPC
water. Oligo (dT; 1 μl) and primer (0.5 μg/μl;
18 μl; Takara Bio, Inc., Otsu, Japan) were added and mixed
gently, prior to centrifugation for 3–5 sec and heated at 70°C for
5 min in a water bath. Following cooling the samples on ice and
short centrifugation, 4 μl 5X reaction buffer, 1 μl
Ribolock™ ribonuclease inhibitor (20 μg/μl) and 2
μl 10 mM dNTP mix were added (Takara Bio, Inc.), mixed
gently and centrifuged for 3–5 sec. The samples were then amplified
by PCR for 5 min at 37°C. RevertAid™ M-MuLV Reverse Transcriptase
(1 μL; 200 μg/μl; Takara Bio, Inc.) was added
and PCR was performed for 60 min at 42°C and 10 min at 70°C.
Finally, the reaction products were collected and cooled on
ice.
qPCR
The qPCR was performed using a SYBR®
Premix Ex Taq™ II test kit (Takara Bio Inc.). The cDNA (2
μl; 100 ng/μl), 2X SYBR® Premix Ex Tap™ II
(10 μl) and 0.8 μl of each fluorescence quantitative
primer (CaM1, forward 5′-TCAACATCTCCTCTACCAACCA-3′ and reverse
5′-TACTCCCTGTCTTTCTGGCATT-′3, and CaMKII, forward
5′-ACCAGCTCTTCGAGGAATTG-3′ and reverse 5′-GTGACCAGGTCGAAGATCAG-3′)
and ROX (0.4 μl; Takara Bio, Inc.) were added in a reaction
mixture. Reference dye (50X; Invitrogen Life Technologies) and 6
μl distilled H2O were added to the reaction at a
total volume of 20 μl and qPCR amplification was performed
using a StepOnePlus™ Real-Time PCR system (Beckman Coulter, Brea,
CA, USA). The following PCR program was used: 95°C for 30 sec
denaturation and 40 cycles of 95°C for 5 sec and 64°C for 34 sec.
The comparative threshold (Ct) value was obtained from the
fluorescent qPCR: Rate F (following treatment / prior to treatment)
= 2 −[Ct2 treatment − Ct2 control) − (Ct1 treatment − Ct1 control],
which indicated changes in the mRNA expression following and prior
to treatment. Rate F refers to the ratio of Ct before (Ct1) and
after (Ct2) treatment.
Determination of CaMK II by ELISA
Rat liver cells (2 ml; 1×10⁵ cells/ml)
were uniformly seeded into 6-well culture plates. Following 18–24 h
culture, NH4Cl solution was added at a final
concentration of 0, 1, 5, 10 or 20 mmol/l and further cultured for
24, 48 or 72 h. The culture media was discarded and the cells were
transferred to 10 ml centrifuge tubes containing 0.25 pancreatin
(Solarbio Science & Technology Co., Ltd.) without EDTA, prior
to being centrifuged for 10 min at 37°C at 800 rpm, and the
supernatant was discarded. The precipitate was transferred into 1.5
ml microcentrifuge tubes, resuspended in PBS, centrifuged for 10
min at 10,000 rpm and the supernatant was collected and stored at
−20 or 4°C. The CaMKII value was determined as follows. The Human
CAMKII ELISA kit (R&D Systems, Inc., Minneapolis, MN, USA) was
incubated at room temperature for 15–30 min and 50 μl
standard solution (0.1 g BCA added to 0.2 g
KH2PO4, 2.9 g
Na2HPO4.12H2O, 8.0 g KCl, 0.5 ml
0.05% Tween-20, 1,000 ml distilled water; Solarbio Science &
Technology Co., Ltd.) was added into each well of the ELISA plate,
according to the sequence of the standard solution. The cell
supernatant (50 μl), which was diluted five-fold, was added
to each well three times. The enzyme labelled solution (100
μl) was added, joint sealant, sealers and was incubated for
1 h at 37°C. Maintaining the same indoor temperature and relative
humidity, the ELISA plate was washed between three and five times
with washing fluids (0.2 g KH2PO4, 2.9 g
Na2HPO4.12H2O, 8.0g NaCl, 0.2 g
KCl, 0.5 ml 0.05% Tween-20, made up to 1 L with distilled water)
diluted 100-fold and patted dry with blotting paper. Chromogenic
agent A and B (50 μl) were added and the reaction was
performed in the dark for 15 min. Following the incubation,
termination solution (50 μl; Solarbio Science &
Technology Co., Ltd.) was added to each well and rested for 5 min
at 37°C in order to terminate the reaction. The OD value was
measured in an enzymatic analyzer at 450 nm. A standard curve was
determined and the corresponding concentration was obtained using
this curve.
Statistical processing
The experimental data were analyzed using SPSS 17.0
software (SPSS, Inc., Chicago, IL, USA) and data are expressed as
the mean ± standard deviation. The mean differences are expressed
as 95% confidence intervals. The levels of ammonia in the blood and
the relative expression of SPP1 were determined using a
Kruskal-Wallis test and differences between groups were determined
using a Nemenyi test. Other comparisons were performed using a
single factor analysis of variance and differences between groups
were determined by the least significant difference test. P<0.05
was considered to indicate a statistically significant
difference.
Results
Determination of the optimal
concentration of NH4Cl
As shown in Table
I, treatment with identical concentrations of NH4Cl
led to a different growth inhibitory rates in different cell lines,
with the most significant effect was on the liver cells. Treatment
with 100 mM NH4Cl increased the inhibitory rate to
89.52±0.47%. The IC50 of rat liver cells was calculated
to be 41.6 mM.
 | Table IGrowth inhibitory rate of different
types of cells following treatment with NH4Cl for 24
h. |
Table I
Growth inhibitory rate of different
types of cells following treatment with NH4Cl for 24
h.
| NH4Cl
concentration (mM) | Growth inhibitory
rate (mean % ±standard deviation)
|
|---|
| Rat liver | BCG-823 | 9706 | A549 |
|---|
| 100 |
89.52±0.47a |
17.81±1.14b |
16.60±1.52b |
14.24±0.64b |
| 80 |
80.26±0.60a |
13.97±0.87b |
11.99±2.38b |
11.47±1.43b |
| 40 |
33.55±1.52a |
11.86±2.39b |
8.05±2.58b |
8.74±0.85b |
| 20 |
16.71±1.25a |
5.20±2.16b |
3.69±1.48b |
7.75±0.83b |
| 10 |
12.91±0.71a |
2.61±0.59b |
2.08±1.18b |
6.77±0.67b |
| 5 |
9.81±0.84a |
1.02±0.50b |
1.44±1.60b |
4.65±0.29b |
Determination of optimal drug
concentration of the control
High concentrations of NH4Cl and EGTA
solution and different concentrations of BAPTA-AM were used to
treat the cells. The growth inhibitory effect was determined in all
cells following a short treatment duration. As shown in Table II, following 6 h treatment, the
inhibitory rate increased as the concentration of NH4Cl
increased in each drug groups. No significant difference were
observed between the EGTA and NH4Cl groups after 6 h
treatment at identical drug concentrations. However, the growth
rate of the BAPTA-AM group was significantly inhibited at
concentrations >40 mM (P<0.05), particularly in the 0.01
μM group, compared with the NH4Cl group.
| Table IIGrowth inhibitory rate (%) of
different groups of rat liver cells following treatment with
NH4Cl for 6 h. |
Table II
Growth inhibitory rate (%) of
different groups of rat liver cells following treatment with
NH4Cl for 6 h.
| NH4Cl
concentration (mM) | BAPTA-AM
|
|---|
|
NH4Cl | EGTA | 0.1 μM | 0.01 μM | 0.001
μM |
|---|
| 100 | 49.25±1.71 | 46.50±2.38 |
29.32±1.45a |
26.02±1.32a |
28.44±1.77a |
| 80 | 36.93±1.14 | 35.00±1.09 |
25.26±1.92a |
23.71±1.88a |
25.02±1.63a |
| 60 | 27.96±1.30 | 26.02±1.32 |
22.93±2.13b |
20.43±0.83a |
22.45±1.46b |
| 40 | 23.29±2.90 | 23.71±1.88 |
16.67±2.12b |
15.28±2.20b |
16.87±1.97b |
| 20 | 14.04±2.34 | 13.63±1.50 | 12.53±1.98 | 11.09±2.01 | 12.33±2.78 |
| 10 | 9.23±1.54 | 9.07±2.00 | 8.23±1.12 | 7.40±0.93 | 8.19±0.97 |
The results demonstrated that the optimal
concentration range of NH4Cl for short duration
treatments was 0, 2.5, 10, 20 and 40 mM, and for long duration
treatments was 0, 1, 5, 10 and 20 mM. The optimal BAPTA-AM
concentration was 0.01 μM.
Detection of cell apoptosis by flow
cytometry
In the high NH4Cl concentration group and
the BAPTA-AM group, the growth of cells was inhibited following a
short treatment duration (Fig. 1).
When treated with NH4Cl for 6 h at a final concentration
of 0, 2, 10, 20 or 40 mM, the apoptotic rate in the BAPTA-AM group
was significantly lower compared with the NH4Cl group
(Fig. 1).
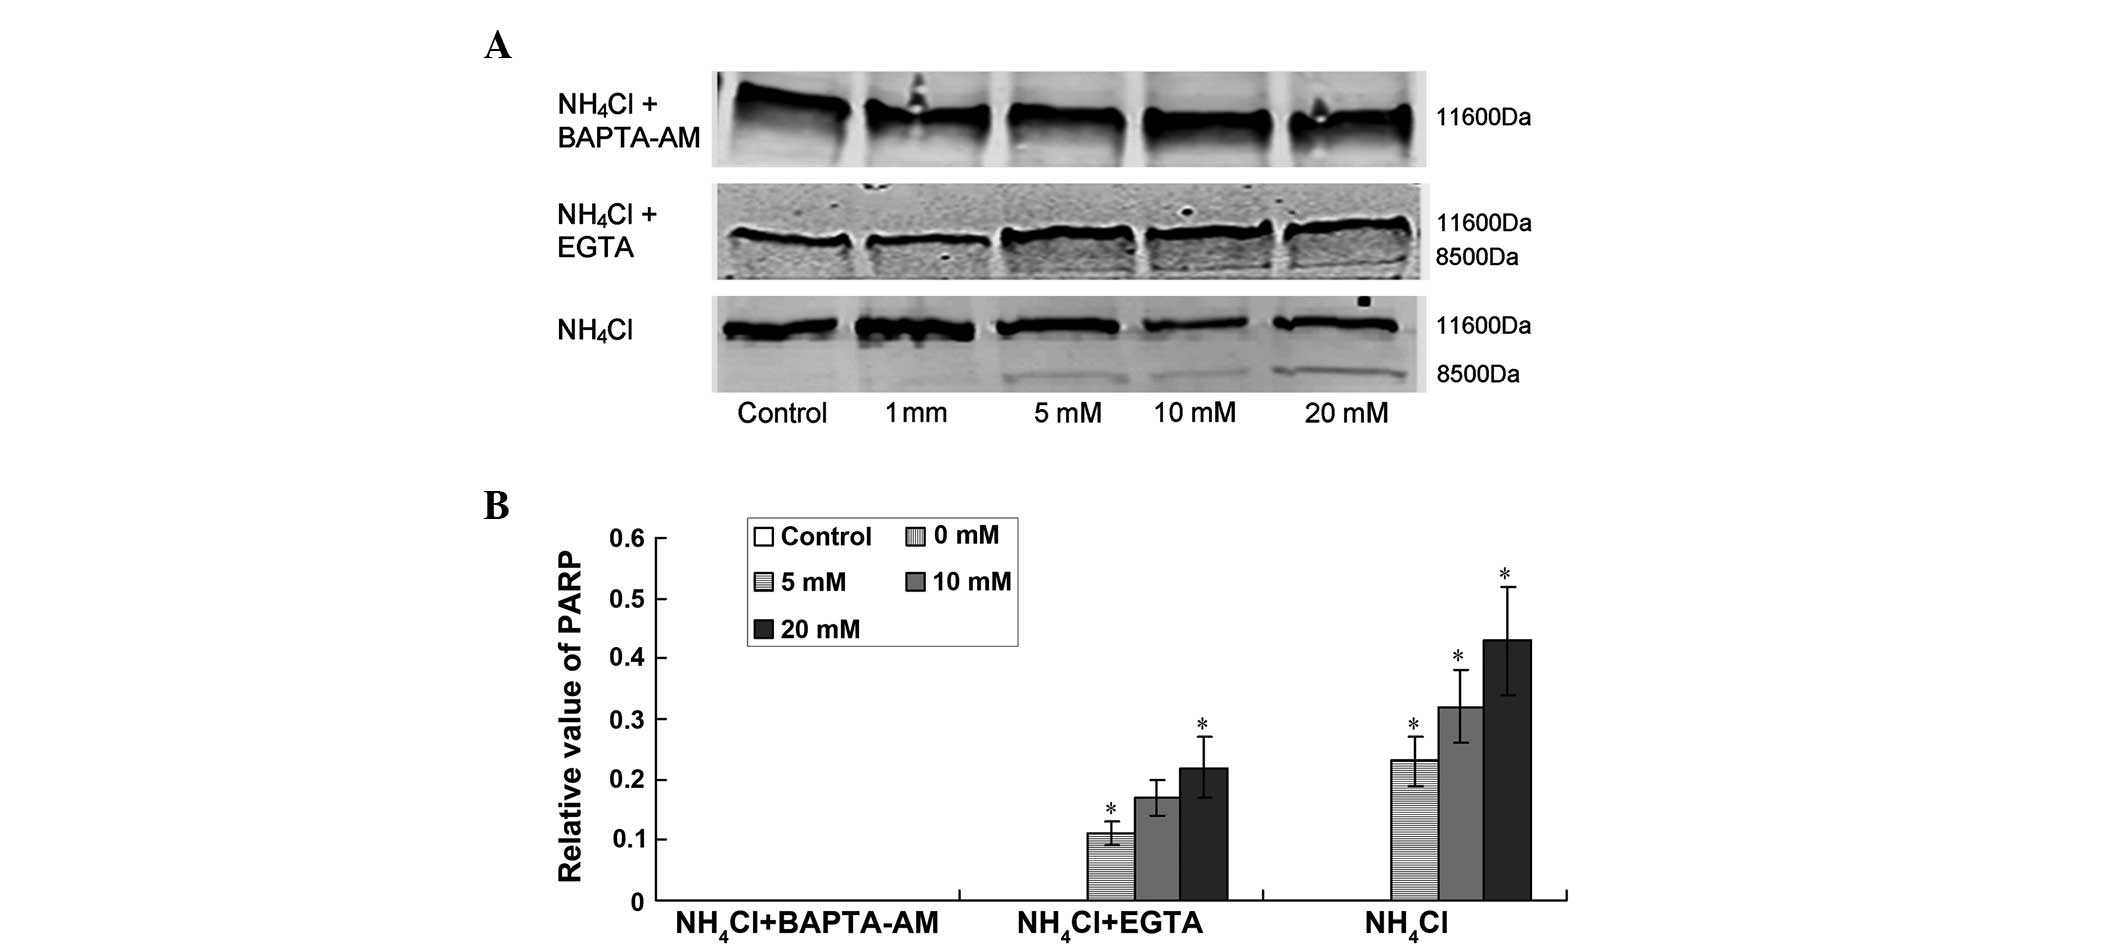
Protein expression of PARP increases in
the NH4Cl treated group
As shown in Fig. 2,
the expression of PARP changed following treatment for 72 h in the
NH4Cl group and the EGTA + NH4Cl group. The
protein expression of PARP increased significantly following
increasing of the final NH4Cl concentration to 5.0, 10.0
and 20.0 mM (Fig. 2; P<0.05).
However, no change was detected in the BAPTA-AM group
(P>0.05).
NH4Cl induces the protein
expression of Cyt C
As shown in Fig. 3,
the expression of Cyt C increased as the concentration of
NH4Cl increased, to 10 mM in a dose-dependent manner.
However, 20 mM treatment reduced the expression of Cyt C. No
significant difference was revealed between the EGTA group and the
NH4Cl group, which also increased dose-dependently, and
the expression decreased following treatment with 20 mM
NH4Cl. The expression of Cyt C remained unchanged in the
BAPTA-AM group.
NH4Cl decreases the expression
of CaMK
The rat liver cells were treated with different
concentrations of NH4Cl for 6, 12 and 24 h. No
significant difference was observed in the mRNA expression of CaM,
remained unchanged as the treatment concentration and duration
increased.
As shown in Fig.
4A, the mRNA expression of CaMK decreased gradually as the
concentration of NH4Cl increased following 6 h
treatment. The results after 12 and 24 h treatment were similar, as
shown in Fig. 4B and C. It was
demonstrated that the mRNA expression of CaMK decreased as the
duration increased following treatment with identical
concentrations of NH4Cl (Fig. 4D).
Discussion
In an acute liver failure model, blood ammonia is
not only the result of liver damage, but is also the cause of liver
damage (11,12). The apoptosis of liver cells may be
the underlying mechanism of liver failure. When blood ammonia
induce liver damage, cell apoptosis is one of the significant
changes to occur and is also the first change observed following
blood ammonia treatment in an acute liver failure model (13–15).
Cell apoptosis may be the important mechanism and the initial
factor causing blood ammonia-induced liver damage. The present
study aimed to investigate how this cell apoptosis is induced.
The results demonstrated that liver cells were
damaged following ammonia treatment under identical conditions. The
growth of cells was markedly inhibited, which was concentration-
and time-dependent. Flow cytometric analysis revealed that the cell
apoptosis ratio increased with increasing concentrations of
NH4Cl. This demonstrated that high blood ammonia levels
may lead to liver cell damage and apoptosis. At a shorter treatment
duration and low concentration of NH4Cl, cell apoptosis
was the predominant effect and, as the concentration of
NH4Cl increased and the treatment duration lengthened,
the number of apoptotic cells increased significantly. These
results demonstrated that cell apoptosis was the predominant effect
in the early injury of liver cells, induced by high levels of blood
ammonia.
The MTT results, with the exception of the 6 h high
concentration treatment or 24 and 48 h low concentration treatment,
revealed that the inhibition on cell growth following BAPTA-AM
pretreatment was alleviated significantly compared with the other
two groups. The rate of cell apoptosis in the BAPTA-AM group was
between 30 and 40% lower compared with the NH4Cl group
following 6 h treatment, however, no inhibition was observed in any
of the EGTA treatment groups. This indicated that the liver cell
damage by ammonia resulted from the increasing intracyto-plasmic
calcium ion concentration and not from changes in the extracellular
calcium ion concentration. Intracellular calcium ion chelating
agent, BAPTA-AM, can inhibit the occurrence of cell apoptosis by
decreasing the intracellular calcium ion concentration, which may
be required for liver cell protection from ammonia poisoning or to
delay the progress of liver failure by inhibiting cell
apoptosis.
MPTP is a nonspecific channel localized in the inner
and outer mitochondrial membrane, and is dependent on calcium ions
(16). When cell apoptosis or
necrosis are induced, mitochondrial content is released into the
cytoplasm by MPTP (17,18). The fine structure of the MPTP
remains to be elucidated, however, it includes adenosine inversion,
the voltage dependent anion channel, peripheral-type benzodiazepine
receptor, cancer protein, hexokinase and creatine kinase. Factors,
including excessive calcium ions in the cells, mitochondrial
glutathione oxidation and increasing reactive oxygen species, cause
the MPTP to open, resulting in a change in mitochondrial
permeability, releasing Cyt C and resulting in the loss of
mitochondrial membrane potential (19). The increased concentration of
intracellular calcium ions caused by NH4Cl leads to
opening of the MPTP and activation of cell apoptosis resulting from
the mitochondrial pathway. According to the shift in the
fluorescence peak to the left following fluorescent quenching, cell
fluorescence in the 10 mM NH4Cl group decreased compared
with the control group as the treatment duration prolonged and the
peak value shifted to the left. However, following BAPTA-AM
preprocessing, the degree and speed of the shift to the left were
reduced, which demonstrated that BAPTA-AM inhibited the opening of
the MPTP by increasing calcium ions. This indicated that
NH4Cl caused an increase in intracellular calcium ions
and led to the opening of the MPTP and apoptosis. However,
treatment with BAPTA-AM reduced the opening of MPTP through its
calcium chelating effect to reduce the rate of cell apoptosis.
The opening of the MPTP causes an increase in Cyt C
release (20). Cyt C is a
necessary molecule for cell survival and also a promoter molecule
for cell death (21). Cyt C enters
the cytoplasm through an open MPTP, induces apoptosis proteinase
activating factor and activates homocysteine, this induces a
caspase cascade reaction and activates caspase 3 to hydrolyze the
substrate proteins, including cleaved PARP, DNA and steroid hormone
response element protein 1 and 2, eventually leading to the
occurrence of apoptosis (22).
High concentrations of ammonia alters the mitochondrial
permeability of star-shaped glial cells cultured in vitro,
causing severe apoptosis or necrosis of the glial cells, which is
controlled by the concentration of calcium ions (23,24).
Cyt C is important in electron transfer for biological oxidation
and can form a respiratory chain with other oxidases on the
mitochondrial cristae. A lack of Cyt C in the mitochondrial
respiratory chain may cause electron transfer problems, the
production of reactive oxygen species, cell damage and can lead to
cell apoptosis, and oxidative damage. This occurs in the
mitochondria and is part of the mitochondrial apoptotic pathway
(25). Therefore, it is important
to investigate the expression of Cyt C to understand the mechanisms
underlying cell apoptosis.
PARP is an important substrate cleaved by caspase 3
(26) and is predominantly
associated with DNA repair, ensuring complete transcription and
expression of genes. Activated caspase 3 cleaves PARP into two
fragments, preventing the interaction with DNA. Impaired PARP
function increases the Ca2+/Mg2+-dependent
endonuclease activation, damages nucleosome structure and increases
the occurrence of apoptosis. Specific inhibitors of caspase 3
inhibit the occurrence of apoptosis and the degradation of PARP can
activate the caspase cascade reaction (27).
In the present study, key proteins in the
mitochondrial apoptotic pathways, Cyt C and PARP, were assessed by
western blotting. Following treatment with NH4Cl for 72
h, PARP was partly hydrolyzed in all the cells treated with 5, 10
and 20 mM and the expression of Cyt C increased. The results
demonstrated that the high blood ammonia caused the release of Cyt
C from the mitochondria, activated the cascade reaction, increased
the degradation of PARP and eventually induced the rate of
apoptosis. However, following pretreatment with BAPTA-AM, no
significant difference in the expression levels of Cyt C and PARP
were observed, suggesting that BAPTA-AM effectively chelated the
intracellular calcium, preventing the mitochondria damage caused by
calcium overload and released apoptotic factors to protect the
liver cells. Notably, that the expression of Cyt C in the 20 mM
group decreased compared with the 10 mM group, which may be caused
by the rapid increase in calcium ions resulting from the treatment
with excessive concentrations of NH4Cl. This may also
induce necrosis of certain cells causing a reduction in the number
of cells undergoing apoptosis.
CaM is a calcium-dependent activated calcium-binding
protein. When combined with a calcium ion, CaM undergoes changes in
configuration, activates certain enzymes and regulates cell
activity. CaMK is a serine/threonine protein kinase and its
activity is adjusted by the calcium/calmodulin complexes. Previous
studies have revealed that the activation of
Ca2+-CaM-CaMK may be involved in the regulation of cell
apoptosis (28,29). The results from fluorescence qPCR
and ELISA demonstrated no significant increase in the expression
levels of the CaM and CaMK in the Ca2+-CaM-CaMK
signaling pathway, which indicated that the apoptotic pathway was
not activated. However, the mRNA expression of CaMK decreased as
the duration and concentration of treatment increased, which may be
associated with the effect of reduced adenosine triphosphate (ATP)
synthesis following mitochondrial damage. However, the
concentration dependency may be associated with high blood ammonia,
which affects CaMK and cell proliferation.
Importantly, early treatment with NH4Cl
may cause an increase in the levels of calcium ions in liver cells,
leading to the opening of the MPTP, activation of the mitochondrial
apoptosis pathway, release of Cyt C and degradation of PARP induced
by an activated caspase cascade reaction (29–31).
In this process, the mitochondria are damaged and the production of
ATP, protein synthesis, cell proliferation and other activities may
be affected. Therefore, increased levels of ammonia in the blood
may be an important cause of further damage to residual liver cells
following liver failure. It is important to investigate the
underlying mechanism of liver cell damage by blood ammonia to
further understand the pathogenesis of liver failure and to
identify novel therapeutic targets and techniques.
References
|
1
|
Jones EA and Mullen KD: Theories of the
pathogenesis of hepatic encephalopothy. Clin Liver Dis. 16:7–26.
2012. View Article : Google Scholar : PubMed/NCBI
|
|
2
|
Zamora Nava LE, Aguirre Valadez J,
Chávez-Tapia NC and Torre A: Acute-on-chronic liver failure: a
review. Ther Clin Risk Manag. 10:295–303. 2014.PubMed/NCBI
|
|
3
|
Bernal W and Wendon J: Acute liver
failure. N Engl J Med. 369:2525–2534. 2013. View Article : Google Scholar : PubMed/NCBI
|
|
4
|
Yang Q, Shi Y, Yang Y and Chen Z:
Deactivation and aoptosis of hepatic macrophages are involved in
the development of concanavalin A-induced acute liver failure. Mol
Med Rep. 8:757–762. 2013.PubMed/NCBI
|
|
5
|
Jia B, Yu ZJ, Duan ZF, et al:
Hyperammonaemia induces hepatic injury with alteration of gene
expression profiles. Liver Int. 34:748–758. 2014. View Article : Google Scholar
|
|
6
|
Liu CP and Yu ZJ: Study on
L-Ornithine-L-Aspartate in the treatment of acute-on-chronic liver
failure. Zhonghua Gan Zang Bing Za Zhi. 19:63–64. 2011.In Chinese.
PubMed/NCBI
|
|
7
|
Yu ZJ, Sun R and Liu XR:
Hyperammonemia-induced hepatic injury in rats: characterization of
a ne w animal model. Zhonghua Gan Zang Bing Za Zhi Zhonghua Gan
Zang Bing Za Zhi. 21:467–472. 2013.In Chinese.
|
|
8
|
Lao MS and Toth D: Effects of ammonium and
lactate on growth and metabolism of a recombinant Chinese hamster
ovary cell culture. Biotechnol Prog. 13:688–691. 1997. View Article : Google Scholar : PubMed/NCBI
|
|
9
|
Helgeland K: NH4Cl and protein metabolism
in human gingival fibroblasts. Scand J Dent Res. 89:400–406.
1981.PubMed/NCBI
|
|
10
|
Hassell T, Gleave S and Butler M: Growth
inhibition in animal cell culture. The effect of lactate and
ammonia. Appl Biochem Biotechnol. 30:29–41. 1991. View Article : Google Scholar : PubMed/NCBI
|
|
11
|
Kasahara I, Saitoh K and Nakamura K:
Apoptosis in acute hepatic failure: histopathological study of
human liver tissue using the tunel method and immunohistochemistry.
J Med Dent Sci. 47:167–175. 2000.
|
|
12
|
Malhi H, Guicciardi ME and Gores GJ:
Hepatocyte death: a clear and present danger. Physiol Rev.
90:1165–1194. 2010. View Article : Google Scholar : PubMed/NCBI
|
|
13
|
Chen Z, Chen Y, Chen J and Shen C: Effects
of ammonium and lactate on hybridoma cell growth and metabolism.
Chin J Biotechnol. 8:255–261. 1992.PubMed/NCBI
|
|
14
|
Doyle C and Butler M: The effect of pH on
the toxicity of ammonia to a murine hybridoma. J Biotechnol.
15:91–100. 1990. View Article : Google Scholar : PubMed/NCBI
|
|
15
|
Cruz HJ, Freitas CM, Alves PM, Moreira JL
and Carrondo MJ: Effects of ammonia and lactate on growth,
metabolism, and productivity of BHK cells. Enzyme Microb Technol.
27:43–52. 2000. View Article : Google Scholar : PubMed/NCBI
|
|
16
|
Giorgi C, Baldassari F, Bononi A, et al:
Mitochondrial Ca(2+) and apoptosis. Cell Calcium. 52:36–43. 2012.
View Article : Google Scholar : PubMed/NCBI
|
|
17
|
Liu D, He H, Yin D, et al: Mechanism of
chronic dietary iron overload-induced liver damage in mice. Mol Med
Rep. 7:1173–1179. 2013.PubMed/NCBI
|
|
18
|
Tsien RY: New calcium indicators and
buffers with high selectivity against magnesium and protons:
design, synthesis, and properties of prototype structures.
Biochemistry. 19:2396–2404. 1980. View Article : Google Scholar : PubMed/NCBI
|
|
19
|
Grimm S and Brdiczka D: The permeability
transition pore in cell death. Apoptosis. 12:841–855. 2007.
View Article : Google Scholar : PubMed/NCBI
|
|
20
|
Borutaite V, Morkuniene R, Arandarcikaite
O, Jekabsone A, Barauskaite J and Brown GC: Nitric oxide protects
the heart from ischemia-induced apoptosis and mitochondrial damage
via protein kinase G mediated blockage of permeability transition
and cytochrome c release. J Biomed Sci. 16:702009. View Article : Google Scholar : PubMed/NCBI
|
|
21
|
Liu Y, E Q, Zuo J, Tao Y and Liu W:
Protective effect of cordyceps polysaccharide on hydrogen
peroxide-induced mitochondrial dysfunction in HL-7702 cells. Mol
Med Rep. 7:747–754. 2013.
|
|
22
|
Li Y, He K, Huang Y, et al: Betulin
induces mitochondrial cytochrome c release associated apoptosis in
human cancer cells. Mol Carcinog. 49:630–640. 2010.PubMed/NCBI
|
|
23
|
Karl A, Wurm A, Pannicke T, et al:
Synergistic action of hypoosmolarity and glutamine in inducing
acute swelling of retinal glial (Müller) cells. Glia. 59:256–266.
2011. View Article : Google Scholar
|
|
24
|
Ohara K, Aoyama M, Fujita M, Sobue K and
Asai K: Prolonged exposure to ammonia increases extracellular
glutamate in cultured rat astrocytes. Neurosci Lett. 462:109–112.
2009. View Article : Google Scholar : PubMed/NCBI
|
|
25
|
Boulares AH, Yakovlev AG, Ivanova V, et
al: Role of poly(ADP-ribose) polymerase (PARP) cleavage in
apoptosis. Caspase 3-resistant PARP mutant increases rates of
apoptosis in transfected cells. J Biol Chem. 274:22932–22940. 1999.
View Article : Google Scholar : PubMed/NCBI
|
|
26
|
Choi HS, Seo HS, Kim SR, et al:
Anti-inflammatory and anti-proliferative effects of Rhus
verniciflua stokes in RAW264.7. cells Mol Med Rep. 9:311–315.
2014.
|
|
27
|
Bressenot A, Marchal S, Bezdetnaya L,
Garrier J, Garrier f and Plénat F: Assessment of apoptosis by
immunohistochemistry to active caspase-3, active caspase-7, or
cleaved PARP in monolayer cells and spheroid and subcutaneous
xenografts of human carcinoma. J Histochem Cytochem. 57:289–300.
2009. View Article : Google Scholar :
|
|
28
|
Gaspers LD, Mémin E and Thomas AP:
Calcium-dependent physiologic and pathologic stimulus-metabolic
response coupling in hepatocytes. Cell Calcium. 52:93–102. 2012.
View Article : Google Scholar : PubMed/NCBI
|
|
29
|
Wang HG, Pathan N, Ethell IM, et al:
Ca2+-induced apoptosis through calcineurin
dephosphorylation of BAD. Science. 284:339–343. 1999. View Article : Google Scholar : PubMed/NCBI
|
|
30
|
Sánchez-Gómez MV, Alberdi E, Ibarretxe G,
Torre I and Matute C: Caspase-dependent and caspase- independent
oligodendrocyte death mediated by AMPA and kainate receptors. J
Neurosci. 23:9519–9528. 2003.
|
|
31
|
Liu Y and Templeton DM: Cadmium activates
CaMK-II and initiates CaMK-II-dependent apoptosis in mesangial
cells. FEBS Lett. 581:1481–1486. 2007. View Article : Google Scholar : PubMed/NCBI
|