Introduction
The most frequently occurring malignant brain tumor
is glioblastoma, which has a median survival time of less than one
year (World Health Organization grade IV). Despite advances in
treatment strategy, the prognosis of glioblastoma patients has not
substantially improved and tumor recurrence frequently occurs in
patients following treatment (1–3).
Previous studies in several types of solid tumor, including brain
tumors, reported that the presence of cancer stem cells (CSCs) is
responsible for treatment failure and tumor recurrence (4–8).
Brain cancer stem cells (BCSCs) are capable of self-renewal and
express neural stem cell surface markers, including CD133
and Nestin. In addition, CSCs are able to form neurospheres,
differentiate into other cell types, including neurons, astrocytes
and oligodendrocytes, have the potential to initiate tumor growth
and also exhibit multidrug and apoptotic resistance (9,10).
The conventional treatment strategies target only the bulk of the
tumor cells, leaving the CSCs unaffected, which results in
treatment failure and is responsible for minimal residual disease
(11,12). Therefore, the development of new
therapeutic strategies that effectively target BCSCs is crucial.
Several methods have been proposed for the isolation of BCSCs from
brain tumors or glioma. These include the isolation of glioma
tissues as spheres in serum-free medium, sorting of BCSCs with
antibodies for stem cell surface markers and Hoechst 33342 dye
exclusion by flow cytometry (3,13,14).
It has previously been reported in several types of solid tumor
that the Hoechst 33342 dye exclusion is a powerful and valuable
technique for isolating CSCs (4,15,16).
Cells that exclude Hoechst 33342 dye are termed side
population (SP) cells. These cells share characteristics with
BCSCs, including the ability to initiate tumor growth following
treatment, such as chemotherapy or radiotherapy and the expression
of stem cells genes, including CD133, CD44,
CD34, CD29 and CD24. Furthermore, SP cells
also have a higher expression of ATPase binding cassette (ABC)
transporters, including ABCB1 [multidrug resistance
transporter 1 (MDR1)], ABCC1 and ABCG2
[breakpoint cluster region pseudogene 1 (BCRP1)], which
contribute to multidrug resistance. Therefore, determination of key
SP cells in the tumor population that are able to maintain the
tumor may provide new insight into the mechanism of brain
tumorigenesis and assist in tracing the tumor cell of origin for
providing effective treatment. Thus, in the present study, SP cells
were isolated and characterized from the human glioblastoma cell
line MG-12.
Materials and methods
Cell line and cell culture
The human glioblastoma MG-12 cell line was
established from a patient with malignant glioblastoma (Grade IV).
The tumor samples were collected from the patient in accordance
with the ethical principles approved by the Department of
Neurosurgery, Tianjin Huanhu Hospital, Tianjin, China and written
informed consent was obtained. Cell lines were maintained in
Dulbecco’s modified Eagle’s medium (DMEM), which was supplemented
with 10% fetal bovine serum, 100 U/ml penicillin G and 100 lg/ml
streptomycin. To generate glioma spheres, cells were cultured in a
neurosphere culture medium (NSP medium) consisting of neurobasal
medium supplemented with human recombinant endothelial growth
factor (20 ng/ml) human recombinant fibroblast growth factor 2 (20
ng/ml), B27, heparin (10 ng/ml) and human recombinant leukemia
inhibitory factor (10 ng/ml). All reagents and chemicals were
purchased from Sigma-Aldrich, Shanghai, China.
Study group
Group I, control-MG-12 cells+Hoechst 33342 dye
(n=6); Group II, drug treated-MG-12 cells+verapamil+Hoechst 33342
dye (n=6).
Labeling with Hoechst 33342
Using a hemocytometer, ~106 cells/ml in
10% DMEM were labeled with Hoechst 33342 (Sigma, St. Louis, MO,
USA) stock bis-benzimide (5 μl/ml) either with dye alone or
in combination with drug treatment (verapamil, 0.8 μl/ml).
After 90 min incubation in a water bath at 37°C, cells were
subjected to centrifugation at 2,500 × g for 10 min at 4°C and
resuspended in 500 μl of Hank’s balanced salt solution
containing 10 mM 4-(2-hydroxyethyl)-1-piperazineethanesulfonic
acid. Finally, cells were counterstained with propidium iodide (2
μg/ml sample) at 4°C to exclude dead cells. Cells were
filtered through a 50 μm nylon mesh (BD Biosciences,
Franklin Lakes, NJ, USA) to remove cell clumps into labeled
fluorescence-activated cell sorting (FACS) tubes. The SP cells and
main population (non-SP) cells were sorted using a flow cytometer
(FACS Aria II; BD Biosciences). The Hoechst 33342 dye was excited
at 355 nm and its dual-wavelength fluorescence was analyzed (blue,
450 nm; red, 675 nm).
Sphere formation assay
The sphere formation assays for the sorted SP and
non-SP cells were performed as described previously (3). SP and non-SP cells sorted from the
MG-12 cell line were seeded at a low density of 20 cells/l and the
number of generated spheres was counted after 8 days of
culture.
In vitro proliferation activity
assay
The sorted SP and non-SP cells were seeded in a
96-well plate at 2×10⁶ cells/well (n=4) and incubated in
a CO2 incubator. Cell proliferation activity was
measured each day for 6 days. Each well was supplemented with cell
counting kit-8 (CCK-8) solution (10 μl) and incubated in a
CO2 incubator for 2–3 h. The optical density (OD) was
determined at 450 nm. These data were used to calculate cell growth
graphs based on the mean value of OD450 and standard
deviation values for each well.
Cell resistance assay
The sorted SP and non-SP cells were seeded in
96-well plates at a concentration of 1×10³ cells/plate.
After 24 h, 10 μg/ml 5-fluorouracil (5-FU) was added to all
cultures and incubated for 48 h. Subsequently, each well was
supplemented with CCK-8 solution (10 μl) and the plates were
incubated for 3 h. The mean value of OD450 obtained was
presented as a graph as described previously (15). Cell resistance in the two groups
was calculated using the following formula: Cell resistance rate
(%) = (experimental group OD450 value/control group
OD450 value) × 100.
Reverse-transcription quantitative
polymerase chain reaction (RT-qPCR)
Total RNA was isolated from FACS-sorted SP and
non-SP cells using the Ambion RNAqueous®-Micro kit
(Applied Biosystems, Warrington, UK). cDNA was synthesized using
the Bioline cDNA synthesis kit (Bioline, London, UK). RT-qPCR was
performed using 2–3 μl cDNA and 2X TaqMan Gene Expression
Mastermix (Applied Biosystems) in 50 μl reaction volumes.
Glyceraldehyde-3-phosphate dehydrogenase (GAPDH) was used as
the standard endogenous expression. The primers were designed to
encompass an exon junction to prevent templating from possibly
contaminated genomic DNA. The primer sequences used were as
follows: ABCG2, forward 5′-AGC TGC AAG GAA AGA TCC AA-3′ and
reverse 5′-TCC AGA CAC ACC ACG GAT AA; octamer-binding
transcription factor 4 (Oct-4), forward 5′-ATC CTG GGG GTT
CTA TTT GG-3′ and reverse 5′-CTC CAG GTT GCC TCT CAC TC-3′);
epithelial cell adhesion molecule (EpCAM), forward 5′-CTG
CCA AAT GTT TGG TGA TG and reverse 5′-ACG CGT TGT GAT CTC CTT
CT-3′; Nestin, forward 5′-TGG CTC AGA GGA AGA GTC TGA-3′ and
reverse 5′-TCC CCC ATT TAC ATG CTG TGA-3′; Notch 1, forward
5′-CAG GCA ATC CGA GGA CTA TG-3′ and reverse 5′-CAG GCG TGT TGT TCT
CAC AG-3′ and GAPDH, forward 5′-ATG TCG TGG AGT CTA CTG
GC-3′ and reverse 5′-TGA CCT TGC CCA CAG CCT TG-3′. The amplified
products were separated by electrophoresis on ethidium
bromide-stained 1.2% agarose gels. Band intensity was measured
using Image J software, version 1.4 (National Institutes of Health,
Bethesda, MA, USA) from three independent experiments.
Biochemistry
For western blot analysis, proteins were extracted
from the SP and non-SP cells and protein concentration was
determined using the Bradford assay. Blots were probed with the
monoclonal primary antibodies, 1:1,000 [rabbit anti-human
ABCG2, CD133, CD44, B-cell lymphoma 2
(Bcl-2) and Actin], the monoclonal secondary antibody
(1:10,000; goat anti-rabbit IgG with alkaline phosphatase markers)
purchased from Santa Cruz Biotechnology, Inc., (Dallas, TX, USA).
and a chemiluminescence reagent.
Statistical analysis
A one-way analysis of variance was performed to
determine the significance between different treatment groups and
individual Student’s t-tests were performed to compare the effect
of different treatments between the SP and non-SP populations.
P<0.05 was considered to indicate a statistically significant
difference.
Results
Isolation of SP cells from the human
glioma cell line MG-12
The malignant human glioblastoma cell line was
analyzed for the presence of SP cells using Hoechst 33342 dye,
which is a DNA binding dye. Using FACS, the live cell population
was selected against propidium iodide, which was used to exclude
dead cells from the samples. The presence of a distinct SP cell
population (P2) was identified towards the SP-violet region of the
dot plot of the FACS profile (Fig.
1A), which accounts for 3.2% of the total cell population. The
exclusion of Hoechst 33342 by SP cells is an active process, which
involves MDR1, a member of the ABC transporter family. Since
verapamil inhibits the activity of the Hoechst 33342 transporters,
the SP cell fraction was decreased in the presence of verapamil
(17). Therefore, following
treatment with verapamil, the SP cells (P2 gated) were reduced from
3.2 to 0.5% (Fig. 1B). The present
findings suggest that the sorted SP cells are highly resistant to
multidrug uptake, which may be due to the overexpression of ABC
transporters and therefore in the presence of verapamil, the
percentage of SP cells is significantly reduced.
Sphere formation and drug resistance
properties of SP cells
The sorted SP cells and non-SP cells were
subsequently subjected to sphere formation assays. In order to
compare their self-renewing capacities, SP cells and non-SP cells
were cultured in NSP medium at a low density (20 cells/ml) and
analyzed for sphere formation. The SP cells were able to grow and
started to form spheres by day 5 (Fig.
2A). The floating spheres in suspension, which were generated
from single cells of the MG-12 cell line increased in size over
time (Fig. 2A; day 9 and 14).
However, non-SP cells were unable to propagate under these
conditions. The number of spheres generated after 8 days was also
counted. The number of spheres generated by SP cells was
significantly higher than that produced by non-SP cells (Fig. 2B).
The sorted SP and non-SP cells were further
subjected to in vitro cell proliferation and drug resistance
assays. The SP cells of the MG-12 cell line of human glioblastoma
origin exhibited increased cell proliferation starting from day 3
and became confluent on day 6 when compared with non-SP cells
(Fig. 3A). Subsequently, the SP
cells were analyzed for drug resistance. Following treatment with
10 μg/ml 5-FU, the survival rate of SP cells (92%) was
significantly higher (Fig. 3B)
compared with non-SP cells (49%). Therefore, the present data
suggest that the sorted glioblastoma SP cells are highly resistant
to drug treatment and have a high proliferation rate.
Expression of stem cell genes in MG-12 SP
cells
Several studies have demonstrated that
overexpression of the MDR1 transporter, particularly
ABCG2, contributes to Hoechst dye expulsion and the drug
resistance properties of SP cells in several types of solid tumor
(18,19). In addition, the expression of stem
cell genes, including Nestin and Notch 1 have been
implicated in various cancer cells, including BCSCs (9,20,21).
Therefore, the gene expression of ABCG2, Nestin,
Notch 1, EpCAM and Oct-4 was analyzed in SP
and non-SP cells from the MG-12 cell line. RT-qPCR analysis
revealed that ABCG2, Nestin and EpCAM were
more highly expressed in SP cells than in non-SP cells (Fig. 4A). Additionally, the genes Notch
1 and Oct-4 were expressed highly in SP cells whereas
the expression levels were almost null in non-SP cells (Fig. 4A). The quantification graph clearly
demonstrates that the expression levels of these genes were
significantly higher in SP cells compared with non-SP cells
(Fig. 4B). The housekeeping gene
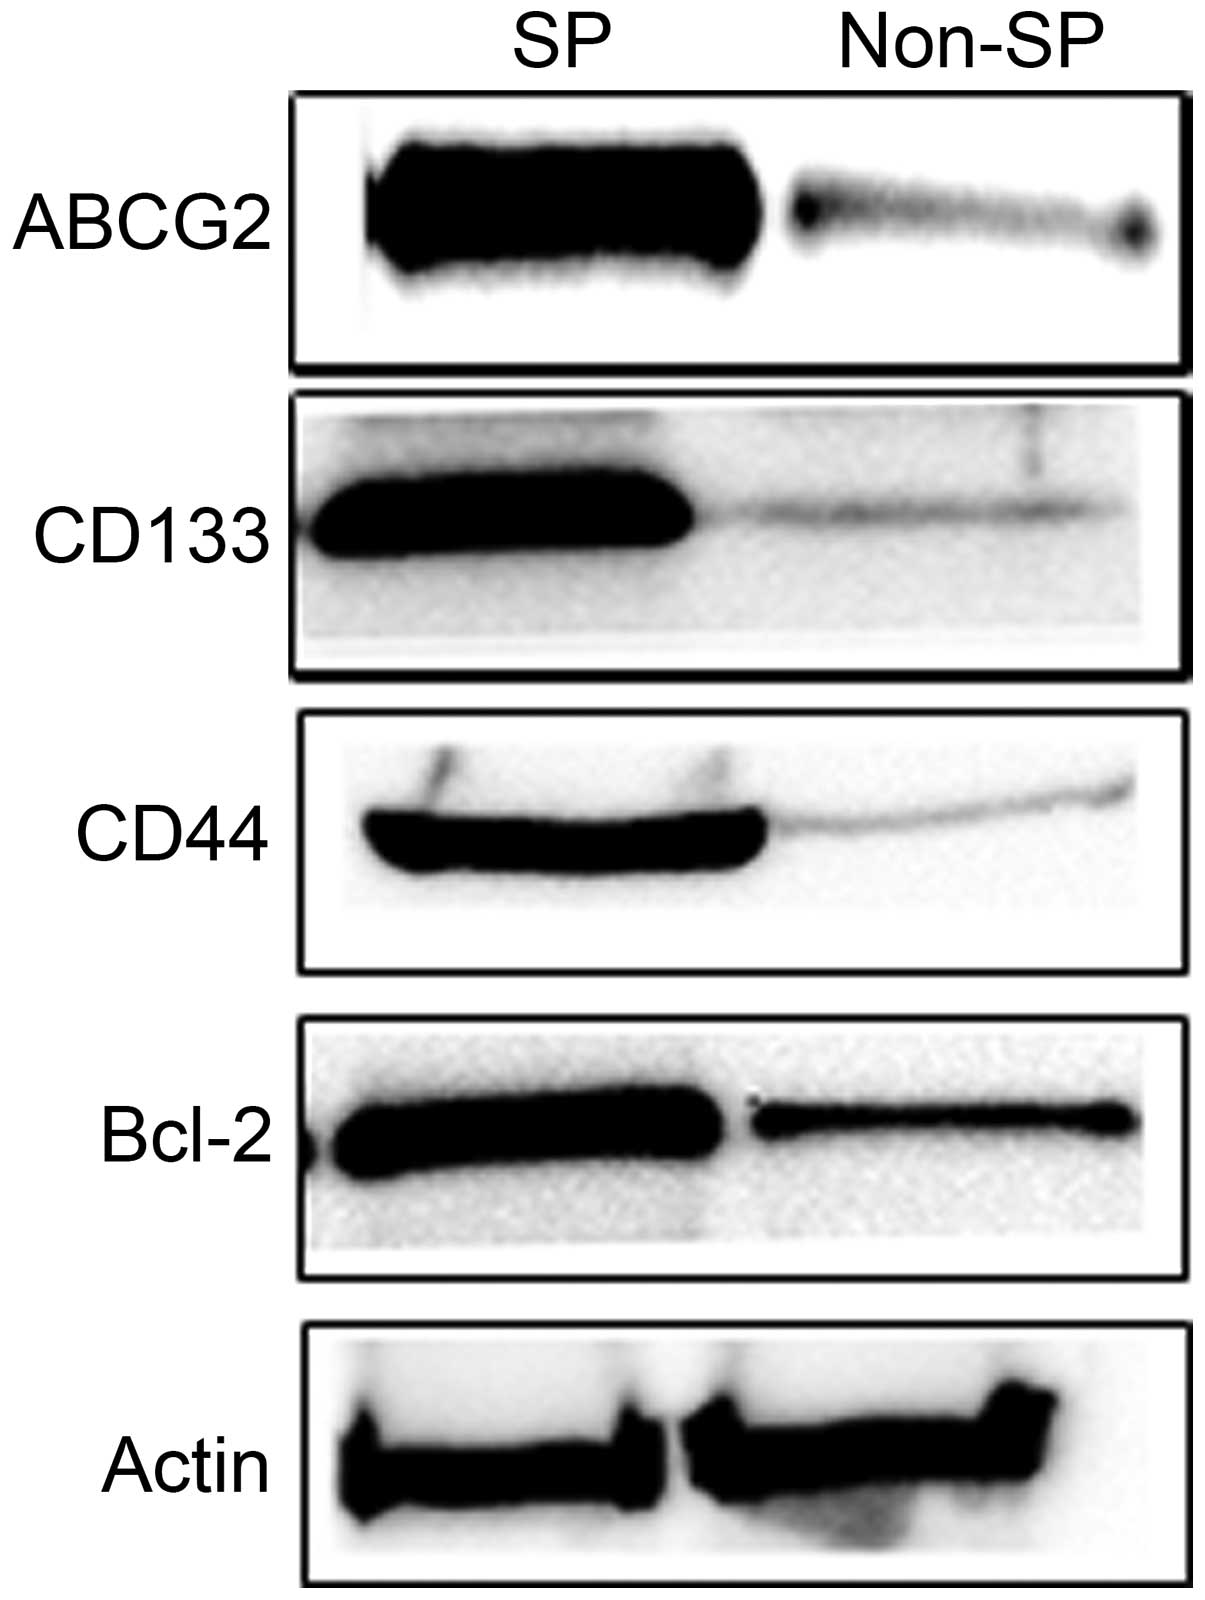
GAPDH was used as a control. Subsequently, western blot
analysis revealed that the protein expression of ABCG2,
CD133, CD44 and Bcl-2 was significantly
increased in SP cells, whereas these proteins levels were
significantly reduced in non-SP cells (Fig. 5). These findings clearly
demonstrate that elevated expression of ABCG2 and other stem
cell and anti-apoptotic genes/proteins are possibly responsible for
the drug/apoptotic resistance, self-renewal capacity and rapid
proliferation of cancer cells.
Discussion
Previously, it has been identified that cancer
treatment failure may be due to the persistence of CSCs, which
possess multiple characteristics associated with stem cells,
including the capacity for self-renewal, high tumorigenicity, a
high differentiation potential as well as multidrug and apoptotic
resistance (5,22–24).
These CSCs evade the treatment regimen and may be responsible for
minimal residual disease. Therefore, CSCs are the main target for
eradicating cancerous growth completely. Cells that exclude Hoechst
33342 dye are defined as SP cells, which share a number of
characteristics with CSCs, specifically tumor initiating capacity,
expression of stem cell surface markers and resistance to
chemotherapeutic drugs (22,25).
In addition, SP cells are enriched in ABC transporters, including
ABCB1 (MDR1), ABCC1 and ABCG2
(BCRP1), which contribute to multidrug resistance (26). These SP cells were identified and
characterized in several types of solid tumor and cancer cell lines
based on Hoechst 33342 dye efflux by FACS (5,27).
In the present study, cancer stem-like SP cells were isolated from
human glioblastoma cell lines using the Hoechst 33342 dye exclusion
method. FACS analysis revealed that the human glioblastoma MG-12
cell line contained 3.2% SP cells, whose presence was markedly
reduced to 0.5% when treated with verapamil. Previous studies have
demonstrated that SP cells account for 1–2.5% of cells in the
majority of glioblastoma cell lines (3,5).
Furthermore, it was demonstrated that sorted SP cells were highly
capable of self-renewal as they were able to form spheres in NSP
medium and had an increased capacity to proliferate in
vitro. The drug resistance assays clearly demonstrated that
MG-12 SP cells are highly resistant to 5-FU, therefore they have an
increased survival rate, whereas the non-SP cells were sensitive to
5-FU.
Overexpression of ABCG2 may be responsible
for multidrug resistance and involves the direct downstream
targeting of Notch 1, which promotes the expression of
Nestin, a neural stem cell marker, in glioma cells (28). The Notch and Nestin
pathway has been observed to promote the survival rate and
proliferation of neural stem cells (29). Using RT-qPCR analysis, it was also
observed that the gene expression of ABCG2, Nestin,
EpCAM, Oct-4 and Notch 1 in SP cells was
increased compared with non-SP cells. It was also observed that the
isolated MG-12 SP cells exhibited positivity and elevated protein
expression for stem cell surface proteins, including CD133,
CD44, EpCAM and Oct-4. In line with the
current findings, it was observed that CD44+
cancer stem cells in head and neck squamous cell carcinomas were
highly tumorigenic and able to propagate tumor formation in mice
(16). In addition, the expression
of Oct-4 in human gliomas enables self renewal and promotes
colony formation in glioma cells (30). Thus, the present results suggest
that elevated expression of CD133, CD44, ABCG2
and Bcl-2 in SP cells may co-operatively act as crucial
factors in drug and cell death resistance, proliferation of cancer
cells and tumor invasion.
In conclusion, it was identified that MG-12, a human
glioblastoma cell line, contained a high percentage of SP cells
that possess the properties of BCSCs, including self-renewal,
increased cell proliferation rate, the ability to form spheres and
high drug resistance. The elevated expression of ABCG2,
Nestin, Notch 1, Oct-4 and EpCAM in SP
cells may interact with each other and function collectively to
contribute to drug resistance, resistance to apoptosis and the
enhanced survival rate of SP cells. However, the mechanisms
underlying the Notch signaling pathways and the cascade of
downstream events in cancer stem cells remain to be elucidated.
Therefore, the identification and characterization of SP cells
provide a strategy to design novel therapeutic drugs, which target
BCSCs in order to prevent tumor recurrence.
References
|
1
|
Holland EC: Gliomagenesis: genetic
alterations and mouse models. Nat Rev Genet. 2:120–129. 2001.
View Article : Google Scholar : PubMed/NCBI
|
|
2
|
Kleihues P, Louis DN, Scheithauer BW, et
al: The WHO classification of tumors of the nervous system. J
Neuropathol Exp Neurol. 61:215–225. 2002.PubMed/NCBI
|
|
3
|
Fukaya R, Ohta S, Yamaguchi M, et al:
Isolation of cancer stem-like cells from a side population of a
human glioblastoma cell line, SK-MG-1. Cancer Lett. 291:150–157.
2010. View Article : Google Scholar
|
|
4
|
Hirschmann-Jax C, Foster AE, Wulf GG, et
al: A distinct ‘side population of cells’ with high drug efflux
capacity in human tumor cells. Proc Natl Acad Sci USA.
101:14228–14233. 2004. View Article : Google Scholar
|
|
5
|
Patrawala L, Calhoun T,
Schneider-Broussard R, Zhou J, Claypool K and Tang DG: Side
population is enriched in tumorigenic, stem-like cancer cells,
whereas ABCG2+ and ABCG2- cancer cells are similarly tumorigenic.
Cancer Res. 65:6207–6219. 2005. View Article : Google Scholar : PubMed/NCBI
|
|
6
|
Lee TK, Castilho A, Ma S and Ng IO: Liver
cancer stem cells: implications for a new therapeutic target. Liver
Int. 29:955–965. 2009. View Article : Google Scholar : PubMed/NCBI
|
|
7
|
Al-Hajj M, Wicha MS, Benito-Hernandez A,
Morrison SJ and Clarke MF: Prospective identification of
tumorigenic breast cancer cells. Proc Natl Acad Sci USA.
100:3983–3988. 2003. View Article : Google Scholar : PubMed/NCBI
|
|
8
|
Dalerba P, Dylla SJ, Park IK, Liu R, Wang
X, Cho RW, et al: Phenotypic characterization of human colorectal
cancer stem cells. Proc Natl Acad Sci USA. 104:10158–10163. 2007.
View Article : Google Scholar : PubMed/NCBI
|
|
9
|
Singh SK, Clarke ID, Terasaki M, et al:
Identification of a cancer stem cell in human brain tumors. Cancer
Res. 63:5821–5828. 2003.PubMed/NCBI
|
|
10
|
Singh SK1, Hawkins C, Clarke ID, et al:
Identification of human brain tumour initiating cells. Nature.
432:396–401. 2004. View Article : Google Scholar : PubMed/NCBI
|
|
11
|
Challen GA and Little MH: A side order of
stem cells: the SP phenotype. Stem Cells. 24:3–12. 2006. View Article : Google Scholar : PubMed/NCBI
|
|
12
|
Ramachandran C and Melnick SJ: Multidrug
resistance in human tumors - molecular diagnosis and clinical
significance. Mol Diagn. 4:81–94. 1999. View Article : Google Scholar : PubMed/NCBI
|
|
13
|
Kondo T, Setoguchi T and Taga T:
Persistence of a small subpopulation of cancer stem-like cells in
the C6 glioma cell line. Proc Natl Acad Sci USA. 101:781–786. 2004.
View Article : Google Scholar : PubMed/NCBI
|
|
14
|
Harris MA, Yang H and Low BE: Cancer stem
cells are enriched in the side population cells in a mouse model of
glioma. Cancer Res. 68:10051–10059. 2008. View Article : Google Scholar : PubMed/NCBI
|
|
15
|
Yanamoto S, Kawasaki G, Yamada S, et al:
Isolation and characterization of cancer stem-like side population
cells in human oral cancer cells. Oral Oncol. 47:855–860. 2011.
View Article : Google Scholar : PubMed/NCBI
|
|
16
|
Yanamoto S, Kawasaki G, Yoshitomi I,
Iwamoto T, Hirata K and Mizuno A: Clinicopathologic significance of
EpCAM expression in squamous cell carcinoma of the tongue and its
possibility as a potential target for tongue cancer gene therapy.
Oral Oncol. 43:869–877. 2007. View Article : Google Scholar : PubMed/NCBI
|
|
17
|
Goodell MA, Brose K, Paradis G, Conner AS
and Mulligan RC: Isolation and functional properties of murine
hematopoietic stem cells that are replicating in vivo. J Exp Med.
183:1797–1806. 1996. View Article : Google Scholar : PubMed/NCBI
|
|
18
|
Diestra JE, Scheffer GL, Català I, et al:
Frequent expression of the multi-drug resistance-associated protein
BCRP/MXR/ABCP/ABCG2 in human tumours detected by the BXP-21
monoclonal antibody in paraffin-embedded material. J Pathol.
198:213–219. 2002. View Article : Google Scholar : PubMed/NCBI
|
|
19
|
Lee J, Kotliarova S, Kotliarov Y, et al:
Tumor stem cells derived from glioblastomas cultured in bFGF and
EGF more closely mirror the phenotype and genotype of primary
tumors than do serum-cultured cell lines. Cancer Cell. 9:391–403.
2006. View Article : Google Scholar : PubMed/NCBI
|
|
20
|
Calabrese C, Poppleton H, Kocak M, et al:
A perivascular niche for brain tumor stem cells. Cancer Cell.
11:69–82. 2007. View Article : Google Scholar : PubMed/NCBI
|
|
21
|
Bleau AM, Hambardzumyan D, Ozawa T, et al:
PTEN/PI3K/Akt pathway regulates the side population phenotype and
ABCG2 activity in glioma tumor stem-like cells. Cell Stem Cell.
4:226–235. 2009. View Article : Google Scholar : PubMed/NCBI
|
|
22
|
Gil J, Stembalska A, Pesz KA and Sasiadek
MM: Cancer stem cells: the theory and perspectives in cancer
therapy. J App Genet. 49:193–199. 2008. View Article : Google Scholar
|
|
23
|
Dean M, Fojo T and Bates S: Tumor stem
cells and drug resistance. Nat Rev Cancer. 5:275–284. 2004.
View Article : Google Scholar
|
|
24
|
Eramo A, Ricci-Vitiani L, Zeuner A, et al:
Chemotherapy resistance of glioblastoma stem cells. Cell Death
Differ. 13:1238–1241. 2006. View Article : Google Scholar : PubMed/NCBI
|
|
25
|
Zheng X, Shen G, Yang X and Liu W: Most C6
cells are cancer stem cells: evidence from clonal and population
analyses. Cancer Res. 67:3691–3697. 2007. View Article : Google Scholar : PubMed/NCBI
|
|
26
|
Britton KM, Eyre R, Harvey IJ, et al:
Breast cancer, side population cells and ABCG2 expression. Cancer
Lett. 323:97–105. 2012. View Article : Google Scholar : PubMed/NCBI
|
|
27
|
Robey RW, Shukla S, Finley EM, Oldham RK,
et al: Inhibition of P-glycoprotein (ABCB1)- and multidrug
resistance-associated protein 1 (ABCC1)-mediated transport by the
orally administered inhibitor, CBT-1((R)). Biochem Pharmacol.
75:1302–1312. 2008. View Article : Google Scholar : PubMed/NCBI
|
|
28
|
Shih AH and Holland EC: Notch signaling
enhances nestin expression in gliomas. Neoplasia. 8:1072–1082.
2006. View Article : Google Scholar
|
|
29
|
Solecki DJ, Liu XL, Tomoda T, Fang Y and
Hatten ME: Activated Notch2 signaling inhibits differentiation of
cerebellar granule neuron precursors by maintaining proliferation.
Neuron. 31:557–568. 2001. View Article : Google Scholar : PubMed/NCBI
|
|
30
|
Du Z, Jia D, Liu S, et al: Oct4 is
expressed in human gliomas and promotes colony formation in glioma
cells. Glia. 57:724–733. 2009. View Article : Google Scholar
|