Introduction
Caveolae are 50–100 nm omega-shaped membranes that
represent a sub-compartment of the plasma membrane (1). Caveolin-1 (CAV-1) is the most
researched among the three principal proteins in caveolae (CAV-1,
-2 and -3) (1). CAV-1 is a 21–24
kDa protein which has emerged as a plasma membrane organizer,
sensor and protector that can respond to plasma membrane stress and
remodel the extracellular environment (2). The expression of CAV-1 is closely
associated with its transcription through various signaling
pathways that are mediated by a number of molecules, and it is
widely expressed in numerous cell types, including fibroblasts,
endothelial cells and epithelial cells (3,4).
Transcriptional control of gene expression is regulated by
microRNAs (miRNAs), regulatory molecules that mediate effects by
interacting with messenger RNA (mRNA) targets (5). Thus, CAV-1 mRNA, and the abundance of
CAV-1 protein associated with it, can be considered a potential
controller that subtly adjusts the proteome levels in
transcriptional and translational repression despite a small number
of targets (1,2). Previous studies revealed that CAV-1
and its mRNA could be expressed in numerous types of human cancer,
including breast, lung, prostate and renal cancers (6–9). A
number of studies have also identified significant correlations
between the expression of CAV-1 and its mRNA and liver
carcinogenesis (10,11).
Ethanol is an important factor in the pathogenesis
of liver cancer. Metabolically, ethanol is first converted to
acetaldehyde, an unstable molecule that generates reactive oxygen
species (ROS) and can directly drive the onset of DNA damage and
the DNA damage/repair response (12,13).
Generally, ethanol may be directly involved in hepatic cell injury
through the induction of ROS following oxidative stress or by CAV-1
translocation to the lipid droplets, thereby affecting DNA
methylation patterns and cell signaling pathways and resulting in
increased liver iron deposition (14,15).
A previous study indicates that CAV-1 expression can be used as a
new biomarker for monitoring oxidative stress induced by ethanol
(16). However, whether ethanol
can affect the expression of CAV-1 has not yet been reported. In
the present study, ethanol-treated HepG2 cells were observed using
the in vitro model to investigate the effects of ethanol on
the expression of CAV-1.
Materials and methods
Chemicals and reagents
Unless otherwise noted, all chemicals were obtained
from Sigma-Aldrich Chimie (Saint-Quentin Fallavier, France).
Standard molecular biological techniques were applied. Rabbit
monoclonal glyceraldehyde-3-phosphate dehydrogenase (GAPDH)
antibody, rabbit anti-cav-1 and anti-GAPDH antibodies and the CAV-1
(1:1,000) antibody were obtained from Santa Cruz Biotechnology,
Inc. (Santa Cruz, CA, USA). TRIzol® reagent was
purchased from Invitrogen™ (Life Technologies, Carlsbad, CA, USA).
ReverTra Ace® qPCR RT kit and Thunderbird™
SYBR® qPCR mix were obtained from Toyobo (Tokyo, Japan).
Primers were designed by AlleleID6.01 (Premier Biosoft
International, Palo Alto, CA, USA) and synthesized by Sangon
Biotech Co. Ltd. (Shanghai, China). Total protein extraction kits
were also purchased from Sangon Biotech Co. Ltd.
Culture of HepG2 cells
Human HepG2 hepatocarcinoma cells were obtained from
American Type Culture Collection (Rockville, MD, USA). The HepG2
cells were routinely cultivated in Dulbecco’s modified Eagle’s
medium (DMEM; Hyclone, Logan, UT, USA), which consisted of 10%
fetal calf serum (FCS; Hyclone), glucose (4.5 mg/ml), glutamine (4
mm), and antibiotics (50 U/ml penicillin and 50 U/ml streptomycin;
Sigma, St. Louis, MO, USA). Prior to the experiment, cells were
incubated at 37°C in a humidified atmosphere of 95% air and 5%
CO2, and the medium was changed every other day.
HepG2 cells were divided into two groups, one of
which was plated onto 6-well plates in DMEM with 10% fetal bovine
serum. After overnight attachment, HepG2 cells were incubated for
up to 12 h with 0.5, 1.0, 2.5, 5.0 and 7.5% ethanol or without
ethanol and in the presence or absence of 5 mol/l 4-methylpyrazole,
10 mol/l diallyl sulfide, or 100 mol/l uric acid. Unless otherwise
indicated, the medium was exposed to the stated ethanol
concentrations for 24 h prior to analysis.
Cell viability assay
To determine cell viability the
3-(4,5-dimethylthiazol-2-yl)-2,5-diphenyltetrazolium bromide (MTT)
assays were used. The MTT relies on a reductive coloring reagent
and dehydrogenase in a viable cell to determine cell viability with
a colorimetric method (17). The
MTT assay is the best known method for determining mitochondrial
dehydrogenase (SDH) activities in living cells (18). With this method, MTT is reduced to
a purple formazan by nicotinamide-adenine dinucleotide. However,
MTT formazan is insoluble in water, and it forms purple
needle-shaped crystals in the cells. Therefore, prior to measuring
absorbance, an organic solvent is required to solubilize the
crystals. SDH activity was detected after 3 h incubation in culture
medium without serum, containing 250 μg/ml MTT. After
removing the culture medium, formazan crystals were dissolved in
dimethyl sulphoxide. The absorbance intensity of the purple
solution that was produced was spectrophotometrically measured by a
Fusion™ microplate reader (Packard Bioscience, Meriden, CT, USA)
with a reference wavelength of 535 nm.
Cell viability was also assessed by measuring the
release of lactate dehydrogenase (LDH) in the culture medium and
cell lysate using a LDH kit (Roche Diagnostics, Mannheim, Germany).
LDH is a soluble cytosolic enzyme present in the majority of
eukaryotic cells, and upon cell death it is released into the
culture medium as a result of damage to the plasma membrane
(19). The increase of LDH
activity in the culture supernatant is proportional to the number
of lysed cells (20). LDH
participates in a coupled reaction, converting yellow tetrazolium
salt into a red, formazan-class dye, which was measured by
absorbance at 485 nm. A LDH standard curve (0–3,000 mU/ml) was used
for quantifying enzyme activity.
Western blot analysis
The HepG2 cells were washed three times without
calcium and magnesium using Dulbecco’s phosphate-buffered saline
(DPBS; Dulbecco’s Formula Modified; ICN Biochemicals, England),
which contained 0.1 mM ethylenediamine tetraacetic acid (EDTA).
Subsequently, the HepG2 cells were homogenized in 1 ml lysis buffer
A (2 mm EDTA, 10 mm ethylene glycol tetraacetic acid, 0.4% NaF, 20
mm Tris-HCL, protease inhibitor cocktail, phosphatase inhibitor 1%
Triton® X‑100, pH 7.5) at 4°C. Samples were centrifuged
at 14,000 × g for 30 min and the supernatant was decanted to a
separate tube and collected as a soluble fraction. Buffer A (150
μl) with 1% sodium dodecyl sulfate (SDS) at 4°C was then
added to the pellet. The pellet was disrupted using an ultrasonic
crusher. The samples were then centrifuged at 14,000 × g for 30 min
at 4°C, as previously described. The supernatant was collected as
an insoluble fraction. Equal amounts of proteins (40–50 μg)
were separated by SDS-polyacrylamide gel electrophoresis and
processed for immunoblotting with antibodies for CAV-1 (diluted
1:1,000). The blots were inhibited with 5% nonfat dry milk in
Tris-buffered saline containing TBS (20 mM Tris and 137 mM NaCl; pH
7.5) and 0.3% Tween 20 (TBS‑T) for 3 h at 25°C and then incubated
with antibodies for CAV-1 (1:1,000) for 16 h at 4°C. All protein
bands were scanned using ChemiImager 5500 V2.03 software (Alpha
Innotech, San Leandro, CA, USA), and integrated density values were
calculated with a computerized image analysis system (FluorChem
2.0; Bio-Rad, Hercules, CA, USA) and normalized to that of
β-actin.
Quantitative PCR (qPCR)
Total RNA was extracted from cells using the RNA
Mini kit (Ambion, Paisley, UK) according to the manufacturer’s
instructions. Genes of interest were amplified from 2 mg DNase
I-treated total RNAs with Thunderbird™ reverse transcriptase
(Toyobo) and a random primer. The primers used for qPCR are listed
in Table I (21). For qPCR, transcripts were
quantified by Applied Biosystems 7300 Real-Time PCR system (Life
Technologies) and Thunderbird™ SYBR® qPCR mix. The qPCR
reactions were performed by adding 10 μl solution of clone
pC (10-fold dilutions of an initial stock solution concentration of
0.0056 fmol pC/μl) to 1 μl test DNA (0.1–0.5 fmol
total mtDNA/μl) in a standard 100 μl PCR reaction [10
mM Tris-HCl, 50 mM KCI, 2 mM MgC12, 400 μM each of dATP,
dCTP, dGTP, TTP (Pharmacia Biotech, Picastaway, NJ, USA), 100 pmol
of each primer, 2.5 units of Taq polymerase (Perkin-Elmer, Waltham,
MA, USA) and 10 UCi of [a-32P]dATP (Amersham, Arlington Heights,
IL, USA)]. The PCR reaction was run on a Biocycler (IBI; Bios
Corp., New Haven, CT, USA) at 94°C for 20 sec, 65°C for 20 sec and
72°C for 20 sec for 25 cycles. The extension of the last cycle was
at 72°C for 10 min. Following the last cycle, the DNA was denatured
at 95°C for 10 min and then cooled to room temperature.
Subsequently, 10 μl PCR product was digested with 0.5 units
Sspl overnight at 37°C. The digested DNA fragments were separated
by electrophoresis on a 12% non-denaturing polyacrylamide gel (29:1
acrylamide:bis) and the labelled fragments were visualized by
autoradiography on X‑ray films [Ray Chem Medica (P) Ltd., Delhi,
India] of the vacuum-dried gels. These experiments were performed
in triplicate and independently repeated at least three times.
GAPDH was used as an internal control for gene expression
analysis.
 | Table IQuantitative PCR primer sequences. |
Table I
Quantitative PCR primer sequences.
| Gene | PCR primer
sequences | Cycle number | PCR products
(bp) |
|---|
| CAV-1 |
5′-CGCGACCCTAAACACCTCAA-3′ | 40 | 254 |
|
5′-GCCGTCAAAACTGTGTGTCC-3′ | | |
| GAPDH |
5′-ACCACAGTCCATGCCATCAC-3′ | 40 | 605 |
|
5′-TCCACCACCCTGTTGCTGTA-3′ | | |
Immunofluorescence
The HepG2 cell monolayers grown on glass coverslips
were fixed with 4% paraformaldehyde and permeabilized with 0.5%
Triton® X-100. Following blocking with 2% bovine serum
albumin in PBS, the cells were incubated with rabbit anti-CAV-1
(diluted 1:50) to visualize the distribution of CAV-1. The glass
slides were analyzed using BX-50-FLA immunofluorescence microscopy
(Olympus, Tokyo, Japan).
Statistical analysis
Experiments were repeated at least three times.
Continuous variables were expressed as the mean ± standard
deviation. Categorical data were presented as frequencies and
percentages. Differences between the groups were compared using the
two-tailed, non-paired Student’s t-test or one-way analysis of
variance for continuous variables, where appropriate. Comparisons
of categorical variables between the groups were performed using
the χ2 test. All tests of statistical significance were
two-sided, and P<0.05 was considered to indicate a statistically
significant difference. The statistical analyses were calculated
with SPSS 17.0 (SPSS, Inc., Chicago, IL, USA).
Results
Effect of ethanol on HepG2 cell
viability
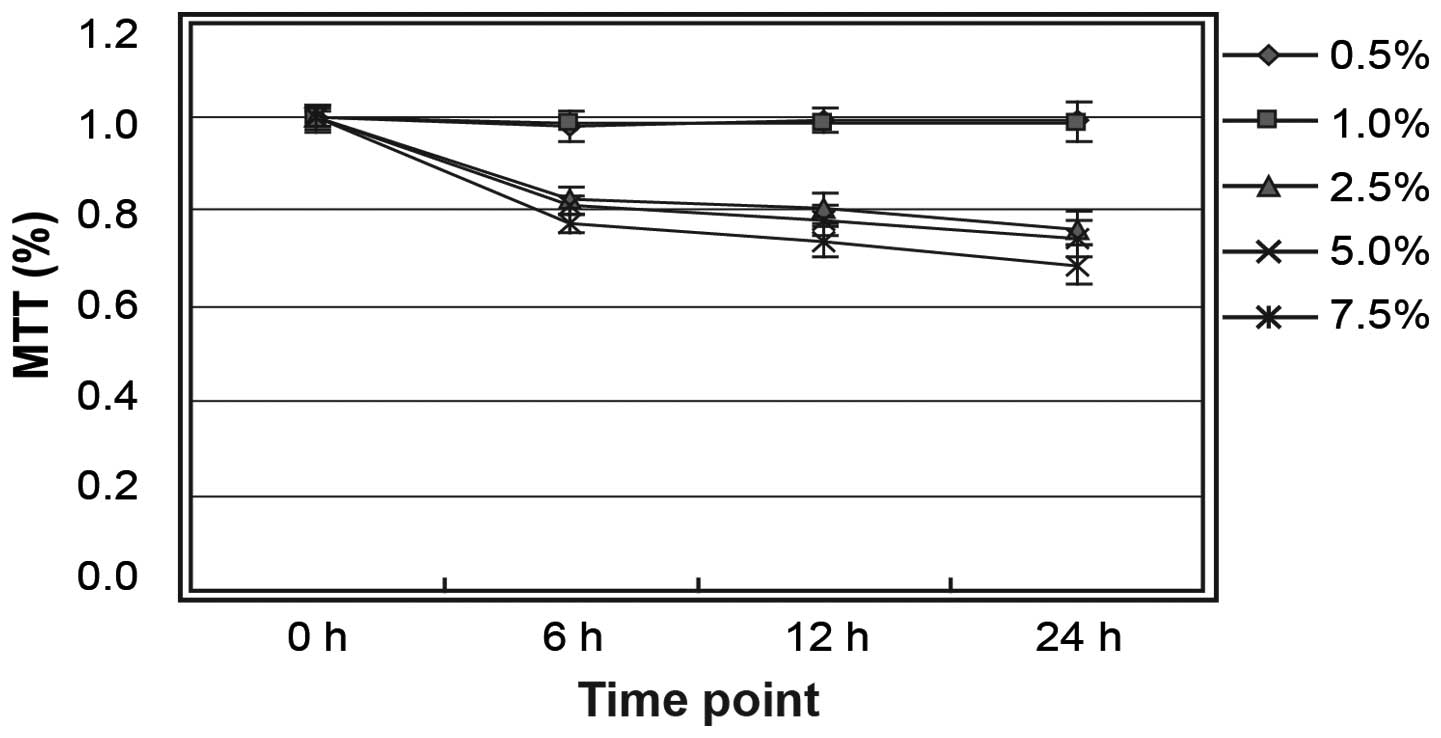
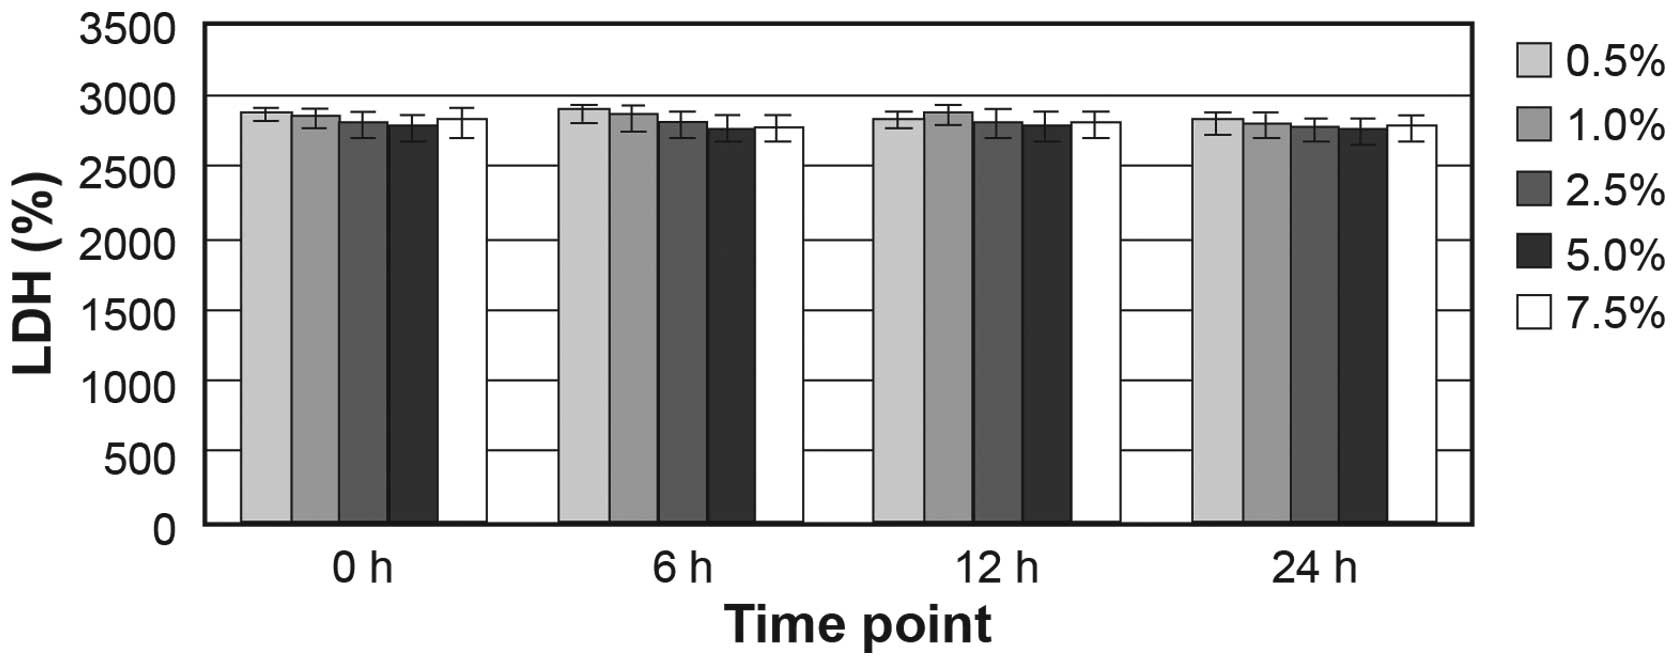
The HepG2 cells were treated with ethanol at
different concentrations (0.5, 1.0, 2.5, 5.0 and 7.5%) for 6, 12 or
24 h. MTT assay showed that cell viability was not altered at
ethanol concentrations of ≤1.0% (Fig.
1). LDH assay indicated that ≥7.5% ethanol did not increase the
release of the cytosolic enzyme LDH into the medium (Fig. 2). Ethanol concentrations >1.0%
caused cell shedding, but not cell fragmentation. At an ethanol
concentration of 7.5%, the ratio of shedding cells was up to
32.16±2.28%. Therefore, subsequent experiments were conducted using
an ethanol concentration of 1.0%.
Effect of ethanol on the expression of
CAV‑1
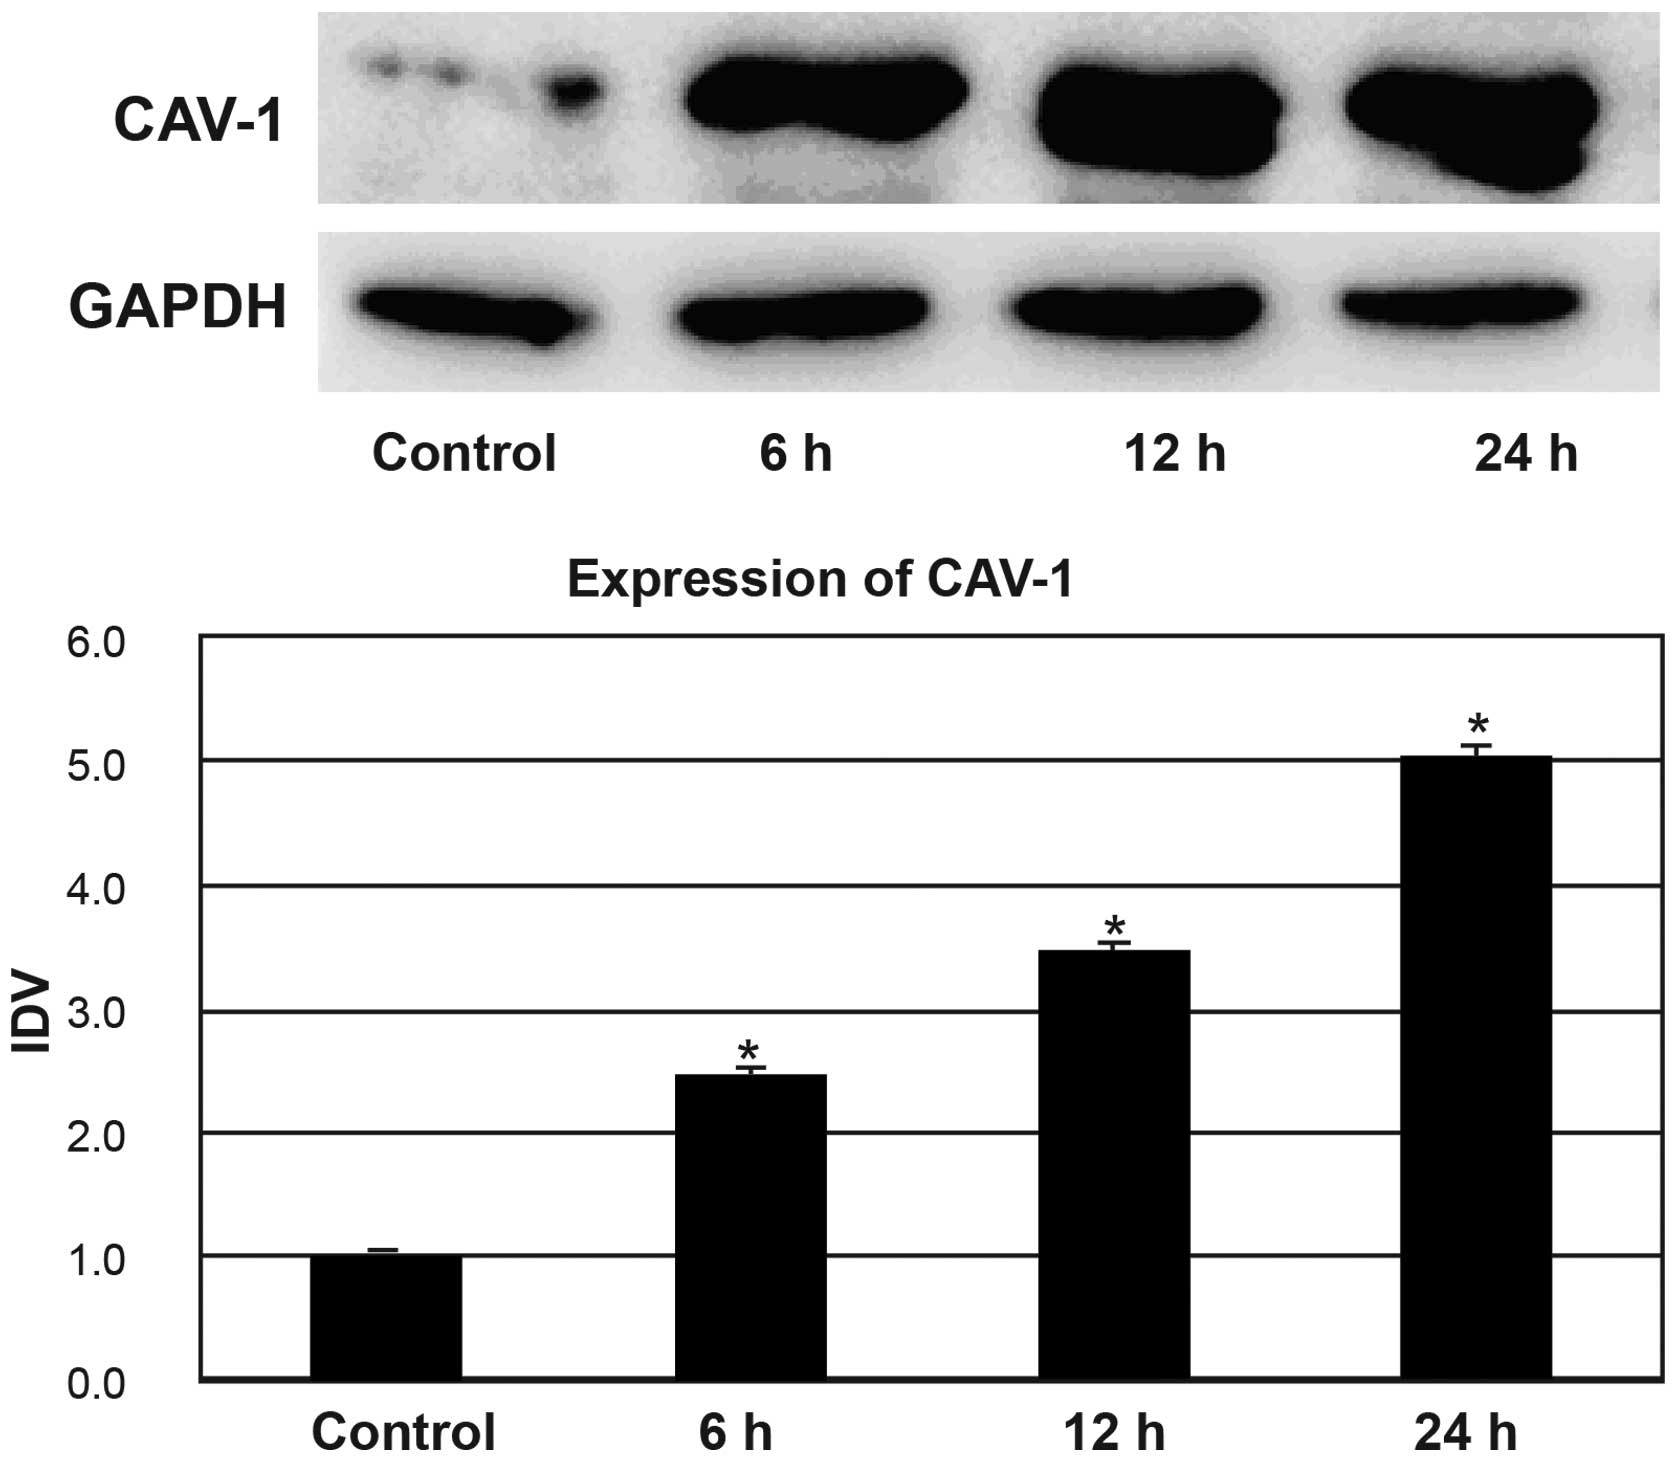
The HepG2 cells in the ethanol group were treated
with 1% ethanol for 6, 12, and 24 h. As shown in Fig. 3, the expression levels of CAV-1
showed an increase after treatment with 1.0% ethanol. Western blot
analysis showed significant differences in CAV‑1 expression between
the control group and the 1.0% ethanol-treated group at 6, 12 and
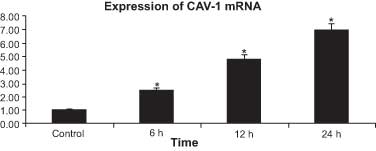
24 h (all P<0.05). After treatment with 1.0% ethanol, the
expression levels of CAV-1 mRNA in HepG2 cells also exhibited an
increasing trend (Fig. 4).
Significant differences in the expression levels of CAV‑1 mRNA were
identified between the control group and the 1.0% ethanol-treated
group at 6, 12 and 24 h (all P<0.05).
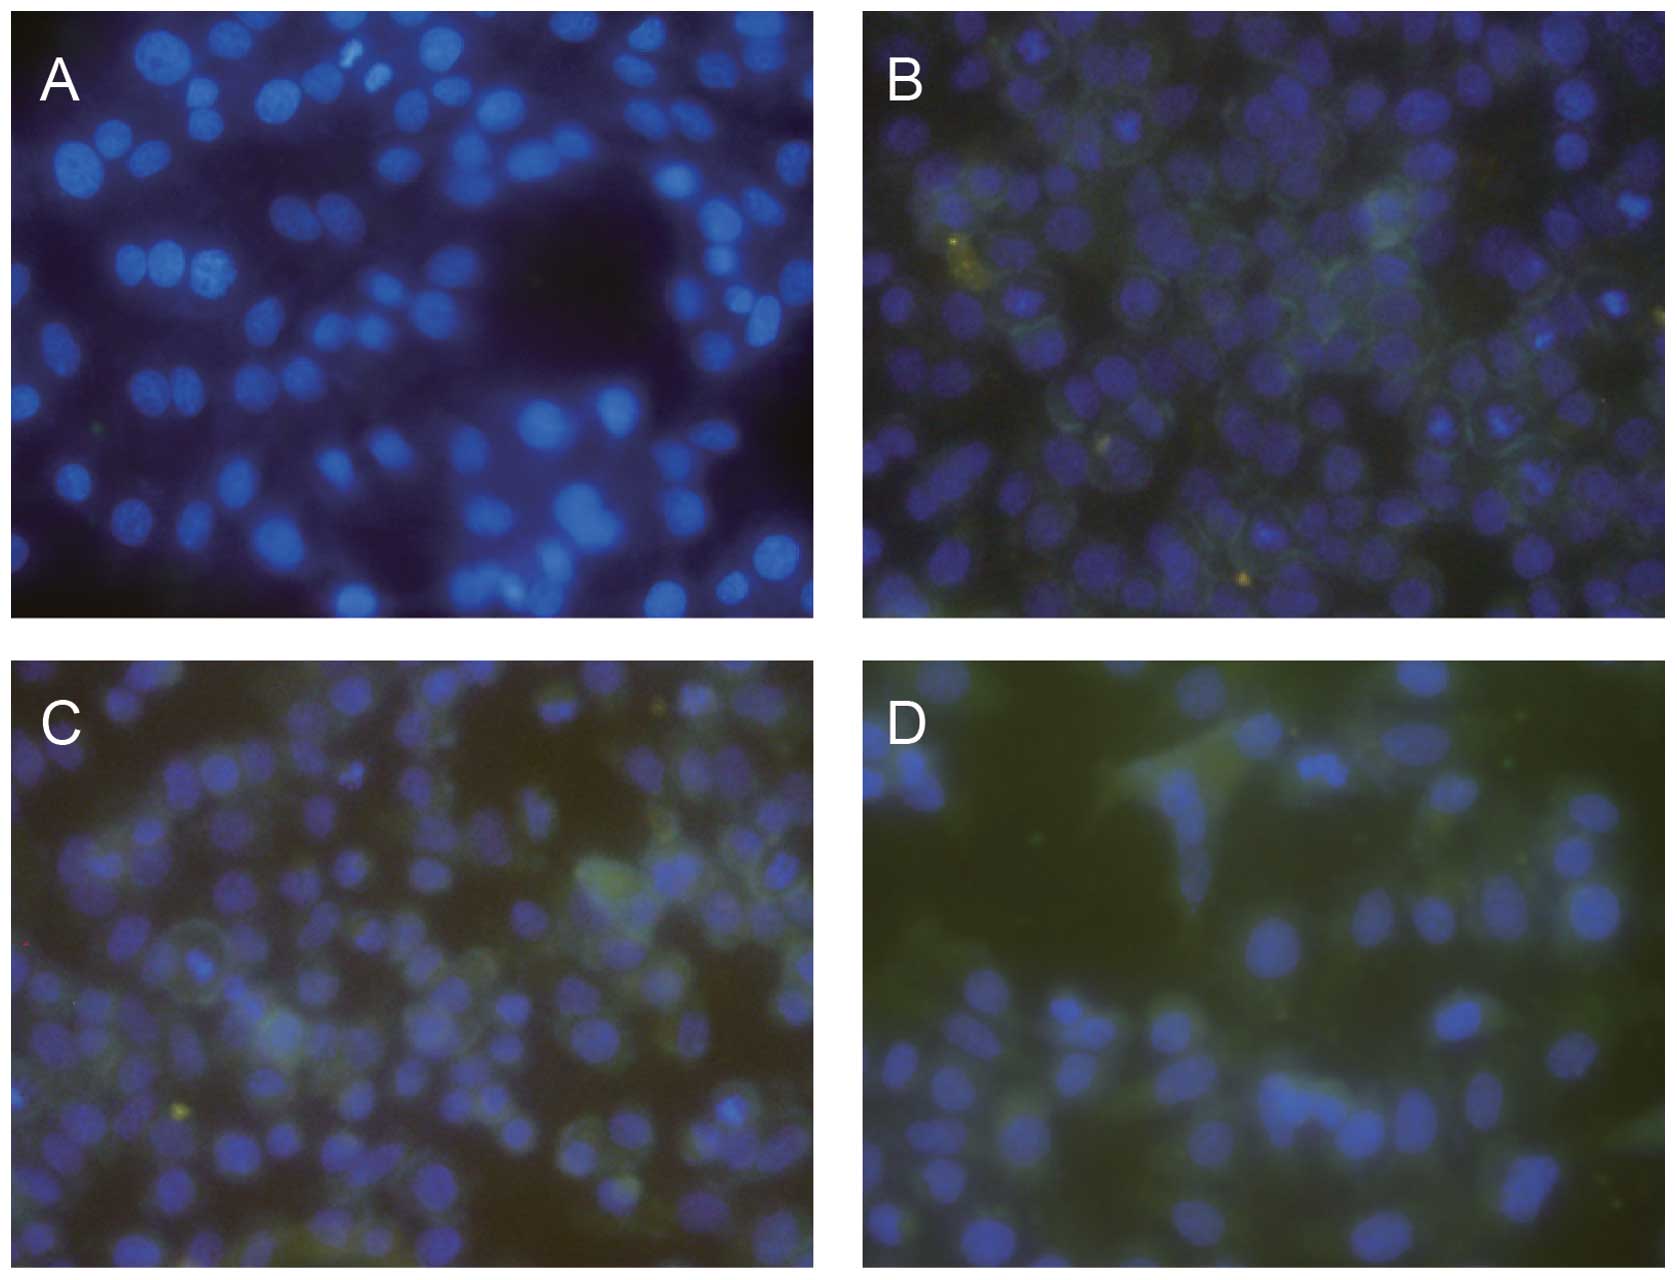
Distribution of CAV‑1 in HepG2 cells
The distribution of CAV-1 in HepG2 cells was
assessed by immunofluorescent microscopy. CAV-1 was distributed
discontinuously in the boundaries of HepG2 cells (Fig. 5).
Discussion
CAV-1 is the chief structural protein of caveolae
and is a plasma membrane protector organizer and sensor that can
respond to plasma membrane stresses and remodel the extracellular
environment (22). Numerous
studies suggest that the involvement of CAV‑1 in a variety of
cellular processes has a significant effect on the internalization
of pathogens, cholesterol homeostasis, transendothelial vesicular
transport, integration of signaling pathways, and regulation of
cell growth and proliferation (23–28).
Generally, downregulation of CAV-1 can release and activate
signaling molecules and promote cell transformation and
proliferation during the first stage of tumorigenesis, which may
encourage rapid tumor growth and advanced metastasis (29,30).
On the contrary, the overexpression of CAV-1 has been demonstrated
to be closely correlated with the expression of classic markers of
tumor progression (Ki-67 and p53), and can mediate filopodia
formation, increase proliferation and protect against apoptosis,
which may enhance the invasive ability of certain adenocarcinoma
cells (31,32). Numerous previous studies have
revealed that CAV-1 expression is downregulated in many forms of
cancer (6,7,33,34).
Even though the molecular mechanism of this controversial function
of CAV-1 remains to be elucidated, these findings imply that CAV‑1
may act as a tumor suppressor gene and a metastasis-promoting gene
(35).
In the present study, MTT and LDH assays showed that
cell viability was not altered at ethanol concentrations of ≤1.0%,
while ethanol concentrations >1.0% led to cell shedding. Based
on these results, 1.0% ethanol was defined as the maximum
concentration at which ethanol has no significant influence on
HepG2 cell viability and molecular structure. The results of the
current study demonstrate that 1.0% ethanol may result in a
significant increase in the levels of CAV-1 expression in HepG2
cells at 6, 12 and 24 h. This result may be due to proteolysis
caused by increased ROS following oxidative stress, or to CAV-1
translocation to the lipid droplets, considering its role in
lipogenesis. A previous study indicated that this increase in CAV-1
may be associated with the alteration of mitochondrial
permeability, a primary cause of the swelling. However, there are
other factors involved in the regulation of mitochondrial
permeability, and their role cannot be completely dismissed
(36). The present study also
demonstrated that the expression of CAV-1 mRNA in HepG2 cells
exhibited an increasing trend following treatment with 1.0%
ethanol, which supports the theory that ethanol affects the
expression of CAV-1 and its mRNA. Metabolically, ethanol is first
converted to acetaldehyde, which is an unstable molecule that
generates ROS and can directly drive the onset of DNA-damage and
the DNA-damage/repair response (12,13).
Ethanol may be involved directly in the injury of hepatic cells by
the effect of CAV-1 translocation to the lipid droplets on DNA
methylation patterns and cell signaling pathways (14,15).
Wang and Abdel-Rahman (16)
presented evidence that ethanol induces metabolic changes in the
tumor microenvironment and fuels tumor cell growth via oxidative
mitochondrial metabolism. They also demonstrate that caveolin-1
protein expression can be effectively used as a new biomarker to
monitor oxidative stress induced by ethanol.
In conclusion, this study indicates that ethanol may
increase the expression levels of CAV-1 in HepG2 cells.
Acknowledgments
The authors would like to thank all of their
colleagues working in the Department of Gastroenterology, The First
Affiliated Hospital of China Medical University. This study was
funded by the Department of Science and Technology Project of
Liaoning Province (2011225015) and the Scientific Research of the
First Hospital of China Medical University (fsfh1313).
References
|
1
|
Fu Y, Hoang A, Escher G, et al: Expression
of caveolin-1 enhances cholesterol efflux in hepatic cells. J Biol
Chem. 279:14140–14146. 2004. View Article : Google Scholar : PubMed/NCBI
|
|
2
|
Hendrickson DG, Hogan DJ, McCullough HL,
et al: Concordant regulation of translation and mRNA abundance for
hundreds of targets of a human microRNA. Plos Biol. 7:e10002382009.
View Article : Google Scholar : PubMed/NCBI
|
|
3
|
Yang XY, Huang CC, Kan QM, et al: Calcium
regulates caveolin-1 expression at the transcriptional level.
Biochem Biophys Res Commun. 426:334–341. 2012. View Article : Google Scholar : PubMed/NCBI
|
|
4
|
Sotgia F, Martinez-Outschoorn UE, Howell
A, et al: Caveolin-1 and cancer metabolism in the tumor
microenvironment: markers, models, and mechanisms. Annu Rev Pathol.
7:423–467. 2012. View Article : Google Scholar
|
|
5
|
Khraiwesh B, Arif MA, Seumel GI, et al:
Transcriptional control of gene expression by microRNAs. Cell.
140:111–122. 2010. View Article : Google Scholar : PubMed/NCBI
|
|
6
|
Sloan EK, Ciocca DR, Pouliot N, et al:
Stromal cell expression of caveolin-1 predicts outcome in breast
cancer. Am J Pathol. 174:2035–2043. 2009. View Article : Google Scholar : PubMed/NCBI
|
|
7
|
Chen HL, Fan LF, Gao J, Ouyang JP and
Zhang YX: Differential expression and function of the caveolin-1
gene in non-small cell lung carcinoma. Oncol Rep. 25:359–366. 2011.
View Article : Google Scholar
|
|
8
|
Thompson TC, Tahir SA, Li L, et al: The
role of caveolin-1 in prostate cancer: clinical implications.
Prostate Cancer Prostatic Dis. 13:6–11. 2010. View Article : Google Scholar :
|
|
9
|
Yu S, Zhang L, Li N, et al: Caveolin-1
up-regulates ST6Gal-I to promote the adhesive capability of mouse
hepatocarcinoma cells to fibronectin via FAK-mediated adhesion
signaling. Biochem Biophys Res Commun. 427:506–512. 2012.
View Article : Google Scholar : PubMed/NCBI
|
|
10
|
Meyer C, Dzieran J, Liu Y, et al: Distinct
dedifferentiation processes affect caveolin-1 expression in
hepatocytes. Cell Commun Signal. 11:62013. View Article : Google Scholar : PubMed/NCBI
|
|
11
|
Tse EY, Ko FC, Tung EK, et al: Caveolin-1
overexpression is associated with hepatocellular carcinoma
tumourigenesis and metastasis. J Pathol. 226:645–653. 2012.
View Article : Google Scholar
|
|
12
|
Abraham J, Balbo S, Crabb D and Brooks PJ:
Alcohol metabolism in human cells causes DNA damage and activates
the Fanconi anemia-breast cancer susceptibility (FA-BRCA) DNA
damage response network. Alcohol Clin Exp Res. 35:2113–2120. 2011.
View Article : Google Scholar : PubMed/NCBI
|
|
13
|
Seitz HK and Stickel F: Acetaldehyde as an
underestimated risk factor for cancer development: role of genetics
in ethanol metabolism. Genes Nutr. 5:121–128. 2010. View Article : Google Scholar :
|
|
14
|
Cederbaum AI, Lu Y and Wu D: Role of
oxidative stress in alcohol-induced liver injury. Arch Toxicol.
83:519–548. 2009. View Article : Google Scholar : PubMed/NCBI
|
|
15
|
Vluggens A and Reddy JK: Nuclear receptors
and transcription factors in the development of fatty liver
disease. Curr Drug Metab. 13:1422–1435. 2012. View Article : Google Scholar : PubMed/NCBI
|
|
16
|
Wang X and Abdel-Rahman AA: Effect of
chronic ethanol administration on hepatic eNOS activity and its
association with caveolin-1 and calmodulin in female rats. Am J
Physiol Gastrointest Liver Physiol. 289:G579–G585. 2005. View Article : Google Scholar : PubMed/NCBI
|
|
17
|
Denizot F and Lang R: Rapid colorimetric
assay for cell growth and survival. Modifications to the
tetrazolium dye procedure giving improved sensitivity and
reliability. J Immunol Methods. 89:271–277. 1986. View Article : Google Scholar : PubMed/NCBI
|
|
18
|
Vega-Avila E and Pugsley MK: An overview
of colorimetric assay methods used to assess survival or
proliferation of mammalian cells. Proc West Pharmacol Soc.
54:10–14. 2011.PubMed/NCBI
|
|
19
|
Smith SM, Wunder MB, Norris DA and
Shellman YG: A simple protocol for using a LDH-based cytotoxicity
assay to assess the effects of death and growth inhibition at the
same time. Plos One. 6:e269082011. View Article : Google Scholar : PubMed/NCBI
|
|
20
|
Cummings BS, Wills LP and Schnellmann RG:
Measurement of cell death in Mammalian cells. Curr Protoc
Pharmacol. Chapter 12: Unit 12. pp. 82012, PubMed/NCBI
|
|
21
|
Fuchs S, Hollins AJ, Laue M, et al:
Differentiation of human alveolar epithelial cells in primary
culture: morphological characterization and synthesis of caveolin-1
and surfactant protein-C. Cell Tissue Res. 311:31–45. 2003.
View Article : Google Scholar
|
|
22
|
Quest AF, Lobos-Gonzalez L, Nunez S, et
al: The caveolin-1 connection to cell death and survival. Curr Mol
Med. 13:266–281. 2013. View Article : Google Scholar
|
|
23
|
Chidlow JH Jr and Sessa WC: Caveolae,
caveolins, and cavins: complex control of cellular signalling and
inflammation. Cardiovasc Res. 86:219–225. 2010. View Article : Google Scholar : PubMed/NCBI
|
|
24
|
Garrean S, Gao XP, Brovkovych V, et al:
Caveolin-1 regulates NF‑kappaB activation and lung inflammatory
response to sepsis induced by lipopolysaccharide. J Immunol.
177:4853–4860. 2006. View Article : Google Scholar : PubMed/NCBI
|
|
25
|
Razani B, Combs TP, Wang XB, et al:
Caveolin‑1‑deficient mice are lean, resistant to diet-induced
obesity, and show hypertriglyceridemia with adipocyte
abnormalities. J Biol Chem. 277:8635–8647. 2002. View Article : Google Scholar
|
|
26
|
Yokomori H, Oda M, Yoshimura K, et al:
Vascular endothelial growth factor increases fenestral permeability
in hepatic sinusoidal endothelial cells. Liver Int. 23:467–475.
2003. View Article : Google Scholar
|
|
27
|
Giancotti FG: Complexity and specificity
of integrin signalling. Nat Cell Biol. 2:E13–E14. 2000. View Article : Google Scholar : PubMed/NCBI
|
|
28
|
Ten Dijke P, Goumans MJ, Itoh F and Itoh
S: Regulation of cell proliferation by Smad proteins. J Cell
Physiol. 191:1–16. 2002. View Article : Google Scholar : PubMed/NCBI
|
|
29
|
Wang S, Kan Q, Sun Y, et al: Caveolin-1
regulates neural differentiation of rat bone mesenchymal stem cells
into neurons by modulating Notch signaling. Int J Dev Neurosci.
31:30–35. 2013. View Article : Google Scholar
|
|
30
|
Senetta R, Stella G, Pozzi E, et al:
Caveolin-1 as a promoter of tumour spreading: when, how, where and
why. J Cell Mol Med. 17:325–336. 2013. View Article : Google Scholar : PubMed/NCBI
|
|
31
|
Tanase CP, Dima S, Mihai M, et al:
Caveolin-1 overexpression correlates with tumour progression
markers in pancreatic ductal adenocarcinoma. J Mol Histol.
40:23–29. 2009. View Article : Google Scholar : PubMed/NCBI
|
|
32
|
Pancotti F, Roncuzzi L, Maggiolini M and
Gasperi-Campani A: Caveolin-1 silencing arrests the proliferation
of metastatic lung cancer cells through the inhibition of STAT3
signaling. Cell Signal. 24:1390–1397. 2012. View Article : Google Scholar : PubMed/NCBI
|
|
33
|
Han F and Zhu HG: Caveolin-1 regulating
the invasion and expression of matrix metalloproteinase (MMPs) in
pancreatic carcinoma cells. J Surg Res. 159:443–450. 2010.
View Article : Google Scholar
|
|
34
|
Prinetti A, Aureli M, Illuzzi G, et al:
GM3 synthase overexpression results in reduced cell motility and in
caveolin-1 upregulation in human ovarian carcinoma cells.
Glycobiology. 20:62–77. 2010. View Article : Google Scholar
|
|
35
|
Yeh D, Chen C, Sun MZ, et al: Caveolin-1
is an important factor for the metastasis and proliferation of
human small cell lung cancer NCI-H446 cell. Anat Rec (Hoboken).
292:1584–1592. 2009. View
Article : Google Scholar
|
|
36
|
Mastrodonato M, Portincasa P, Mentino D,
et al: Caveolin-1 and mitochondrial alterations in regenerating rat
liver. Microsc Res Tech. 75:1026–1032. 2012. View Article : Google Scholar : PubMed/NCBI
|