Introduction
Hepatitis B is the most common severe hepatic
infection worldwide. The causative agent of hepatitis B is the
hepatitis B virus (HBV), which attacks the liver. There is
currently no complete cure for chronic hepatitis B. The drugs
currently used to treat hepatitis B slow the progression of liver
disease, by suppressing the virus. If less HBV is produced, less
liver damage occurs (1). However,
the current anti-HBV drugs, including interferon-α and nucleoside
analogues, have certain disadvantages, including the rebound
phenomenon of HBV replication following withdrawal of treatment and
unpleasant side effects (2).
Furthermore, a significant number of patients develop drug
resistance following long-term use of these therapeutic agents
(3). Therefore, further
investigation is required, in order to develop novel anti-HBV
agents.
Heme oxygenases (HO) are rate-limiting enzymes in
heme catabolism. They catalyze the oxidative degradation of heme to
carbon monoxide, free iron and biliverdin, which is subsequently
converted to bilirubin by the bilirubin reductase enzyme (4,5).
Among the three known heme oxygenase isoforms, HO-1, HO-2 and HO-3;
HO-1 is the only inducible form present in almost every type of
cell (6). The induction,
overexpression or inhibition of HO-1 degradation has been observed
to interfere with acute and chronic liver inflammation and fibrotic
progression, apoptotic liver damage, replication of hepatitis B and
C viruses or protection of liver grafts from ischemia/reperfusion
injury, caused by either transplantation or
hemorrhage/resuscitation (7).
Therefore, HO-1 possesses significant curative potential,
particularly for patients with hepatitis B and C, predominantly due
to its anti-inflammatory, anti-apoptotic, antifibrotic and
antiviral properties (7).
The induction of HO-1 directly represses HBV
replication in hepatocytes at the post-transcriptional level by
reducing the stability of the HBV core protein, therefore
inhibiting the refill of nuclear HBV covalently closed circular DNA
(HBV cccDNA) (8). Small
interfering (si)RNA, directed against HO-1 demonstrated that this
effect is dependent on the expression of HO-1 (7). Therefore, the induction of HO-1 may
be a novel therapeutic option for hepatitis B-associated
inflammation. Although HO-1 has been observed to exhibit pronounced
antiviral properties, the dynamic association between HBV
replication and the expression of HO-1 remains to be elucidated.
The present study aimed to investigate the overexpression of HO-1
induced by hemin, and to discuss the dynamic association between
HBV replication and the induction of HO-1 in HBV-transfected
HepG2.2.15 cells.
Materials and methods
Reagents
Fetal bovine serum, hemin and Dulbecco’s modified
Eagle’s medium (DMEM) were purchased from Gibco Life Technologies
(Grand Island, NY, USA).
3-(4,5-dimethylthiazol-2-yl)-2,5-diphenyltetrazolium bromide (MTT)
was purchased from Sigma-Aldrich (St. Louis, MO, USA). A HBV DNA
polymerase chain reaction (PCR)-fluorescence quantitation kit and
enzyme-immunoassay (EIA) kits for the detection of hepatitis B
surface antigen (HBsAg) and hepatitis B e antigen (HBeAg) were
obtained from Shanghai Kehua Bio-engineering Co., Ltd (Shanghai,
China). G418 was purchased from Invitrogen Life Technologies
(Carlsbad, CA, USA). SYBR® Premix Ex Taq™, RNAiso Plus,
a Prime Script Reverse Transcription (RT) Reagent kit and DNA
ladder marker were obtained from Takara Biotechnology Co., Ltd.
(Dalian, China). All other reagents were of the highest commercial
grade available.
Cytotoxicity of hemin on HepG2.2.15
cells
HBV-transfected HepG2.2.15 hepatoma cells
(5.0×10⁴ cells/ml) were provided by the State Key
Laboratory for Diagnosis and Treatment of Infectious Diseases at
Zhejiang University (Zhejiang, China) (9) and maintained in DMEM supplemented
with 2 mM glutamine, 10% (v/v) heat-inactivated fetal bovine serum
and 380 μg/ml G418 at 37°C in a 95% humidified atmosphere
containing 5% CO2. Hemin-induced cytotoxicity was
analyzed using an MTT assay. Briefly, the cells were seeded in a
96-well plate (5.0×10⁴ cells/ml; 200 μl/well).
Different concentrations of hemin (5, 10, 20, 50, 75 and 100
μM) were applied to the culture wells in triplicate. The
cells were then incubated for six days and 10 μl MTT (5
mg/ml) was then added to the cells in each well. Following 4 h
culture at 37°C (95% humidity; 5% CO2), the medium was
removed, and the blue formazan crystals, which had formed, were
dissolved in 150 μl dimethyl sulfoxide (Sigma-Aldrich). The
absorbance of the formazan generated from MTT was measured at a
wavelength of 570 nm using a Multi-Well microplate reader
(Multiskan MK3; Thermo Fisher Scientific Inc., Waltham, MA, USA).
The cytotoxicity of hemin was defined according to the quantity of
formazan produced relative to that produced by the untreated cells,
and was expressed as cell viability.
Hemin-induced expression of HO-1 in
HepG2.2.15 cells
HepG2.2.15 cells were seeded in six-well plates
(5.0×10⁴ cells/ml) and were treated with various
concentrations of hemin (5, 10, 20 and 50 μM) for 1–6 days,
respectively. The mRNA expression of HO-1 was detected using
quantitative (q)PCR. Total RNA was extracted from the HepG2.2.15
cells using RNAiso Plus reagent, followed by recombinant DNase I
(RNase-free; Takara Biotechnology Co., Ltd) digestion. The RNA was
reverse transcribed into cDNA using the Prime Script RT reagent
kit, according to the manufacturer’s instructions. The products of
reverse transcription served as a template for qPCR. qPCR was
performed with SYBR Premix Ex Taq (Tli RNaseH Plus) using a Bio-Rad
iQ5 Real Time PCR system (Bio-Rad Laboratories, Inc., Hercules, CA,
USA). β-actin was used as an internal control. The primers for HO-1
and β-actin were specifically designed according to the mRNA
sequences of human HO-1 and β-actin, obtained from Genbank
(http://blast.st-va.ncbi.nlm.nih.gov/Blast.cgi?CMD=Web&PAGE_TYPE=BlastHome).
The following primer sequences were used: HO-1, forward
5′-TTGCCAGTGCCACCAAGTTC-3′, reverse 5′-TCAGCAGCTCCTGCAACTCC-3′; and
β-actin, forward 5′-TGGCACCCAGCACAATGAA-3′, and reverse
5′-CTAAGTCATAGTCCGCCTAGAAGCA-3′. The thermal program comprised of
an initial denaturation at 95°C for 30 sec, followed by 40
amplification cycles, each containing two steps: 95°C for 5 sec and
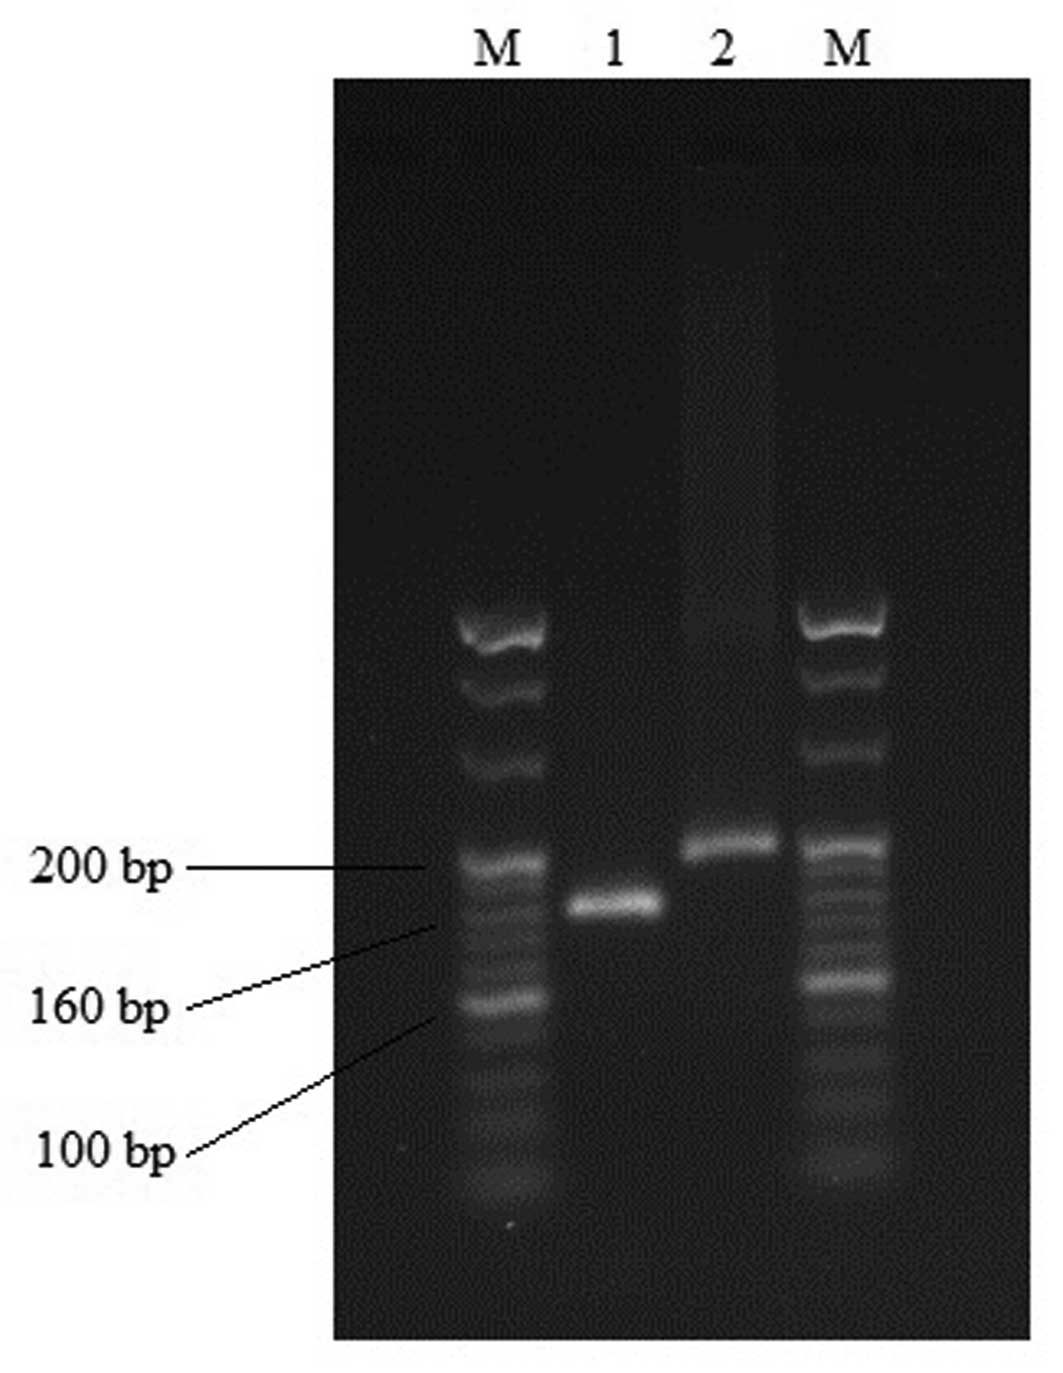
60°C for 1 min. The target gene fragments were analyzed using gel
electrophoresis (2% agarose; Biowest SAS, Nuaillé, France), to
verify the specificity of the primers. To check the purity of the
products, a melting curve analysis was performed after each run.
Relative quantification was conducted using the cycle threshold
(Ct) values, which were determined for triplicate reactions for the
assessed and reference samples for each target gene, and for the
internal control gene (β-actin). The relative expression levels
were determined using the 2−ΔΔCt quantification method,
where ΔΔCt = ΔCt(target sample) -
ΔCt(reference sample) (10).
HBV replication in HepG2.2.15 cells
treated with hemin
The medium, in which the HepG2.2.15 cells treated
with hemin for 1–6 days, was used to measure the HBsAg, HBeAg and
HBV DNA levels. The levels of HBsAg and HBeAg in the culture
supernatants were determined using EIA kits, according to the
manufacturer’s instructions. The absorbance was measured at 450 nm
using a multi-well plate reader. The HBV viral load in the culture
supernatants was detected using a HBV DNA PCR-fluorescence
quantitation kit. Briefly, viral DNA from HBV virions present in
the cell culture supernatants was extracted and amplified using the
Bio-Rad iQ5 Real Time PCR system. The primer sequences were as
follows: Forward 5′-CCGTCTGTGCCTTCTCATCTG-3′, and reverse
5′-AGTCCAAGAGTACTCTTATAGAAGACCTT-3′. The Taqman probe sequence was:
FAM-CCGTGTGCACTTCGCTTCACCTCTGC. The thermal program comprised of an
initial denaturation at 94°C for 2 min, followed by 40
amplification cycles each containing two steps: 95°C for 5 sec and
60°C for 30 sec. A plasmid containing the HBV genome was used to
prepare the standard curve.
Dynamic correlation between HO-1
induction and HBV replication
Preliminary investigations indicated that 50
μM hemin is the maximum non-toxic concentration on
HepG2.2.15 cells, and is the optimal concentration for the
induction of HO-1 (Table I). To
further determine the dynamic correlation between the induction of
HO-1 and the replication of HBV, overexpression of HO-1 was induced
using 50 μM hemin, and its effects on HBV replication were
investigated in the HepG2.2.15 cells. HepG2.2.15 cells were treated
with 50 μM hemin for 1–6 days. The expression levels of HO-1
in the cells treated with hemin for different durations were
determined using qPCR, as described above. The HBsAg and HBeAg
levels in the culture supernatants were determined using EIA kits.
The HBV viral load the in culture supernatants were detected using
a HBV DNA PCR-fluorescence quantitation kit.
 | Table ICytotoxicity of hemin in HepG2.2.15
cells. |
Table I
Cytotoxicity of hemin in HepG2.2.15
cells.
| Group | Hemin concentration
(μM) | Absorbance at 570
nm | Cell survival
(%) |
|---|
| Vehicle | – | 1.586±0.058 | 100.000 |
| Hemin | 5 | 1.675±0.042 | 105.612 |
| 10 | 1.535±0.112 | 96.784 |
| 20 | 1.435±0.103 | 90.479 |
| 50 | 1.446±0.101 | 91.173 |
| 75 | 1.377±0.147a | 86.822 |
| 100 | 1.259±0.055b | 79.382 |
Statistical analysis
The experimental data are expressed as the mean ±
standard deviation. The results were subjected to one-way analysis
of variance and Student’s t-test in order to determine
significance. Statistical analyses were performed using SPSS 10.0
software (SPSS, Inc., Chicago, IL, USA). P<0.05 was considered
to indicate a statistically significant difference.
Results
Cytotoxicity analysis of hemin
The cytotoxicity of hemin on HepG2.2.15 cells was
determined using an MTT assay. Hemin was non-toxic to the cells
when used at a concentration between 5 and 50 μM for six
days (Table I). Following exposure
to 50 μM hemin for six days, cell viability was 91.17%. The
maximum non-toxic concentration of hemin on HepG2.2.15 cells was 50
μM, whereas treatment with hemin at concentrations between
75 and 100 μM produced a significant decrease in cell
viability. Cell viability was 86.82 and 79.38% following exposure
to 75 and 100 μM hemin for six days, respectively.
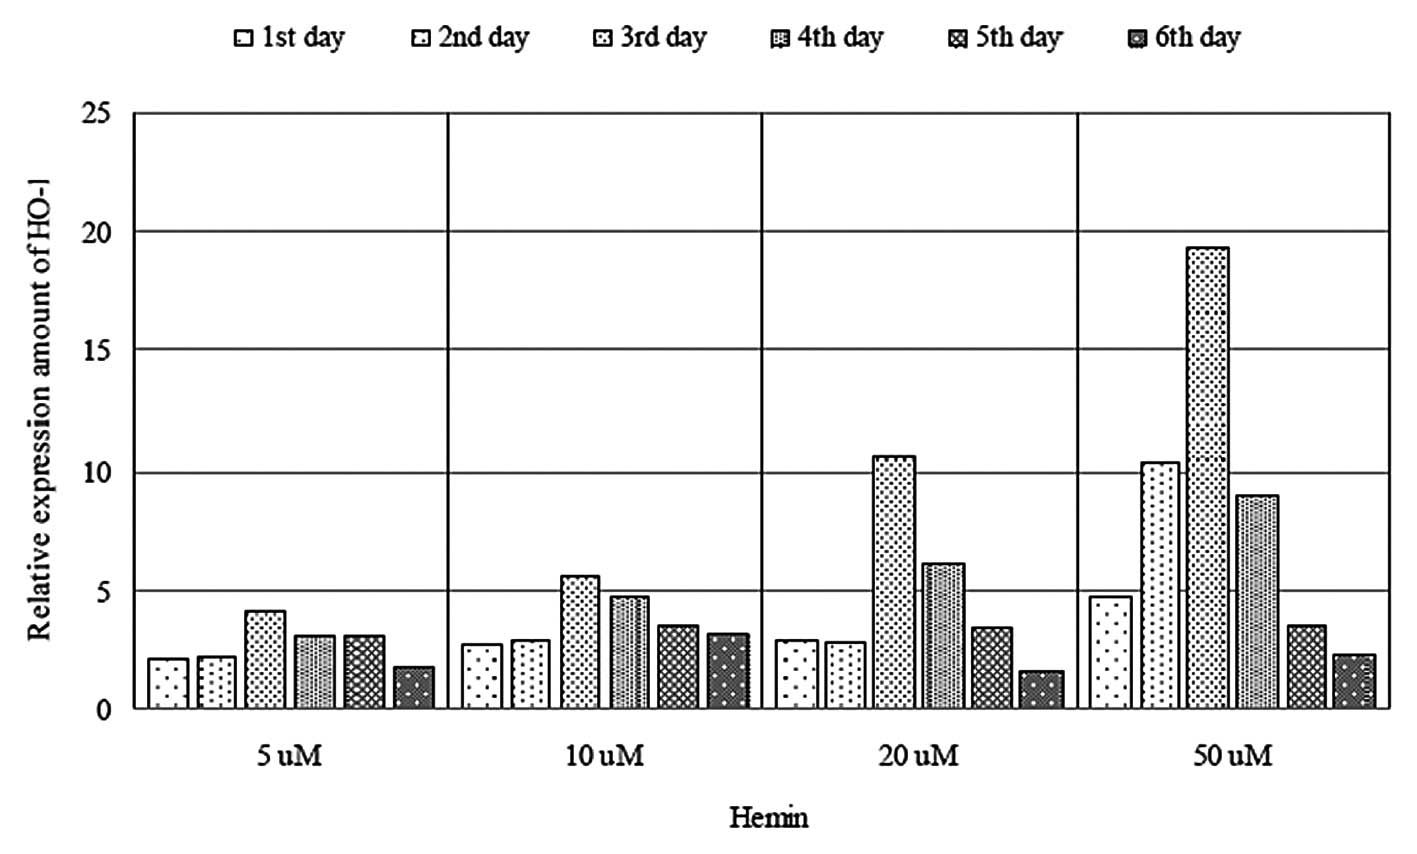
Hemin induces the expression of HO-1
The mRNA expression levels of hemin-induced HO-1
were determined in the HepG2.2.15 cells by qPCR (Fig. 1). Treatment with hemin at 5–50
μM significantly increased the expression levels of HO-1 in
a dose-dependent manner. Exposure of the cells to hemin for
different durations resulted in an elevation in the mRNA expression
levels of HO-1 (Fig. 2).
Furthermore, the mRNA expression of HO-1 peaked following exposure
to 5–50 μM hemin for three days, whereas the mRNA expression
levels began to decrease as the duration of exposure to hemin
increased further.
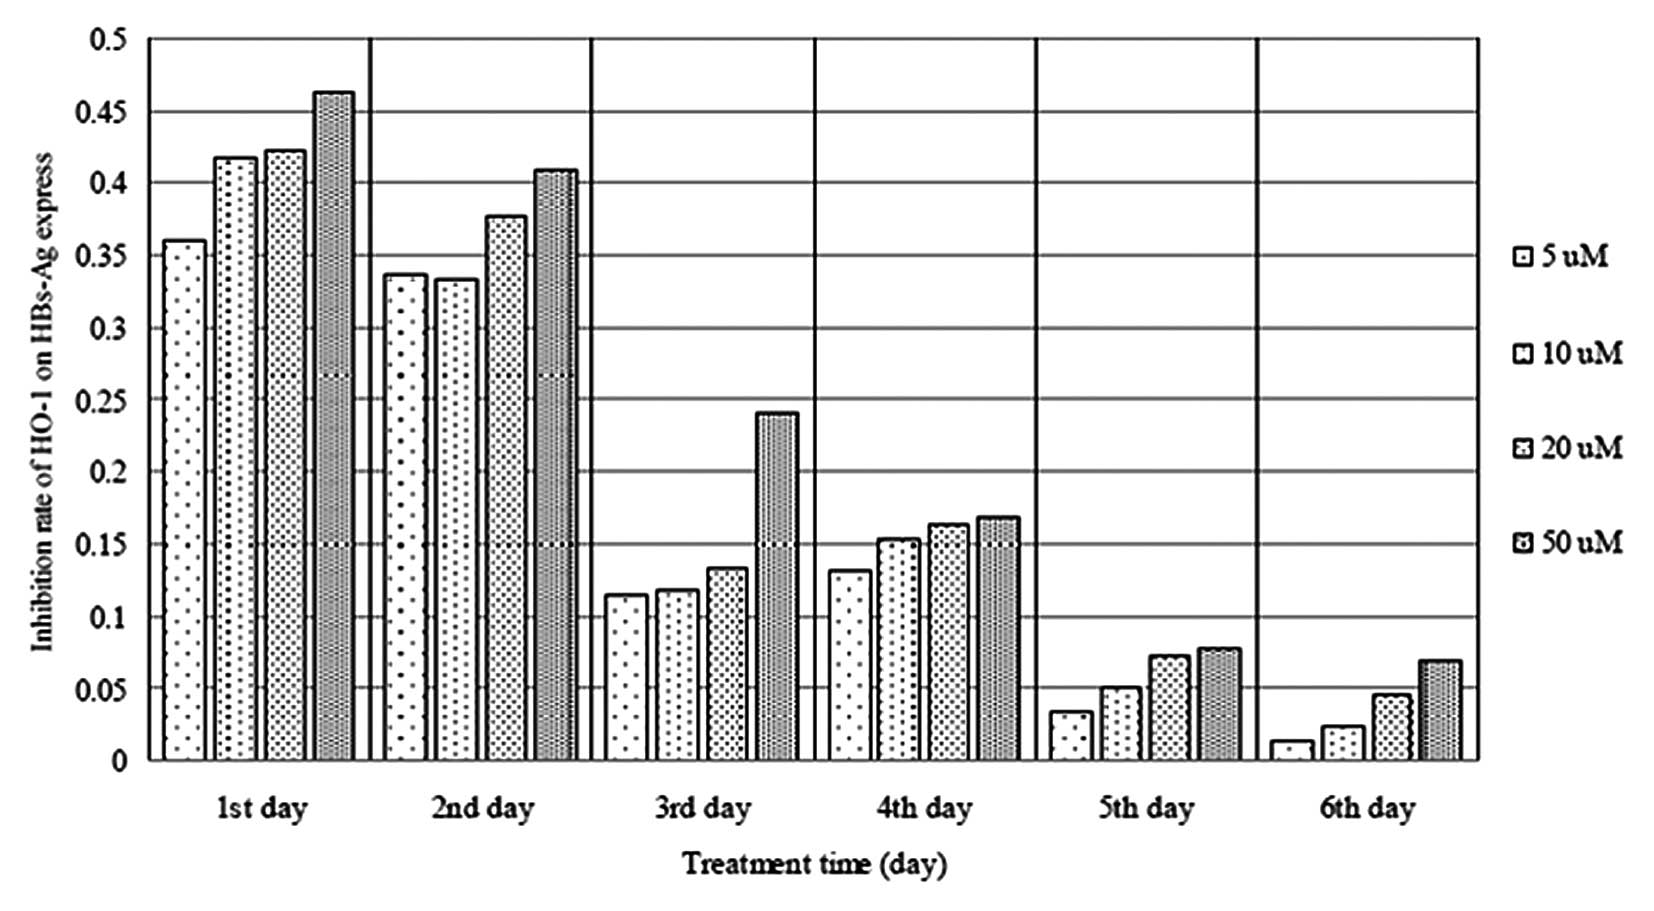
Effects of hemin on HBV replication
The levels of HBsAg and HBeAg were detected in the
HepG2.2.15 cell culture supernatants following incubation with
hemin (5–50 μM) for 1–6 days. The expression of HBsAg was
significantly inhibited in the HepG2.2.15 cells following exposure
to 5–50 μM hemin (Fig. 3).
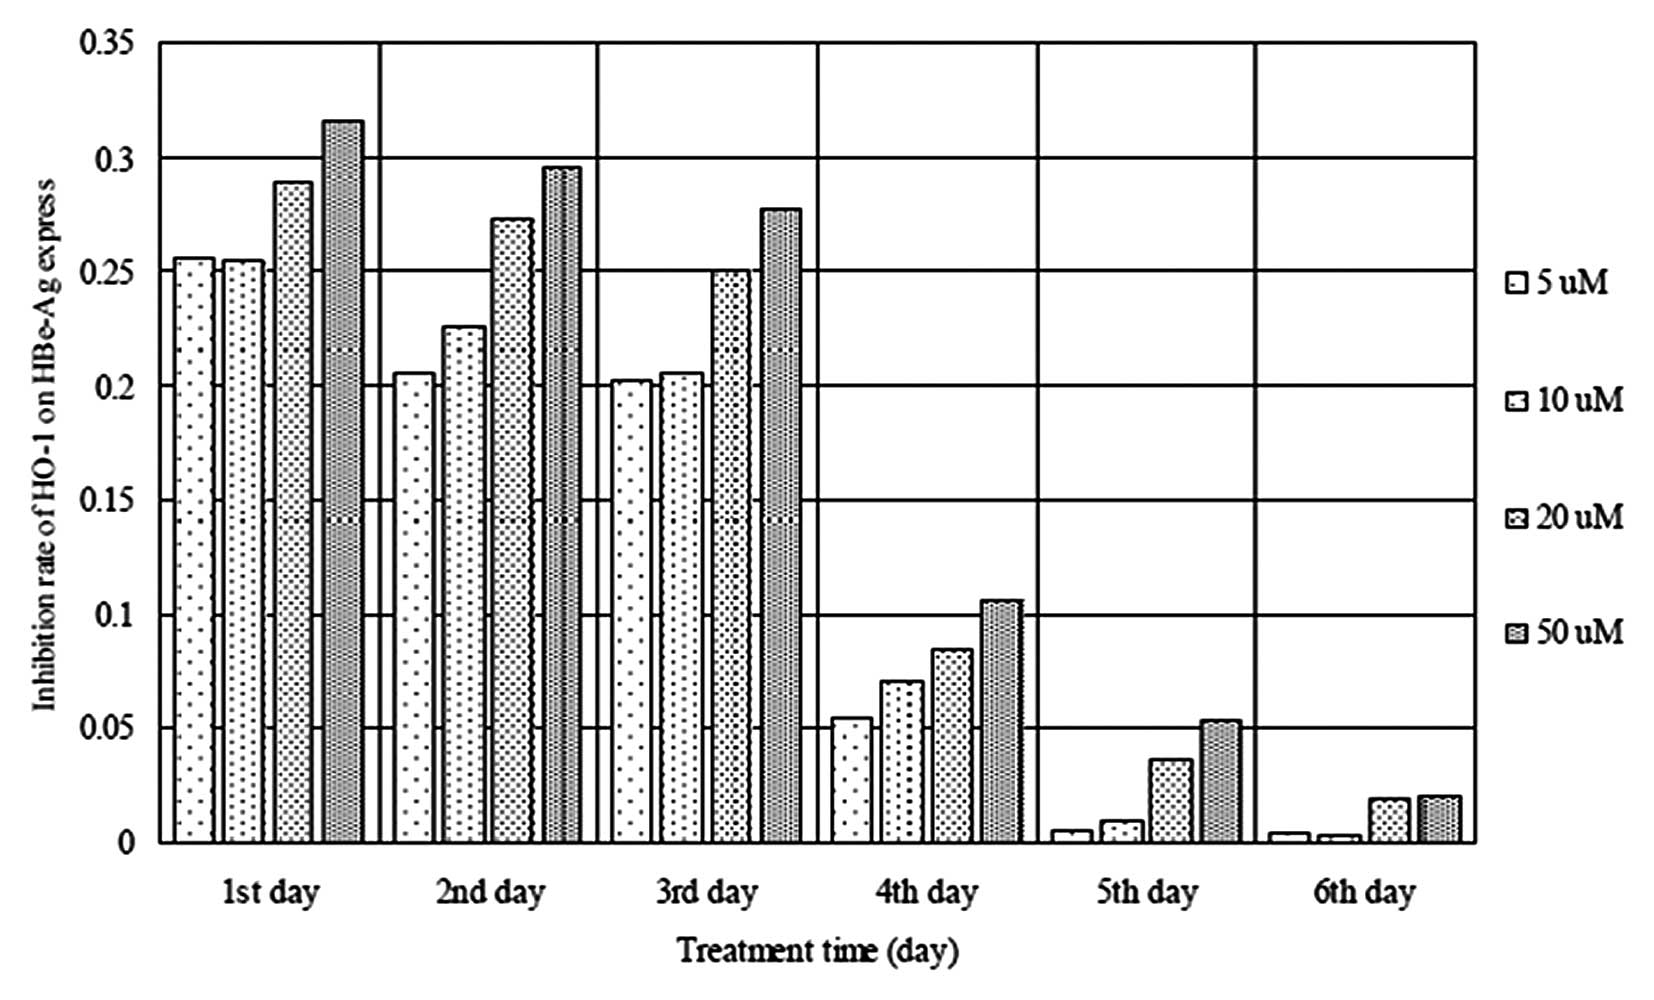
In addition, the expression of HBeAg was markedly reduced in the
cells following exposure to 5–50 μM hemin (Fig. 4). Furthermore, as the duration of
exposure to hemin, increased, the inhibitory trend was less marked.
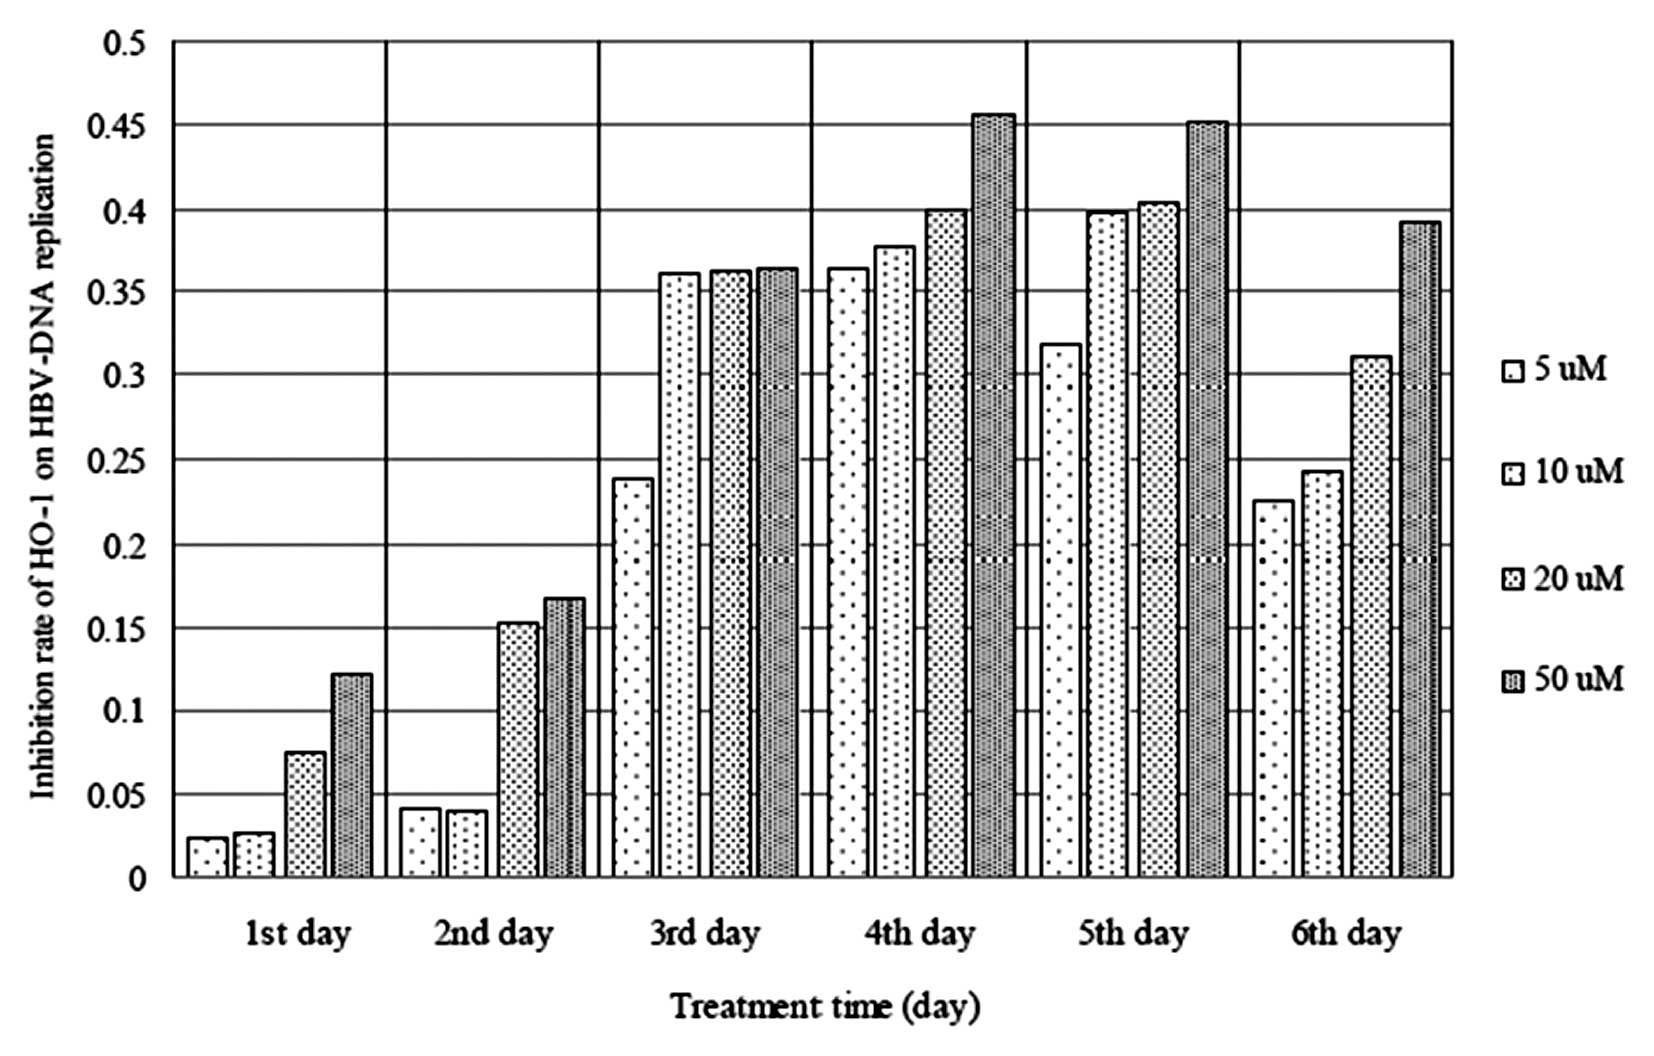
The DNA expression levels of HBV were determined in the culture
supernatants following treatment of the cells with hemin (5–50
μM) for 1–6 days. HBV DNA replication was markedly inhibited
following exposure to hemin, and this trend of inhibition became
more marked as the duration of exposure increased (Fig. 5).
Correlation between the expression of
HO-1 and HBV replication
To further analyze the dynamic association between
the induction of HO-1 and HBV replication, the expression of HO-1
was induced in HepG2.2.15 cells with hemin, at an optimal
concentration of 50 μM, for 1–6 days (Table II). The expression of HO-1
increased markedly following exposure of the cells to hemin for 1–6
days. The mRNA expression levels of HO-1 reached a peak in the
hepatoma cells on the third day and subsequently reduced as the
duration of exposure to hemin increased. Furthermore, the levels of
HBsAg and HBeAg in the culture supernatants were significantly
reduced following exposure to hemin for 1–6 days. The maximum
inhibition of HBsAg and HBeAg was 37.37 and 31.73% on the first
day, respectively; whereas inhibition of the expression levels of
HBsAg and HBeAg decreased with increasing duration of exposure to
hemin. By contrast, as the duration of hemin exposure increased,
the inhibition of HBV DNA replication increased. Furthermore, the
expression levels of HBV DNA were markedly reduced following
exposure to hemin for 3–6 days, and reached their lowest levels on
the fourth day.
| Table IIEffects of hemin-induced expression
of HO-1 on HBV replication in HepG2.2.15 cells. |
Table II
Effects of hemin-induced expression
of HO-1 on HBV replication in HepG2.2.15 cells.
| Group | Treatment duration
(days) | Relative HO-1
expression | HBsAg
| HBeAg
| logHBV-DNA
(copy/μl) |
|---|
| Absorbance | Inhibitory rate
(%) | Absorbance | Inhibitory rate
(%) |
|---|
| Vehicle | 1 | – | 0.669±0.033 | – | 0.562±0.038 | – | 4.842±0.045 |
| 2 | – | 0.791±0.030 | – | 0.684±0.064 | – | 4.843±0.016 |
| 3 | – | 1.071±0.034 | – | 1.003±0.056 | – | 4.822±0.035 |
| 4 | – | 1.524±0.043 | – | 1.890±0.108 | – | 4.722±0.022 |
| 5 | – | 2.174±0.028 | – | 2.020±0.063 | – | 4.772±0.008 |
| 6 | – | 2.367±0.110 | – | 2.272±0.075 | – | 4.878±0.035 |
| Hemin (50
μM) | 1 | 4.837±0.798 | 0.413±0.047b | 37.374 | 0.383±0.027b | 31.729 | 4.771±0.033 |
| 2 | 5.807±0.740 | 0.502±0.027c | 36.498 | 0.517±0.023a | 24.415 | 4.772±0.049 |
| 3 | 17.923±3.061 | 0.815±0.024c | 23.832 | 0.791±0.069a | 20.900 | 4.687±0.061a |
| 4 | 13.943±0.777 | 1.183±0.088b | 22.193 | 1.618±0.091a | 14.392 | 4.595±0.055a |
| 5 | 5.614±1.146 | 1.901±0.073b | 12.412 | 1.727±0.106a | 14.505 | 4.602±0.065a |
| 6 | 5.014±0.944 | 2.112±0.084a | 10.494 | 2.093±0.048a | 7.783 | 4.639±0.094a |
Discussion
The HO system includes the heme catabolic pathway,
which is comprised of HO and biliverdin reductase and the products
of heme degradation, carbon monoxide, iron and biliverdin/bilirubin
(11,12). As a protective enzyme, the
relevance of HO-1 in humans and animals has been demonstrated in
the case of HO-1 deficiency, which results in severe tissue damage
due to oxidative stress and in multiple consecutive disorders
(13–15). HO-1 and the reaction products of
heme degradation have been associated with cytoprotection, due to
their anti-inflammatory, antioxidative, and anti-apoptotic effects
(8,16). Furthermore, the induction of HO-1
or application of its products has been observed to lead to a broad
range of hepatoprotective effects in animal models of acute and
chronic hepatitis (7). The effects
of HO-1 include preventing and attenuating liver injury (17–22),
protecting from liver fibrosis (23), interrupting the progression of
nutritional steatohepatitis (24,25),
preserving hepatic architecture (26), improving liver function (26,27)
and providing protection against severe ischemia/reperfusion injury
(27–30). Therefore, HO-1 offers a promising
novel target in drug development, and the implementation of
clinical approaches to moderate and alleviate the numerous chronic
disorders affected by perturbations in the HO system (31).
It has been demonstrated that the induction or
overexpression of HO-1 interfered with the viral replication of
hepatitis B and C (8,32–35).
HO-1 induction results in a marked antiviral effect in the
adenoviral transfer of the HBV 1.3 genome into wild type mice and
HBV transgenic animal models of acute and chronic HBV infection,
respectively (8). Investigation
into the effects of HO-1 on HBV replication in hepatoma cells
stably transfected with HBV have revealed that induction of HO-1
directly suppressed HBV replication in hepatocytes at the
posttranscriptional level by reducing the stability of the HBV core
protein, inhibiting the refill of nuclear HBV cccDNA (8). Furthermore, it has been reported that
microRNA-122, which is abundantly expressed in the human liver,
interferes with the expression of HO-1, thereby promoting HBV
replication (32,36). Conversely, HO-1 is overexpressed in
various types of tumor, including hepatocellular carcinoma, and
inhibiting the expression or activity of HO-1 promotes the
apoptosis of cancer cells (37–39).
Although its anti-apoptotic property risks the promotion of tumor
growth (7), the induction of HO-1
may become a useful adjuvant for the clinical therapy of viral
hepatitis.
HepG2.2.15 cells were initially derived from the
HepG2 human hepatoblastoma cells, which were transfected with a
plasmid containing HBV DNA. These transfected cells can stably
secrete viral particles into culture medium (40). This in vitro system can be
used to investigate the life cycle of HBV, and the reaction of
immunocompetent cells to those containing HBV DNA (9). The present study investigated the
dynamic correlation between the expression of HO-1 and HBV
replication in HepG2.2.15 cells following exposure to various
concentrations of hemin for 1–6 days. The initial comparative
investigation of HO-1 expression levels following exposure to
different concentrations of hemin demonstrated that hemin (5–50
μM) significantly induced the expression of HO-1. The mRNA
expression levels of HO-1 increased in a dose-dependent manner and
reached a peak following exposure to hemin for 3 days. However, the
expression levels of HO-1 decreased with further extension of the
duration of exposure to hemin, possibly due to the functions of
HO-1 as a stress-responsive enzyme (41). The present study also investigated
the levels of HBsAg and HBeAg following exposure to various
concentrations of hemin. The results demonstrated that the
expression levels of HBsAg and HBeAg were markedly inhibited
following exposure to hemin for 1–6 days. Measurement of expression
of HBV DNA following exposure to various concentrations of hemin
demonstrated that HBV DNA replication was significantly inhibited
in a time-dependent manner. These data suggested that the secretion
of HBsAg/HBeAg and HBV DNA replication were inhibited with
increasing expression levels of HO-1. Furthermore, as the duration
of hemin exposure increased the inhibition of HBV DNA replication
was more marked, implying that the reduction of HBV replication may
contribute to the induction of the HO-1 gene.
To further understand the correlation between the
induction of HO-1 and HBV replication, the gene expression of HO-1
was induced in HepG2.2.15 cells by hemin at the optimal
concentration of 50 μM for 1–6 days. The significant
elevation in the mRNA expression of HO-1 peaked on the fourth day,
and subsequently reduced with further extension of the duration of
exposure to hemin. Furthermore, the HBsAg and HBeAg levels in the
cell culture supernatants were significantly reduced following
exposure to hemin for 1–6 days. This marked reduction in the
expression of HBsAg and HBeAg peaked on the first day, and the
inhibition was weakened as the duration of exposure to hemin
increased. Conversely, the inhibition of HBV DNA replication
increased with increasing duration of exposure. Furthermore, DNA
expression levels of HBV were significantly decreased following
exposure to hemin for 3–6 days. The effects of hemin-induced HO-1
on HBsAg and HBeAg were different from those on HBV DNA. This may
be associated with a non-significant correlation between either
HBsAg or HBeAg levels, and HBV DNA levels (40,42).
The present study demonstrated that the marked upregulation in the
expression of HO-1 following treatment with hemin attenuated HBV
replication in the HepG2.2.15 cells, indicating that
pharmacologically inducing overexpression of HO-1 may provide
protection against HBV infection. Furthermore, the downregulation
of HBV replication in the cells may be associated with the reaction
products of heme degradation and the inhibition of HBV reverse
transcriptase (RT)-ε RNA interaction by hemin (7,43).
HBV-RT has numerous roles in the viral life cycle and is an
essential target for the development of anti-HBV chemotherapy;
hemin was found to block RT interactions with viral RNA packaging
signal/origin of replication ε, therefore suppressing the
protein-priming reaction (43).
Although the induction or overexpression of HO-1 may assist as an
adjuvant for clinical therapy, no specific HO-1 inducers are
currently available, despite attempts, including the use of miR-196
or antagomiR-122, direct silencing of the HO-1 transcriptional
repressor Bach-1 by siRNA and the use of HO-1 coupled to a protein
transduction domain (7). HO-1 and
its products possess a significant curative potential that may
assist in the treatment of patients with hepatitis.
In conclusion, the present study clarified the
dynamic correlation between the hemin-induced expression of HO-1
and HBV replication in HepG2.2.15 cells. The upregulation of HO-1
interfered with HBV replication in a dose- and time-dependent
manner. The secretion of HBsAg and HBeAg, and HBV DNA replication
were inhibited with induction of the expression of HO-1, suggesting
that a reduction in the HBV viral load may be contributed to by
overexpression of HO-1.
Acknowledgments
The present study was supported by the Zhejiang
Provincial Natural Science Foundation of China (grant no.
Y14H310024), the Key Project of Chinese Ministry of Education
(grant no. 212073) and the Public Welfare Technology Applied
Research Project of Zhejiang Province-Experimental Animal Science
and Technology Project (grant no. 2013C37020). The authors are
grateful to Professor Hangping Yao (State Key Laboratory for
Diagnosis and Treatment of Infectious Diseases at Zhejiang
University) for kindly providing the HepG2.2.15 cells.
References
|
1
|
Hollinger FB and Liang TJ: Hepatitis B
virus. Fields Virology. Knipe DM and Howley PM: Lippincott Williams
& Wilkins; Philadelphia: pp. 2971–3036. 2001
|
|
2
|
Wu YH, Hao BJ, Cao HC, Xu W, Li YJ and Li
LJ: Anti-hepatitis B virus effect and possible mechanism of action
of 3,4-o-dicaffeoylquinic acid in vitro and in vivo. Evid Based
Complement Alternat Med. 2012:3568062012. View Article : Google Scholar : PubMed/NCBI
|
|
3
|
Delaney WE IV, Locarnini S and Shaw T:
Resistance of hepatitis B virus to antiviral drugs: current aspects
and directions for future investigation. Antivir Chem Chemother.
12:1–35. 2001. View Article : Google Scholar : PubMed/NCBI
|
|
4
|
Maines MD, Trakshel GM and Kutty RK:
Characterization of two constitutive forms of rat liver microsomal
heme oxygenase. Only one molecular species of the enzyme is
inducible. J Biol Chem. 261:411–419. 1986.PubMed/NCBI
|
|
5
|
Maines MD: Heme oxygenase: function,
multiplicity, regulatory mechanisms, and clinical applications.
FASEB J. 2:2557–2568. 1988.PubMed/NCBI
|
|
6
|
Otterbein LE and Choi AM: Heme oxygenase:
colors of defense against cellular stress. Am J Physiol Lung Cell
Mol Physiol. 279:L1029–L1037. 2000.PubMed/NCBI
|
|
7
|
Sass G, Barikbin R and Tiegs G: The
multiple functions of heme oxygenase-1 in the liver. Z
Gastroenterol. 50:34–40. 2012. View Article : Google Scholar : PubMed/NCBI
|
|
8
|
Protzer U, Seyfried S, Quasdorff M, et al:
Antiviral activity and hepatoprotection by heme oxygenase-1 in
hepatitis B virus infection. Gastroenterology. 133:1156–1165. 2007.
View Article : Google Scholar : PubMed/NCBI
|
|
9
|
Sells MA, Chen ML and Acs G: Production of
hepatitis B virus particles in Hep G2 cells transfected with cloned
hepatitis B virus DNA. Proc Natl Acad Sci USA. 84:1005–1009. 1987.
View Article : Google Scholar : PubMed/NCBI
|
|
10
|
Livak KJ and Schmittgen TD: Analysis of
relative gene expression data using real-time quantitative PCR and
the 2(−delta delta C(T)) method. Methods. 25:402–408. 2001.
View Article : Google Scholar
|
|
11
|
Tenhunen R, Marver HS and Schmid R: The
enzymatic conversion of heme to bilirubin by microsomal heme
oxygenase. Proc Natl Acad Sci USA. 61:748–755. 1968. View Article : Google Scholar : PubMed/NCBI
|
|
12
|
Tenhunen R, Marver H, Pimstone NR, Trager
WF, Cooper DY and Schmid R: Enzymatic degradation of heme.
Oxygenative cleavage requiring cytochrome P-450. Biochemistry.
11:1716–1720. 1972. View Article : Google Scholar : PubMed/NCBI
|
|
13
|
Yachie A, Niida Y, Wada T, Igarashi N,
Kaneda H, Toma T, Ohta K, Kasahara Y and Koizumi S: Oxidative
stress causes enhanced endothelial cell injury in human heme
oxygenase-1 deficiency. J Clin Invest. 103:129–135. 1999.
View Article : Google Scholar : PubMed/NCBI
|
|
14
|
Kawashima A, Oda Y, Yachie A, Koizumi S
and Nakanishi I: Heme oxygenase-1 deficiency: the first autopsy
case. Hum Pathol. 33:125–130. 2002. View Article : Google Scholar : PubMed/NCBI
|
|
15
|
Schulz S, Wong RJ, Jang KY, Kalish F,
Chisholm KM, Zhao H, Vreman HJ, Sylvester KG and Stevenson DK: Heme
oxygenase-1 deficiency promotes the development of necrotizing
enterocolitis-like intestinal injury in a newborn mouse model. Am J
Physiol Gastrointest Liver Physiol. 304:G991–G1001. 2013.
View Article : Google Scholar : PubMed/NCBI
|
|
16
|
Immenschuh S, Baumgart-Vogt E and Mueller
S: Heme oxygenase-1 and iron in liver inflammation: a complex
alliance. Curr Drug Targets. 11:1541–1550. 2010. View Article : Google Scholar : PubMed/NCBI
|
|
17
|
Zuckerbraun BS, Billiar TR, Otterbein SL,
Kim PK, Liu F, Choi AM, Bach FH and Otterbein LE: Carbon monoxide
protects against liver failure through nitric oxide-induced heme
oxygenase 1. J Exp Med. 198:1707–1716. 2003. View Article : Google Scholar : PubMed/NCBI
|
|
18
|
Sass G, Soares MC, Yamashita K, Seyfried
S, Zimmermann WH, Eschenhagen T, Kaczmarek E, Ritter T, Volk HD and
Tiegs G: Heme oxygenase-1 and its reaction product, carbon
monoxide, prevent inflammation-related apoptotic liver damage in
mice. Hepatology. 38:909–918. 2003. View Article : Google Scholar : PubMed/NCBI
|
|
19
|
Sass G, Seyfried S, Parreira Soares M,
Yamashita K, Kaczmarek E, Neuhuber WL and Tiegs G: Cooperative
effect of biliverdin and carbon monoxide on survival of mice in
immune-mediated liver injury. Hepatology. 40:1128–1135. 2004.
View Article : Google Scholar : PubMed/NCBI
|
|
20
|
Chang KY, Tsai PS, Huang TY, Wang TY, Yang
S and Huang CJ: HO-1 mediates the effects of HBO pretreatment
against sepsis. J Surg Res. 136:143–153. 2006. View Article : Google Scholar : PubMed/NCBI
|
|
21
|
Wen T, Guan L, Zhang YL and Zhao JY:
Dynamic changes of heme oxygenase-1 and carbon monoxide production
in acute liver injury induced by carbon tetrachloride in rats.
Toxicology. 228:51–57. 2006. View Article : Google Scholar : PubMed/NCBI
|
|
22
|
Wen T, Wu ZM, Liu Y, Tan YF, Ren F and Wu
H: Upregulation of heme oxygenase-1 with hemin prevents
D-galactosamine and lipopolysaccharide-induced acute hepatic injury
in rats. Toxicology. 237:184–193. 2007. View Article : Google Scholar : PubMed/NCBI
|
|
23
|
Barikbin R, Neureiter D, Wirth J, Erhardt
A, Schwinge D, Kluwe J, Schramm C, Tiegs G and Sass G: Induction of
heme oxygenase 1 prevents progression of liver fibrosis in Mdr2
knockout mice. Hepatology. 55:553–562. 2012. View Article : Google Scholar
|
|
24
|
Nan Y, Wang R, Zhao S, Han F, Wu WJ, Kong
L, Fu N, Kong L and Yu J: Heme oxygenase-1 prevents non-alcoholic
steatohepatitis through suppressing hepatocyte apoptosis in mice.
Lipids Health Dis. 9:1242010. View Article : Google Scholar : PubMed/NCBI
|
|
25
|
Yu J, Chu ES, Wang R, Wang S, Wu CW, Wong
VW, Chan HL, Farrell GC and Sung JJ: Heme oxygenase-1 protects
against steatohepatitis in both cultured hepatocytes and mice.
Gastroenterology. 138:694–704. 2010. View Article : Google Scholar
|
|
26
|
McCarter SD, Badhwar A, Scott JR, Akyea
TG, Bihari A, Dungey AA, Harris KA and Potter RF: Remote liver
injury is attenuated by adenovirus-mediated gene transfer of heme
oxygenase-1 during the systemic inflammatory response syndrome.
Microcirculation. 11:587–595. 2004. View Article : Google Scholar : PubMed/NCBI
|
|
27
|
Amersi F, Buelow R, Kato H, Ke B, Coito
AJ, Shen XD, Zhao D, Zaky J, Melinek J, Lassman CR, et al:
Upregulation of heme oxygenase-1 protects genetically fat Zucker
rat livers from ischemia/reperfusion injury. J Clin Invest.
104:1631–1639. 1999. View
Article : Google Scholar : PubMed/NCBI
|
|
28
|
Amersi F, Shen XD, Anselmo D, Melinek J,
Iyer S, Southard DJ, Katori M, Volk HD, Busuttil RW, et al: Ex vivo
exposure to carbon monoxide prevents hepatic ischemia/reperfusion
injury through p38 MAP kinase pathway. Hepatology. 35:815–823.
2002. View Article : Google Scholar : PubMed/NCBI
|
|
29
|
Kato H, Amersi F, Buelow R, Melinek J,
Coito AJ, Ke B, Busuttil RW and Kupiec-Weglinski JW: Heme
oxygenase-1 overexpression protects rat livers from
ischemia/reperfusion injury with extended cold preservation. Am J
Transplant. 1:121–128. 2001. View Article : Google Scholar
|
|
30
|
Kim SJ, Park JG and Lee SM: Protective
effect of heme oxygenase-1 induction against hepatic injury in
alcoholic steatotic liver exposed to cold ischemia/reperfusion.
Life Sci. 90:169–176. 2012. View Article : Google Scholar
|
|
31
|
Abraham NG and Kappas A: Pharmacological
and clinical aspects of heme oxygenase. Pharmacol Rev. 60:79–127.
2008. View Article : Google Scholar : PubMed/NCBI
|
|
32
|
Qiu L, Fan H, Jin W, Zhao B, Wang Y, Ju Y,
Chen L, Chen Y, Duan Z and Meng S: miR-122-induced down-regulation
of HO-1 negatively affects miR-122-mediated suppression of HBV.
Biochem Biophys Res Commun. 398:771–777. 2010. View Article : Google Scholar : PubMed/NCBI
|
|
33
|
Zhu Z, Wilson AT, Mathahs MM, Wen F, Brown
KE, Luxon BA and Schmidt WN: Heme oxygenase-1 suppresses hepatitis
C virus replication and increases resistance of hepatocytes to
oxidant injury. Hepatology. 48:1430–1439. 2008. View Article : Google Scholar : PubMed/NCBI
|
|
34
|
Lehmann E, El-Tantawy WH, Ocker M,
Bartenschlager R, Lohmann V, Hashemolhosseini S, Tiegs G and Sass
G: The heme oxygenase 1 product biliverdin interferes with HCV
replication by increasing antiviral interferon response.
Hepatology. 51:398–404. 2010. View Article : Google Scholar : PubMed/NCBI
|
|
35
|
Shan Y, Zheng J, Lambrecht RW and
Bonkovsky HL: Reciprocal effects of micro-RNA-122 on expression of
heme oxygenase-1 and hepatitis C virus genes in human hepatocytes.
Gastroenterology. 133:1166–1174. 2007. View Article : Google Scholar : PubMed/NCBI
|
|
36
|
Chang J, Nicolas E, Marks D, Sander C,
Lerro A, Buendia MA, Xu C, Mason WS, Moloshok T, Bort R, Zaret KS
and Taylor JM: miR-122, a mammalian liver-specific microRNA, is
processed from hcr mRNA and may downregulate the high affinity
cationic amino acid transporter CAT-1. RNA Biol. 1:106–113. 2004.
View Article : Google Scholar
|
|
37
|
Lee J, Lee SK, Lee BU, Lee HJ, Cho NP,
Yoon JH, Choi HR, Lee SK and Kim EC: Upregulation of heme
oxygenase-1 in oral epithelial dysplasias. Int J Oral Maxillofac
Surg. 37:287–292. 2008. View Article : Google Scholar : PubMed/NCBI
|
|
38
|
Nuhn P, Künzli BM, Hennig R, Mitkus T,
Ramanauskas T, Nobiling R, Meuer SC, Friess H and Berberat PO: Heme
oxygenase-1 and its metabolites affect pancreatic tumor growth in
vivo. Mol Cancer. 8:372009. View Article : Google Scholar : PubMed/NCBI
|
|
39
|
Sass G, Leukel P, Schmitz V, Raskopf E,
Ocker M, Neureiter D, Meissnitzer M, Tasika E, Tannapfel A and
Tiegs G: Inhibition of heme oxygenase 1 expression by small
interfering RNA decreases orthotopic tumor growth in livers of
mice. Int J Cancer. 123:1269–1277. 2008. View Article : Google Scholar : PubMed/NCBI
|
|
40
|
Sureau C, Romet-Lemonne JL, Mullins JI and
Essex M: Production of hepatitis B virus by a differentiated human
hepatoma cell line after transfection with cloned circular HBV DNA.
Cell. 47:37–47. 1986. View Article : Google Scholar : PubMed/NCBI
|
|
41
|
Elbirt KK and Bonkovsky HL: Heme
oxygenase: recent advances in understanding its regulation and
role. Proc Assoc Am Physicians. 111:438–447. 1999.PubMed/NCBI
|
|
42
|
Wiegand J, Wedemeyer H, Finger A, Heidrich
B, Rosenau J, Michel G, Bock CT, Manns MP and Tillmann HL: A
decline in hepatitis B virus surface antigen (hbsag) predicts
clearance, but does not correlate with quantitative hbeag or HBV
DNA levels. Antivir Ther. 13:547–554. 2008.PubMed/NCBI
|
|
43
|
Lin L and Hu J: Inhibition of hepadnavirus
reverse transcriptase-epsilon RNA interaction by porphyrin
compounds. J Virol. 82:2305–2312. 2008. View Article : Google Scholar :
|