Introduction
Nasopharyngeal carcinoma (NPC) is a type of
malignant carcinoma, which is distinct in terms of its
epidemiology, biological markers, clinical presentation,
carcinogenic risk factors and prognostic factors. NPC is endemic to
certain regions of the world, in particular in Southeast Asia,
where the yearly incidence rate is 20–40/100,000 people (1). Among head and neck cancers, NPC is a
type of squamous cell carcinoma, which may be highly invasive and
give rise to metastases. A classification based on tumor stage,
regional lymph node stage and presence or absence of metastasis
(TNM classification) is usually applied to malignant tumors in
order to evaluate the response to treatment and to predict
prognosis (2). With the
improvement of radiation techniques, the majority of patients with
NPC may be cured, when diagnosed and treated in the early stages of
the disease (3). However, in the
advanced stages of the disease, distant metastases usually result
in treatment failure (4).
Nevertheless, studies have shown that even patients with the same
stage of NPC exhibit marked variations in their response to similar
treatments, indicating that the current staging system remains
inadequate for making accurate predictions (5,6).
Therefore, novel NPC biomarkers may be useful for assessing the
prognosis of the disease and may facilitate the development of
personalized therapies for patients with NPC (7,8).
Ribonucleotide reductase (RR) is a enzyme involved
in the DNA synthesis pathway (9).
RR is responsible for the conversion of ribonucleoside diphosphate
to deoxyribo-nucleoside diphosphate, which is essential for DNA
synthesis and repair (10). Human
RR consists of two subunits, M1 and M2. RR enzymatic activity is
controlled by its M2 subunit (RRM2) (11). It has been reported that RRM2 is
physiologically associated with DNA synthesis and cell
proliferation. Changes in RRM2 expression and its potential
prognostic value have been demonstrated in a variety of human
malignancies, including bladder cancer (12), esophageal carcinoma (13), melanoma (14) and gastric carcinoma (15). Thus, RRM2 is hypothesized to be
involved in malignant progression (16). To date, however, little is known
regarding the expression of RRM2 and its prognostic value and
function in NPC.
Therefore, the present study aimed to investigate
RRM2 expression in NPC, in order to identify whether RRM2 may be a
prognostic biomarker for patients with NPC. The present study also
aimed to explore whether RRM2 may influence the biological behavior
of NPC cells in vitro.
Materials and methods
Tissue specimens
The first set of samples consisted of 60 NPC tissue
samples and 20 noncancerous nasopharyngeal epithelial tissue
samples. Cancerous and noncancerous samples were collected from Sun
Yat-sen University Cancer Center (SYSUCC) and Sun Yat-sen Memorial
hospital (Guangzhou, China), respectively, between January and
October 2011. These samples were used to investigate RRM2
expression using reverse transcription-quantitative polymerase
chain reaction (RT-qPCR). Samples were immediately immersed into an
RNAlater solution (AM7021, Ambion Life Technologies, Carlsbad, CA,
USA) and incubated overnight at 4°C, followed by incubation at
−80°C prior to RNA extraction. The second set of samples consisted
of 56 paraffin-embedded NPC tissue samples and four noncancerous
nasopharyngeal epithelial tissue samples, collected from Huizhou
Municipal Central Hospital (Huizhou, China), between January 2002
and March 2006. These samples were used to conduct an
immunohistochemistry (IHC) assay. The clinicopathological
characteristics of the 56 patients with NPC are summarized in
Table I. All patients had been
treated with standard curative radiotherapy, with (n=16) or without
(n=40) chemotherapy. The TNM stage for the 56 patients was defined
according to the International Union against Cancer (UICC) 2002
guidelines.
 | Table ICharacteristics of 56 patients with
NPC. |
Table I
Characteristics of 56 patients with
NPC.
| Characteristic | Cases |
|---|
| Age (years) |
| Median, range | 46, 20–78 |
| <46 | 22 (39.3%) |
| ≥46 | 34 (60.7%) |
| Follow-up period
(months) |
| Median, range | 51, 2–83 |
| Gender | |
| Male | 45 (80.3%) |
| Female | 11 (19.6%) |
| T stage |
| T1 | 7 (12.5%) |
| T2 | 18 (32.2%) |
| T3 | 21 (37.5%) |
| T4 | 10 (17.8%) |
| N stage |
| N0 | 8 (14.3%) |
| N1 | 18 (32.2%) |
| N2 | 23 (41.1%) |
| N3 | 7 (12.5%) |
| UICC stage |
| I | 3 (5.4%) |
| II | 13 (23.2%) |
| III | 24 (43.0%) |
| IV | 16 (28.6%) |
| WHO type |
| NKUC | 54 (96.4%) |
| NKDC | 2 (3.6%) |
| Metastasis |
| Yes | 10 (17.9%) |
| No | 46 (82.15%) |
| Survival |
| Yes | 29 (51.8%) |
| No | 27 (48.2%) |
| Chemotherapy |
| Yes | 16 (28.5%) |
| No | 40 (71.5%) |
Written informed patient consent and ethical
approval from the Sun Yat-sen Memorial hospital, SYSUCC and Huizhou
Municipal Central Hospital Institute Research Ethics Committee were
obtained in order to use these clinical materials for research
purposes.
The follow-up time was calculated from the first day
of treatment to either the day the patient was deceased or the day
of the last examination. Patients were examined at least every
three months during the first two years of treatment and
thereafter, every six months until the end-of-life or the end of
the study. The date of the last follow-up was March 2011. The
median follow-up time was 51 months (3–83 months). The time to the
primary end-points was assessed as overall survival (OS) and
distant metastasis-free survival (DMFS).
IHC assay
NPC tissue samples and noncancerous nasopharyngeal
epithelial tissue samples were resected from patients, fixed in
formalin and embedded in paraffin. Following this, the tissue
samples were cut into 4-μm sections and heated at 58°C for 3
h. The sections were dewaxed in xylene and rehydrated through
graded alcohol to distilled water. The sections were then immersed
in 3% hydrogen peroxide for 15 min at room temperature, in order to
block endogenous peroxidase activity. The sections were heated in
an antigen retrieval solution (citrate, pH 6.0; ZSGB-BIO, Beijing,
China) for 4 min in a pressure cooker at 150°C. Once the retrieval
solution had cooled to room temperature (for 2 h to reach
approximately 26°C), the sections were incubated either with
diluted mouse monoclonal anti-RRM2 antibody (1:200; NBP1-69832;
Novus Biologicals, Littleton, CO, USA) or with the negative control
(mouse immunoglobulin G; Abcam, Shanghai, China), overnight at 4°C.
The sections were then washed with phosphate-buffered saline
Tween-20 (PBST; ZSGB-BIO) three times and incubated with the goat
anti-mouse immunoglobulin-G-horseradish peroxidase secondary
antibodies (ADR-5307; ZSGV-BIO) for 30 min at 37°C. They were
washed with PBST three times, followed by 3, 3-diaminobenzidine
(DAB) staining for 2 min in order to visualize the target protein
(RRM2). Sections were then counter-stained with hematoxylin in
order to visualize the nucleus. They were then washed with running
water for 2 h and dehydrated at 37°C. Finally, the sections were
preserved in neutral balsam (ZSGB-BIO).
Measuring RRM2 expression using an IHC
assay
All sections were stained using DAB (ZSGB-BIO) for 5
min each. For each slide, five random fields of vision were
selected for scoring and the mean score for each slide was used for
the final analysis. Positive staining was scored as follows: 0,
negative or <10% positive cancer cells; 1, 10–25% positive
cancer cells; 2, 26–60% positive cancer cells; and 3, >60%
positive cancer cells. Staining intensity was categorized as
follows: 0, no staining; 1, weak staining (light yellow); 2,
moderate staining (yellow-brown); and 3, strong staining (brown).
The scoring was confirmed by at least two pathologists in a
double-blind model analysis. The RRM2 expression immunoreactivity
score (IRS) was calculated as follows: IRS = intensity score ×
positive staining score. An optimal cut-off value for high and low
RRM2 expression was based on a measurement of heterogeneity with a
log-rank test statistical analysis regarding the overall survival
(OS). IRS ≤5.0 indicated a low RRM2 expression and IRS >5.0
indicated a high RRM2 expression.
Cell lines and cell cultures
Two nasopharyngeal epithelial cell lines (NPECs)
were immortalized by transfection with B lymphoma Mo-MLV insertion
region 1 (Bmi1) homolog, which was synthesized by Shanghai
Invitrogen Shanghai Biotechnology Co., Ltd (Guangzhou, China), as
described previously (17,18) and cultured in a keratinocyte
serum-free medium (Invitrogen Life Technologies, Carlsbad, CA,
USA). The two immortalized NPEC cells lines were referred to as
NPEC1-Bmi1 and NPEC2-Bmi1. NPECs N01–N09 were derived from a
primary culture of fresh nasopharyngeal tissues. The following NPC
cell lines were cultured in an RPMI-1640 medium (Gibco-BRL Life
Technologies, Carlsbad, USA) with 10% fetal bovine serum (FBS;
Gibco-BRL Life Technologies): CNE1, CNE2, 6–10B, 5–8F, HONE1, SUNE1
and HNE1. NPECs and NPC cell lines were cultured at 37°C with 5%
CO2.
RNA extraction and RT-qPCR analysis
Total RNA from the NPECs and NPC cell lines, and
from human NPC tissue samples and noncancerous nasopharyngeal
epithelial tissue samples, was extracted using TRIzol reagent
(Invitrogen Life Technologies). RNA concentrations and quantities
were determined using a NanoDrop spectrophotometer (ND-1000, Thermo
Fisher Scientific, Rockford, IL, USA). Following reverse
transcription of the total RNA, the first-strand cDNA was used as a
template for measuring RRM2 expression. RT-qPCR and data collection
were conducted using a CFX96 real-time PCR detection system
(Bio-Rad, Hercules, CA, USA). The RT-qPCR detection was normalized
using an internal control (Glyceraldehyde-3-phosphate
dehydrogenase; Gapdh). The following primers were used: Forward:
5′-TTGGGATGAATTGCACTCTAA-3′, and reverse: 5′-CTGATACTCGCCTACTCT-3′
for RRM2, and forward: 5′-CTCCTCCTGTTCGACAGTCAGC-3′ and reverse:
5′-CCCAATACGACCAAATCCGTT-3′ for Gapdh. In order to ensure that the
results were reproducible, all experiments were repeated three
times.
Western blotting
Protein from NPEC1-Bmi1 and from the following NPC
cell lines: CNE1, CNE2, HONE1, HNE1, 6–10B, C666, SUNE1 and 5–8F,
was extracted according to the method described by Liao et
al (19). Western blot
analysis was performed according to the method described by Sun
et al (20). The proteins
of all cell lines were incubated overnight at 4°C with a primary
rabbit polyclonal antibody against human RRM2 (1:500 dilution;
NBP-69832; Novus Biologicals). In order to confirm equal loading of
the samples, the membranes were stripped and re-probed with a mouse
monoclonal antibody against human Gapdh (1:4,000 dilution;
sc-137179; Santa Cruz Biotechnology, Inc., Santa Cruz, CA, USA).
Three independent experiments were conducted for each assay.
Plasmids and transient transfection
The full-length human RRM2 was cloned into a
pcDNA3.1 vector (Shanghai Invitrogen Biotechnology Co., Ltd) using
the restriction enzymes Bam HI and Xho I (New England
Biolabs, Inc., Ipswich, MA, USA). HNE1 cells (3.0×10⁵)
were seeded in six-well culture plates. When the cells had reached
60% confluence, they were transfected with either a pcDNA3.1-vector
or a pcDNA3.1-RRM2 plasmid using Lipofectamine 2000®
(Invitrogen Life Technologies) in order to overexpress RRM2.
Following a 6 h incubation period at 37°C in 5% CO2, the
transfection medium was replaced with 2 ml fresh culture medium.
Following 36 h of transfection, the cells were collected for
western blotting, RT-qPCR, cell proliferation, colony formation,
invasion and migration assays.
Cell proliferation assay
A
3-(4,5-dimethylthiazol-2-yl)-2,5-diphenyltetrazoliumbromide (MTT)
assay was conducted in order to investigate cell proliferation.
HNE1-pcDNA3.1-vector (control cells) and HNE1-pcDNA3.1-RRM2 (cells
overexpressing RRM2) were incubated in 96-well plates at an equal
initial cell density of 1×10³. MTT was diluted to 5
mg/ml with phosphate-buffered saline, and the MTT solution (20
μl) was added to the supernatant in each well. The 96-well
plates were then incubated at 37°C for 4 h. Subsequently,
dimethylsulfoxide solution (200 μl; Sigma-Aldrich, St.
Louis, MO, USA) was added to the wells in order to melt the
sediment. The plates were then shaken for 10 min at 106 × g in
order to mix the solutions. At 24 h intervals, the optical density
(OD) value was detected with a microplate reader (Molecular
Devices, Sunnyvale, CA, USA). Three independent experiments were
conducted for each assay.
Colony form ation assay
Three sets of 20 0 HNE1-pcDNA3.1-vector (control
cells) and three sets of 200 HNE1-pcDNA3.1-RRM2 (cells
overexpressing RRM2) were plated at 200 cells per well in six-well
plates and cultured and incubated for 10 days at 37°C. Once the
majority of the colonies had grown to >50 cells, the cells were
washed and fixed in methanol for 15 min. Subsequently, the cells
were dyed with crystal violet (Sigma-Aldrich) for 15 min at room
temperature. Three independent experiments were conducted for each
assay.
Wound-healing assay
A wound-healing assay was conducted in order to
determine the rate of migration for the control cells and cells
overexpressing RRM2, according to the method described by Song
et al (18). Three
independent experiments were conducted for each assay.
Transwell assay
A transwell assay was conducted in order to
determine the invasive ability of control cells and cells
overexpressing RRM2, according to the method described by Song
et al (18). Briefly, the
upper chambers with an 8 mM porosity polycarbonate membrane (BD
Biosciences, Franklin Lakes, NJ, USA) were pre-coated with
Matrigel™ (BD Biosciences) and covered with 200 μl of medium
without FBS, which contained 1×10⁵ cells. The chambers
were then immersed in the lower wells, which contained 500
μl of medium with 10% FBS. Cells which traversed the filters
and adhered to the opposite side of the chamber membrane were
photographed and counted by light microscopy (IX71; Olympus Corp.,
Tokyo, Japan) after 24 h. Three independent experiments were
conducted for each assay.
Statistical analysis
SPSS 16.0 (SPSS, Inc., Chicago, IL, USA) was used
for statistical analyses. The correlation between RRM2 level and
clinicopathological features of the patients were analyzed using
either a χ2 test or Fischer’s exact test. Differences
among variables were assessed using 2-tailed Student’s t-test.
Survival curves were plotted using Kaplan-Meier survival analysis
and compared using a log-rank test. Univariate and multivariate
regression analyses were performed using the Cox proportional
hazards regression model to determine the effect of particular
prognostic factors on OS. In all cases P<0.05 was considered to
indicate a statistically significant difference.
Results
Expression of RRM2 in cell lines and
tissue samples
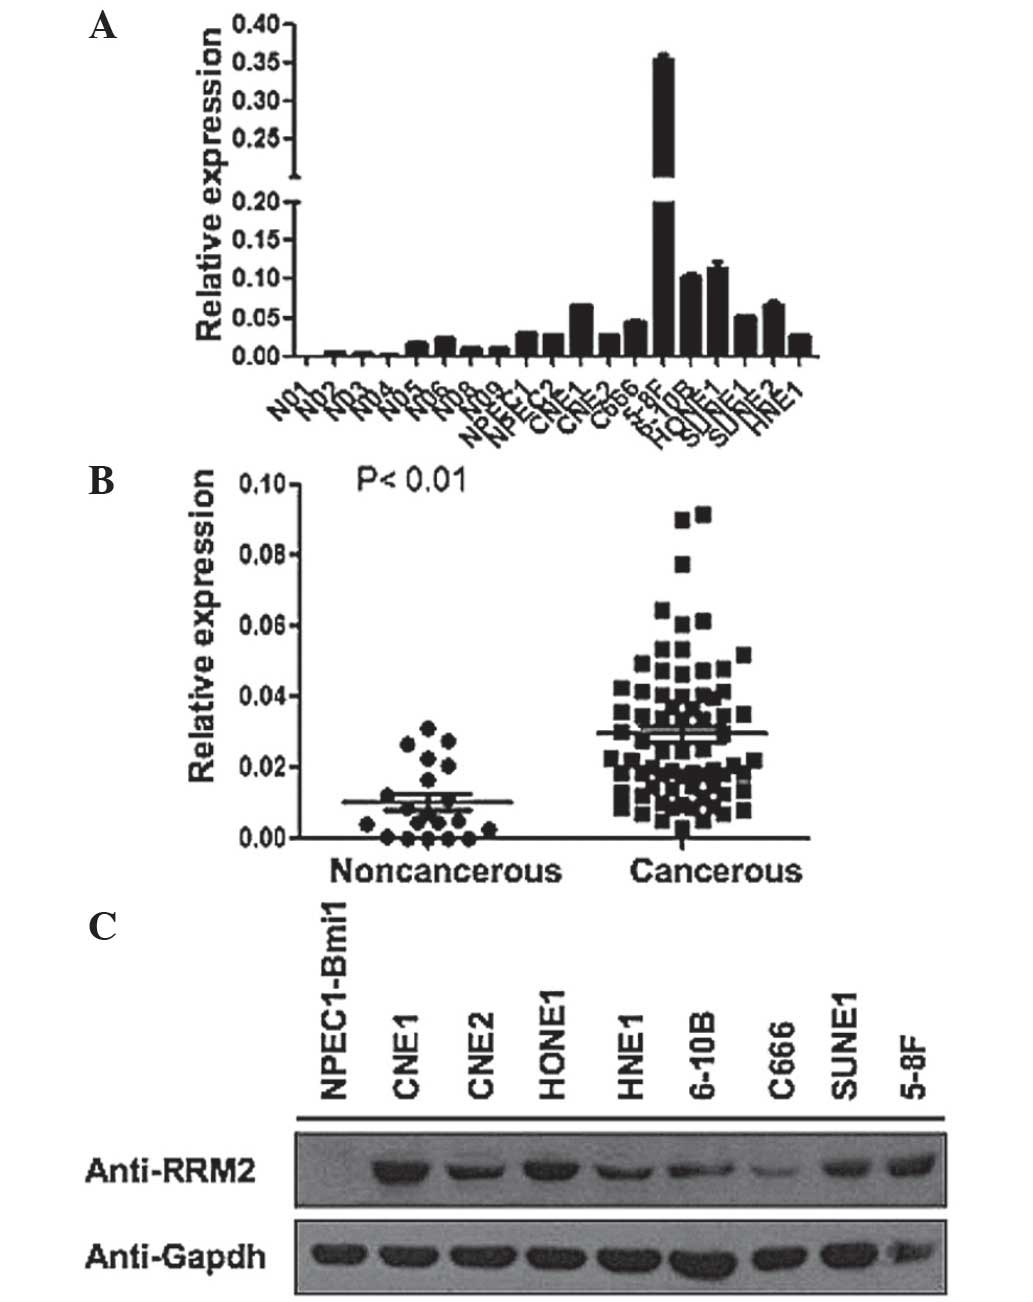
In order to measure RRM2 expression, RT-qPCR was
conducted for the following NPECs: NPEC1-Bmi1 and NPEC2-Bmi1, and
for the following NPC cell lines: CNE1, CNE2, 6–10B, 5–8F, HONE1,
SUNE1 and HNE1. RRM2 mRNA expression level was higher in NPC cell
lines compared with the NPECs, in particular in the NPEC cell line,
5–8F (Fig. 1A). The RRM2 protein
expression of these cell lines were assessed using western
blotting. As NPEC1 and NPEC2 showed similar mRNA expression levels
of RRM2, RRM2 protein expression was only measured in the
NPEC1-Bmi1 cell line, where it was not found to be expressed.
However RRM2 protein expression was high in the majority of the NPC
cell lines (Fig. 1B). In order to
further examine whether there was high RRM2 expression in tissue
samples from patients with NPC compared with that in healthy tissue
samples, an RT-qPCR analysis was conducted for 60 NPC tissue
samples and 20 noncancerous nasopharyngeal epithelial samples. The
mean RRM2 expression level in NPC tissue samples was significantly
higher than in noncancerous nasopharyngeal epithelial tissue
samples (Fig. 1C). In conclusion,
RRM2 expression was upregulated in NPC cell lines and tissue
samples, compared with that in NPECs and noncancerous tissue
samples.
RRM2 expression is upregulated in NPC
tissue samples
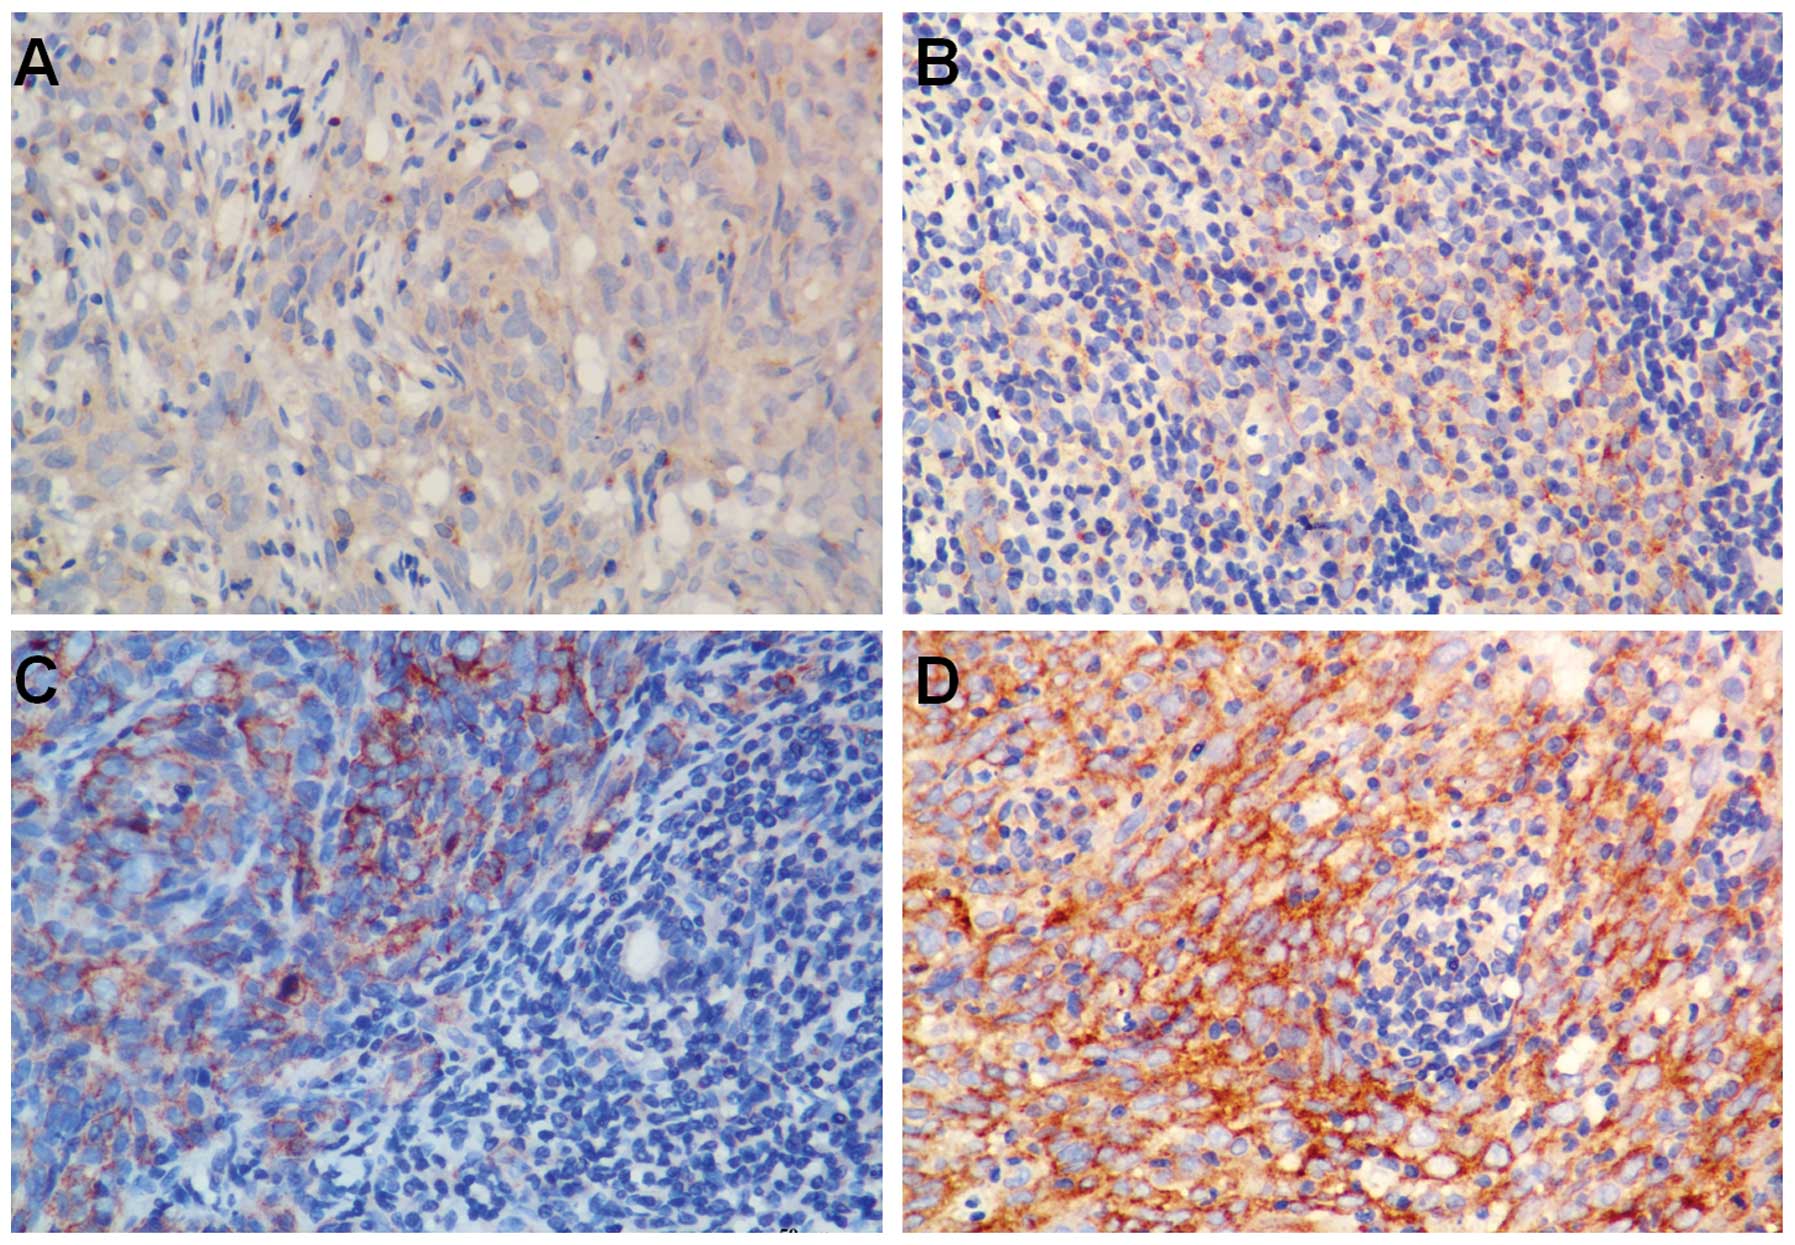
In order to examine the expression of the RRM2
protein in NPC tissue samples, an IHC analysis was conducted for 56
NPC specimens and four noncancerous nasopharyngeal epithelial
tissues, using a monoclonal antibody. No staining was observed in
the four noncancerous nasopharyngeal epithelial tissue samples
(Fig. 2A). Among the 56 NPC tissue
samples, four (7.1%) showed negative staining (Fig. 2A), 16 (28.6%) showed weak staining
(Fig. 2B), 20 (35.7%) showed
moderate staining (Fig. 2C), and
16 (28.6%) showed strong staining (Fig. 2D). Furthermore, RRM2 expression was
predominantly localized to the cytoplasm of NPC cells (Fig. 2).
Association of RRM2 expression with
clinicopathological characteristics
The association between RRM2 expression in NPC
tissue samples and the clinicopathological characteristics of
patients with NPC was analyzed. Samples were separated into two
groups with low or high RRM2 expression, according a cutoff score
of 5.0 (21). Tissue samples of
patients with NPC, which had a score of >5.0 were defined as
having high RRM2 expression, while a score ≤5.0 was defined as low
RRM2 expression. High RRM2 expression was observed in 32/56 (57.1%)
of NPC tissue samples. There were significant correlations between
RRM2 expression and T (tumor) stage (P=0.008), between RRM2
expression and N (nearby regional lymph node) stage (P=0.036), and
between RRM2 expression and UICC stage (P=0.002) in patients with
NPC. However, there was no significant correlation between RRM2
expression and other clinicopathological features, including
patient age, gender, metastasis and world health organization (WHO)
classification (P>0.05; Table
II).
| Table IICorrelation between RRM2 expression
and clinicopathologic characteristics in NPC patients. |
Table II
Correlation between RRM2 expression
and clinicopathologic characteristics in NPC patients.
| Characteristic | All cases
(n=56) | RRM2 expression
(n=56)
| P-value |
|---|
| Low (n=24;%) | High (n=32;%) |
|---|
| Age (years) | | | | 0.178 |
| <46 | 22 | 12 (50.0) | 10 (31.2) | |
| ≥46 | 34 | 12 (50.0) | 22 (68.8) | |
| Gender | | | | 0.113 |
| Male | 45 | 17 (70.8) | 28 (87.5) | |
| Female | 11 | 7
(29.2) | 4
(12.5) | |
| T stage | | | |
0.001a |
| T1–2 | 25 | 17 (70.8) | 8
(25.0) | |
| T3–4 | 31 | 7
(29.2) | 24 (75.0) | |
| N stage | | | |
0.034a |
| N0–1 | 26 | 15 (62.5) | 11 (34.4) | |
| N2–3 | 30 | 9
(37.5) | 21 (65.6) | |
| UICC stage | | | |
0.000a |
| I–II | 16 | 13 (54.2) | 3
(9.4) | |
| III–IV | 40 | 11 (45.8) | 29 (90.6) | |
| WHO type | | | | 0.678 |
| NKUC | 54 | 23 (95.8) | 31 (96.9) | |
| NKDC | 2 | 1
(4.2) | 1
(3.1) | |
| Metastasis | | | | 0.064 |
| Yes | 10 | 2
(8.3) | 7
(21.9) | |
| No | 46 | 22 (91.7) | 25 (78.1) | |
| Survival state | | | |
0.000a |
| Survival | 29 | 19 (79.2) | 10 (31.2) | |
| Mortality | 27 | 5
(20.8) | 22 (68.8) | |
Upregulation of RRM2 expression is
associated with poor prognosis
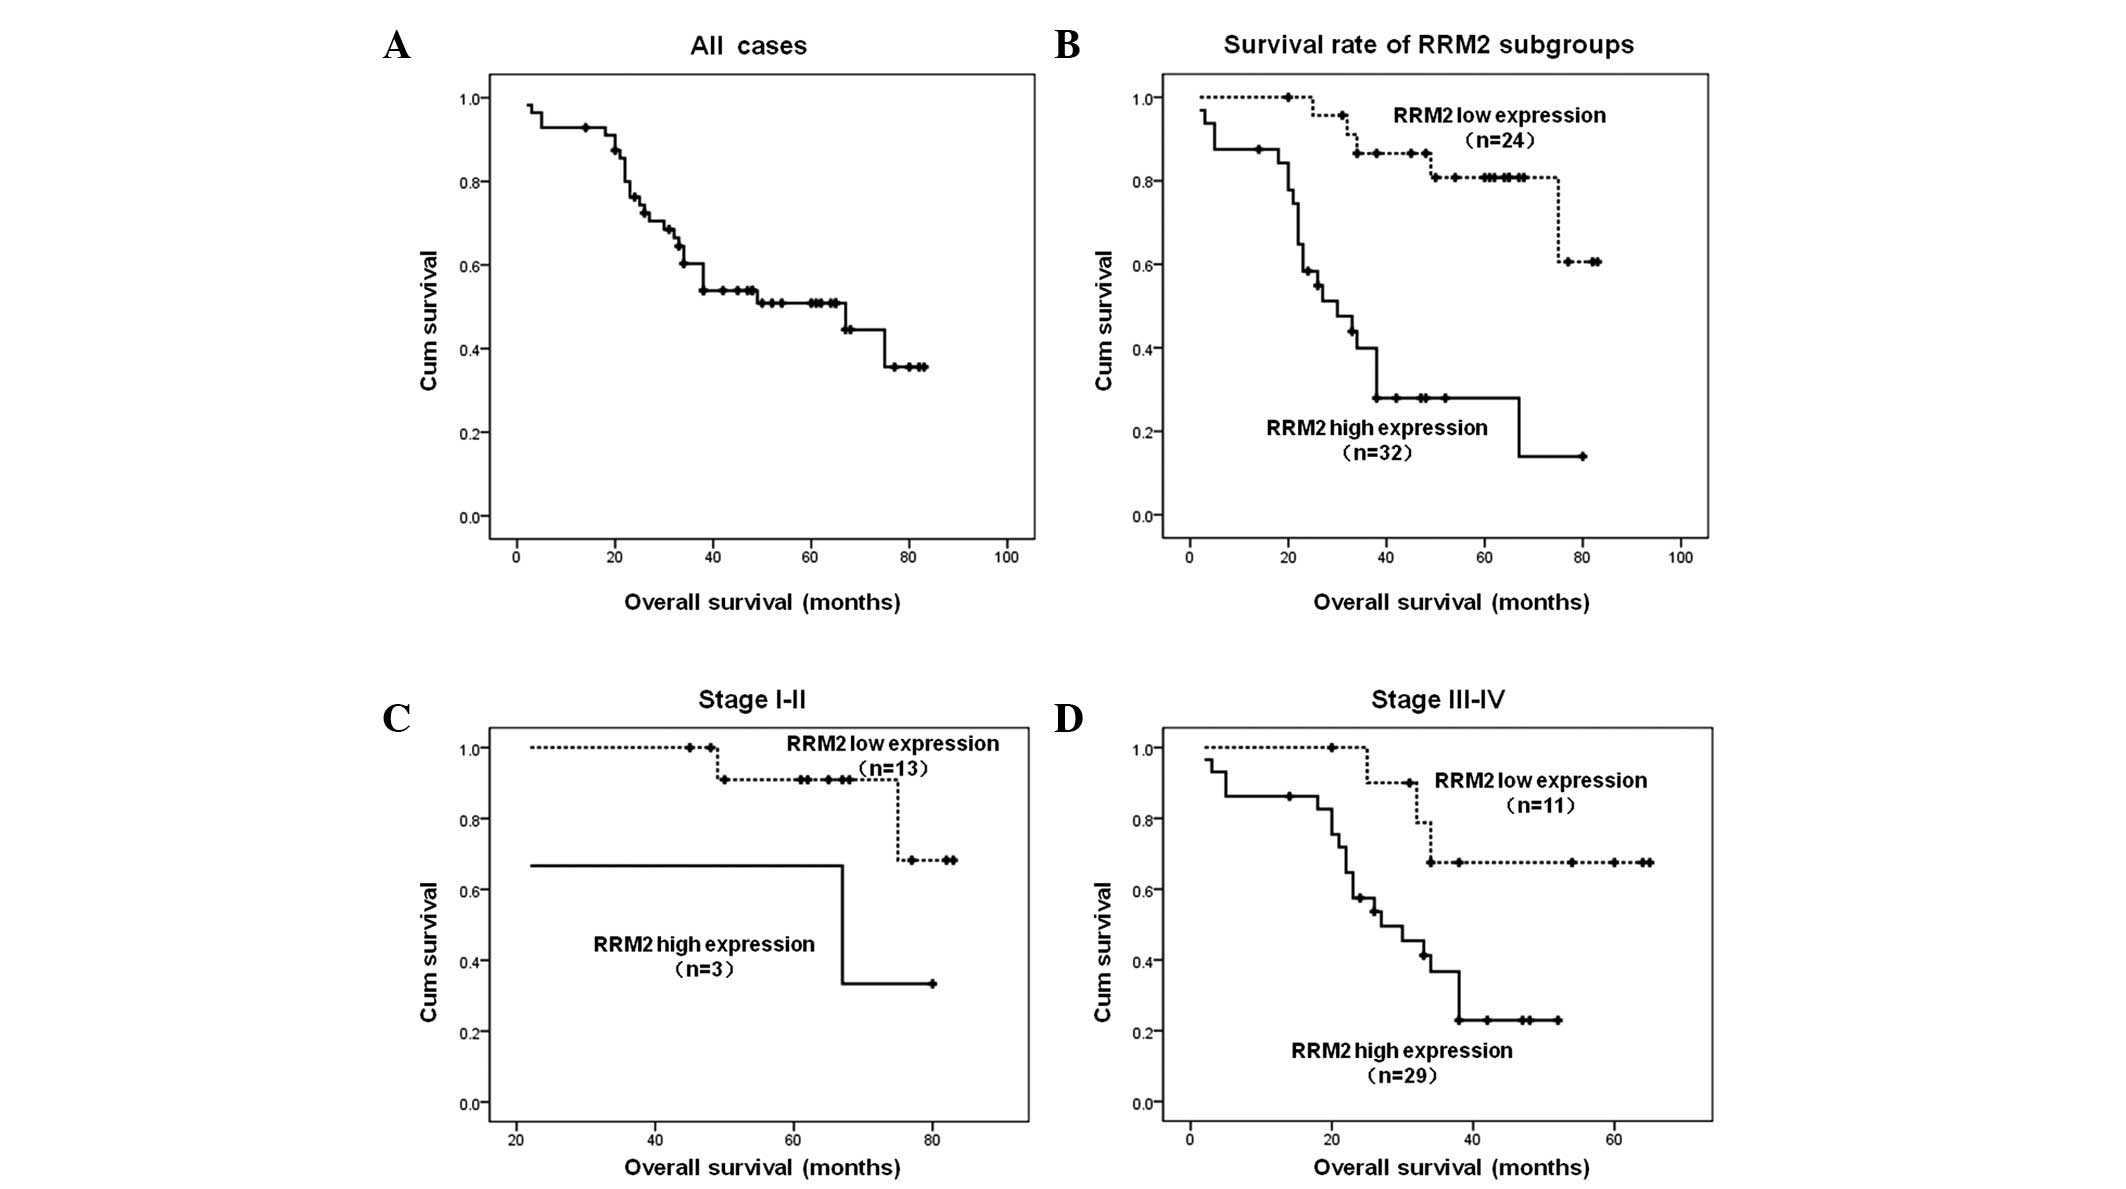
Of the 56 patients with NPC assessed, 51.8% had an
OS of five years (Fig. 3A). NPC
tissue samples from 24 (42.9%) patients exhibited low RRM2
expression levels while 32 (57.1%) exhibited high RRM2 expression
levels. The prognostic role of RRM2 was measured using Kaplan-Meier
analysis and a log-rank test analysis in order to estimate OS in
patients with NPC. The median follow-up time was 51 months. The
cumulative five-year survival was 37.3% [95% confidence interval
(CI), 28.074–46.521] in the high RRM2 expression group and 72.3%
(95% CI, 64.154–80.539) in the low RRM2 expression group
(P<0.01; Fig. 3B). Furthermore,
the patients were divided into two groups according to their UICC
stage: early (I–II) and advanced (III–IV). These groups exhibited a
five-year OS of 73.8% (95% CI: 65.257–82.330) and 38.6% (95% CI:
31.653–45.532) respectively. The results demonstrated that the
association between a high RRM2 expression and shorter OS was
significantly stronger in patients with advanced disease than in
those with disease at an early stages. For patients with the
disease at earlier stages, the five-year OS rate was 56.3% (95% CI:
28.212–84.455) for patients with high expression of RRM2 and 78.1%
(95% CI: 71.840–84.342) for patients with low expression of this
gene (P<0.05) (Fig. 3C). For
patients with an advanced stage of NPC, the five-year OS rate was
30.0% (95% CI, 24.169–35.836) for patients with high RRM2
expression levels and 53.8% (95% CI, 43.303–64.297) for patients
with low RRM2 expression levels (P<0.05) (Fig. 3D).
High RRM2 expression is an independent
prognostic factor
Univariate Cox regression analyses showed that the
following characteristics were significantly correlated with
five-year OS: RRM2 expression (P<0.001), age (P=0.001), T stage
(P<0.001), metastasis (P=0.009) and UICC stage (P=0.005)
(Table III). By contrast gender,
N stage, and WHO histological classification exhibited no
significant correlation with DMFS or OS (P>0.05). Multivariate
analyses were conducted in order to determine whether RRM2
expression level was an independent prognostic factor in DFS and
DMFS (Table III). As a result,
RRM2 appeared to be an independent and unfavorable factor (hazard
ratio [HR], 3.461; 95% CI, 1.204–9.949; P=0.021). In addition,
patient age (HR, 4.087; 95% CI, 1.233–13.545; P=0.026) and T stage
(HR, 11.214; 95% CI, 3.289–38.227; P<0.001), were defined as
independent prognostic predictors for five-year OS (Table III). These results indicated that
RRM2 is an independent prognostic factor for DMFS and OS in
patients with NPC.
| Table IIIUnivariate and multivariate Cox
regression analyses of prognostic variables in 56 patients with
NPC. |
Table III
Univariate and multivariate Cox
regression analyses of prognostic variables in 56 patients with
NPC.
| Variable | Subset | HR (95% CI) | P-value |
|---|
| Univariate
analysis |
| RRM2
expression | High vs Low | 6.424
(2.381–17.333) |
<0.001a |
| Age (years) | > 46 vs ≤
46 | 5.71
(1.793–16.608) |
0.001a |
| Gender | Female vs Male | 0.539
(0.162–1.794) | 0.314 |
| T staging | T1–2 vs T3–4 | 11.214
(3.289–38.227) |
<0.001a |
| N staging | N0–1 vs N2–3 | 0.125
(0.844–4.061) | 0.125 |
| Metastasis | Yes vs No | 3.216
(1.336–7.744) |
0.009a |
| UICC stage | I–II vs III–IV | 8.247
(1.913–35.555) |
0.005a |
| WHO histological
classification | NKDC vs NKUC | 2.147
(0.505–9.126) | 0.301 |
| Multivariate
analysis |
| T staging | T1–2 vs T3–4 | 11.214
(3.289–38.227) |
<0.001a |
| RRM2
expression | High vs Low | 3.461
(1.204–9.949) |
0.021a |
| Age (years) | > 46 vs ≤
46 | 4.087
(1.233–13.545) |
0.026a |
| UICC stage | I–II vs III–IV | 0. 623
(0.049–17.972) |
0.041a |
RRM2 accelerates the proliferation,
colony formation, migration and invasiveness of NPC cells
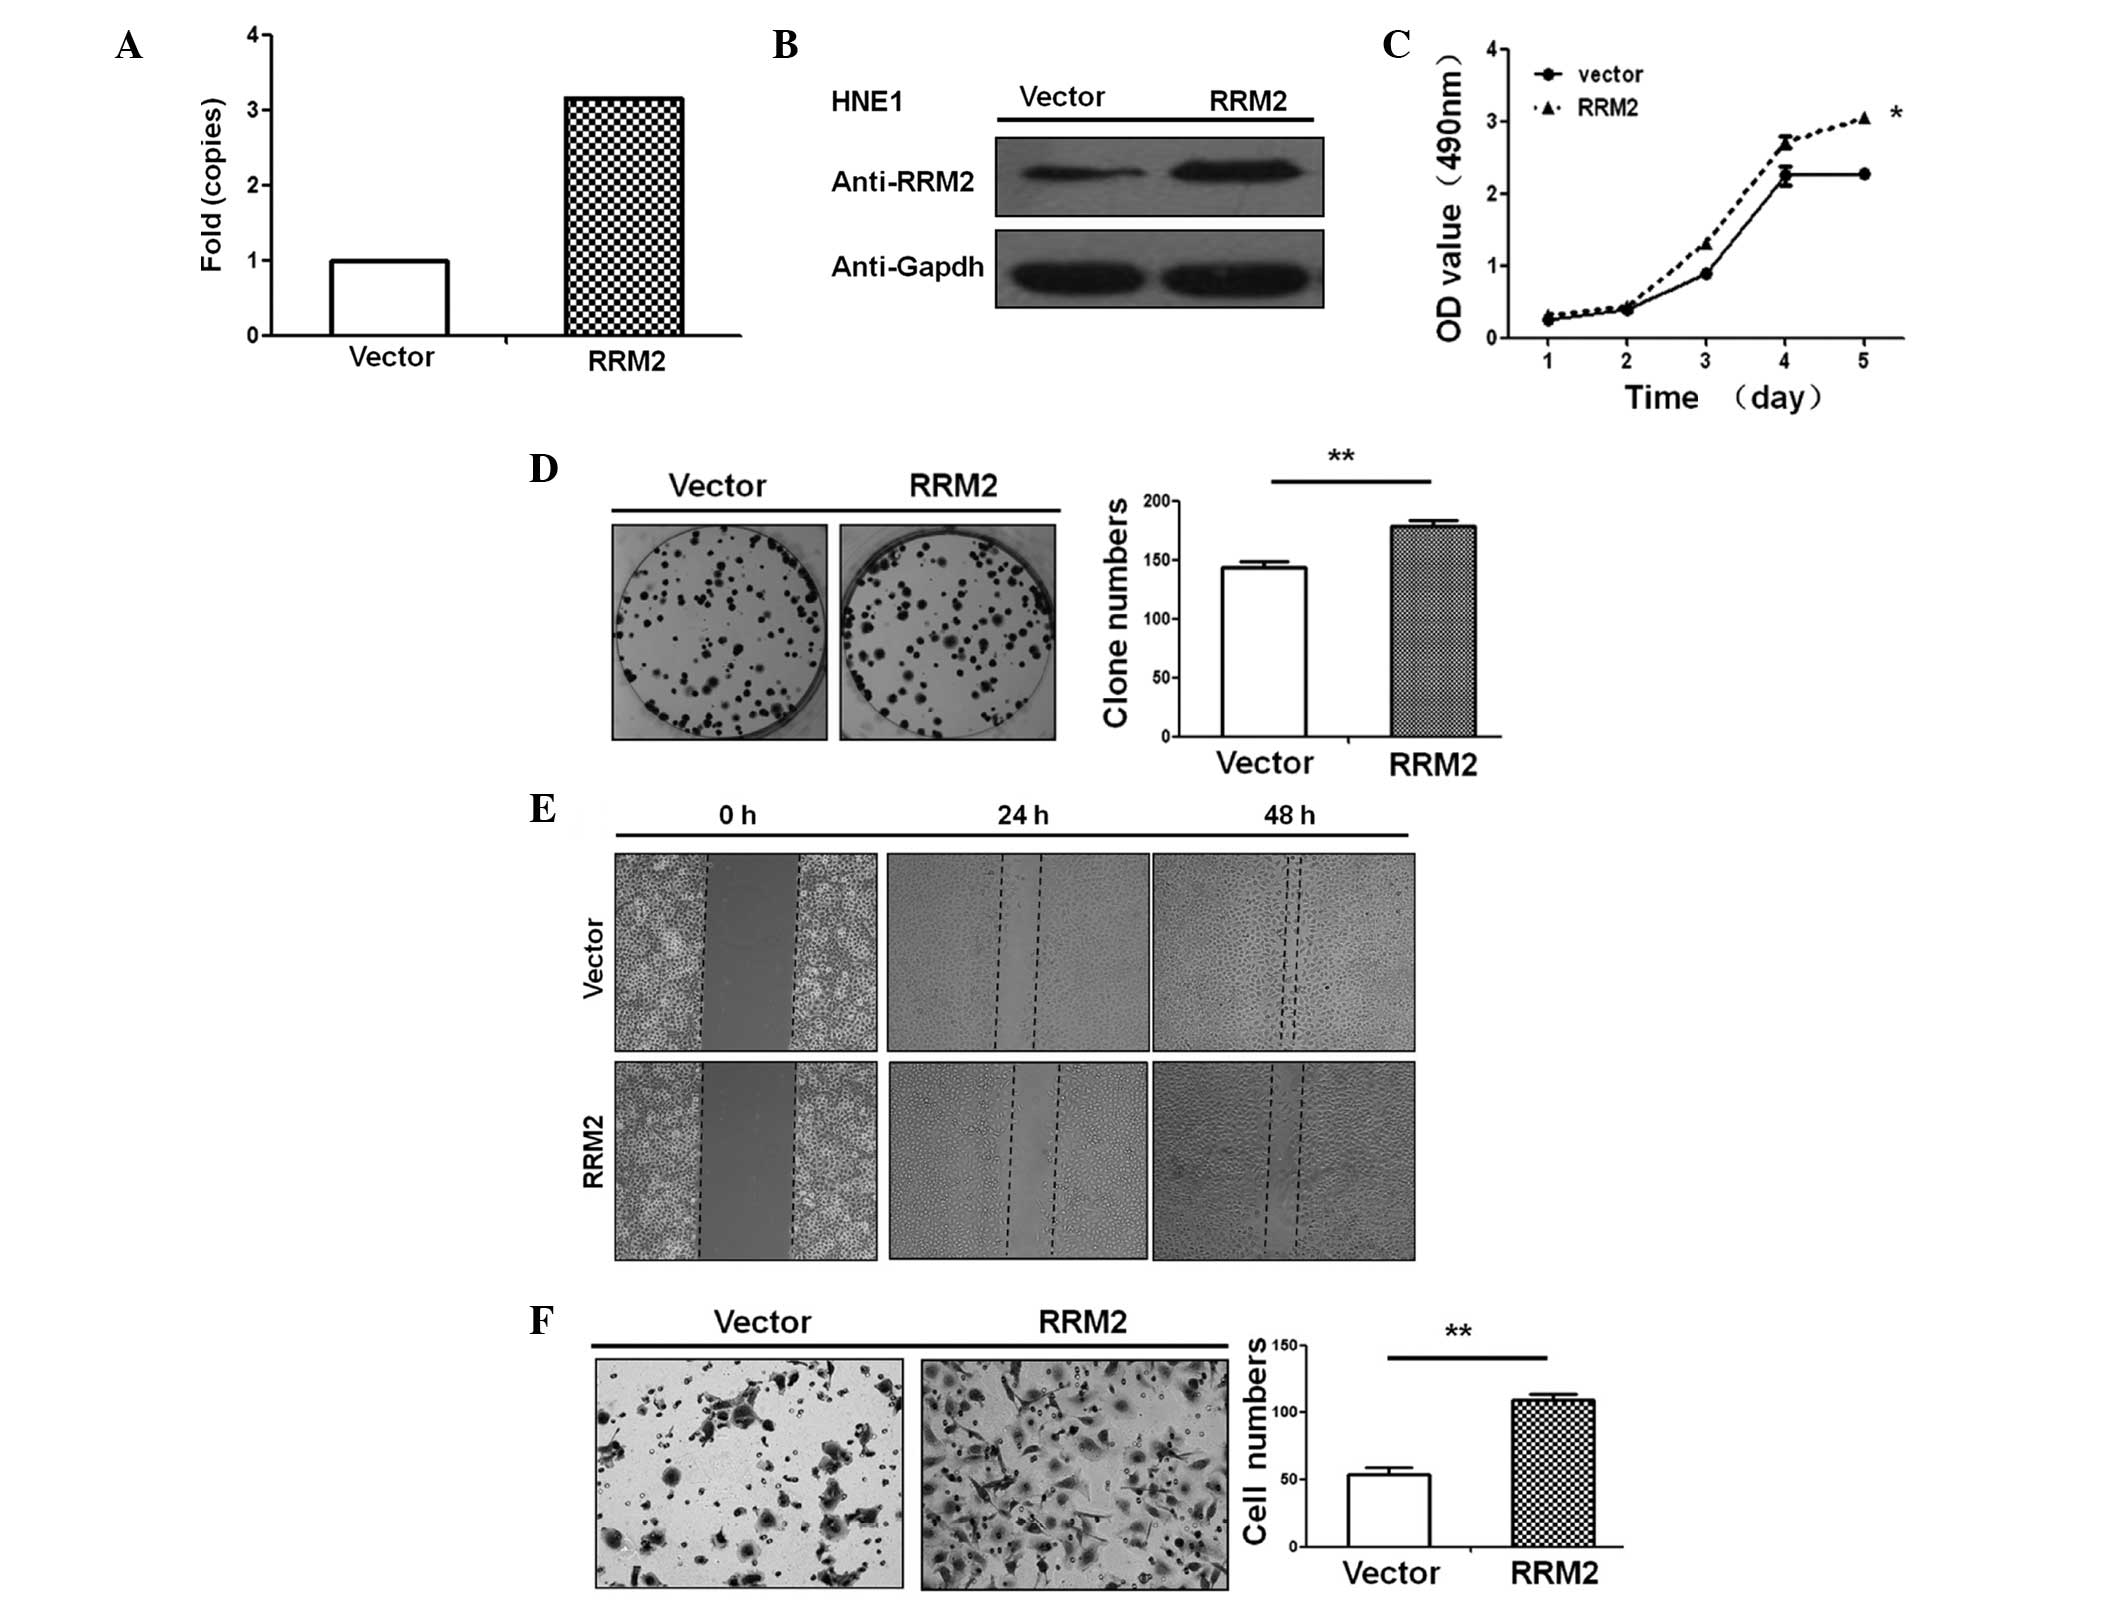
The NPC cell line, HNE1, exhibited endogenous RRM2
expression levels (Fig. 1A). This
cell line was therefore used to establish an RRM2 overexpressing
cell line. Following 36 h transfection, RRM2 mRNA and protein
expression levels were higher in cells overexpressing RRM2 compared
with control cells (Fig. 4A and
B).
In order to investigate the effect of RRM2
expression on the HNE1 cells, the following analyses were performed
for the RRM2 overexpressing cell line and the control cell line: An
MTT assay, a colony formation analysis, a wound healing assay and a
migration assay. RRM2 overexpressing cell lines grew significantly
faster than control cells (P<0.05; Fig. 4C), suggesting that RRM2
overexpression enhanced NPC cell proliferation. Cells
overexpressing RRM2 formed significantly more colonies than the
control cells (P<0.01; Fig.
4D). In addition, cells overexpressing RRM2 exhibited a more
rapid wound healing response (~48 h following serum starvation),
compared with that of the control cells (P<0.05, Fig. 4E). Cells overexpressing RRM2 also
exhibited a significantly faster cell invasion through the
matrigel-covered chamber transwell compared with the control cells
(P<0.01, Fig. 4F).
Discussion
NPC, an endemic cancer in southern China, invades
into the surrounding tissues and spreads to the regional lymph
nodes and distant organs. The majority of patients with NPC are
diagnosed when the tumor is at an advanced stage (22). The presence of distant metastases,
usually results in treatment failure (4). Radiotherapy and chemoradiotherapy may
improve OS for patients with NPC. However, the prognosis remains
poor in patients with advanced NPC (23–25).
For the majority of patients with NPC, the TNM staging system is
inadequate for providing an accurate prognosis (26,27),
and biomarkers may add prognostic value to the staging system.
Therefore, novel molecular biomarkers are required in order to
improve the accuracy of prognostication for patients with NPC.
Ribonucleotide reductase consists of two subunits:
M1 and M2. RRM1 functions as a metastasis-suppressor gene through
the induction of phosphatase and tensin homolog expression
(28,29). Ribonucleotide reductase enzymatic
activity is primarily modulated by its M2 subunit (RRM2). RRM2
exhibits a role in cell division, proliferation and differentiation
(30–32). Studies have shown that RRM2
influences the metastasis potential and drug-resistance of
malignant cancer cells (12,13,15,16).
Higher RRM2 expression has been observed in several types of cancer
cells, compared with that in noncancerous cells (12,13,15).
RRM2 expression has also been associated with tumor invasion,
metastasis and the OS of cancer patients in previous studies,
including, bladder and gastric cancer patients (12–16).
However, the pattern of RRM2 expression and its function in NPC
remain unknown.
To the best of our knowledge, the present study was
the first to demonstrate that NPC tissue samples and cell lines
exhibit higher RRM2 expression levels than those in noncancerous
tissue samples and cell lines (Fig.
1). RRM2 overexpression induced cell growth and increased the
colony formation ability of NPC cells in vitro (Fig. 4A and B), suggesting that RRM2 may
be involved in NPC progression. A high RRM2 expression level was
significantly correlated with the T stage, N stage and UICC stage
in patients with NPC. It was also associated with low OS, in
particular in patients with advanced stages of the disease. In
addition, multivariate Cox proportional hazard survival analyses
indicated that high RRM2 expression levels were an independent
prognostic factor in patients with NPC. Furthermore, patient age, T
stage and UICC stage were independent predictive factors for OS,
which is consistent with previous studies (12,15),
and suggests that RRM2 expression may serve as a novel prognostic
biomarker for NPC.
RRM2 overexpression led to an increase in cell
migration and in cell invasion ability compared with control cells
(Fig. 4C and D), suggesting that
RRM2 may contribute to NPC cell metastasis. Furthermore, a high
RRM2 expression level was associated with metastasis. However, the
correlation was not significant, which may have been due to the
limited sample size.
Although the clinical significance of RRM2 in a
number of cancers has been established, the mechanism underlying
the involvement of RRM2 in human cancers is complex (33–35).
RRM2 expression may be regulated by the upstream kirsten rat
sarcoma viral oncogene homolog and studies have shown that it may
enhance the proliferation ability of cancer cells (33). Recently, Zhang et al
(34) reported that RRM2
overexpression downregulates thrombospondin-1 expression in
oropharyngeal cancer cells and upregulates vascular endothelial
growth factor expression, which promotes the formation of tumor
blood vessels. Duxbury et al (35) found that RRM2 expression activates
the pancreatic cancer cell matrix metalloproteinases 9 via the
NF-κB signaling pathway, which enhances the invasive ability of
cancer cells. These studies therefore further support the
hypothesis that RRM2 affects the proliferation, invasion and
metastatic capabilities of malignant tumor cells.
In the present study, RRM2 overexpression led to an
increase in NPC cell proliferation, migration and invasion
capability, indicating that RRM2 may serve as a target for NPC
treatment. Furthermore, studies have shown that inhibiting RRM2
expression greatly reduces neoplastic transformation in vivo
(36) and increases the
sensitivity of pancreatic cancer cells to chemotherapy using
gemcitabine (37). Using small
interfering RNA to target RRM2 nanoparticles led to inhibition of
head and neck tumor cell growth in nude mice in vivo
(38).
In conclusion, the present study investigated the
role of RRM2 expression in NPC, and demonstrated a high level of
expression of RRM2 to be associated with metastasis and survival in
patients with NPC. RRM2 expression was an independent predictive
factor for DMFS and OS in patients with NPC. RRM2 overexpression
also promoted NPC cell growth, migration and invasion. These
results therefore suggest that RRM2 may be a potential biomarker
for controlling metastasis and for improving prognostication in
patients with NPC, and may provide a basis for the development of
potential gene therapy for this disease.
Acknowledgments
This study was supported by grants from the National
Natural Science Foundation of China (grant nos. 81272950 and
81025014) and Guangdong Natural Science Foundation (grant no.
S2012010009698).
References
|
1
|
Yu MC and Yuan JM: Epidemiology of
nasopharyngeal carcinoma. Semin Cancer Biol. 12:421–429. 2002.
View Article : Google Scholar : PubMed/NCBI
|
|
2
|
Edge S, Byrd DR, Compton CC, et al: AJCC
Cancer Staging Manual. 7th. Lippincott-Raven; Philidelphia, PA:
2009
|
|
3
|
Chua DT, Ma J, Sham JS, et al: Improvement
of survival after addition of induction chemotherapy to
radiotherapy in patients with early-stage nasopharyngeal carcinoma:
Subgroup analysis of two Phase III trials. Int J Radia Oncol Biol
Phys. 65:1300–1306. 2006. View Article : Google Scholar
|
|
4
|
Tao Q and Chan AT: Nasopharyngeal
carcinoma: molecular pathogenesis and therapeutic developments.
Exper Rev Mol Med. 9:1–24. 2007. View Article : Google Scholar
|
|
5
|
Tatsumi-Tamori A, Yoshizaki T, Miwa T and
Furukawa M: Clinical evaluation of staging system for
nasopharyngeal carcinoma: comparison of fourth and fifth editions
of UICC TNM classification. Ann Otol Rhinol Laryngol.
109:1125–1129. 2000. View Article : Google Scholar : PubMed/NCBI
|
|
6
|
Patel SG and Shah JP: TNM staging of
cancers of the head and neck: striving for uniformity among
diversity. CA Cancer J Clin. 55:242–258; quiz. 261–242. 2642005.
View Article : Google Scholar : PubMed/NCBI
|
|
7
|
Liang FY, Sun W, Han P, Lu X, Lian YN and
Huang XM: Detecting plasma Epstein-Barr virus DNA to diagnose
postradiation nasopharyngeal skull base lesions in nasopharyngeal
carcinoma patients: a prospective study. Chin J Cancer. 31:142–149.
2012. View Article : Google Scholar : PubMed/NCBI
|
|
8
|
Tang LQ, Chen QY, Fan W, et al:
Prospective study of tailoring whole-body dual-modality
[18F]fluorodeoxyglucose positron emission tomography/computed
tomography with plasma Epstein-Barr virus DNA for detecting distant
metastasis in endemic nasopharyngeal carcinoma at initial staging.
J Clin Oncol. 31:2861–2869. 2013. View Article : Google Scholar : PubMed/NCBI
|
|
9
|
Cory JG and Sato A: Regulation of
ribonucleotide reductase activity in mammalian cells. Mol Cell
Biochem. 53–54:257–266. 1983.
|
|
10
|
Thelander M, Gräslund A and Thelander L:
Subunit M2 of mammalian ribonucleotide reductase. Characterization
of a homogeneous protein isolated from M2-overproducing mouse
cells. J Bio Chem. 260:2737–2741. 1985.
|
|
11
|
Eriksson S and Martin DW Jr:
Ribonucleotide reductase in cultured mouse lymphoma cells. Cell
cycle-dependent variation in the activity of subunit protein M2. J
Biol Chem. 256:9436–9440. 1981.PubMed/NCBI
|
|
12
|
Morikawa T, Maeda D, Kume H, Homma Y and
Fukayama M: Ribonucleotide reductase M2 subunit is a novel
diagnostic marker and a potential therapeutic target in bladder
cancer. Histopathology. 57:885–892. 2010. View Article : Google Scholar : PubMed/NCBI
|
|
13
|
Kolesar J, Huang W, Eickhoff J, et al:
Evaluation of mRNA by Q-RTPCR and protein expression by AQUA of the
M2 subunit of ribonucleotide reductase (RRM2) in human tumors.
Cancer Chemother Pharmacol. 64:79–86. 2009. View Article : Google Scholar
|
|
14
|
Zuckerman JE, Hsueh T, Koya RC, Davis ME
and Ribas A: siRNA knockdown of ribonucleotide reductase inhibits
melanoma cell line proliferation alone or synergistically with
temozolomide. J Invest Dermatol. 131:453–460. 2011. View Article : Google Scholar
|
|
15
|
Morikawa T, Hino R, Uozaki H, et al:
Expression of ribonucleotide reductase M2 subunit in gastric cancer
and effects of RRM2 inhibition in vitro. Hum Pathol. 41:1742–1748.
2010. View Article : Google Scholar : PubMed/NCBI
|
|
16
|
Burton TR, Kashour T, Wright JA and Amara
FM: Cellular signaling pathways affect the function of
ribonucleotide reductase mRNA binding proteins: mRNA stabilization,
drug resistance, and malignancy (Review). Int J Oncol. 22:21–31.
2003.
|
|
17
|
Song LB, Zeng MS, Liao WT, et al: Bmi-1 is
a novel molecular marker of nasopharyngeal carcinoma progression
and immortalizes primary human nasopharyngeal epithelial cells.
Cancer Res. 66:6225–6232. 2006. View Article : Google Scholar : PubMed/NCBI
|
|
18
|
Song LB, Li J, Liao WT, et al: The
polycomb group protein Bmi-1 represses the tumor suppressor PTEN
and induces epithelial-mesenchymal transition in human
nasopharyngeal epithelial cells. J Clin Invest. 119:3626–3636.
2009. View
Article : Google Scholar : PubMed/NCBI
|
|
19
|
Liao WT, Song LB, Zhang HZ, et al:
Centromere protein H is a novel prognostic marker for
nasopharyngeal carcinoma progression and overall patient survival.
Clin Cancer Res. 13:508–514. 2007. View Article : Google Scholar : PubMed/NCBI
|
|
20
|
Sun W, Guo MM, Han P, et al: Id-1 and the
p65 subunit of NF-κB promote migration of nasopharyngeal carcinoma
cells and are correlated with poor prognosis. Carcinogenesis.
33:810–817. 2012. View Article : Google Scholar : PubMed/NCBI
|
|
21
|
Wang HY, Sun BY, Zhu ZH, et al:
Eight-signature classifier for prediction of nasopharyngeal
[corrected] carcinoma survival. J Clin Oncol. 29:4516–4525. 2011.
View Article : Google Scholar : PubMed/NCBI
|
|
22
|
Zhang YL, Li J, Mo HY, et al: Different
subsets of tumor infiltrating lymphocytes correlate with NPC
progression in different ways. Mol Cancer. 9:42010. View Article : Google Scholar : PubMed/NCBI
|
|
23
|
Guigay J, Temam S, Bourhis J, Pignon JP
and Armand JP: Nasopharyngeal carcinoma and therapeutic management:
the place of chemotherapy. Ann Oncol. 17(Suppl 10): x304–x307.
2006. View Article : Google Scholar : PubMed/NCBI
|
|
24
|
Ma BB and Chan AT: Recent perspectives in
the role of chemotherapy in the management of advanced
nasopharyngeal carcinoma. Cancer. 103:22–31. 2005. View Article : Google Scholar
|
|
25
|
Chen QY, Wen YF, Guo L, et al: Concurrent
chemoradiotherapy vs radiotherapy alone in stage II nasopharyngeal
carcinoma: phase III randomized trial. J Natl Cancer Inst.
103:1761–1770. 2011. View Article : Google Scholar : PubMed/NCBI
|
|
26
|
Au JS, Law CK, Foo W and Lau WH: In-depth
evaluation of the AJCC/UICC 1997 staging system of nasopharyngeal
carcinoma: prognostic homogeneity and proposed refinements. Int J
Radiat Oncol Biol Phys. 56:413–426. 2003. View Article : Google Scholar : PubMed/NCBI
|
|
27
|
Mao YP, Xie FY, Liu LZ, et al:
Re-evaluation of 6th edition of AJCC staging system for
nasopharyngeal carcinoma and proposed improvement based on magnetic
resonance imaging. Int J Radiat Oncol Biol Phys. 73:1326–1334.
2009. View Article : Google Scholar : PubMed/NCBI
|
|
28
|
Gautam A, Li ZR and Bepler G: RRM1-induced
metastasis suppression through PTEN-regulated pathways. Oncogene.
22:2135–2142. 2003. View Article : Google Scholar : PubMed/NCBI
|
|
29
|
Cao MY, Lee Y, Feng NP, et al:
Adenovirus-mediated ribonucleotide reductase R1 gene therapy of
human colon adenocarcinoma. Clin Cancer Res. 9:4553–4561.
2003.PubMed/NCBI
|
|
30
|
Liu X, Zhou B, Xue L, et al:
Metastasis-suppressing potential of ribonucleotide reductase small
subunit p53R2 in human cancer cells. Clin Cancer Res. 12:6337–6344.
2006. View Article : Google Scholar : PubMed/NCBI
|
|
31
|
Filatov D, Björklund S, Johansson E and
Thelander L: Induction of the mouse ribonucleotide reductase R1 and
R2 genes in response to DNA damage by UV light. J Biol Chem.
271:23698–23704. 1996. View Article : Google Scholar : PubMed/NCBI
|
|
32
|
Engström Y, Eriksson S, Jildevik I, Skog
S, Thelander L and Tribukait B: Cell cycle-dependent expression of
mammalian ribonucleotide reductase. Differential regulation of the
two subunits. J Biol Chem. 260:9114–9116. 1985.PubMed/NCBI
|
|
33
|
Yoshida Y, Tsunoda T, Doi K, et al:
KRAS-mediated upregulation of RRM2 expression is essential for the
proliferation of colorectal cancer cell lines. Anticancer Res.
31:2535–2539. 2011.PubMed/NCBI
|
|
34
|
Zhang K, Hu S, Wu J, et al: Overexpression
of RRM2 decreases thrombspondin-1 and increases VEGF production in
human cancer cells in vitro and in vivo: implication of RRM2 in
angiogenesis. Mol Cancer. 8:112009. View Article : Google Scholar : PubMed/NCBI
|
|
35
|
Duxbury MS and Whang EE: RRM2 i nduc es
NF-kappaB-dependent MMP-9 activation and enhances cellular
invasiveness. Biochem Biophys Res Commun. 354:190–196. 2007.
View Article : Google Scholar : PubMed/NCBI
|
|
36
|
Liu X, Zhou B, Xue L, et al:
Ribonucleotide reductase subunits M2 and p53R2 are potential
biomarkers for metastasis of colon cancer. Clin Colorectal Cancer.
6:374–381. 2007. View Article : Google Scholar : PubMed/NCBI
|
|
37
|
Duxbury MS, Ito H, Zinner MJ, Ashley SW
and Whang EE: RNA interference targeting the M2 subunit of
ribonucleotide reductase enhances pancreatic adenocarcinoma
chemosensitivity to gemcitabine. Oncogene. 23:1539–1548. 2004.
View Article : Google Scholar
|
|
38
|
Rahman MA, Amin AR, Wang X, et al:
Systemic delivery of siRNA nanoparticles targeting RRM2 suppresses
head and neck tumor growth. J Control Release. 159:384–392. 2012.
View Article : Google Scholar : PubMed/NCBI
|