Introduction
Dupuytren’s contracture (DC) is a progressive tissue
disorder that affects the palmar fascia, and results in digital
flexion contracture (1–3). DC incidence ranges from 3–40%
worldwide and primarily affects patients >50 years (4). Therefore, it is necessary to
investigate novel diagnostic and therapeutic approaches for
patients with DC.
A number of treatments for DC have been evaluated,
such as radiotherapy, topical vitamin A and E application, and
dimethyl sulfoxide injection. However, these approaches have proven
unsuitable or ineffective for the clinical treatment of DC
(5). More recently, research has
focused on potential treatments targeting the molecular processes
underlying DC (6,7). Fibrogenic cytokines, which may be
capable of inducing the growth of fibroblasts, are involved in the
molecular mechanisms underlying DC (8). Satish et al (9) demonstrated that the expression of
type XV collagen α 1 chain, proteoglycan 4 and fibulin-1, which are
components of the extracellular matrix, is downregulated in DC
fibroblasts compared with controls. The following miRNAs were found
to be associated with the β-catenin pathway in DC tissue samples:
Zinc finger of the cerebellum 1, wingless-type mouse mammary tumor
virus integration site 5A and transforming growth factor β 1,
(10). Musculoaponeurotic
fibrosarcoma oncogene homolog B has been reported to be expressed
in DC samples and not in healthy samples (11). Furthermore, a number of matrix
metalloproteinases (MMPs), including MMP 13, MMP 16 and MMP 19 are
expressed in DC samples but not in healthy samples (12). However, the pathogenesis of DC
remains poorly understood. It is therefore necessary to investigate
the pathology of DC in order to develop diagnostic and therapeutic
approaches to DC.
In the present study, statistical analysis was
performed, in order to develop gene expression profiles for samples
from patients with DC and from healthy controls. The significantly
differentially expressed genes (DEGs) between DC patients and
healthy controls were measured. Hierarchical clustering analysis
was performed for the DEGs. Antagonistic contrary genes, which
exhibited opposite expression patterns in the positive and negative
groups, and likely exhibited opposite functions, were then
identified. A gene ontology (GO) function analysis was conducted
and a network of GO terms was constructed.
Materials and methods
DEG identification
The GSE21221 expression profile was downloaded from
the gene expression omnibus (GEO) database. This included six
samples from DC-derived fibroblasts and six control samples from
carpal-tunnel-derived fibroblasts, and was conducted using GPL2507
Sentrix® Human-6 Expression BeadChip and GPL10301 GE
Healthcare CodeLink Human Whole Genome Bioarray (9). DEGs (P<0.05) were identified using
the Distributed Intrusion Detection System (DIDS) (13) with R package version 1.1.
Hierarchical cluster analysis
Hierarchical cluster analysis for DEGs was performed
in order to investigate the patterns of DEG classification and
co-expression using TreeView (14). Genes whose expression values were
present in >80% of samples had a standard deviation (SD) >2
were selected. Expression values were logarithmically standardized
using TreeView. The correlations in the similarity matrix were
subsequently calculated and a hierarchical cluster analysis was
performed.
Identification of contrary genes
A Pearson correlation coefficient was calculated
using the co-express software (www.bioinformatics.lu/CoExpress), which analyzes the
association between mRNA and miRNA expression. miRNA targets were
predicted using TargetScan (http://www.targetscan.org/) and starBase (15). Genes with high expression values
<520 and SD value <560 were removed.
Between-experiment-normalization was then performed. Genes with a
Pearson correlation coefficient >0.9 were defined as positive.
Genes that were negatively associated with at least one gene in the
positive gene group (Pearson correlation coefficient, <−0.9 and
correlation coefficient, <−0.5 with all the genes in the
positive gene group) were defined as negative. Genes in the
positive and negative groups exhibited opposite expression
patterns. Therefore, in the present study these genes are termed
contrary genes, which exhibited opposite expression patterns in the
positive and negative groups, and likely exhibited opposite
functions.
Function annotation analysis of DEGs
A genecard database (16) was used in order to conduct function
analysis of DEGs annotated with GO terms. Cluster analysis was
conducted using reduce and visualize gene ontology (REViGO)
(17), in order to identify the GO
terms (similarity threshold: 0.7). Semantic similarity was measured
using the SimRel algorithm (18).
System network analysis
A function network of GO terms was produced using
the REViGO database (17), and
network visualization was performed using cytoscape version 2.8
(19). A network analysis plugin
(20) was then used in order to
analyze the network topology and to identify the significant GO
terms in the network.
Results
DEG identification
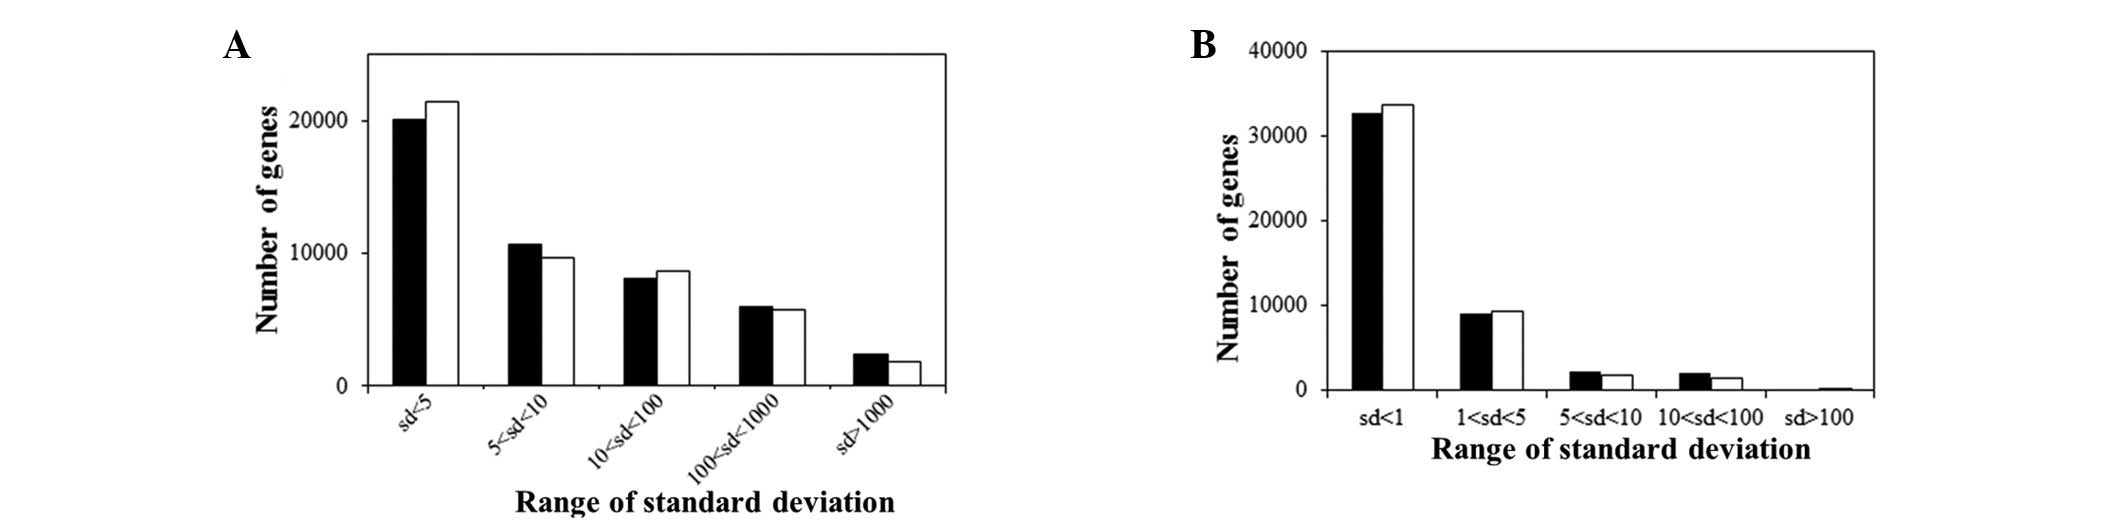
The distribution of SD values was used in order to
indicate the level of homogeneity in the data. The results
suggested that the data exhibited low levels of homogeneity
(Fig. 1). A DIDS analysis was
performed in order to identify DEGs in the DC samples that had
significantly higher expression than normal range, this resulted in
the identification of 801 DEGs (P<0.05).
Hierarchical cluster analysis
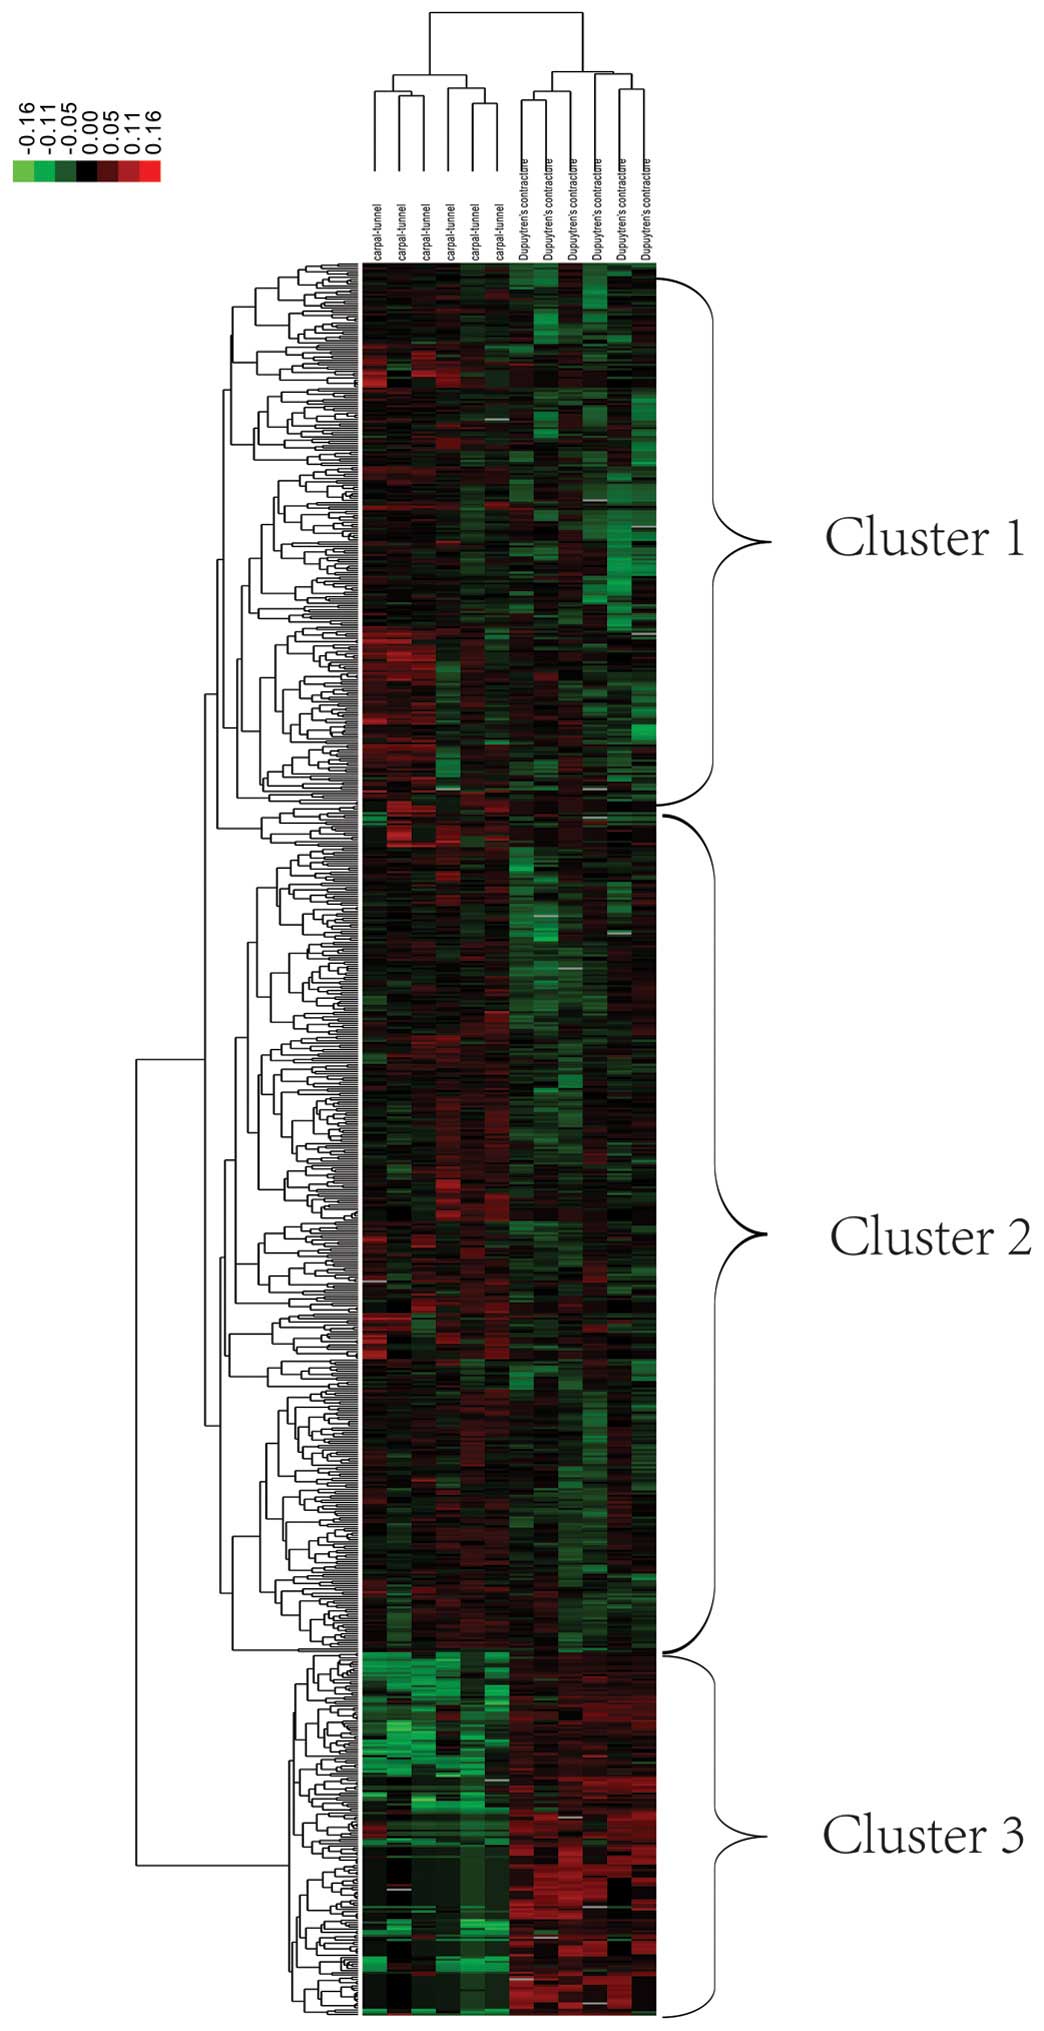
Using the hierarchical clustering method,
significant DEGs (775) were identified among the 801 DEGs. Fig. 2 represents a heatmap produced using
the cluster software, TreeView. The results suggested that the
control and DC samples were clustered in three groups: Clusters
one, two and three. In cluster one, genes in the control samples
were upregulated, whereas those in the DC samples were
significantly downregulated. In cluster two, genes in the control
samples were upregulated and in the DC samples, upregulated and
downregulated genes were observed. In cluster three, genes in the
control samples were downregulated, whereas those in the DC samples
were upregulated. In cluster three, DC and healthy samples were
distinct from one another, whereas in clusters one and two, DC and
healthy samples were not distinct. Therefore, genes associated with
cluster three, may be useful for the development of diagnostic
markers associated with DC.
Identification of contrary genes
Coexpress software was used in order to conduct a
correlation analysis. The average expression value of the 801 DEGs
was 523 and the average SD value was 2.24×10². Following
filtering and standardization of the data, 98 contrary genes were
identified. The average expression value of the 98 contrary genes
was 3.45×10³ and the SD value was 5.56×10².
Subsequently, 18 significantly correlated contrary gene pairs were
identified (Table I).
Chitinase-3-like protein 1 (CHI3L1) was negatively correlated with
the following ten DEGs in the positive group: DEAD
(Asp-Glu-Ala-Asp) box helicase 3; X-Linked (DDX3X); nuclear factor
erythroid 2-related factor 2 (NFE2L2); γ-interferon-inducible
protein 16 (IFI16); integral membrane protein 2B (ITM2B);
Niemann-Pick disease, type C1 (NPC1); rho family GTPase 3 (RND3),
family with sequence similarity 129 A (FAM129A); eukaryotic
translation initiation factor 2, subunit 3 γ (EIF2S3), laminin, α 4
(LAMA4); and aldo-keto reductase family 1, member C2 (AKR1C2;
Fig. 3).
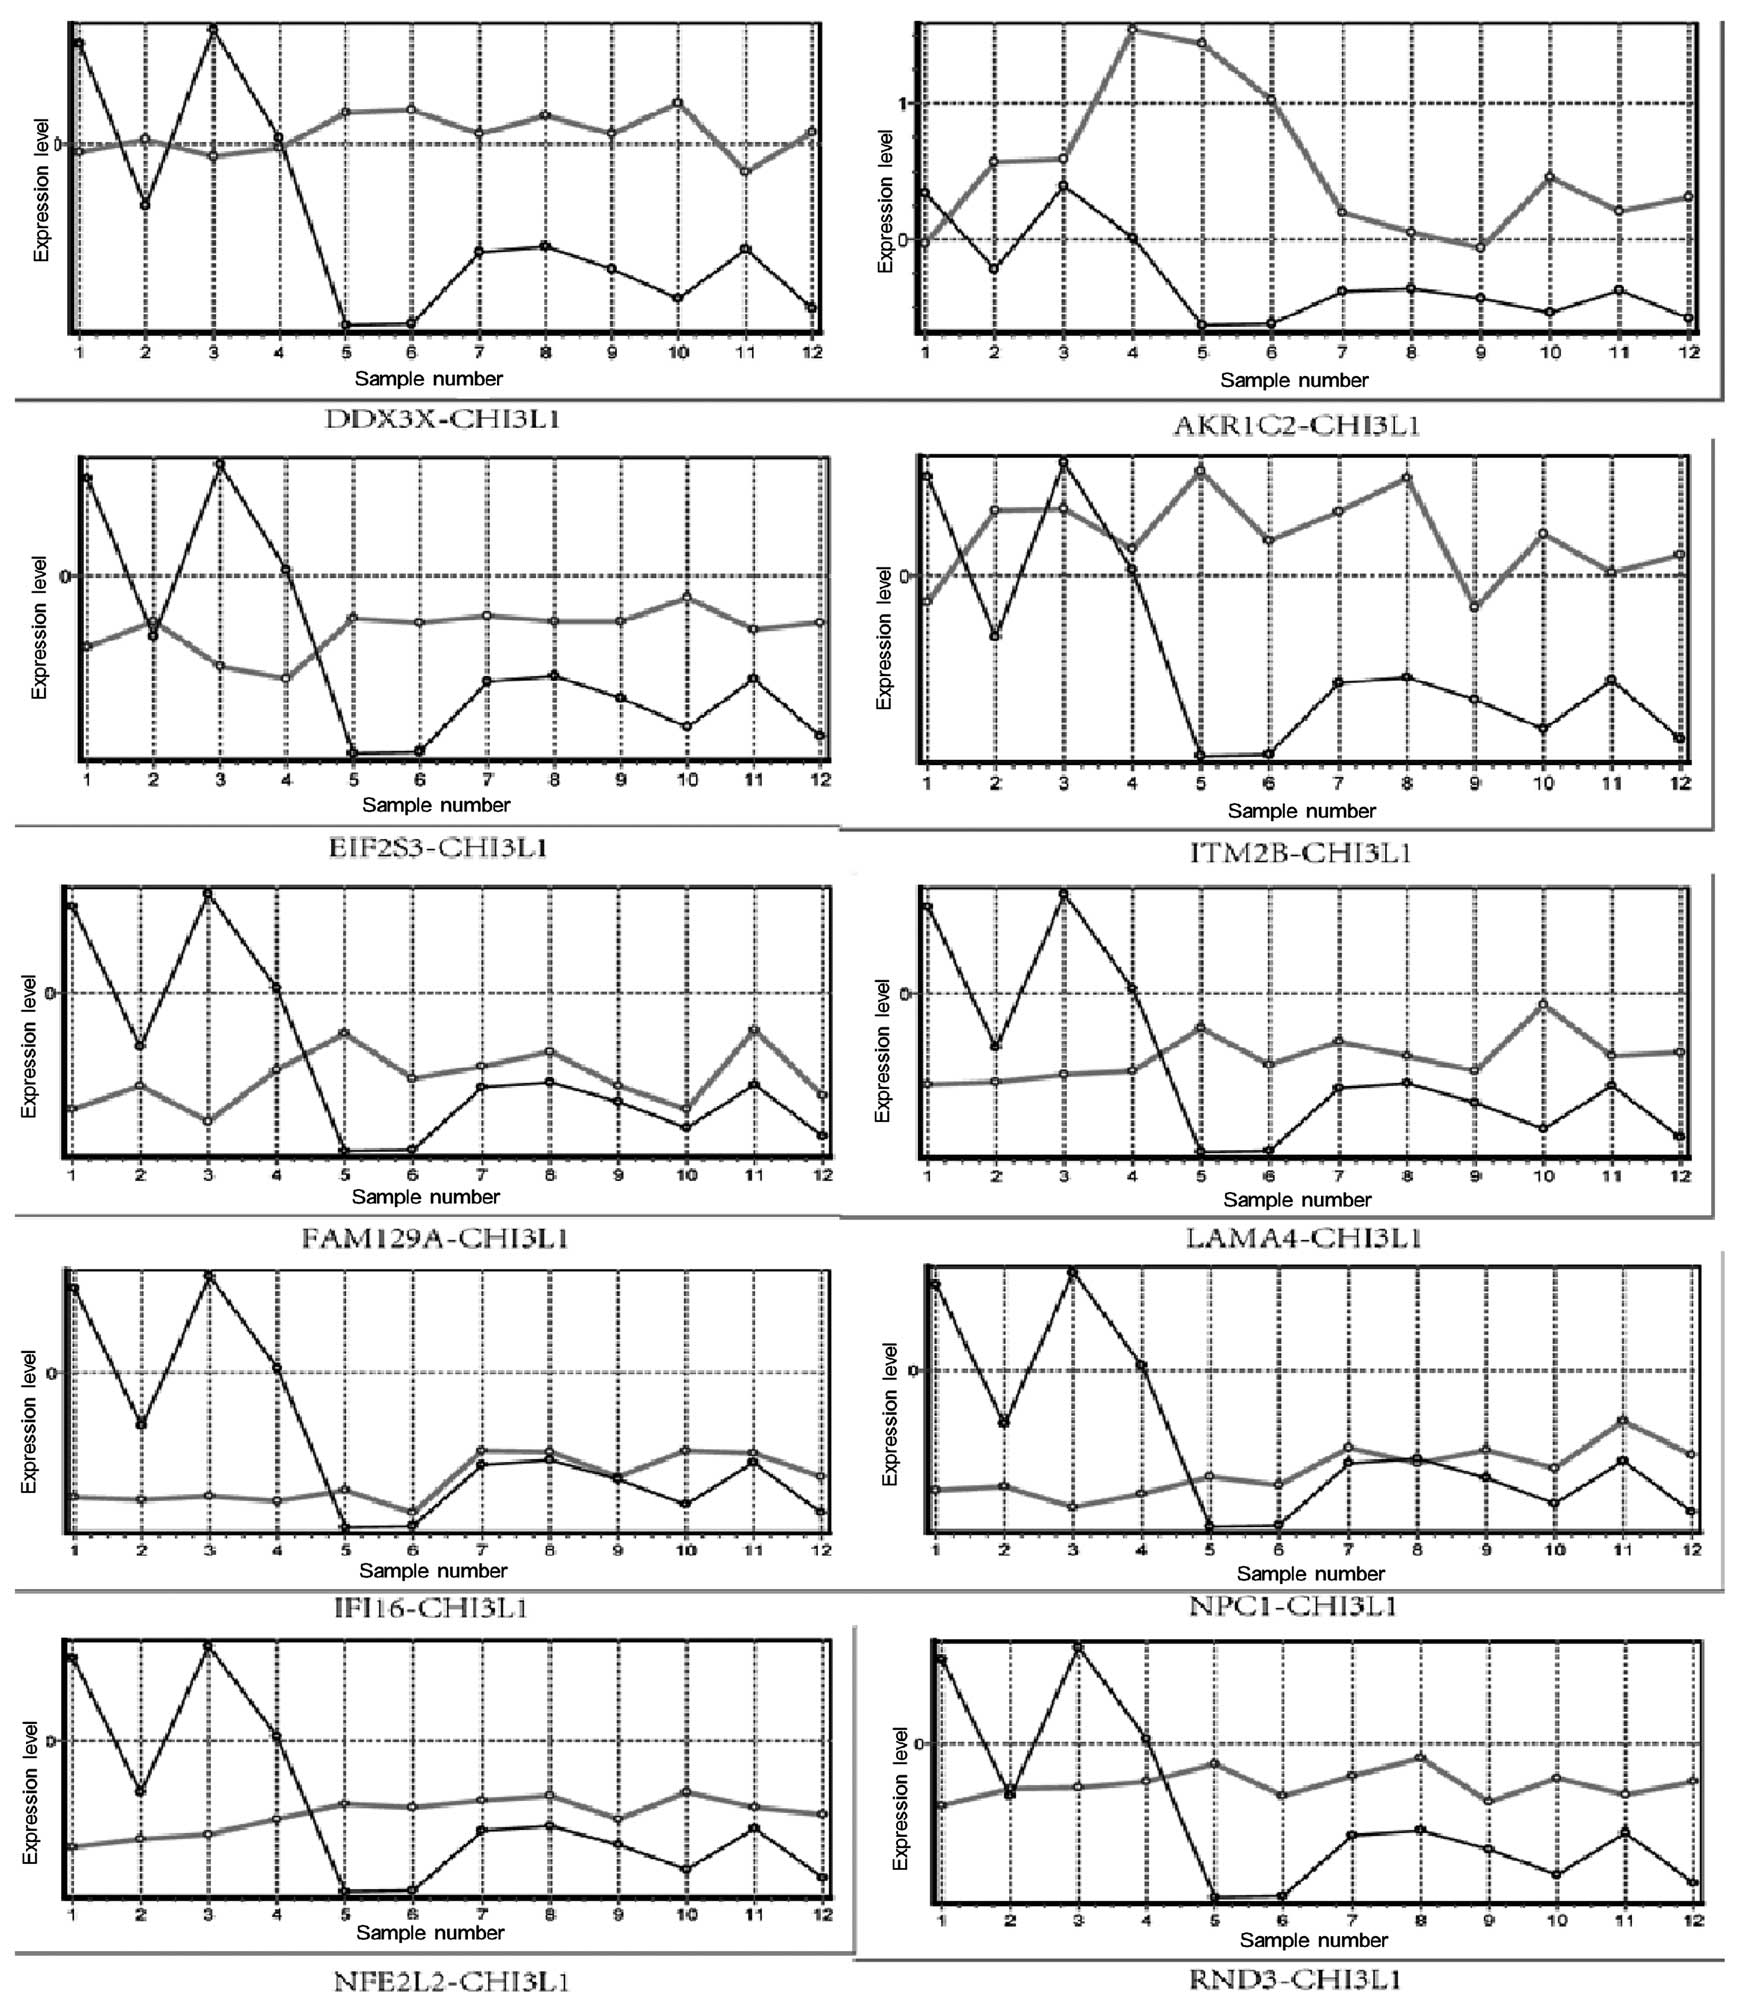 | Figure 3Expression levels of the ten genes
from the positive group and the gene from the negative group,
CHI3L1, in 12 samples (samples 1-6 are DC samples and samples 7–12
are healthy samples). The x-axis represents the 12 samples and the
y-axis represents the expression levels following standardization.
The black line represents the expression level of CHI3L1 and the
grey line represents the expression levels of ten genes in the
positive group. CHI3L1, chitinase-3-like protein 1; DC, Dupuytren’s
contracture; DDX3X, DEAD (Asp-Glu-Ala-Asp) box helicase 3 X-Linked;
NFE2L2, nuclear factor erythroid 2-related factor 2; IFI16,
γ-interferon-inducible protein 16; ITM2B, integral membrane protein
2B; NPC1, Niemann-Pick disease type C1; RND3, rho family GTPase 3;
FAM129A, family with sequence similarity 129 A; EIF2S3, eukaryotic
translation initiation factor 2 subunit 3 γ; LAMA4, laminin α 4;
and AKR1C2, aldo-keto reductase family 1 member C2. |
 | Table ISignificantly correlated genes and
correlation coefficients. |
Table I
Significantly correlated genes and
correlation coefficients.
| Node ID1 | Node ID2 | Correlation
coefficient | Node ID1 | Node ID2 | Correlation
coefficient |
|---|
| CHI3L1 | EIF2S3 | −0.9273 | EPHX1 | ATF4 | −0.90163 |
| SFRP1 | MASP1 | 0.91333 | FAM12A | AKR1C2 | 0.9186 |
| SFRP1 | FBLN1 | 0.9048 | SAA1 | ATF4 | −0.9023 |
| FBLN1 | MASP1 | 0.93677 | NFE2L2 | AKR1C2 | 0.94147 |
| FBLN1 | CLU | 0.90097 | LAMA4 | AKR1C2 | 0.94183 |
| COL15A1 | RAB9A | −0.90623 | ITM2B | AKR1C2 | 0.92597 |
| RND3 | AKR1C2 | 0.92937 | RNF19A | ATF4 | −0.904 |
| EIF2S3 | AKR1C2 | 0.92647 | IFI16 | AKR1C2 | 0.90557 |
| DDX3X | AKR1C2 | 0.9201 | NPC1 | AKR1C2 | 0.91037 |
Function annotation analysis
A GO function annotation analysis was performed for
the CHI3L1 gene and the ten genes with which it was negatively
correlated, which resulted in the identification of 132 GO terms.
The 132 GO terms were subsequently grouped into three clusters
corresponding to the clusters in Fig
2 (Table II). The results
suggested that the genes in cluster one are involved in blood
vessel development, hemopoiesis and myeloid cell differentiation.
Genes in cluster two are involved in cell proliferation, and the
negative and positive regulation of cell death. Genes in cluster
three are involved in the negative regulation in protein
phosphorylation, glycosylation, ubiquitination and
phosphorylation.
| Table IICluster analysis of GO functions. |
Table II
Cluster analysis of GO functions.
| GO ID | GO term | Frequency (%) | Plot size | Uniqueness |
|---|
| Cluster one |
| GO: 0001568 | Blood vessel
development | 1.36 | 3.025 | 0.814 |
| GO: 0030097 | Hemopoiesis | 1.46 | 3.053 | 0.796 |
| GO: 0030099 | Myeloid cell
differentiation | 0.64 | 2.694 | 0.781 |
| Cluster two |
| GO: 0008283 | Cell
proliferation | 4.08 | 3.501 | 0.874 |
| GO: 0060548 | Negative regulation
of cell death | 1.81 | 3.148 | 0.674 |
| GO: 0030307 | Positive regulation
of cell growth | 0.21 | 2.21 | 0.722 |
| GO: 0008284 | Positive regulation
of cell proliferation | 1.65 | 3.107 | 0.712 |
| Cluster three |
| GO: 0001933 | Negative regulation
of protein phosphorylation | 0.49 | 2.584 | 0.666 |
| GO: 0006486 | Protein
glycosylation | 0.73 | 2.755 | 0.787 |
| GO: 0016567 | Protein
ubiquitination | 1.31 | 3.007 | 0.819 |
| GO: 0006468 | Protein
phosphorylation | 5.22 | 3.608 | 0.786 |
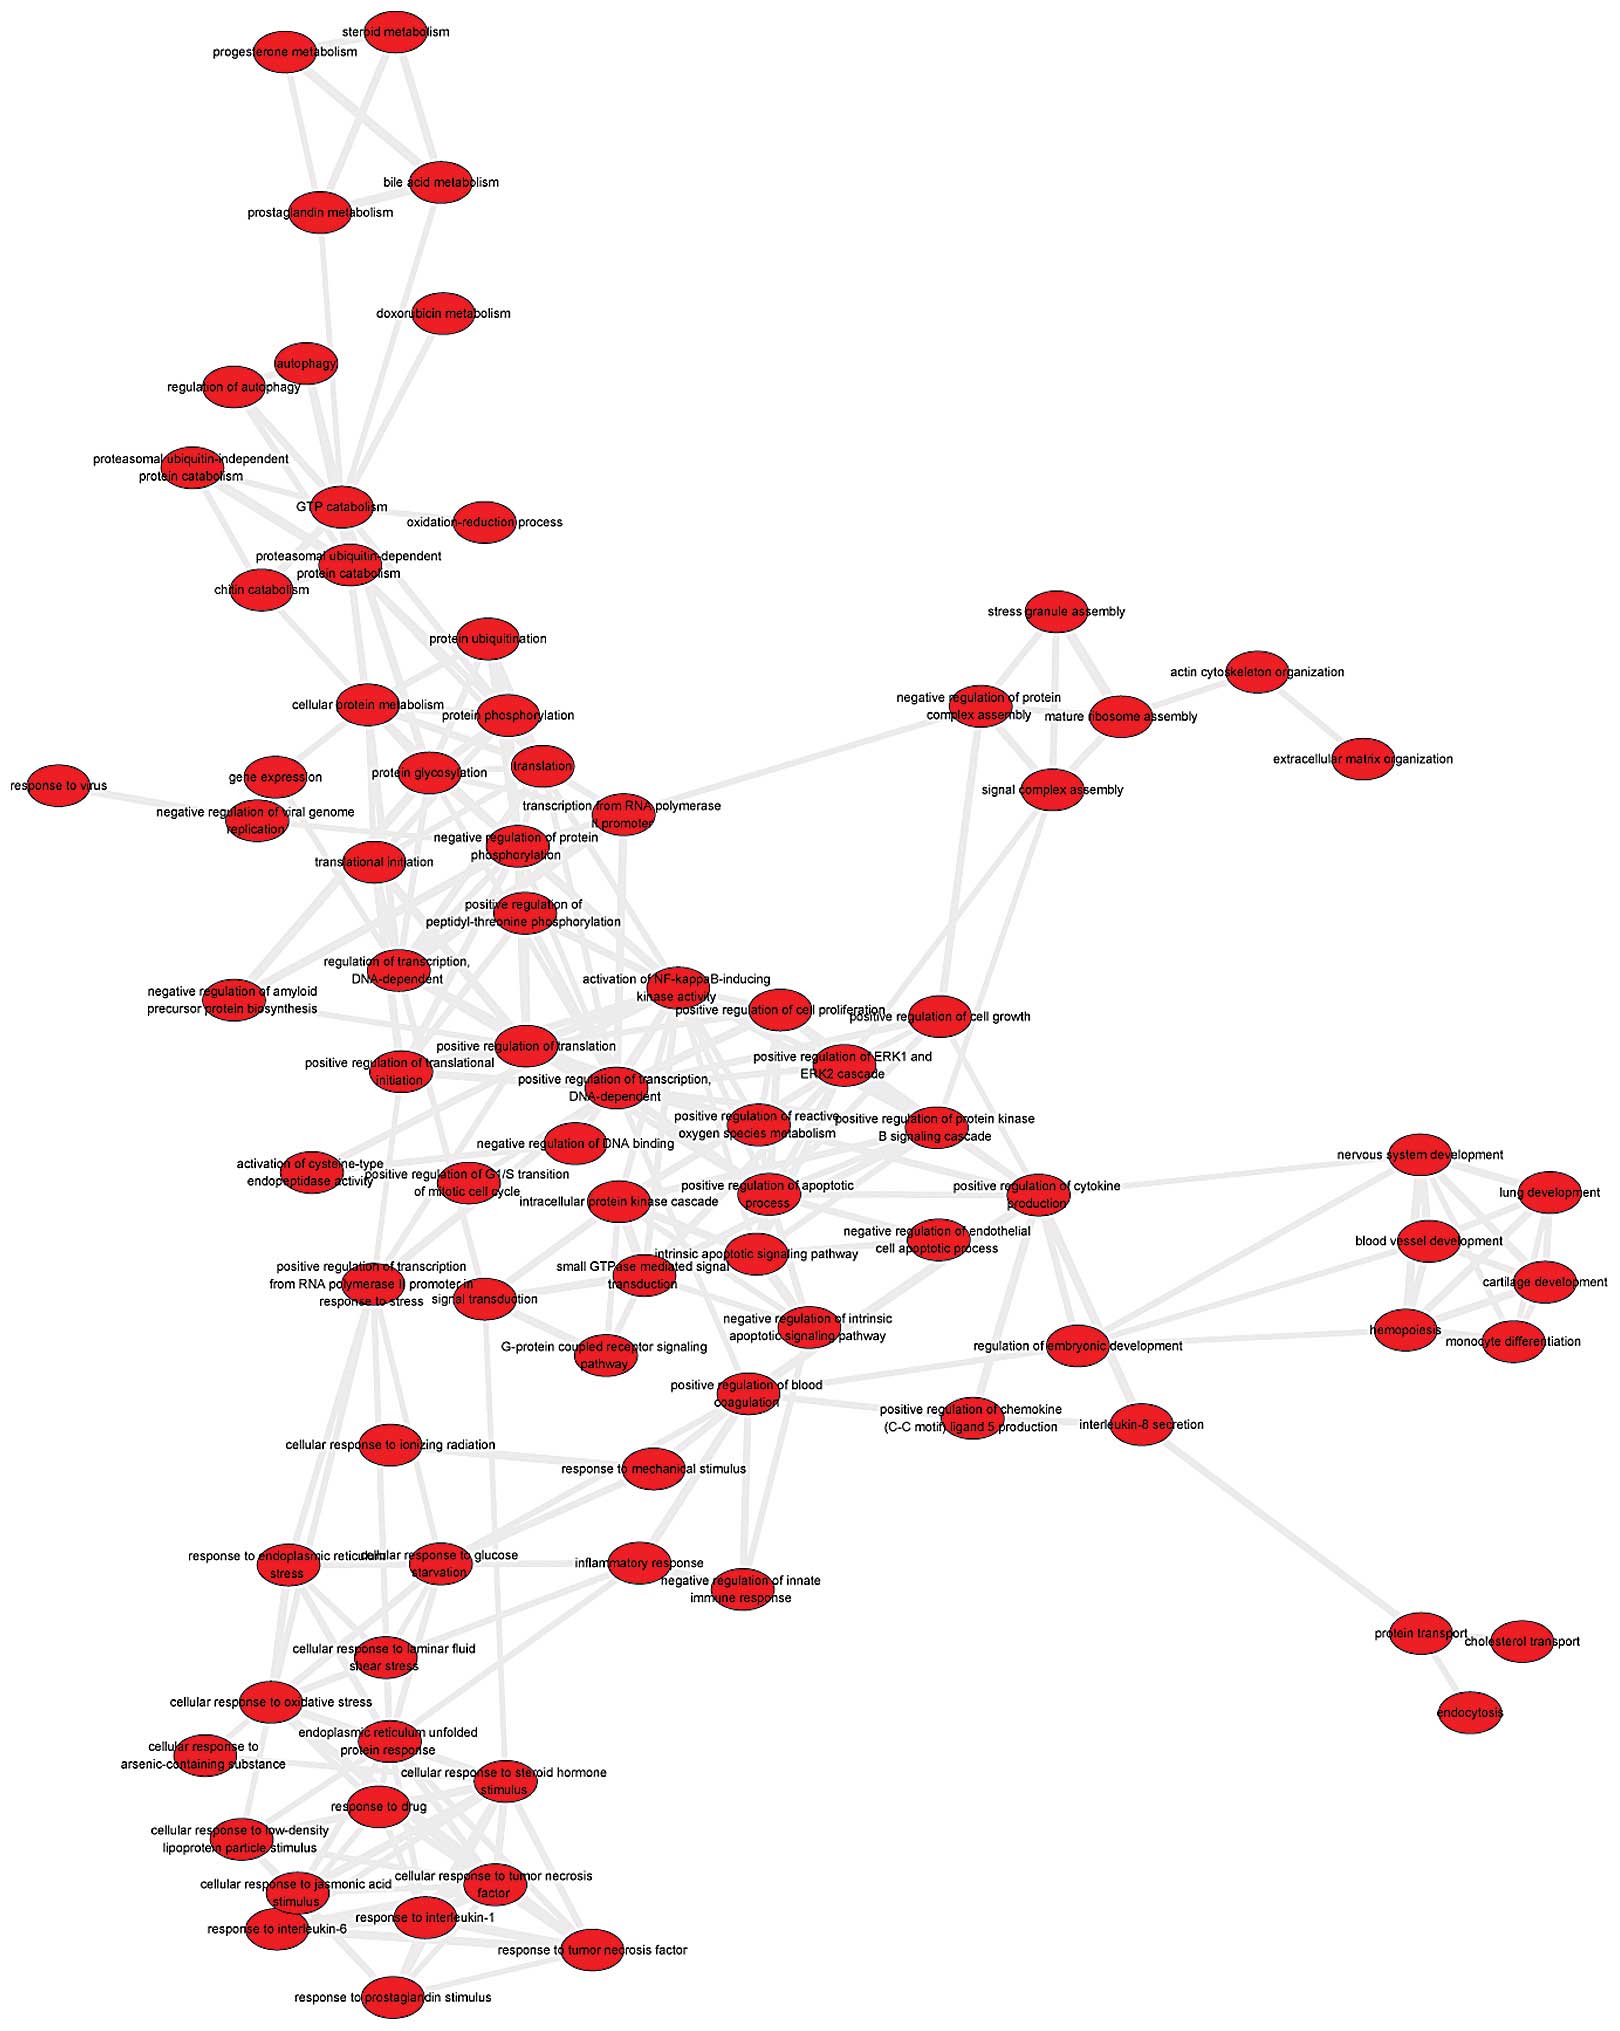
System network analysis
A system network of the 132 GO terms was constructed
(Fig. 4). GO terms exhibiting
semantic similarities were removed. This resulted in 86 GO terms
and 257 edges, which represent the associations between GO terms.
The GO terms, level of positive regulation of transcription and
activation of nuclear factor-κB (NF-κB)-inducing kinase activity,
exhibited degree levels of 19 and 16, respectively.
Discussion
In the present study, a DIDS analysis was conducted,
which resulted in the identification of 801 DEGs. A positive and a
negative group of DEGs were obtained. Opposing DEGs in the two
groups are termed contrary genes in the present study. A network of
GO terms was constructed, following a functional analysis, for the
CHI3L1 gene and the ten genes with which it was negatively
correlated (Table III).
| Table IIIGO terms exhibiting the ten highest
degrees in the network which was constructed based on the GO
function of CHI3L1 and ten positive genes. |
Table III
GO terms exhibiting the ten highest
degrees in the network which was constructed based on the GO
function of CHI3L1 and ten positive genes.
| GO term | Degree |
|---|
| Positive regulation
of transcription | 19 |
| Activation of
NF-κB-inducing kinase activity | 16 |
| Negative regulation
of protein phosphorylation | 14 |
| Endoplasmic
reticulum unfolded protein response | 14 |
| Cellular response
to oxidative stress | 12 |
| Positive regulation
of apoptotic process | 12 |
| Cellular response
to steroid hormone stimulus | 12 |
| GTP catabolism | 12 |
| Positive regulation
of translation | 12 |
| Positive regulation
of ERK1 and ERK2 cascade | 11 |
Hierarchical clustering analysis was performed for
775 DEGs, which resulted in three clusters. Differences were
observed between the expression patterns of genes in these three
clusters. Contrary genes were identified based the correlation of
gene expression level between the DEGs. CHI3L1 expression was found
to be negatively correlated with the expression of ten DEGs in the
positive group. CHI3L1 is a secreted glycoprotein, which may be
termed YKL-40. Forrester et al (21) performed a genome-wide analysis of
exon arrays, which demonstrated that CHI3L1 expression was higher
in primary fibroblasts obtained from patients with Dupuytren’s
disease, compared with that in fibroblasts from healthy patients.
In the present study, CHI3L1 expression was higher in the DC group
than in the control group. Activation of NF-κB-inducing kinase
activity exhibited a high value in the GO term network. CHI3L1 has
been shown to be induced by inflammatory cytokines, tumor necrosis
factor-α (TNF-α) and interleukin-1, in articular chondrocytes, and
this induction requires sustained activation of NF-κB (22). Furthermore, it has been reported
that the expression of TNF-α and interleukin-1 was significantly
higher in patients with DC compared with that in controls (23). Therefore, CHI3L1 may be involved in
the pathology of DC, via the induction of NF-κB kinase activity.
However, the involvement of CHI3L1 in the development of DC
requires further analysis. In the present study, the following ten
genes were negatively correlated with CHI3L1: DDX3X, NFE2L2, IFI16,
ITM2B, NPC1, RND3, FAM129A, EIF2S3, LAMA4 and AKR1C2. To the best
of our knowledge, the present study is the first to demonstrate a
potential association between these ten genes and DC development.
DD3X (24), NFE2L2 (25), IFI16 (26), NPC1 (27), RND3 (28) and AKR1C2 (29) have been found to be positively
correlated with inflammation. Therefore, these genes may be
associated with DC development. However, the association between
these genes and CHI3L1, and their involvement in DC, require
further investigation, in order to understand the molecular
mechanisms underlying DC development.
Positive regulation of transcription demonstrated
the highest degree in the GO term network. The transcription factor
gene, Zf9 is associated with DC pathogenesis (30). The expression of the contractile
phenotype in Dupuytren’s nodular cells is determined by the
post-transcriptional regulation of α-smooth muscle actin (31). Therefore, the regulation of
transcription may be involved in the pathogenesis of DC.
In the present study, the expression of genes
involved in DC was analyzed, and the term, contrary genes, was
proposed. The expression of CHI3L1, was shown to be negatively
correlated with that of ten other genes. These genes are involved
in the positive regulation of transcription and in the activation
of NF-κB-inducing kinase activity. Therefore, the results of the
present study may be of use in the development of diagnostic
markers and treatment for DC.
References
|
1
|
Murphey MD, Ruble CM, Tyszko SM,
Zbojniewicz AM, Potter BK and Miettinen M: From the archines of the
AFIP: musculoskeletal fibromatoses: radiologic-pathologic
correlation. Radiographics. 29:2143–2173. 2009. View Article : Google Scholar : PubMed/NCBI
|
|
2
|
Van Rijssen A and Werker P: Percutaneous
needle fasciotomy in dupuytren’s disease. J Hand Surg Br.
31:498–501. 2006. View Article : Google Scholar : PubMed/NCBI
|
|
3
|
Reilly RM, Stern PJ and Goldfarb CA: A
retrospective review of the management of Dupuytren’s nodules. J
Hand Surg Am. 30:1014–1018. 2005. View Article : Google Scholar : PubMed/NCBI
|
|
4
|
Loos B, Puschkin V and Horch RE: 50 years
experience with Dupuytren’s contracture in the Erlangen University
Hospital - a retrospective analysis of 2919 operated hands from
1956 to 2006. BMC Musculoskelet Disord. 8:602007. View Article : Google Scholar
|
|
5
|
Hurst LC and Badalamente MA: Nonoperative
treatment of Dupuytren’s disease. Hand Clin. 15:97–107. 1999.
|
|
6
|
Aggarwal BB and Shishodia S: Molecular
targets of dietary agents for prevention and therapy of cancer.
Biochem Pharmacol. 71:1397–1421. 2006. View Article : Google Scholar : PubMed/NCBI
|
|
7
|
Shimokawa H and Takeshita A: Rho-kinase is
an important therapeutic target in cardiovascular medicine.
Arterioscler Thromb Vasc Biol. 25:1767–1775. 2005. View Article : Google Scholar : PubMed/NCBI
|
|
8
|
Cordova A, Tripoli M, Corradino B, Napoli
P and Moschella F: Dupuytren’s contracture: an update of
biomolecular aspects and therapeutic perspectives. Journ Hand Surg
Br. 30:557–562. 2005. View Article : Google Scholar
|
|
9
|
Satish L, LaFramboise WA, O’Gorman DB, et
al: Identification of differentially expressed genes in fibroblasts
derived from patients with Dupuytren’s Contracture. BMC Med
Genomics. 1:102008. View Article : Google Scholar
|
|
10
|
Mosakhani N, Guled M, Lahti L, et al:
Unique microRNA profile in Dupuytren’s contracture supports
deregulation of β-catenin pathway. Mod Pathol. 23:1544–1552. 2010.
View Article : Google Scholar : PubMed/NCBI
|
|
11
|
Lee LC, Zhang AY, Chong AK, Pham H,
Longaker MT and Chang J: Expression of a novel gene, MafB, in
Dupuytren’s disease. J Hand Surg Am. 31:211–218. 2006. View Article : Google Scholar : PubMed/NCBI
|
|
12
|
Johnston P, Larson D, Clark IM and
Chojnowski AJ: Metalloproteinase gene expression correlates with
clinical outcome in Dupuytren’s disease. J Hand Surg Am.
33:1160–1167. 2008. View Article : Google Scholar : PubMed/NCBI
|
|
13
|
Snapp SR, Brentano J, Dias GV, et al: DIDS
(distributed intrusion detection system)-motivation, architecture,
and an early prototype. Proceedings of the 14th National Computer
Security Conference Washington, DC, USA: Epstein J and Picciotto J:
http://citeseeristpsu.edu/snapp91didshtmlurisimpleciteseeristpsu.edu/snapp91didshtml.
pp. 167–176. 1991
|
|
14
|
Page RD: Visualizing phylogenetic trees
using TreeView. Curr Protoc Bioinformatics. 6:Unit 6.2. 2002.
View Article : Google Scholar
|
|
15
|
Yang JH, Li JH, Shao P, Zhou H, Chen YQ
and Qu LH: starBase: a database for exploring microRNA-mRNA
interaction maps from Argonaute CLIP-Seq and Degradome-Seq data.
Nucleic Acids Res. 39:D202–D209. 2011. View Article : Google Scholar
|
|
16
|
Rebhan M, Chalifa-Caspi V, Prilusky J and
Lancet D: GeneCards: a novel functional genomics compendium with
automated data mining and query reformulation support.
Bioinformatics. 14:656–664. 1998. View Article : Google Scholar : PubMed/NCBI
|
|
17
|
Supek F, Bošnjak M, Škunca N and Šmuc T:
REVIGO summarizes and visualizes long lists of gene ontology terms.
PloS One. 6:e218002011. View Article : Google Scholar : PubMed/NCBI
|
|
18
|
Zhang L and Hermanns H: Deciding
simulations on probabilistic automata. Automated Technology for
Verification and Analysis (ATVA), 5th International Symposium.
Namjoshi KS, et al: Springer-Verlag; Heidelberg: pp. 207–222. 2007,
View Article : Google Scholar
|
|
19
|
Smoot ME, Ono K, Ruscheinski J, Wang PL
and Ideker T: Cytoscape 2.8: new features for data integration and
network visualization. Bioinformatics. 27:431–432. 2011. View Article : Google Scholar :
|
|
20
|
Saito R, Smoot ME, Ono K, et al: A travel
guide to Cytoscape plugins. Nat Methods. 9:1069–1076. 2012.
View Article : Google Scholar : PubMed/NCBI
|
|
21
|
Forrester HB, Temple-Smith P, Ham S, de
Kretser D, Southwick G and Sprung CN: Genome-wide analysis using
exon arrays demonstrates an important role for expression of
extra-cellular matrix, fibrotic control and tissue remodelling
genes in Dupuytren’s disease. PLoS One. 8:e590562013. View Article : Google Scholar
|
|
22
|
Recklies AD, Ling H, White C and Bernier
SM: Inflammatory cytokines induce production of CHI3L1 by articular
chondrocytes. J Biol Chem. 280:41213–41221. 2005. View Article : Google Scholar : PubMed/NCBI
|
|
23
|
Baird KS, Crossan JF and Ralston SN:
Abnormal growth factor and cytokine expression in Dupuytren’s
contracture. J Clin Pathol. 46:425–428. 1993. View Article : Google Scholar : PubMed/NCBI
|
|
24
|
Wang L, Lawrence MS, Wan Y, et al: SF3B1
and other novel cancer genes in chronic lymphocytic leukemia. N
Engl J Med. 365:2497–2506. 2011. View Article : Google Scholar : PubMed/NCBI
|
|
25
|
Saw C, Wu Q and Kong A: Anti-cancer and
potential chemo-preventive actions of ginseng by activating Nrf2
(NFE2L2) anti-oxidative stress/anti-inflammatory pathways. Chin
Med. 5:372010. View Article : Google Scholar
|
|
26
|
Veeranki S, Duan X, Panchanathan R, Liu H
and Choubey D: IFI16 protein mediates the anti-inflammatory actions
of the type-I interferons through suppression of activation of
caspase-1 by inflammasomes. PLoS One. 6:e270402011. View Article : Google Scholar : PubMed/NCBI
|
|
27
|
Liao G, Cheung S, Galeano J, Ji AX, Qin Q
and Bi X: Allopregnanolone treatment delays cholesterol
accumulation and reduces autophagic/lysosomal dysfunction and
inflammation in Npc1−/− mouse brain. Brain Res. 1270:140–151. 2009.
View Article : Google Scholar : PubMed/NCBI
|
|
28
|
Kurtz KM and Breslin JW: Rnd3 accelerates
termination of thrombin-induced Rho activation in endothelial
cells. FASEB J. Meeting Abstract Suppl. 762.142009.
|
|
29
|
Wang HW, Lin CP, Chiu JH, et al: Reversal
of inflammation-associated dihydrodiol dehydrogenases (AKR1C1 and
AKR1C2) overexpression and drug resistance in nonsmall cell lung
cancer cells by wogonin and chrysin. Int J Cancer. 120:2019–2027.
2007. View Article : Google Scholar : PubMed/NCBI
|
|
30
|
Bayat A, Watson JS, Stanley JK, Ferguson
MW and Ollier WE: Genetic susceptibility to dupuytren disease:
association of Zf9 transcription factor gene. Plast Reconstr Surg.
111:2133–2139. 2003. View Article : Google Scholar : PubMed/NCBI
|
|
31
|
Verjee LS, Midwood K, Davidson D, Eastwood
M and Nanchahal J: Post-transcriptional regulation of alpha-smooth
muscle actin determines the contractile phenotype of Dupuytren’s
nodular cells. J Cell Physiol. 224:681–690. 2010. View Article : Google Scholar : PubMed/NCBI
|