Introduction
Stem cell therapy has the potential to improve the
treatment of patients with various diseases. Bone marrow stromal
cells (BMSCs) possess various characteristics, including
multi-directional differentiation, promotion of stem cell
implantation, hematopoietic support, immune regulation and
self-regulation (1–4). Furthermore, under specific induced
conditions, BMSCs are able to differentiate into various types of
cell, including adipocytes, osteocytes, chondrocytes and
hematopoietic cells, as well as various types of tissue, including
muscle, nerve, endothelium, liver and myocardium (5–10).
Therefore, BMSCs are considered to be ideal cells for stem cell
therapy (11–16).
In addition to the progression of stem cell
transplantation (SCT), its tracking technology has been
demonstrated to be important. Conventional methods used for stem
cell detection are invasive, which require animal organs and
tissues for histological microtome sections and immunochemical
examinations (17). Medical
imaging has progressed from traditional methods using anatomical
morphological analysis, to current molecular imaging (18) which is based on cellular, genetic
and molecular information in addition to signaling pathways. With
the progress of imaging and SCT, SCT has become an international
research focus (19). Magnetic
resonance imaging (MRI) has certain advantages over computer
tomography (CT) and nuclear medicine in molecular imaging,
including high temporal resolution, satisfactory tissue contrast
ratio, long evaluation time and absence of radiation pollution
(20,21). Previous studies on inflammation
(22), cancer (23), immune reactions and the efficacy of
stem cell treatment have demonstrated that MRI is able to detect
the dynamic migration of stem cells in vivo (24,25).
Thus, the use of MRI is suggested to be beneficial to molecular
medicine. Currently, stem cell labeling and tracking using MRI
contrast agents is a focus of research due to its potential to
improve MRI visualization in vivo. Gadodiamide, also known
as Omniscan, is a positive MRI contrast agent and a clinically safe
gadolinium-chelate complex, which is injected as a parenteral
non-ionic gadolinium solution (26,27).
Gadodiamide is a chelate compound containing non-ionic pentetic
acid and gadolinium, and its chemical formula is
[5,8-bis(carboxymethyl)-11-[2-(methylam
ino)-2-oxoethyl]-3-oxo-2,5,8,11-tetraazatridecan-13-oato(3-)]
gadolinium
(C16H26GdN5O8).
In order to explore a novel and feasible molecular
target, the present study delivered gadodiamide into the BMSCs of
neonatal rats and assessed its feasibility, safety and efficacy. In
addition, clinical MRI signal characteristics of BMSC labeling
in vitro were analyzed for further investigation in
vivo.
Materials and methods
Animals
A total of 45 female neonatal Sprague-Dawley (SD)
rats (9-11 days old; 15–20 g) used in this experiment were obtained
from the Experimental Animal Center of Sun Yat-sen University
(Guangzhou, China) (animal use permit no. SYXK 2012-0081). The
experiments in the present study were conducted aseptically in
accordance with the Chinese National Health and Medical Research
Council’s animal ethics guidelines. The use of these animals was
approved by the Medical Ethics Committee of the 5th Affiliated
Hospital of Sun Yat-sen University (Zhuhai, China).
Isolation, cultivation and identification
of BMSCs
The isolation and cultivation of BMSCs from SD rats
was conducted as previously described (28). Three neonatal rats were sacrificed
by cervical dislocation and the left and right tibias, femurs and
humeri were removed under aseptic conditions. The soft tissue
around the bones was also removed, and both ends were cut off.
Partial epiphyseal cartilage was retained, since it contained a
certain number of stem cells. The marrow cavity was pierced using a
1-ml sterile syringe and rinsed repeatedly with cell culture
solution, which contained 10% FBS (Gibco life Technologies,
Carlsbad, CA, USA) and 1% penicillin/streptomycin antibiotics
(Solarbio Science & Technology Co., Ltd., Beijing, China). The
homogeneous bone marrow cell suspension was collected through a
stainless steel screen filter (aperture 75 μm, 200 mesh)
into a beaker and seeded in a 75-cm2 culture flask
(Corning-Costar, Corning, NY, USA) covered with poly-lysine (PLL;
Sigma-Aldrich, St. Louis, MO, USA). Cells were incubated at 37°C
with 5% CO2 and the medium was replaced after 3 h.
Following incubation for 5–7 days, the cells were passaged and
re-plated. To distinguish the cultured cells from hematopoietic
stem cells and evaluate the purity, BMSCs at passage 2 were
detected by fluorescence-activated cell sorting (BD FACSAria III;
BD Biosciences, Franklin Lakes, NJ, USA). Briefly, BMSCs
(5×10⁵) were re-suspended in 500 μl of
phosphate-buffered saline (PBS; Gibco Life Technologies). The cells
were incubated in the dark at 4°C for at least 15 min and collected
for analysis within 1 h. The suspensions were then incubated with
monoclonal anti-rat-CD29-phycoerythrin (PE; 1:1,000; cat. no.
12-0291-81; eBioscience, Inc., San Diego, CA, USA), monoclonal
anti-rat-CD90-PE (1:1,000; cat. no. 12-0900-81; eBioscience, Inc.)
and monoclonal anti-rat-CD45-fluorescein isothiocyanate (FITC;
1:1,000, cat. no. 11-0461-80; eBioscience, Inc.).
Cell-labeling protocol
Medical materials
A gadodiamide solution (Omniscan; molecular weight,
574 Da; 20 ml solution containing 5.74 g gadodiamide solid drug in
sterile redistilled water) was purchased from GE Healthcare Life
Sciences (Little Chalfont, UK). The cell labeling agent used in the
present study was the fluorescent Arrest-In transfection reagent
(Open Biosystems, GE Healthcare Bio-Sciences), which is a
polyethylenimine-based lipopolymeric formulation (29). An orthogonal experiment was
conducted to achieve the highest transfer efficiency and minimized
toxicity. The orthogonal experiment was designed according to an
initial factor orthogonal experimental table to test MTT value
(n=3), with 1×10⁵ cells/ml seeded in a 96-well plate
(Corning-Costar). Optimum conditions based on various levels of the
test were then selected. Subsequently, a repeated verification test
was conducted to further optimize conditions for both minimal
cytotoxicity and the optimum up-take efficiency. In the present
study, the optimal cell-uptake method was as following: FI
reagent/Gd solution/Opti-MEM = 1:3:200, and the mixing time and
incubation time were 30 min and 3 h, respectively.
Cell labeling
Cells were seeded at a density of 5×10⁵
cells/well in a six-well plate with 2 ml Dulbecco’s modified
Eagle’s medium (DMEM; Gibco Life Technologies)/F12 [10% fetal
bovine serum (FBS)] culture medium. A total of 10 μl
FI-Arrest In reagent and 30 μl gadodiamide were respectively
dissolved in 500 μl opti-MEM (Gibco Life Technologies),
incubated for 15–20 min at room temperature (RT; 25°C), and were
mixed for 30 min to produce the labeling mixture. The mixture was
then carefully and slowly added to the plate, and Opti-MEM was
added to a total amount of 2 ml per well. Following incubation at
37°C and 5% CO2 for 3 h, the mixed liquid was replaced
by 2 ml fresh DMEM/F12 medium containing 10% FBS.
Evaluation of cell uptake efficiency
Flow cytometric detection of labeling
ratio
Following a 24-h resting period after labeling,
5–7×10⁵ labeled cells were suspended in 500 μl
PBS. Taking an equal quantity of non-labeled cells as controls, the
cell uptake efficiency was analyzed using a flow cytometer (BD
FACSAria III).
Inverted fluorescence microscopy
The labeled cells incubated for 8 h in the six-well
plates were fixed with 4% paraformaldehyde (Sigma-Aldrich). The
cells were then counter-stained and incubated at RT with Hoechst
33258 (1 ml/well; Beyotime Institute of Biotechnology, Haimen,
China) in the dark for 15 min. After removal of Hoechst 33258, the
cells were washed three times with PBS. The stained cells were
observed under an inverted fluorescence microscope (DMI4000B; Leica
Microsystems, Oberkochen, Germany).
Transmission electron microscopy
(TEM)
TEM was used to observe the intracellular
Gd3+ distribution. Cells were suspended in culture
medium in a 1.5 ml tube and centrifuged at 100 × g for 5 min.
Following removal of the supernatant, 3% glutaraldehyde (Beyotime
Institute of Biotechnology) was added to fix cells for 30 min. The
cells were further centrifuged at 100 × g for 5 min. The cells were
sectioned using a diamond knife (Diatome Ltd., Biel, Switzerland)
in order to obtain ultrathin sections, and double staining was
conducted using uranyl acetate (Guanghua Chemical Factory Co.,
Ltd., Guangong, China) and lead citrate (Guanghua Chemical Factory
Co., Ltd.).
Comparision of cellular
characteristics
Growth curves and survival ratio
The labeled cells were vaccinated in a
25-cm2 culture flask (Corning-Costar), and incubated at
37°C with 5% CO2. A total of 15 μl re-suspension
liquid from labeled BMSCs was added to 4% trypan blue solution
(Beyotime Institute of Biotechnology) at a 1:1 ratio. The inverted
microscope (DM IL; Leica Microsystems) was used to count the total
cells. As the blue-stained cells were the dead cells, the cell
survival ratio was calculated as [1−(number of blue-stained
cells/total number of cells)] ×100%. Every other day, survival
tests were performed on cells from the experimental and the control
group. Three samples per group were examined, and counting of each
sample was repeated four times. The cell numbers were counted,
respectively between days 0–14 in order to construct cell growth
curves, and the cell survival ratio was calculated for 24, 48 and
72 h.
Viability and proliferation of
cells
The MTT assay was used to analyze cell viability and
proliferation. Following 3 h of labeling, the cell suspension with
fresh medium was adjusted to a density of 1×10⁵ cells/ml
and seeded into a 96-well plate coated with PLL at 100
μl/well. The cell vability was measured at days 0–5
following labeling. A total of 20 μl MTT (Sigma-Aldrich)
liquid was added to each well, and the wells were subsequently
incubated for 4 h. All the medium and MTT liquid was removed and
150 μl dimethyl sulfoxide (Sigma-Aldrich) added into test
wells. A microplate reader (Multiskan MK3; Thermo Fisher
Scientific, Waltham, MA, USA) was used to measure the optical
density values at a wavelength of 490 mm. Using unlabeled cells as
the control, the ratio between labeled cells and the control group
was taken as the proliferation rate.
In vitro MRI of Gd-labeled BMSCs
Cells groups
Cells were re-suspended and exposed to different
concentrations of BMSCs for different time periods. A total of 200
μl/well of the suspension was added into the 96-well plates.
Centrifugation was conducted at 200 ×g for 5 min at 20°C (Allegra
X-15R; Beckman Coulter, Brea, CA, USA), and the plate was washed
thoroughly with 0.01 M PBS in order to eliminate the gadodiamide
that had not been taken up by the cells. Cells were covered with
100 μl 1% agarose solution (Agar; Sigma-Aldrich), which
solidified at RT, to immobilize them.
Experimental groups
To analyze the MRI signal intensity and durability
of cell labeling (BMSCs + Gd/FI) at different time-points,
experimental groups were exposed to Gd + FI for 1, 3, 7, 14, 21 and
28 days. Each group contained three samples and each sample
contained 1×10⁶ cells. The control groups were as
follows: Cells with gadodiamide but no FI-Arrest In agent at day 1
(BMSCs + Gd/non-FI), non-labeled cells (BMSCs + Agar) and empty
control without BMSCs (Agar + PLL).
MRI scanning parameters
MRI scanning was performed using a clinical 1.5
Tesla MRI scanner (Philips, Amsterdam, Netherlands) with a
dedicated animal somatic coil with a radial line of 14.5 x 8 cm.
Samples were flatly and centrally placed in the coil and transverse
scanning was conducted. The scanning parameters were performed as
follows: Field of vision, 130 × 148 × 79 mm (FH × RL × AP); voxel
size, 0.9 × 1.12 mm (FH × RL); number of signal averages, 2; layer
thickness, 1.5 mm; and layer distance, 1.5 mm. FH represents
foot-to-head diameter, on behalf of the longitudinal axial
diameter; RL represents right-to-left diameter, on behalf of the
transverse axial diameter; and AP represents anteroposterior
diameter. T1 weighted image and spin echo sequences (T1WI SE)
parameters were TR = 250 msec and TE = 15 msec. Each sample was
scanned six times repeatedly. Image-analysis software (Intera
Achieva Nova Dual 1.5T MRI; Philips) was used to obtain the signal
intensity and signal-to-noise ratio (SNR). The software was used to
gate the areas of interest at the bottom of the scanning specimens.
The area was 15 mm2 with a diameter of 14 mm. T1WI
signal intensity and noise at the same level acquired MRI SNR
data.
Statistical analysis
The results were analyzed using SPSS software,
version 17.0 (SPSS, Inc., Chicago, IL, USA). All values are
expressed as the mean ± standard deviation. Variance analysis was
used to compare differences and the paired t-test was used for data
analysis between the experimental and control groups. P<0.05 was
considered to indicate a statistically significant difference.
Results
Identification and morphological
observation of BMSCs
In the experiment, following 24-h culture in
DMEM/F12 medium, the number of adherent cells increased gradually
and cells exhibited a spindle-shaped morphology (Fig. 1A). During 5–7 days, the primary
BMSCs were confluent to 80–90% in a single layer. At passage 2, the
cells became homogeneous in morphology (Fig. 1B). FACS analysis confirmed that the
BMSCs homogeneously expressed specific surface antigens (Fig. 1C). They were observed to be
positive for CD29 (95.83±3.35%) and CD90 (98.67±1.47%), but
negative for CD45 (98.6±0.23%; n=3).
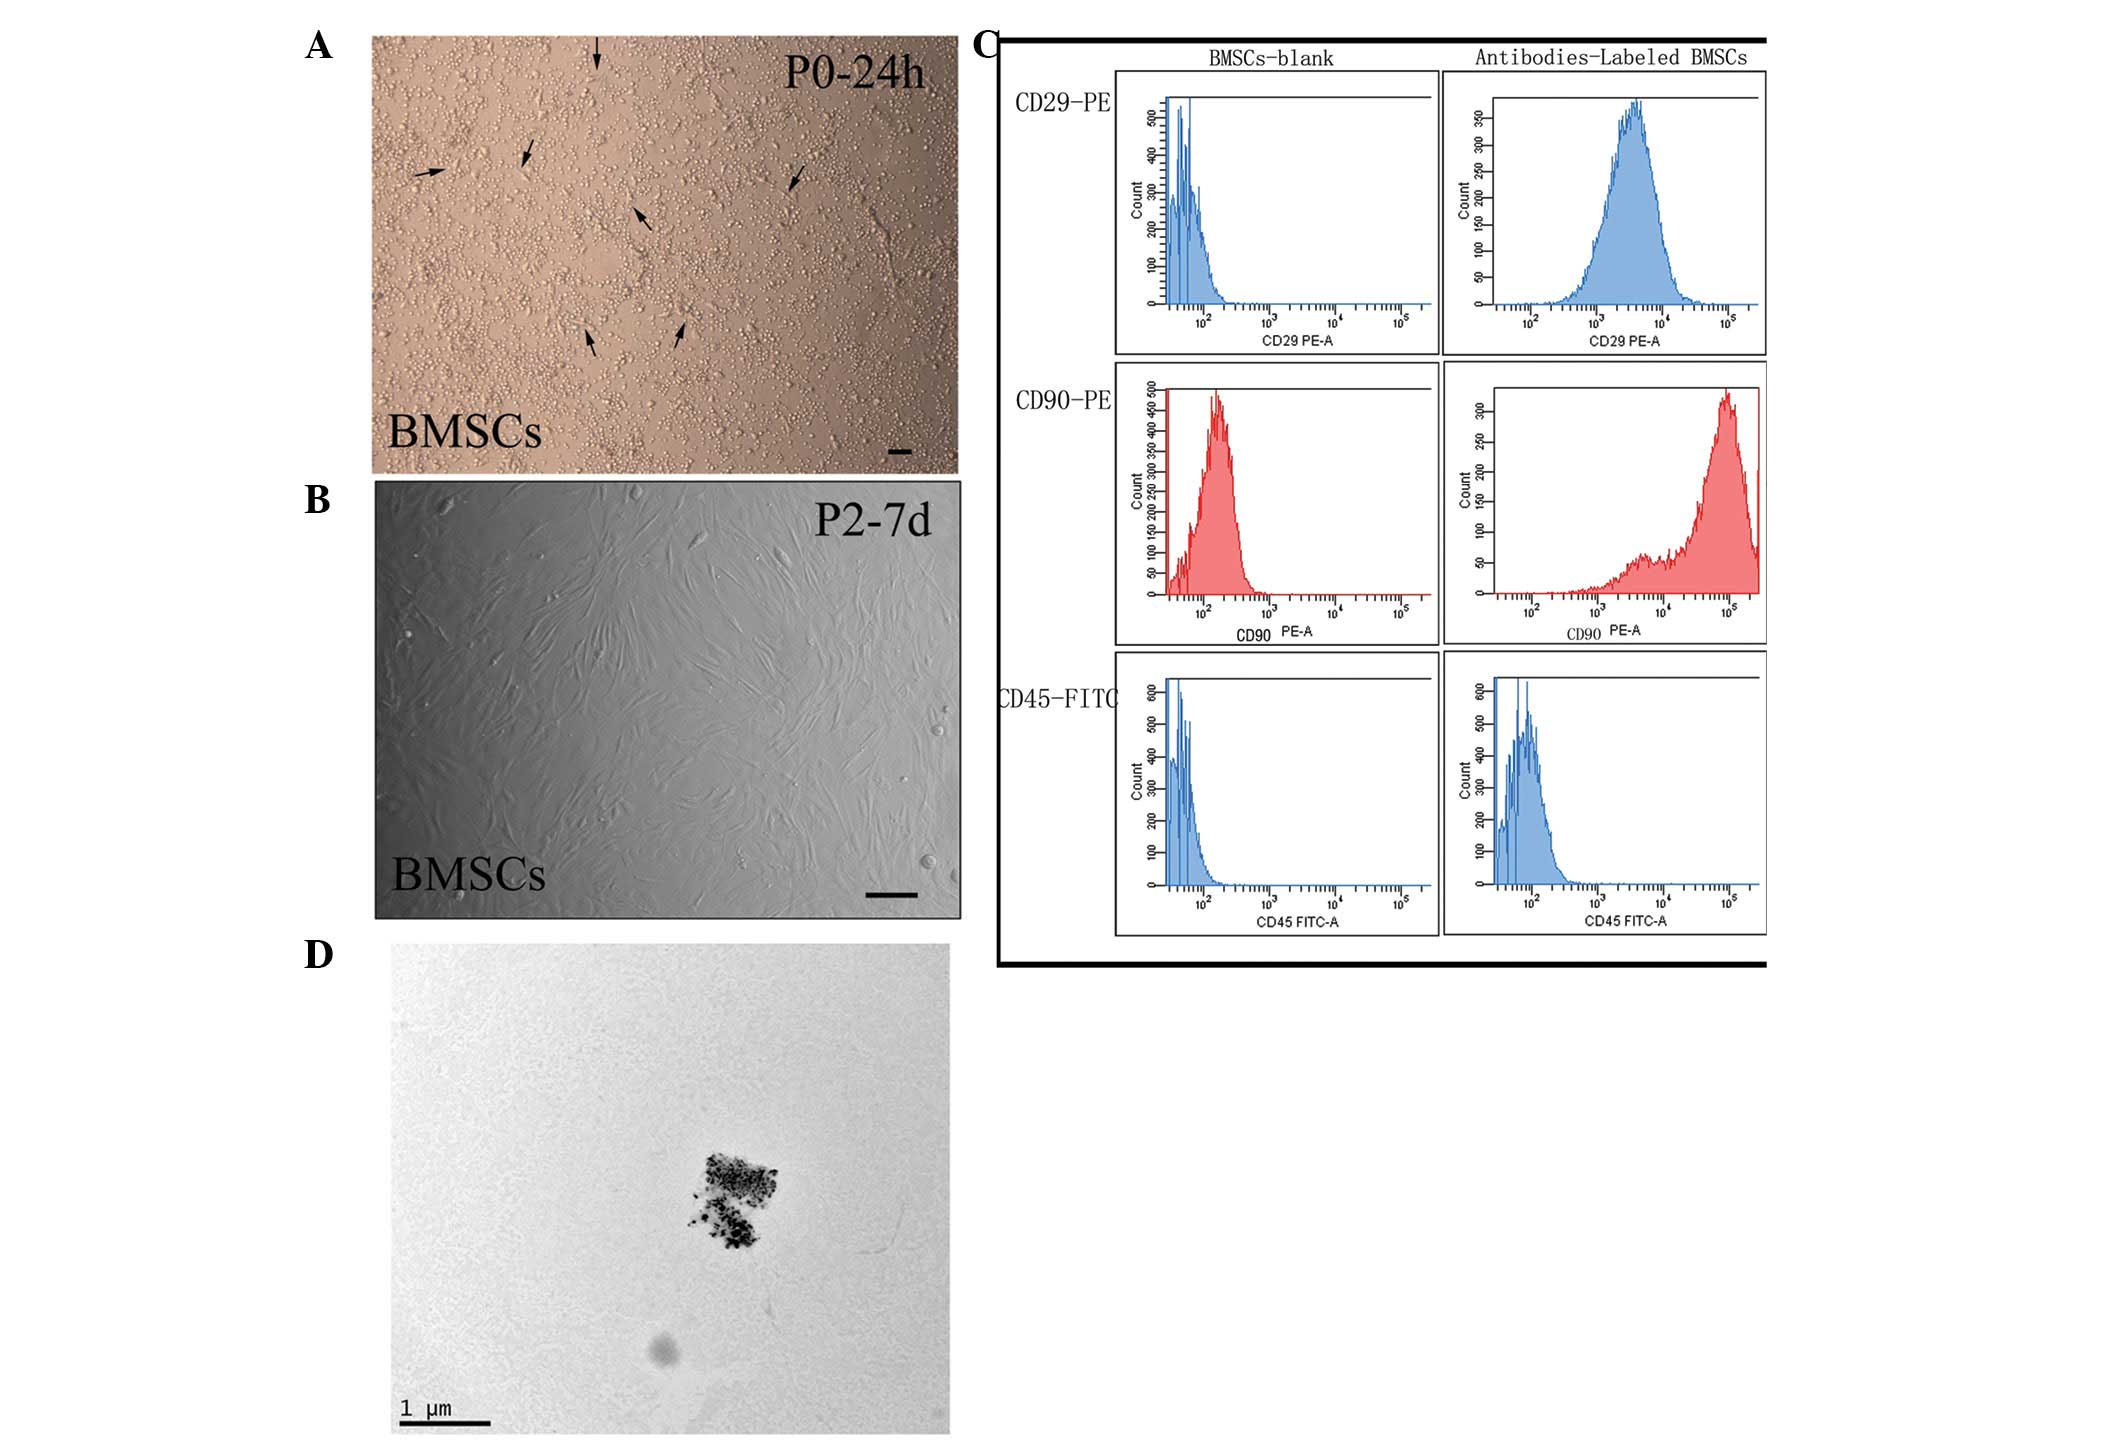 | Figure 1Morphology of cultured BMSCs and the
physical characteristics of gadodiamide. (A and B) Morphology of
cultured BMSCs. (A) Following 24-h of culture in Dulbecco’s
modified Eagle’s medium/F12 medium, the number of adherent cells
increased gradually and exhibited a spindle-shaped morphology,
indicated by the black arrows. (B) At passage 2, the cells became
homogeneous in morphology. (C) Fluoresnce-activated cell sorting
analysis confirmed that the BMSCs homogeneously expressed specific
surface antigens. The BMSCs were observed to be positive for CD29
and CD90, but negative for CD45. (D) Via transmission electron
microscopy, gadodiamide was observed to be composed of black and
dense gadolinium particles, of which the diameter was identified to
be ~0.04 μm. (A and B, scale bar = 100 μm; D, scale
bar = 1 μm). BMSCs, bone marrow stromal cells; TEM,
transmission electron microscopy. |
TEM
According to TEM analysis, the diameter of the black
and dense gadolinium particles was observed to be ~0.04 μm
(Fig. 1D).
Cellular uptake and localization of
gadodiamide
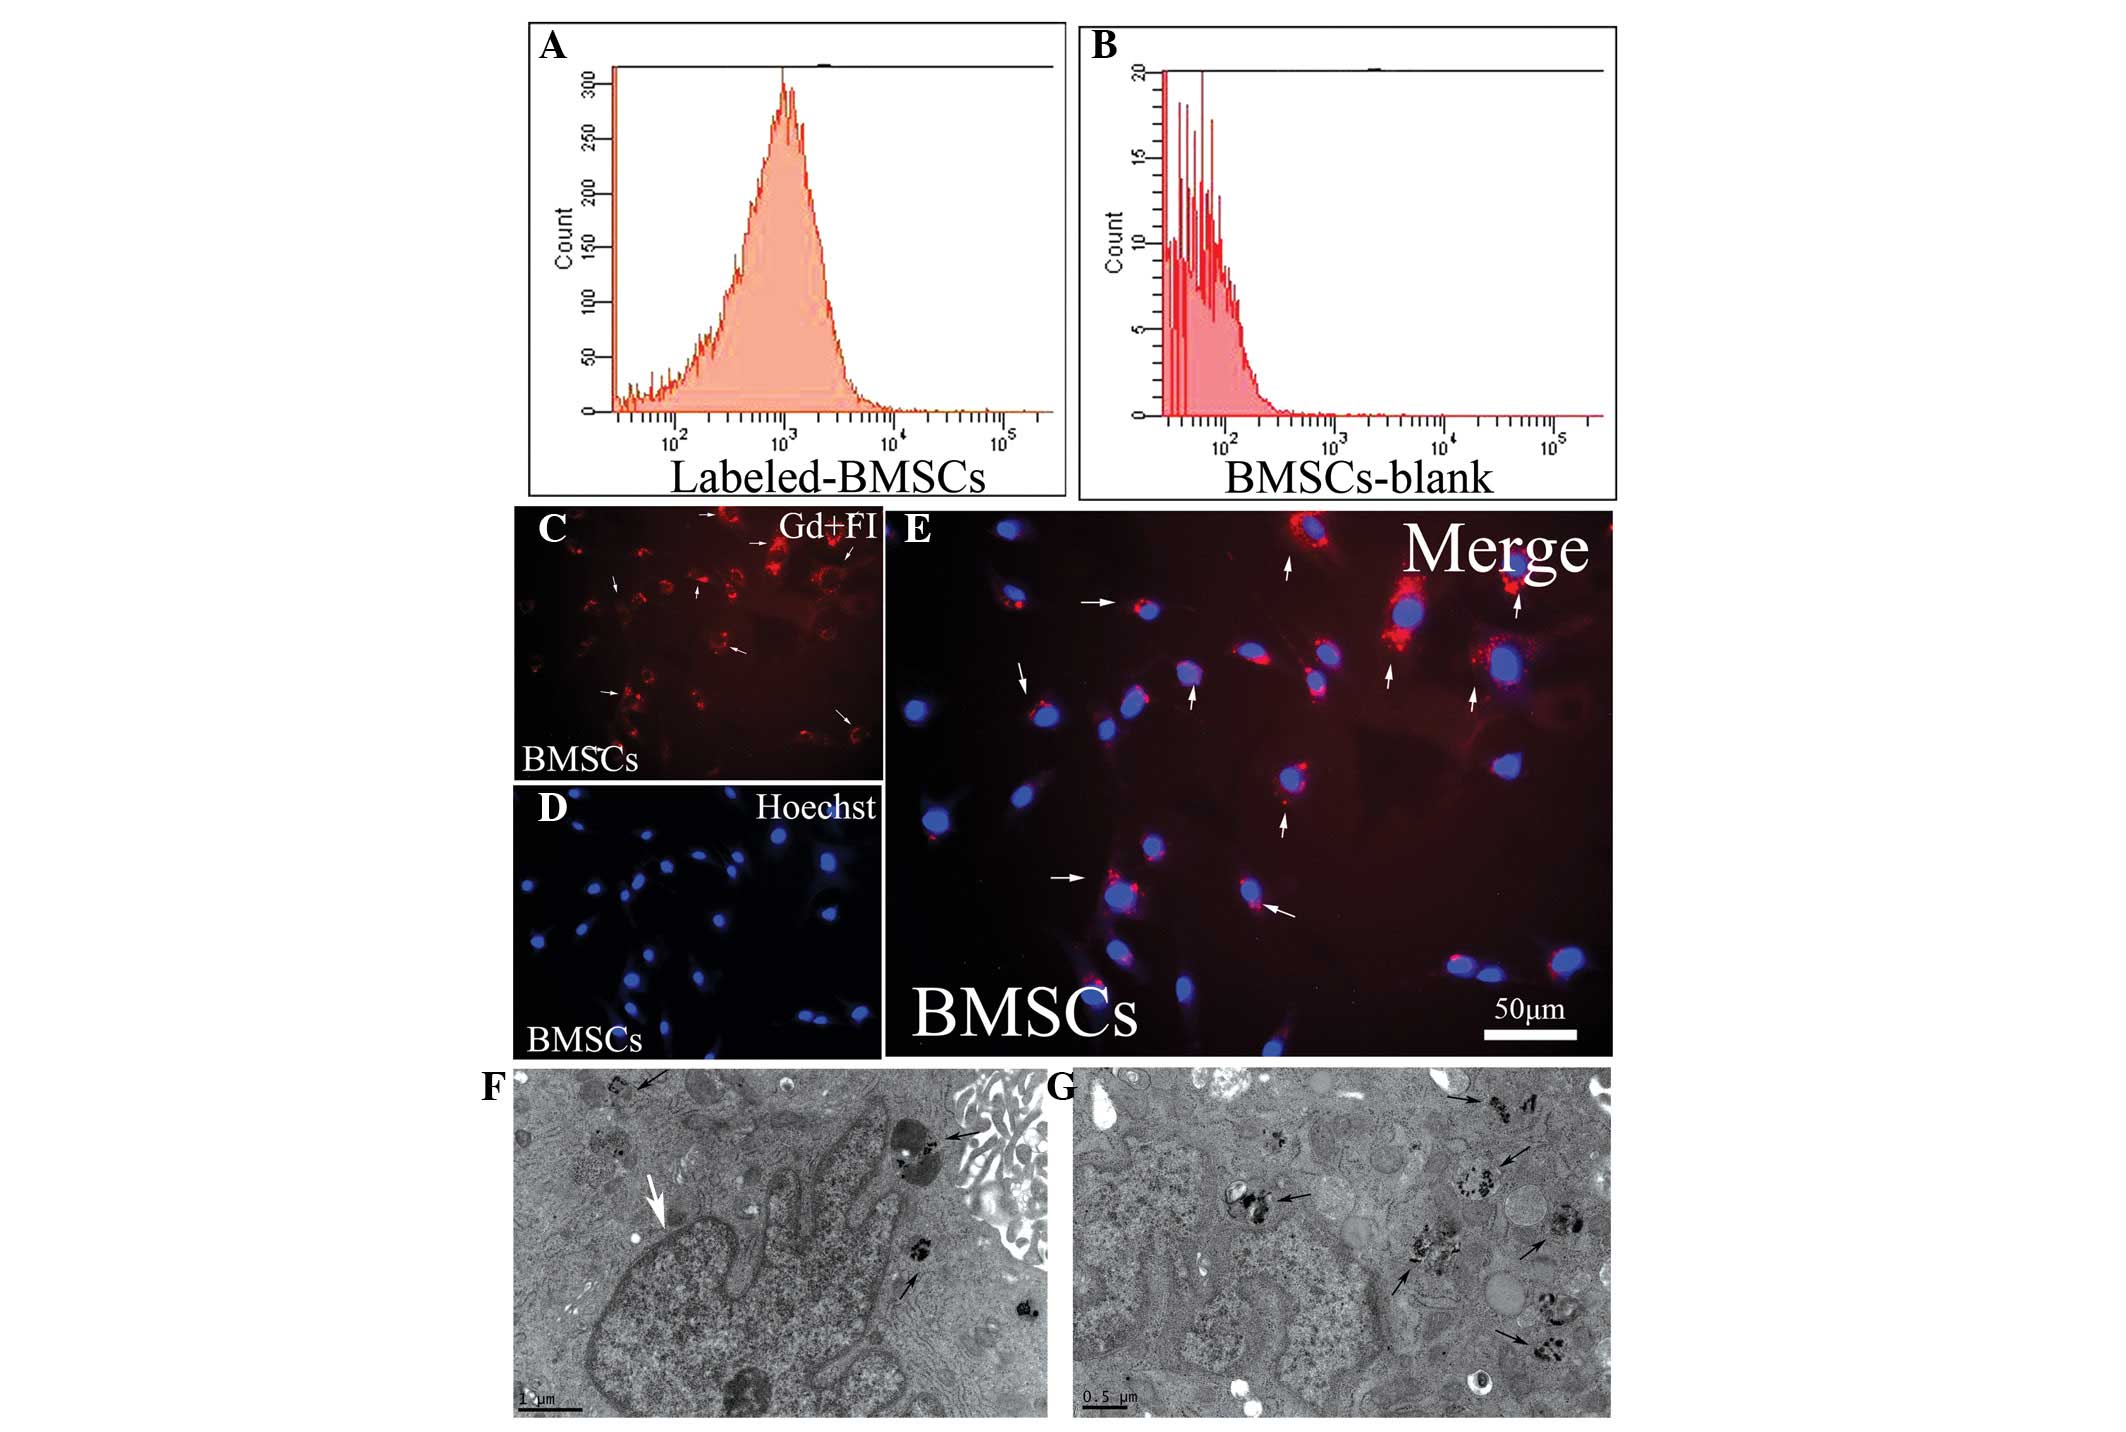
Flow cytometric analysis was used to detect the
rhodamine-fluorescence ratio of gadodiamide-labeled cells (Fig. 2A) with unlabeled cells as a control
(Fig. 2B). The positive labeling
rate was 44.95±2.42% (n=3). As observed under an inverted
fluorescence microscope, FI-Arrest In agent combined with Gd (red)
was present within the cytoplasm and around the blue-stained cell
nuclei (Fig. 2C–E). Under the
transmission electron microscope, the black and dense gadolinium
particles were clearly observed. They were sporadic or confluent
within the cytoplasm of labeled cells (Fig. 2F and G); however, none were
observed in the control group.
Characteristics of labeled BMSCs
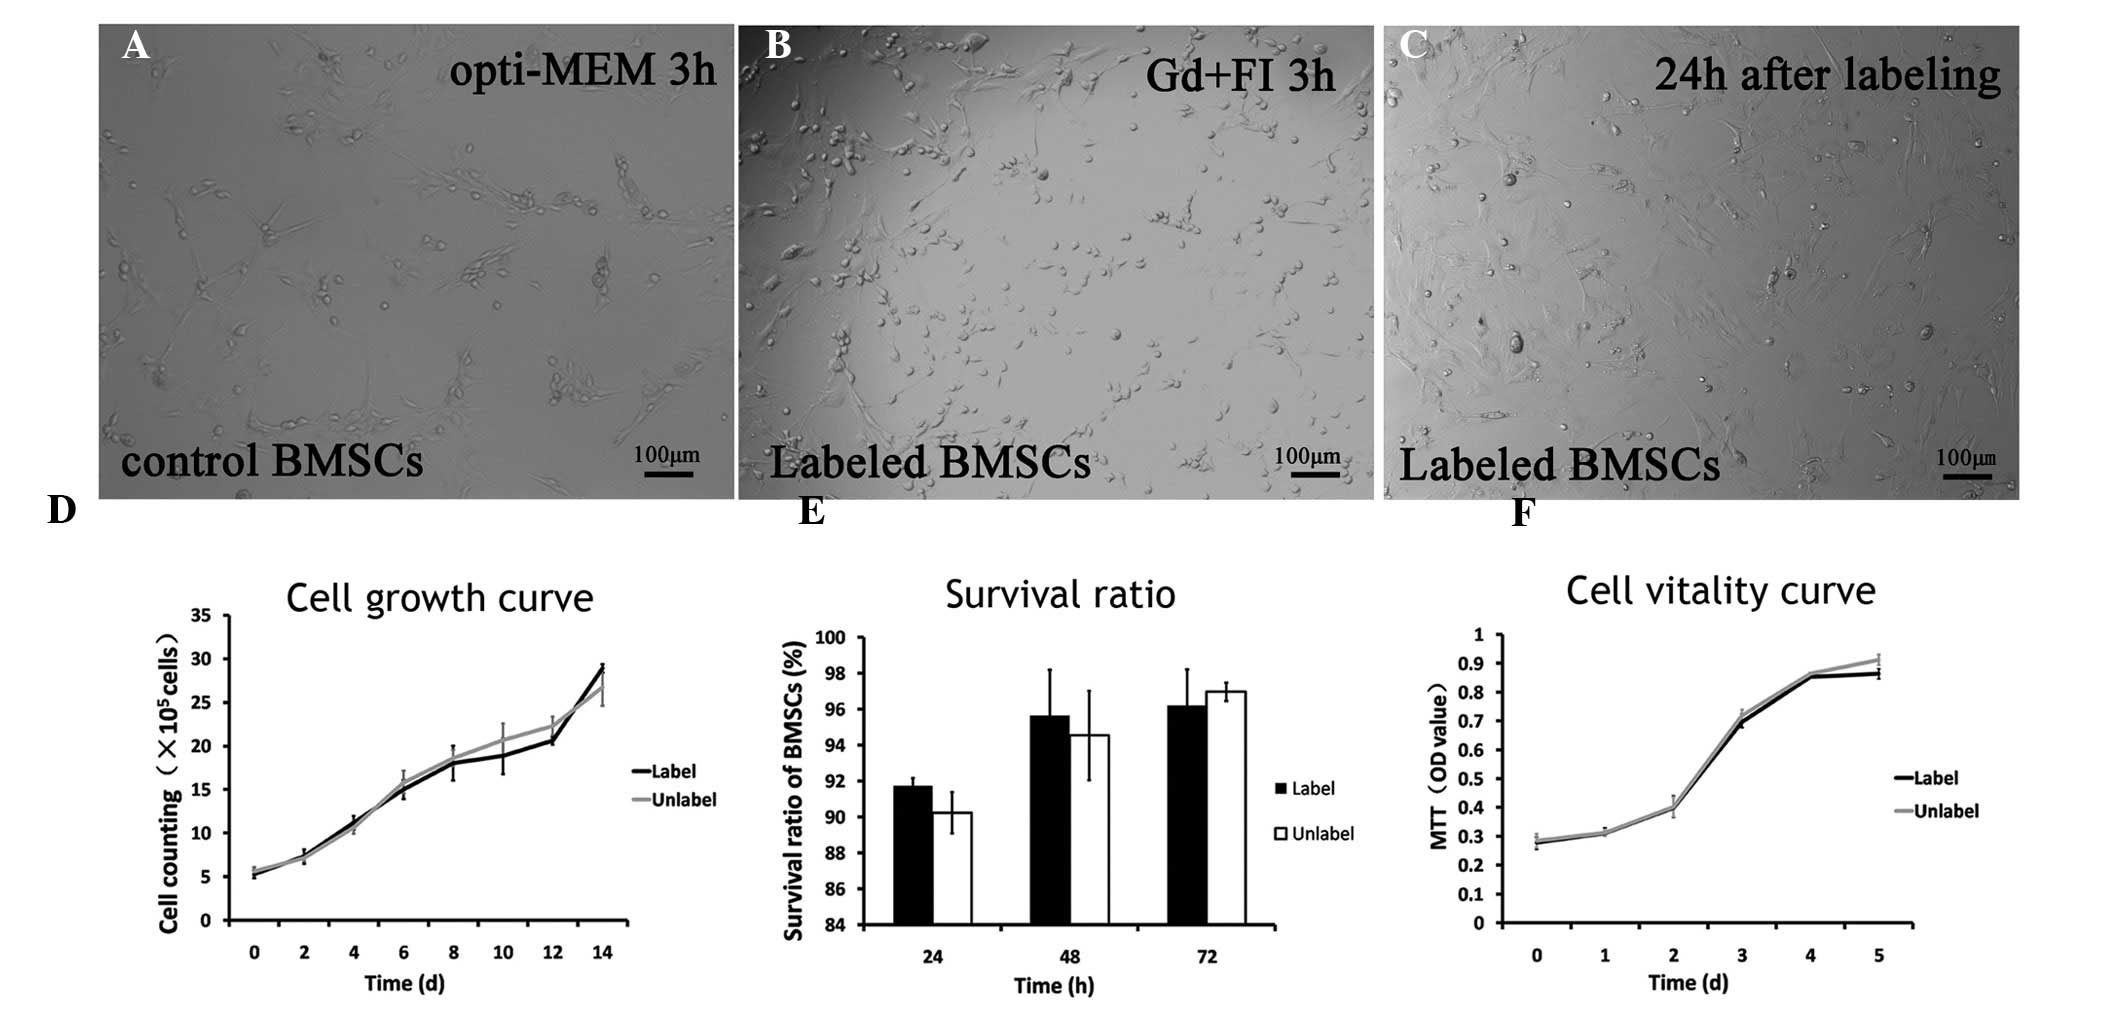
Following incubation for 3 h in vitro, BMSCs
were observed under the inverted microscope. The cells in the
experimental (labeled with Gd + FI for 3 h) and control (incubated
with opti-MEM medium only) groups were observed to be similar in
morphology and growth density (Fig.
3A–B). The cells were adherent to the wall of the culture flask
and exhibited spindle-shaped morphology. Subsequently, the labeling
solution was removed and DMEM/F12 containing 10% FBS was placed
into a culture flask. Labeled cells were observed following
incubation for 24 h (Fig. 3C). The
adherent cells grew, and the number of cells was markedly
increased.
Evaluation by trypan blue exclusion analysis
identified no significant difference in the growth rate between the
labeled and unlabeled BMSCs (P>0.05) from 0–14 days subsequent
to cell labeling (Fig. 3D). The
growth curve demonstrated that the total number of cells in the
labeled and unlabeled groups increased in a time-dependent manner,
particularly during 2–8 days following cell labeling. No
significant difference was observed in the survival ratio between
labeled cells and the control group at 24, 48 and 72 h (Fig. 3E). The MTT-based cell viability
evaluation confirmed that optical density values increased with the
number of cells. There was no statistically significant difference
between labeled and unlabeled BMSCs (P>0.05) 0–5 days following
cell labeling (Fig. 3F). At the
same time interval, the cell proliferation ratio in the
experimental and control groups reduced gradually with prolongation
of survival time, but remained >95%.
In vitro MRI studies of BMSCs labeled
with gadodiamide
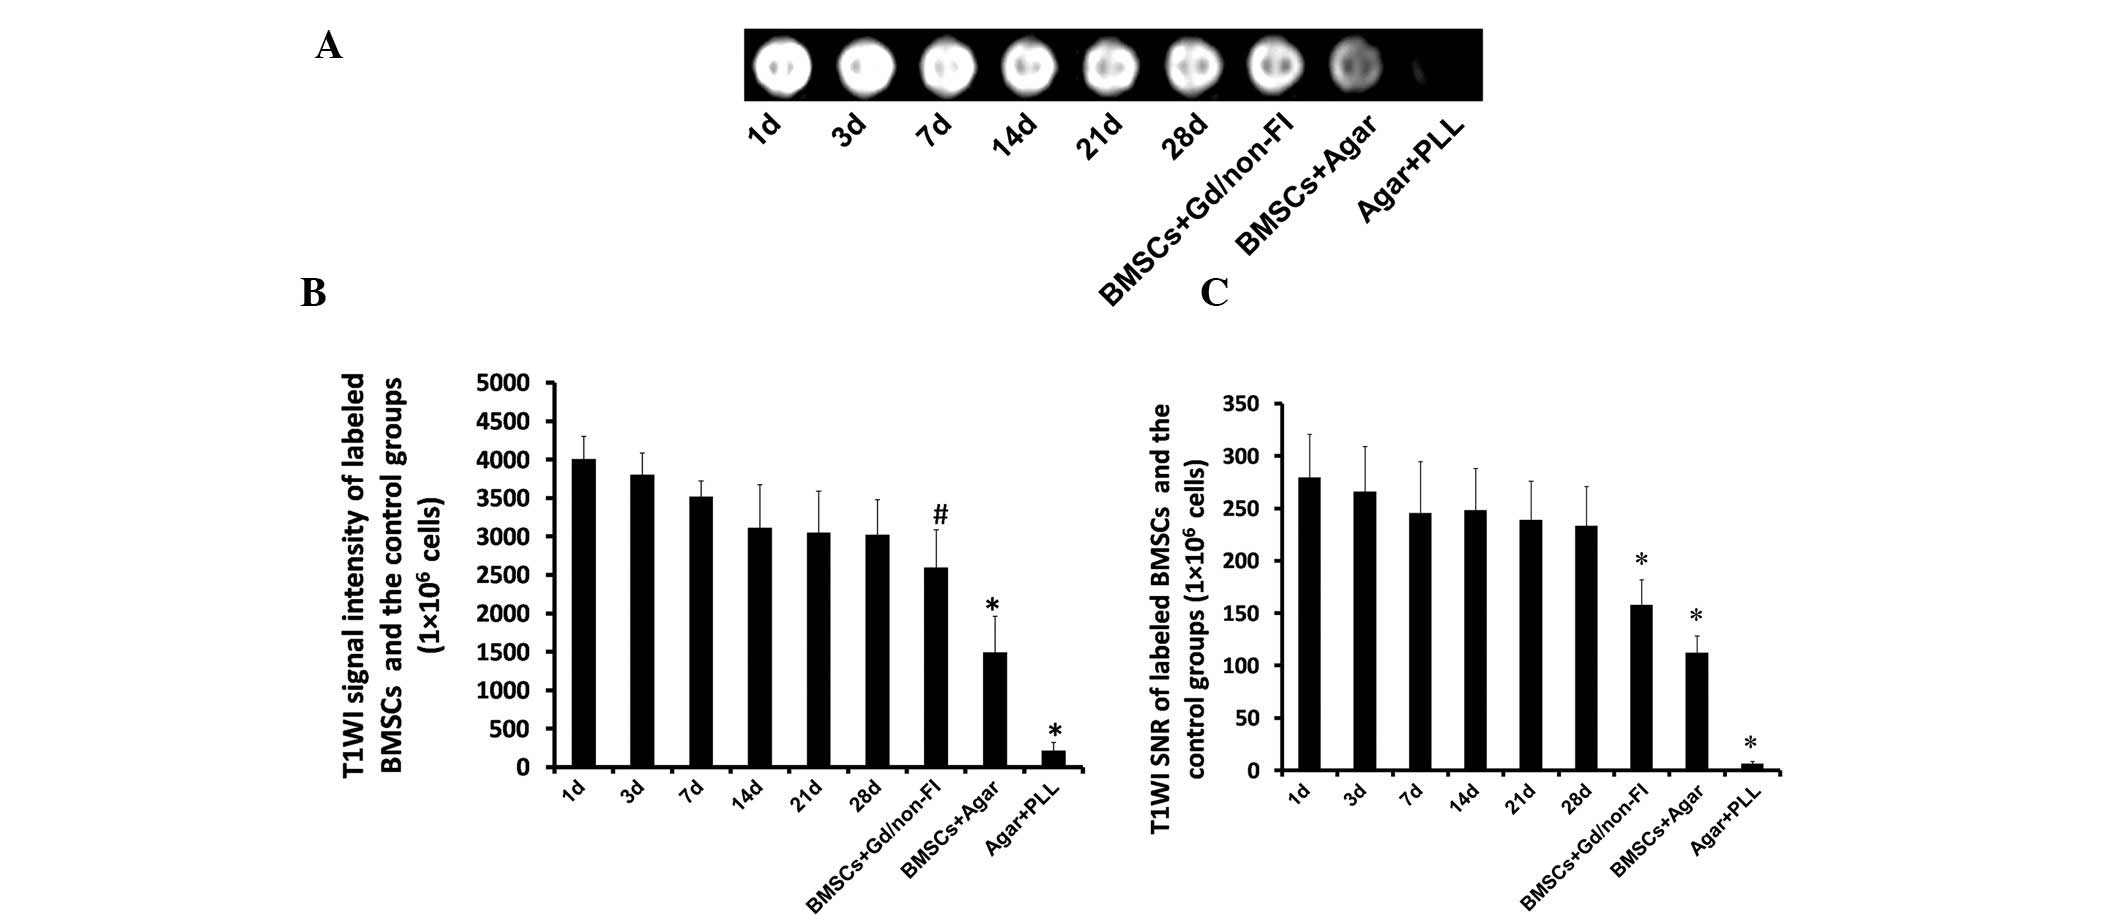
BMSCs labeled with the gadodiamide-FI Arrest In
complex (Gd + FI) particles at different time-points were scanned
using an MRI detector with spin echo in vitro. The minimal
number of detectable cells was 5×10⁴. The results
demonstrated that at 1, 3, 7, 14, 21 and 28 days following cell
labeling, the signal was enhanced as shown by increased T1WI and
SNR compared with those in the control groups. The T1WI and
relevant SNR of BMSCs were attenuated with cell division and
proliferation (Fig. 4A).
Significant differences were observed between the control (BMSCs +
Agar) and experimental groups on days 1–28 with regard to T1WI
signal enhancement and SNR (P<0.05; Fig. 4B and C; Table I). MRI signal intensity in the
labeled groups at 1, 3 and 7 days subsequent to cell labeling were
higher than those of BMSCs treated with gadodiamide but without FI
Arrest In reagent (BMSCs + Gd/non-FI; P<0.05; Fig. 4B). Among the labeled cells, signal
intensity slightly decreased with time (days 1–28; however, these
differences were not statistically significant (Fig. 4B–C).
 | Table IT1WI signal intensity and SNR for
different times of Gd/FI-labeled BMSCs and the control groups
(1×10⁶ cells). |
Table I
T1WI signal intensity and SNR for
different times of Gd/FI-labeled BMSCs and the control groups
(1×10⁶ cells).
| BMSCs | T1WI | SNR |
|---|
| BMSCs labeled with
Gd/FI composite |
| 1
day | 4001.37±296.58 | 279.05±41.24 |
| 3
days | 3801.28±282.33 | 265.58±43.20 |
| 7
days | 3511.6±211.00 | 245.30±49.00 |
| 14 days | 3105.63±564.39 | 248.04±39.97 |
| 21 days | 3042.12±460.05 | 238.42±37.17 |
| 28 days | 3015.55±460.05 | 233.00±37.56 |
| BMSCs + Gd/non-FI
(1 d) |
2589.45±494.03a |
157.53±24.09b |
| BMSCs + Agar |
1489.91±471.78b |
112.01±16.26b |
| Agar + PLL |
207.18±109.36b | 6.29±1.82b |
Discussion
In order to use stem cells for the treatment of
disease, their molecular biological characteristics, gene
expression profiles and signaling pathways are required to be
studied and methods of stem cell modification need to be developed;
furthermore, stem cell tracing studies are required to investigate
the cellular migration in the body (30,31).
The purpose of the present study was to investigate a novel and
safe cell labeling strategy for a basic MRI contrast agent in order
to provide access to a novel clinical MRI tracking method of
BMSCs.
Superparamagnetic iron oxide and ultra small
super-paramagnetic iron oxide predominantly shortens the T2 and
T2* relaxation time (3233–34).
Using conventional MRI contrast agents, it is difficult to
distinguish stem cells from air, post-operative bleeding and iron
signals originating from red blood cells (35,36).
These effects lead to distortion and misinterpretation of MRI
tracing of stem cells. In the clinic, as opposed to iron-based
contrast agents, cellular labeling with gadolinium chelates is more
permanent, and their use is safer and more economical (37,38).
It is physically and chemically stable (39), and is easily dissolved in water but
is not ionized. Gadodiamide can be filtrated and eliminated through
the glomerulus quickly; thus, it does not accumulate to a toxic
level in vivo (40).
Gadodiamide has advantages over other particles due to its
non-ionic characteristics, low osmotic pressure and high lethal
dose (26,41). More importantly, its efficacy,
safety and tolerance are similar or even superior to those of
Gd-DTPA, which was confirmed by animal and human clinical trials in
previous studies (41–44). In 1996, gadodiamide was first
described to be a safe and effective marker of the nervous system
of children (45). Several studies
indicated that gadodiamide had a relatively low thermodynamic
stability constant and conditional stability constant in
vitro (4647–48).
However, as these studies were conducted in vitro, they did
not effectively reflect physiological conditions. Another study
assessed the gadolinium concentration in organs of rats following
gadodiamide injection; however, this did not give sufficient
information on the separation degree between gadolinium and ligand
in vivo (49). The FDA has
approved the use of gadodiamide/Omniscan for the enhancment of MRI
images of human tissues and organs in vivo, particularly for
cranial, spinal and peripheral nerves (50). However, to date, only few studies
have focussed on stem cell labeling with non-ionic gadolinium,
including gadodiamide (44,51).
In the present study, fluorescent Arrest-In
transfection reagent was used to form a composite with gadodiamide
as a novel method for cell labeling. FI Arrest-In was originally
formulated for short hairpin RNA transfection and is a
polyethylenimine-based lipopolymeric formulation, which is combined
with a rhodamine fluorescent element and transfection reagent.
Through the orthogonal test, the optimized cell uptake
concentration and incubating time were determined to help reduce
cytotoxicity. The delivery and localization of the Gd + FI
composite in the BMSCs was confirmed by flow cytometric analysis
and inverted fluorescence microscopy. In addition, tracing of Gd +
FI-labeled cells by MRI was successfully performed in vitro,
achieving the goal of real-time dual imaging. Compared with
previous studies (525354–55),
the present study used a novel cell uptake method to reduce
labeling steps and the quantity of reagents required, and improve
laboratory safety. In the present study, no effects of gadodiamide
on the cell viability and proliferation of BMSCs were observed
in vitro.
In the present study MRI was able to effectively
detect the labeled BMSCs. The minimum number of cells able to be
detected by the MRI scanner was 5×10⁴ cells, which was
similar to results reported in a previous study (55); however, the dosage of MRI contrast
agent was only two-thirds of that. As Gd + FI composites were
located in the cytoplasm of labeled cells, the concentration of
gadolinium reduced as the cells divided (56). Therefore, the MRI detection time
was limited. Although signal intensity was suggested to gradually
reduce with labeling time, the signal and signal-to-noise ratio
were observed to be higher in the experimental cells than those in
the blank cells (BMSCs + Agar), and the signal remained
sufficiently high 28 days subsequent to cell labeling in
vitro. The T1WI signal for the MSCs + Gd/non-FI groups was
higher than that of the blank cells. This demonstrated that stem
cells were able to absorb small amounts of contrast agent through
direct phagocytosis. However, the T1WI signal and SNR of labeled
cells at 1, 3 and 7 days following cell uptake was higher than
those at 1 day in the MSCs + Gd/non-FI groups. This suggested that
cell labeling using the FI-Arrest In reagent led to increased
cellular uptake of gadodiamide as compared with direct phagocytosis
of cells, leading to an enhancement of the MRI signal.
In conclusion, by combining the clinically used Gd
chelate gadodiamide (Omniscan) and a rhodamine-conjugated
transfection reagent to form composites, a novel, effective,
practical and rapid labeling protocol for stem cells was
successfully developed using BMSCs from neonatal SD rats. Those
labeled cells were detected using a conventional clinical MRI
system in vitro, providing a foundation for BMSCs tracing
in vivo in the future.
Acknowledgments
The current study was supported by grants from the
National Natural Science Foundation of China (grant nos. 81070995
and 31171290); the Doctoral Research Foundation of the Ministry of
Education, China (grant no. 20110171110048); the Natural Science
Foundation of Guangdong Province (grant no. S2012010009215); and
the Health Bureau Foundation of Zhuhai City (grant no.
2014108).
References
|
1
|
Aggarwal S and Pittenger MF: Human
mesenchymal stem cells modulate allogeneic immune cell responses.
Blood. 105:1815–1822. 2005. View Article : Google Scholar
|
|
2
|
Di Nicola M, Carlo- Stella C, Magni M, et
al: Human bone marrow stromal cells suppress T- lymphocyte
proliferation induced by cellular or nonspecific mitogenic stimuli.
Blood. 99:3838–3843. 2002. View Article : Google Scholar : PubMed/NCBI
|
|
3
|
Pittenger MF, Mackay AM, Beck SC, et al:
Multilineage potential of adult human mesenchymal stem cells.
Science. 284:143–147. 1999. View Article : Google Scholar : PubMed/NCBI
|
|
4
|
Charbord P: Bone marrow mesenchymal stem
cells: Historical overview and concepts. Hum Gene Ther.
21:1045–1056. 2010. View Article : Google Scholar : PubMed/NCBI
|
|
5
|
Yamaguchi Y, Ohno J, Sato A, Kido H and
Fukushima T: Mesenchymal stem cell spheroids exhibit enhanced
in-vitro and in-vivo osteoregenerative potential. BMC Biotechnol.
14:1052014. View Article : Google Scholar : PubMed/NCBI
|
|
6
|
Stock P, Brückner S, Winkler S, Dollinger
MM and Christ B: Human bone marrow mesenchymal stem cell-derived
hepatocytes improve the mouse liver after acute acetaminophen
intoxication by preventing progress of injury. Int J Mol Sci.
15:7004–7028. 2014. View Article : Google Scholar : PubMed/NCBI
|
|
7
|
Yazawa T, Imamichi Y, Miyamoto K, Umezawa
A and Taniguchi T: Differentiation of mesenchymal stem cells into
gonad and adrenal steroidogenic cells. World J Stem Cells.
6:203–212. 2014. View Article : Google Scholar : PubMed/NCBI
|
|
8
|
Lim IJ and Phan TT: Epithelial and
mesenchymal stem cells from the umbilical cord lining membrane.
Cell Transplant. 23:497–503. 2014. View Article : Google Scholar : PubMed/NCBI
|
|
9
|
Sykova E, Urdzkova L, Jendelova P, et al:
Bone marrow cells-a tool for spinal cord injury repair. Exp Neurol.
193:2612–2620. 2005.
|
|
10
|
Ukai R, Honmou O, Harada K, Houkin K,
Hamada H and Kocsis JD: Mesenchymal stem cells derived f rom
peripheral blood protects against ischemia. J Neurotrauma.
24:508–520. 2007. View Article : Google Scholar : PubMed/NCBI
|
|
11
|
Bajek A, Olkowska J and Drewa T:
Mesenchymal stem cells as a therapeutic tool in tissue and organ
regeneration. Postepy Hig Med Dosw (Online). 65:124–132. 2011.In
Polish. View Article : Google Scholar
|
|
12
|
Kalmar B, Burnstock G, Vrbová G, Urbanics
R, Csermely P and Greensmith L: Upregulation of heat shock proteins
rescues motoneurones from axotomy-induced cell death in neonatal
rats. Exp Neurol. 176:87–97. 2002. View Article : Google Scholar : PubMed/NCBI
|
|
13
|
Aoki S, Su Q, Li H, et al: Identification
of an axotomy- induced glycosylated protein, AIGP1, possibly
involved in cell death triggered by endoplasmic reticulum- Golgi
stress. J Neurosci. 22:10751–10760. 2002.PubMed/NCBI
|
|
14
|
Sng J and Lufkin T: Emerging stem cell
therapies: Treatment, safety, and biology. Stem Cells Int.
2012:5213432012. View Article : Google Scholar : PubMed/NCBI
|
|
15
|
Lescroart F and Meilhac SM: Cell lineages,
growth and repair of the mouse heart. Results Probl Cell Differ.
55:263–289. 2012.PubMed/NCBI
|
|
16
|
Hefferan MP, Galik J, Kakinohana O, et al:
Human neural stem cell replacement therapy for amyotrophic lateral
sclerosis by spinal transplantation. PLoS One. 7:e426142012.
View Article : Google Scholar : PubMed/NCBI
|
|
17
|
Zhang L, Zheng H, Shao H, et al: Long-term
therapeutic effects of mesenchymal stem cells compared to
dexa-methasone on recurrent experimental autoimmune uveitis of
rats. Invest Ophthalmol Vis Sci. 55:5561–5571. 2014. View Article : Google Scholar : PubMed/NCBI
|
|
18
|
Weissleder R: Molecular imaging: Exploring
the next frontier. Radiology. 212:609–614. 1999. View Article : Google Scholar : PubMed/NCBI
|
|
19
|
Shen J, Duan XH, Cheng LN, et al: In
vivoMR imaging tracking of transplanted mesenchymal stem cells in a
rabbit model of acute peripheral nerve traction injury. J Magn
Reson Imaging. 32:1076–1085. 2010. View Article : Google Scholar : PubMed/NCBI
|
|
20
|
Browaeys P, Larson TL, Wong ML and Patel
U: Can MRI replace CT in evaluating semicircular canal dehiscence?
AJNR Am J Neuroradiol. 34:1421–1427. 2013. View Article : Google Scholar : PubMed/NCBI
|
|
21
|
Kato H, Kanematsu M, Watanabe H, Mizuta K
and Aoki M: Metastatic retropharyngeal lymph nodes: Comparison of
CT and MR imaging for diagnostic accuracy. Eur J Radiol.
83:1157–1162. 2014. View Article : Google Scholar : PubMed/NCBI
|
|
22
|
Ikeno S, Suzuki MO, Muhsen M, et al:
Sensitive detection of measles virus infection in the blood and
tissues of humanized mouse by one-step quantitative RT-PCR. Front
Microbiol. 4:2982013. View Article : Google Scholar : PubMed/NCBI
|
|
23
|
Skidan I and Steiniger SC: In vivomodels
for cancer stem cell research: A practical guide for frequently
used animal models and available biomarkers. J Physiol Pharmacol.
65:157–169. 2014.PubMed/NCBI
|
|
24
|
Samanta A, Das RK, Park SJ, Maiti KK and
Chang YT: Multiplexing SERS nanotags for the imaging of
differentiated mouse embryonic stem cells (mESC) and detection of
teratoma in vivo. Am J Nucl Med Mol Imaging. 4:114–124.
2014.PubMed/NCBI
|
|
25
|
Salamon J, Wicklein D, Didié M, et al:
Magnetic resonance imaging of single co-labeled mesenchymal stromal
cells after intracardial injection in mice. Rofo. 186:367–376.
2014. View Article : Google Scholar : PubMed/NCBI
|
|
26
|
Maravilla KR, Maldjian JA, Schmalfuss IM,
et al: Contrast enhancement of central nervous system lesions:
Multicenter intraindividual crossover comparative study of two MR
contrast agents. Radiology. 240:389–400. 2006. View Article : Google Scholar : PubMed/NCBI
|
|
27
|
Sugiyama S, Saito R, Nakamura T, et al:
Safety and feasibility of convection- enhanced delivery of
nimustine hydrochloride co- infused with free gadolinium for real-
time monitoring in the primate brain. Neurol Res. 34:581–587. 2012.
View Article : Google Scholar : PubMed/NCBI
|
|
28
|
Soleimani M and Nadri S: A protocol for
isolation and culture of mesenchymal stem cells from mouse bone
marrow. Nat Protoc. 4:102–106. 2009. View Article : Google Scholar : PubMed/NCBI
|
|
29
|
Pollard H, Remy JS, Loussouarn G,
Demolombe S, Behr JP and Escand D: Polyethylenimine but not
cationic lipids promotes transgene delivery to the nucleus in
mammalian cells. J Biol Chem. 273:7507–7511. 1998. View Article : Google Scholar : PubMed/NCBI
|
|
30
|
Ju Z, Jiang H, Jaworski M, et al: Telomere
dysfunction induces environmental alterations limiting
hematopoietic stem cell function and engraftment. Nat Med.
13:742–747. 2007. View
Article : Google Scholar : PubMed/NCBI
|
|
31
|
Markel TA, Crisostomo PR, Manukyan MC, et
al: Are neonatal stem cells as effective as adult stem cells in
providing ischemic protection? J Surg Res. 152:325–330. 2009.
View Article : Google Scholar
|
|
32
|
Delcroix GJ, Jacquart M, Lemaire L, et al:
Mesenchymal and neural stem cells labeled with HEDP- coated SPIO
nanoparticles: In vitro characterization and migration potential in
rat brain. Brain Res. 1255:18–31. 2009. View Article : Google Scholar
|
|
33
|
Tetsumura A, Nakamura S, Yoshino N, et al:
USPIO- enhanced MRI of highly invasive and highly metastasizing
transplanted human squamous cell carcinoma: An experimental study.
Dentomaxillofac Radiol. 41:55–63. 2012. View Article : Google Scholar
|
|
34
|
Reiner CS, Lutz AM, Tschirch F, et al:
USPIO-enhanced magnetic resonance imaging of the knee in
asymptomatic volunteers. Eur Radiol. 19:1715–1722. 2009. View Article : Google Scholar : PubMed/NCBI
|
|
35
|
Cunningham CH, Arai T, Yang PC, McConnell
MV, Pauly JM and Conolly SM: Positive contrast magnetic resonance
imaging of cells labled with magnetic nanoparticles. Magn Reson
Med. 53:999–1005. 2005. View Article : Google Scholar : PubMed/NCBI
|
|
36
|
Pintaske J, Martirosian P, Claussen CD and
Schick F: Positive contrast in the detection of magnetically
labeled cells by MRI - in vitro experiments. Biomed Tech (Berl).
50:271–276. 2005.In German. View Article : Google Scholar
|
|
37
|
Darvish Mohamadi T, Amanlou M,
Ghalandarlaki N, Mehravi B, Shafiee Ardestani M and Yaghmaei P:
Gd(3+)-DTPA-meglumine-anionic linear globular dendrimer G1: Novel
nanosized low toxic tumor molecular MR imaging agent. ISRN Pharm.
2013:3784522013.PubMed/NCBI
|
|
38
|
Sze G, Brant-Zawadzki M, Mcnamara MT, et
al: Use of the magnetic resonance contrast agent gadodiamide in the
central nervous system. Results of a multicenter trial. Invest
Radiol. 28(Suppl 1): S49–S55. 1993. View Article : Google Scholar : PubMed/NCBI
|
|
39
|
Chang CA: Magnetic resonance imaging
contrast agents. Design and physicochemical properties of
gadodiamide. Invest Radiol. 28(Suppl 1): S21–S27. 1993. View Article : Google Scholar : PubMed/NCBI
|
|
40
|
Kittner T, Rudolf J, Fages JF, et al:
Efficacy and safety of gadodiamide (Gd-DTPA-BMA) in renal
3D-magnetic resonance angiography (MRA): A phase II study. Eur J
Radiol. 64:456–464. 2007. View Article : Google Scholar : PubMed/NCBI
|
|
41
|
Knopp MV, Runge VM, Essig M, et al:
Primary and secondary brain tumors at MR imaging: Bicentric
intraindividual crossover comparison of gadobenate dimeglumine and
gadopentetate dimeglumine. Radiology. 230:55–64. 2004. View Article : Google Scholar
|
|
42
|
Gandhoke GS, Frassanito P, Chandra N, Ojha
BK and Singh A: Role of magnetic resonance ventriculography in
multiloculated hydrocephalus. J Neurosurg Pediatr. 11:697–703.
2013. View Article : Google Scholar : PubMed/NCBI
|
|
43
|
Gahramanov S, Muldoon LL, Li X and Neuwelt
EA: Improved perfusion MR imaging assessment of intracerebral tumor
blood volume and antiangiogenic therapy efficacy in a rat model
with ferumoxytol. Radiology. 261:796–804. 2011. View Article : Google Scholar : PubMed/NCBI
|
|
44
|
Brekke C, Williams SC, Price J, Thorsen F
and Modo M: Cellular multiparametric MRI of neural stem cell
therapy in a rat glioma model. Neuroimage. 37:769–782. 2007.
View Article : Google Scholar : PubMed/NCBI
|
|
45
|
Lundby B, Gordon P and Hugo F: MRI in
children given gadodiamide injection: Safety and efficacy in CNS
and body indications. Eur J Radiol. 23:190–196. 1996. View Article : Google Scholar : PubMed/NCBI
|
|
46
|
Cabella C, Crich SG, Corpillo D, et al:
Cellular labeling with Gd(III) chelates: Only high thermodynamic
stabilities prevent the cells acting as ‘sponges’ of
Gd3+ ions. Contrast Media Mol Imaging. 1:23–29. 2006.
View Article : Google Scholar : PubMed/NCBI
|
|
47
|
Baranyai Z, Pálinkás Z, Uggeri F, Maiocchi
A, Aime S and Brücher E: Dissociation kinetics of open- chain and
macrocyclic gadolinium(III)-aminopolycarboxylate complexes related
to magnetic resonance imaging: Catalytic effect of endogenous
ligands. Chemistry. 18:16426–16435. 2012. View Article : Google Scholar : PubMed/NCBI
|
|
48
|
Di Gregorio E, Gianolio E, Stefania R,
Barutello G, Digilio G and Aime S: On the fate of MRI Gd- based
contrast agents in cells. Evidence for extensive degradation of
linear complexes upon endosomal internalization. Anal Chem.
85:5627–5631. 2013. View Article : Google Scholar : PubMed/NCBI
|
|
49
|
Kindberg GM, Uran S, Friisk G, Martinsen I
and Skotland T: The fate of Gd and chelate following intravenous
injection of gadodiamide in rats. Eur Radiol. 20:1636–1643. 2010.
View Article : Google Scholar : PubMed/NCBI
|
|
50
|
Ekholm S, Jonsson E, Sandvik L, et al:
Tolerance and efficacy of Omniscan (gadodiamide injection) in MR
imaging of the central nervous system. Acta Radiol. 37:223–228.
1996. View Article : Google Scholar : PubMed/NCBI
|
|
51
|
Yoo SY, Kim JH, Eo H, Jeon TY, Sung KW and
Kim HS: Dynamic MRI findings and clinical features of benign
hyper-vascular hepatic nodules in childhood- cancer survivors. AJR
Am J Roentgenol. 201:178–184. 2013. View Article : Google Scholar : PubMed/NCBI
|
|
52
|
Daldrup-Link HE, Rudelius M, Metz S, et
al: Cell tracking with gadophrin- 2: A bifunctional contrast agent
for MR imaging, optical imaging, and fluorescence microscopy. Eur J
Nucl Med Mol Imaging. 31:1312–1321. 2004. View Article : Google Scholar : PubMed/NCBI
|
|
53
|
Himes N, Min JY, Lee R, et al: In vivoMRI
of embryonic stem cells in a mouse model of myocardial infarction.
Magn Reson Med. 52:1214–1219. 2004. View Article : Google Scholar : PubMed/NCBI
|
|
54
|
Shyu WC, Chen CP, Lin SZ, Lee YJ and Li H:
Efficient tracking of non- iron- labeled mesenchymal stem cells
with serial MRI in chronic stroke rats. Stroke. 38:367–374. 2007.
View Article : Google Scholar
|
|
55
|
Rudelius M, Daldrup-Link HE, et al: Highly
efficient paramagnetic labelling of embryonic and neuronal stem
cells. Eur J Nucl Med Mol Imaging. 30:1038–1044. 2003. View Article : Google Scholar : PubMed/NCBI
|
|
56
|
Shen J, Zhong XM, Duan XH, et al: Magnetic
resonance imaging of mesenchymal stem cells labeled with dual (MR
and fluorescence) agents in rat spinal cord injury. Acad Radiol.
16:1142–1154. 2009. View Article : Google Scholar : PubMed/NCBI
|