Introduction
There are several factors, particularly obesity,
which lead to intervertebral disc degeneration (IDD), which is the
predominant origin contributing to low back pain (LBP) (1,2).
These factors may lead to the disturbance of balance between
anabolism and catabolism in the extracellular matrix (ECM),
including type II collagen, type I collagen and proteoglycan
(predominantly aggrecan) (3,4). In
the disc, proteoglycan and collagen II are expressed predominantly
in the nucleus pulposus (NP). The balance of ECM metabolism is
regulated by catabolic enzymes, including matrix metalloproteinases
(MMPs), a disintegrin and metalloproteinase with thrombospondin
motifs (ADAMTS) and their inhibitors, secreted by the
intervertebral disc cells, which determine the progression of IDD
(5). The catabolic enzymes, which
degrade components of the ECM can disturb this balance and impair
ECM turnover (5–7). In addition, the well-known
pro-inflammatory mediator, interleukin (IL)-1β can induce disc
degeneration, in part, via upregulation of the destructive enzymes
(8). In the present study, IL-β
was used in combination with leptin to confirm the effect of leptin
on the levels of degeneration-associated genes.
Leptin, a 16kDa peptide hormone, is predominantly
secreted by the adipose tissue, which regulates obesity and is one
of the factors contributing to IDD (2). Leptin can regulate energy
homeostasis, including food intake, and can also exert its effect
as an endocrine hormone on immune function, bone formation and
neuroendocrine function (9–12).
Previously, the presence of leptin and its acceptors has been
confirmed in human NP and annulus fibrosus (AF) cells in several
studies (13,14). In addition, it has been suggested
that leptin may be important in modulating the expression of
catabolic enzymes in chondrocytes (15,16).
Leptin, alone or in combination with IL-1β has been observed to
increase the levels of MMP-1, MMP-3 and MMP-13 in human
osteoarthritic cartilage and chondrocytes (15,16).
Furthermore, leptin mediates the inflammatory activities of the
chondrocytes, in which the expression levels of IL-1β, nitric oxide
and IL-8 are elevated (17,18).
To the best of our knowledge, the biochemical properties of NP
cells are similar to those of chondrocytes, however, the effect of
leptin on the catabolic enzymes within the NP cells remains to be
fully elucidated. The present study hypothesized that leptin
enhances the levels of catabolic genes and impairs the synthesis of
proteoglycan and collagen II.
The leptin receptors, as products of the diabetes
gene, are comprised of five forms, including long (OB-Rb), short
(OB-Ra, -Rc, and -Rd), and soluble (OB-Re) receptors (18,19).
However, the OB-Rb receptor, regarded as the predominant functional
receptor, mediates the most biological effects of leptin with the
assistance of the other forms within the body (20). In the disc and NP cells, the
presence of OB-Rb and OB-Ra has been demonstrated (21). When binding with the receptors,
leptin, considered pro-inflammatory and pro-catabolic factor in
certain cells, activates several signaling pathways, including the
MAPK (c-Jun-N-terminal kinase, extracellular signal-regulated
kinase and P38) pathways, and the protein kinase C,
phosphatidylinositol 3-kinase (PI3K)/Akt, Janus kinase
(JAK)2/signal transducer and activator of transcription (STAT)3 and
nuclear factor (NF)-κB pathways. Since the MAPK, JAK2/STAT3 and Akt
pathways are present in chondrocytes (15,16),
the present study examined whether these pathway were involved in
gene expression in NP cells.
The present study aimed to determine whether leptin,
alone or in combination with IL-β, regulates catabolic metabolism
in NP cells using reverse transcription-quantitative polymerase
chain reaction (RT-q-PCR) and western blotting. The present study
then aimed to detect the mechanism by which leptin exerts its
effect via the use of specific pathway inhibitors.
Materials and methods
Materials
The pathway inhibitors were all obtained from Merck
Millipore (Nottingham, UK). IL-1β, recombinant rat leptin and
Alcian blue were acquired from Sigma-Aldrich (St. Louis, MO, USA).
The agents used for cell culture were all purchased from Gibco Life
Technologies, Carslbad, CA, USA). The primary antibodies against
collagen II and cytokeratin 19 were from Abcam (Cambridge, UK), and
those against the protein of the signaling pathways were from Cell
Signaling Technology, Inc. (Danvers, MA, USA). The primers used for
RT-qPCR were designed and obtained from Invitrogen Life
Technologies (Carslbad, CA, USA).
NP cell culture and treatment
The experimental procedures involving the use of
animals were approved by the Animal Care and Use Committee of Ruian
People’s Hospital (Ruian, China). A total of 30 male Sprague-Dawley
rats (3-month-old, 250–300 g; Shanghai Laboratory Animal Center,
Shanghai, China) were sacrificed using 10% (w/v) chloral hydrate
(3.5 ml/kg body weight; Sigma-Aldrich, St. Louis, MO, USA). The
spinal columns between L1 and L6 were removed en bloc, and the NP
tissue was detached using a dissecting microscope (Xintian Medical
Device, Zhenjiang, China). When the cartilage endplate was cut
open, the gelatinous nucleus pulposus extruded out the endplate
under the relative high pressure in the discs. The tissue was then
treated with 0.1% collagenase II for 4 h at 37°C, followed by
filtration. The cells (5×10⁶ cells/25 cm2
flask) were cultured in Dulbecco’s modified Eagle’s medium (DMEM)
with 10% fetal bovine serum (FBS) and antibiotics (1%
penicillin/streptomycin) in an incubator in 5% CO2 at
37°C. At 80–90% confluence, the cells were harvested with 0.25%
trypsin-EDTA (Gibco Life Technologies, Carslbad, CA, USA), counted
and replanted into 10 cm culture plates at the appropriate density.
The second-passage cells, cultured in a monolayer, were used in the
subsequent experiments. All experiments were approved by the ethics
committee of Wenzhou Medical University, Ruian People’s Hospital,
Ruian, China.
The NP cells (1×10⁶ cells/well in 6-well
plates) were incubated with DMEM and 2% FBS for 12 h prior to
pretreatment with the indicated pathway inhibitors and IL-1β (10
ng/ml), which were added 30 min prior to the addition of
recombinant rat leptin. For RT-qPCR, the NP cells were either
treated with different concentrations of leptin (0.1, 1 or 10
µg/ml), were co-treated with leptin (10 µg/ml) and
IL-1 β (10 ng/ml), or with leptin (10 µg/ml) combined with
the following corresponding pathway inhibitors: SP600125, a JNK
inhibitor (10 µM); U0216, a ERK inhibitor (5 µM);
SB220025, a p38 inhibitor (10 µM); Wortannim, a PI3K/Akt
inhibitor (20 nM) or AG490, a JAK2/STAT3 inhibitor (40 µM)
for 48 h. For Alcian staining and immunocytochemistry, the NP cells
were incubated with leptin (10 µg/ml) for 1 week. For
western blotting, the cells were either treated with leptin (10
µg/ml) alone for 10 and 60 min or co-treated with leptin and
the corresponding inhibitor for 60 min at 37°C.
Immunocytochemistry and
immunofluorescence
The NP cells (1×10⁶ cells/well in 6-well
plates) were fixed with fresh 4% paraformaldehyde (Sigma-Aldrich)
for 10 min at 37°C in 24-well plates and rinsed with
phosphate-buffered saline (PBS’ Sigma-Aldrich) three times. The
cells were then treated with 0.2% Triton X-100 (Sigma-Aldrich) for
15 min. Following blocking with 5% goat serum (Gibco Life
Technologies) for 30 min at 37°C, the cells were incubated with
primary antibodies against collagen II (Rabbit anti-rat polyclonal;
1:100; cat. no. ab34712; Abcam), Cambridge, UK) and cytokeratin 19
(Rabbit anti-rat polyclonal; 1:100; cat. no. ab101255; Abcam)
overnight. For immunocytochemistry, these cells were incubated with
horseradish peroxidase (HRP)-conjugated secondary antibodies (Goat
anti-rabbit monoclonal; 1:50; cat. no. A0208; Beyotime Institute of
Biotechnology, Haimen, China) for 2 h at room temperature, followed
by counterstaining with hematoxylin (Beyotime Institute of
Biotechnology). For immunofluorescence, the cells were incubated
with fluorescein isothiocyanate (FITC)-labeled secondary antibodies
(Goat anti-rabbit monoclonal; 1:100; cat. no. A0562; Beyotime
Institute of Biotechnology), followed by staining with
4′,6-diamidino-2-phenylindole (Beyotime Institute of Biotechnology)
for nuclei. Finally, these cells were observed under light or
fluorescence microscopy (Olympus, Tokyo, Japan).
Alcian blue staining
To analyze the expression of proteoglycans, the
fixed cells were stained with 1% Alcian blue solution for 30 min at
37°C, which was dissolved in 3% glacial acetic acid. The cells were
rinsed with a tap water for 5 min and counterstained with 0.1%
nuclear red solution dissolved in 5% aluminum sulfate for 20 min.
The staining density was analyzed under light microscopy.
Western blotting
The total protein was isolated using
radioimmunoprecipitation assay lysis buffer with 1 mM
phenylmethylsulfonyl fluoride (Beyotime Institute of
Biotechnology), and the protein concentration was determined with
using an Enhanced BCA Protein Assay kit (Beyotime Institute of
Biotechnology,). Equal quantities (30 µg) of protein from
each sample were separated using sodium dodecyl
sulfate-polyacrylamide gel electrophoresis and transferred onto
polyvinylidene difluoride membranes (Bio-Rad Laboratories, Inc.,
Hercules, CA, USA). Following blocking with 5% nonfat milk, the
membranes were incubated with the following rabbit anti-rat primary
antibodies overnight: p-JNK (cat. no. 9251), JNK (cat. no. 9252).
p-ERK (cat. no. 4370), ERK (cat. no. 9102), p-p38 (cat. no. 9211),
p38 (cat. no. 8690), p-Akt (cat. no. 13038), Akt (cat. no. 9272)
p-STAT3 (cat. no. 9145), STAT3 (cat. no. 4904) and GAPDH (cat. no.
5174), all purchased from Cell Signaling Technology, Inc. and
diluted 1:1,000. Following this, the membranes were incubated with
HRP-conjugated secondary antibodies (Goat anti-rabbit; 1:2,000;
cat. no. A0208; Beyotime Institute of Biotechnology). All the
antibodies were diluted to 1:1,000. Finally, the bands were
detected using ECL plus reagent(Invitrogen Life Technologies) on an
enhanced chemiluminescence detection system (PerkinElmer, Inc.,
Waltham, MA, USA). In addition, the intensity of the bands were
quantified using Alpha Ease FC 4.0 software (Alpha Innotech Corp.,
San Leandro, CA, USA).
RT-qPCR
The total RNA was extracted using TRIzol reagent
(Invitrogen Life Technologies). The RNA (1 µg) was used to
synthesize cDNA (MBI Fermantas, St. Leon-Rot, Germany). For qPCR
amplification, a 20 µl reaction volume, containing 10
µl 2X SYBR Premix Ex Taq mixture (Takara, Bio Inc., Otsu,
Japan), 0.2 µmol/l each primer, 2 µl 2-fold diluted
cDNA and sterile distilled water was used. The reaction and
detection were performed using a light cycle (Roche, Mannheim,
Germany). The PCR cycling steps were as follows: 96°C for 5 min; 35
cycles of 94°C for 30 sec, 60°C for 30 sec and 72°C for 60 sec;
followed by 72°C for 5 min for extension. The primers used are
shown in Table I. The cycle
threshold (Ct) values were obtained and normalized to the
housekeeping gene, glyceraldehyde phosphate dehydrogenase. When the
fluorescence intensity reached 0.05, the Ct value was determined as
the cycle number and following confirmation that in this range all
curves were in the exponential phase of amplification, the value
was selected. The ΔΔCt method was used to calculate the relative
mRNA levels of each target gene. ΔΔCt method: ΔCt =
Cttarget - CtGAPDH, ΔΔCt =
ΔCttreated - ΔCtcontrol and gene expression
is expressed as 2−ΔΔCt.
 | Table IPrimer sequences for ADAMTSs, MMPs,
aggrecan, COL2A1 and GAPDH. |
Table I
Primer sequences for ADAMTSs, MMPs,
aggrecan, COL2A1 and GAPDH.
| Gene | Primer sequence
(5′-3′) |
|---|
| MMP-1 | Forward:
GACCTCATGTTCATCTTTAGA |
| Reverse:
CACCACAATAAGGAATTCGTT |
| MMP-3 | Forward:
TGGACCAGGGACCAATGGA |
| Reverse:
GGCCAAGTTCATGAGCAGCA |
| MMP-9 | Forward:
GTCCAGACCAAGGGTACAG |
| Reverse:
GTCCAGACCAAGGGTACAG |
| MMP-13 | Forward:
GCCGGAAATAACCTCACTGT |
| Reverse:
CTCACCCTCTACACCTCCCT |
|
ADAMTS-4 | Forward:
GCCGGAAATAACCTCACTGT |
| Reverse:
CTCACCCTCTACACCTCCCT |
|
ADAMTS-5 | Forward:
CGACAAGAGTCTGGAGGTGAG |
| Reverse:
CGTGAGCCACAGTGAAAGC |
|
Aggrecan | Forward:
AGGATGGCTTCCACCAGTGC |
| Reverse:
TGCGTAAAAGACCTCACCCTCC |
| COL2A1 | Forward:
CTCAAGTCGCTGAACAACC |
| Reverse:
CTATGTCCACACCAAATTCC |
| GAPDH | Forward:
CCACAGTCCATGCCATCAC |
| Reverse:
TCCACCACCCTGTTGCTGTA |
Statistical analysis
Statistical analyses were performed using the SPSS
19 statistical software program (SPSS Inc., Chicago, IL, USA).
Analysis of variance was used to analyze the difference between
groups, and Tukey’s least significant difference test was used to
detect difference between two groups. P<0.05 was considered to
indicate a statistically significant difference.
Results
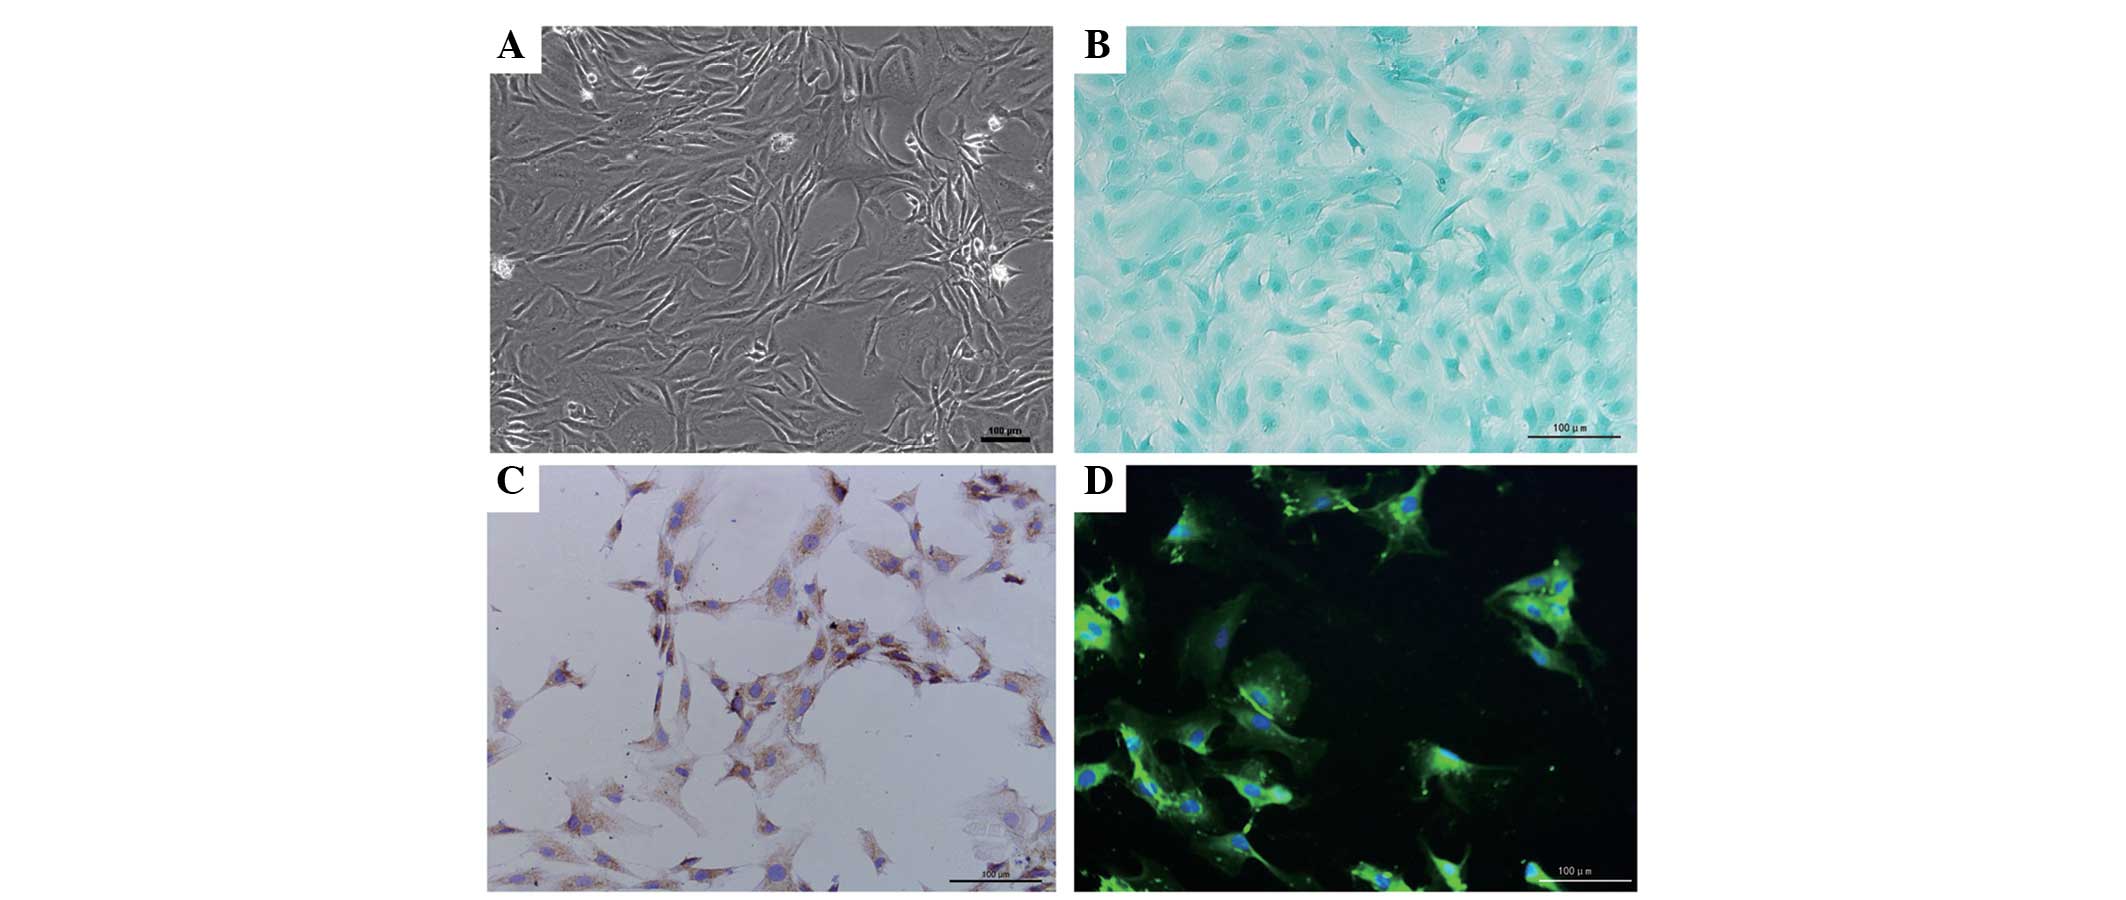
Identification of the NP cells
In order to ensure the purity of the NP, the
gelatinous tissue was only harvested when they were extruding out
of the endplate following endplate rupture. Under phase-contrast
microscopy, the NP cells exhibited an appearance similar to
chondrocytes, with polygonal and stellate morphology, and contained
vacuoles in the cytoplasm with long processes (Fig. 1A). The expression of proteoglycans
and collagen II were detected within the cytoplasm using Alcian
blue staining and immunocytochemistry, and this was predominantly
distributed around the nucleus (Fig.
1B and C). In addition, CA125, a novel maker gene for NP cells,
was also detected in the cells under florescence microscopy,
further validating the purity of the cells (Fig. 1D).
Leptin enhances the expression of
catabolic enzymes
The catabolic enzymes investigated in the present
study included MMP-1, MMP-3, MMP-9, MMP-13, ADAMTS-4 and ADAMTS-5.
A significant (P<0.05) dose-dependent increase in the mRNA
expression levels of MMP-1, MMP-13, ADAMTS-4
and ADAMTS-5, were observed to be regulated by leptin alone
(Fig. 2). Compared with the
control group, there was an ~8-fold increase in the mRNA levels of
MMP-1 and MMP-13 in the leptin-treated group.
Although the mRNA expression levels of MMP-3 and
MMP-9 were not altered by leptin, synergy between leptin (10
µg/ml) and IL-1β enhanced the mRNA expression of
MMP-3, suggesting that the base level of inflammation may be
important in regulation (Fig. 2).
In addition, the levels of MMP-1 and ADAMTS-5 were
also elevated by leptin in combination with 10 µg/ml
IL-1β.
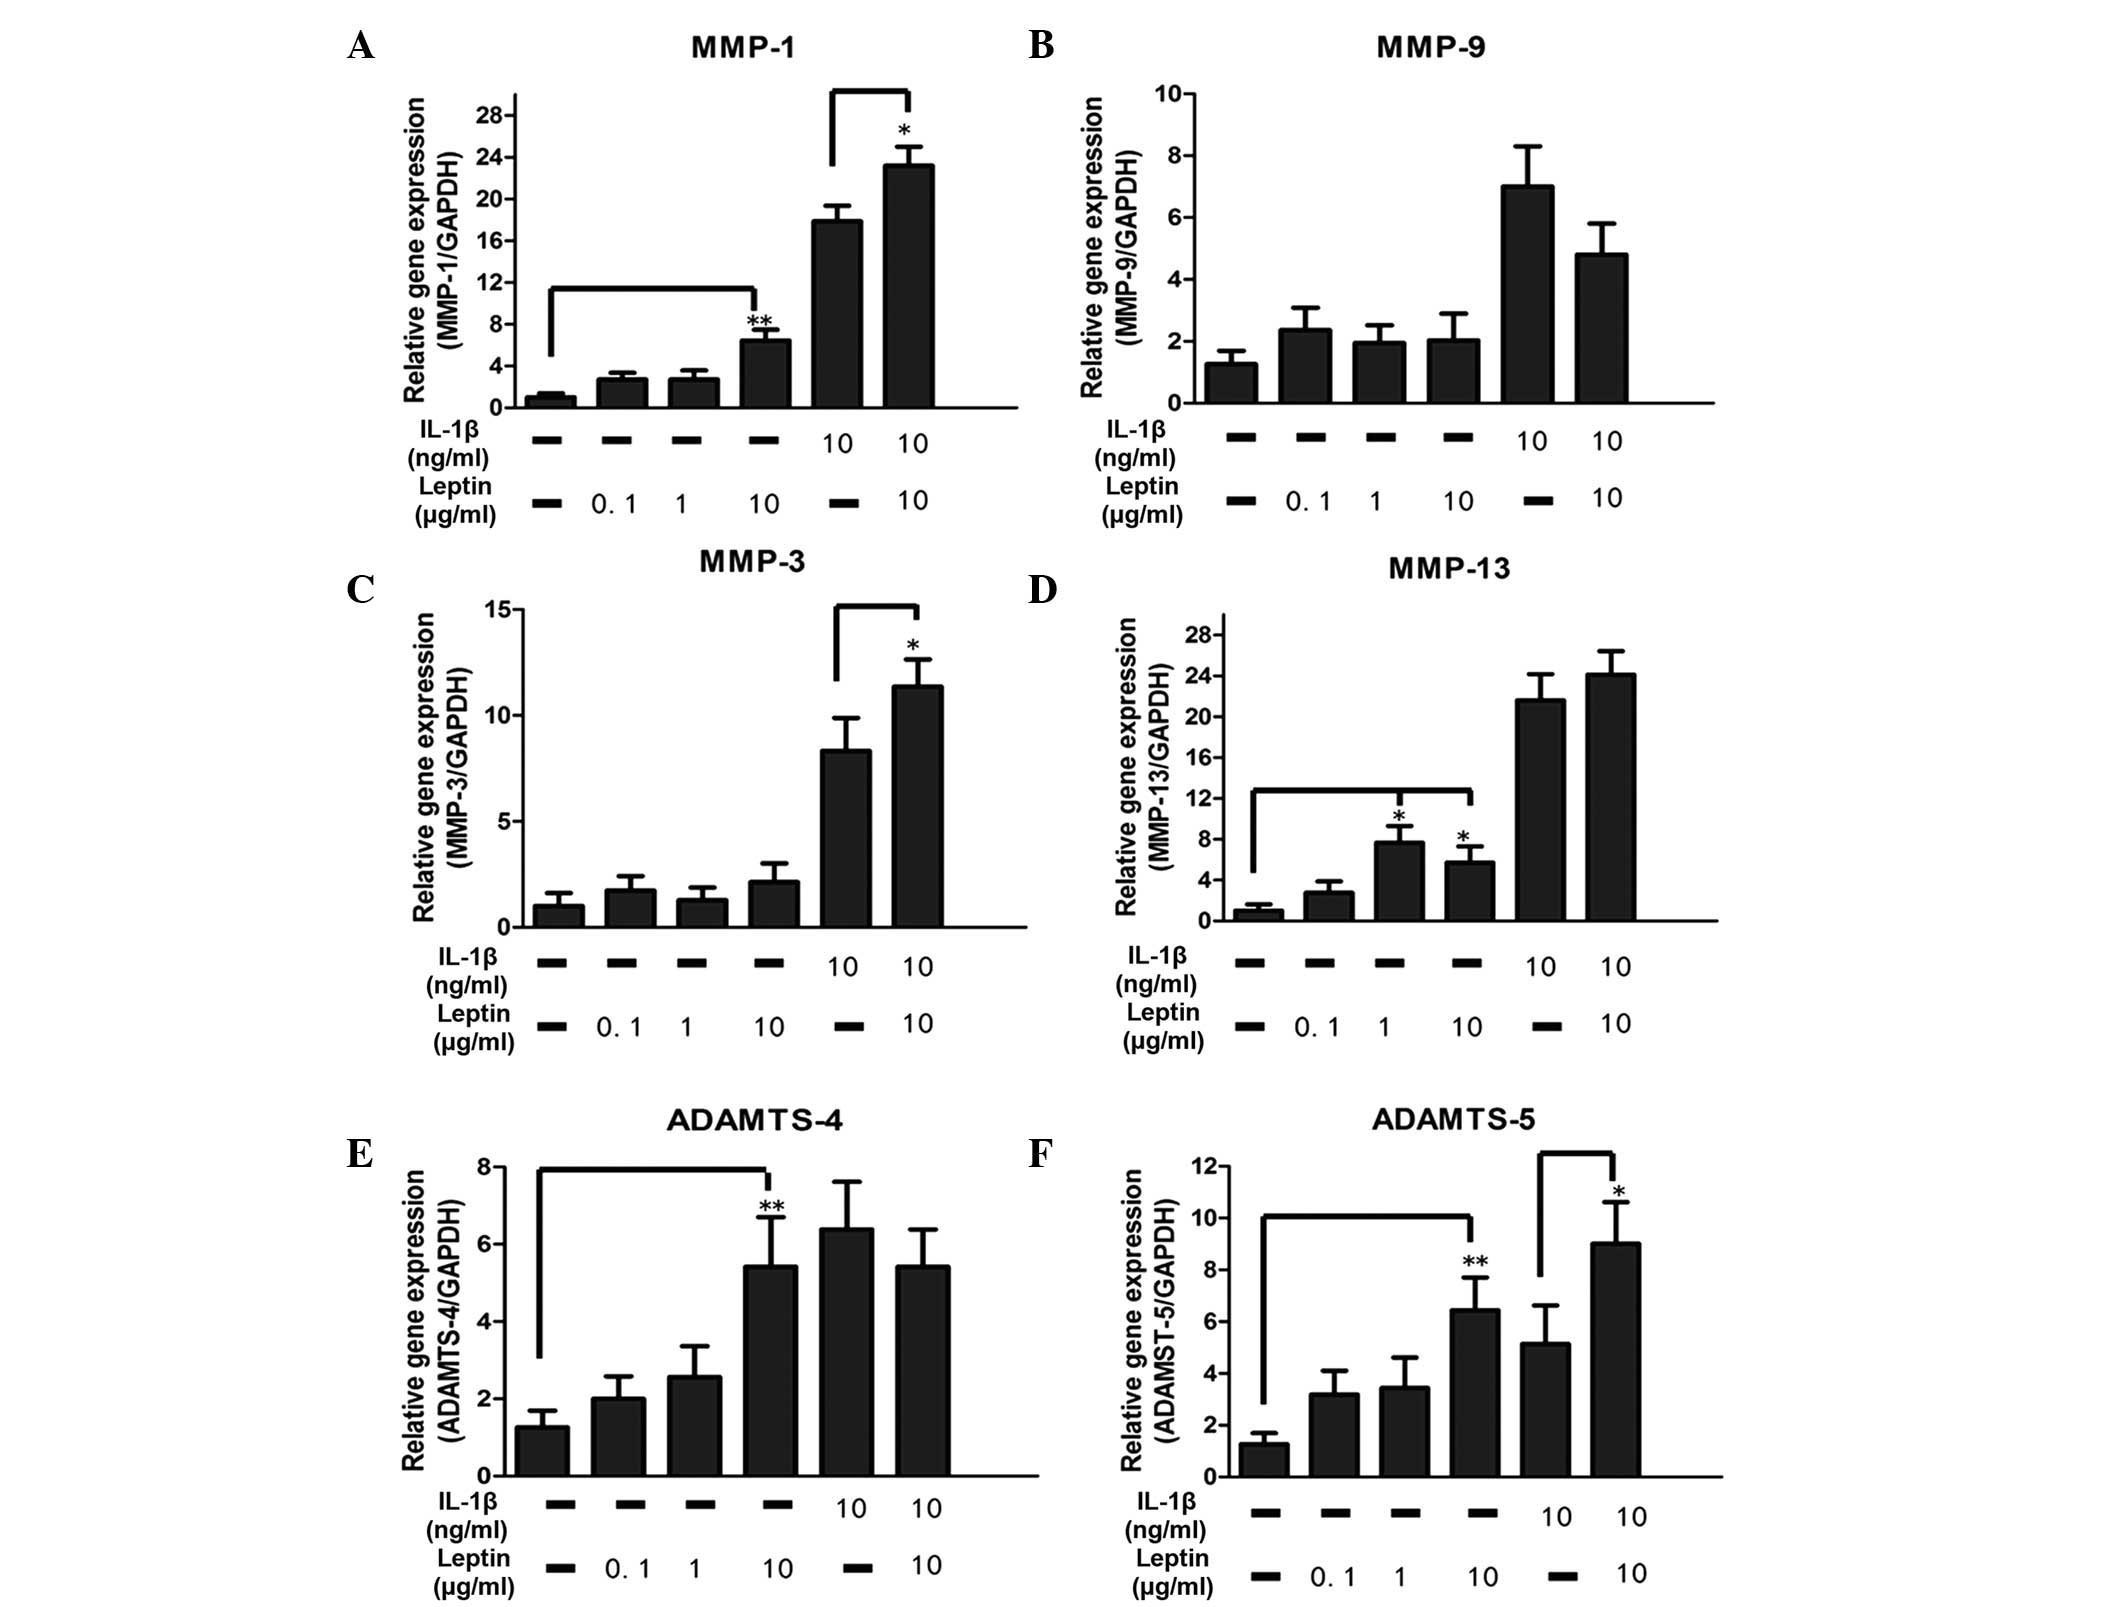 | Figure 2Effect of the leptin, alone or in
combination with IL-1β, on catabolic enzymes in NP cells. The NP
cells were treated with leptin (0.1, 1 ot 10 µg/ml) either
alone or in combination with IL-1β (10 ng/ml) for 48 h. mRNA levels
of (A–D) metalloproteases and (E–F) aggrecanases, which were
normalized by the expression of GAPDH separately. Data were
analyzed using reverse transcription-quantitative polymerase chain
reaction. IL-1β was added 30 min prior to the addition of leptin.
Data are presented as the mean fold change ± standard deviation
(*P<0.05 and **P<0.01, compared with
the untreated control; n=6). NP cells, nucleus pulposus; IL,
interleukin; MMP, matrix metalloproteinase; ADAMTS, a disintegrin
and metalloproteinase with thrombospondin motifs; GAPDH,
glyceraldehyde phosphate dehydrogenase. |
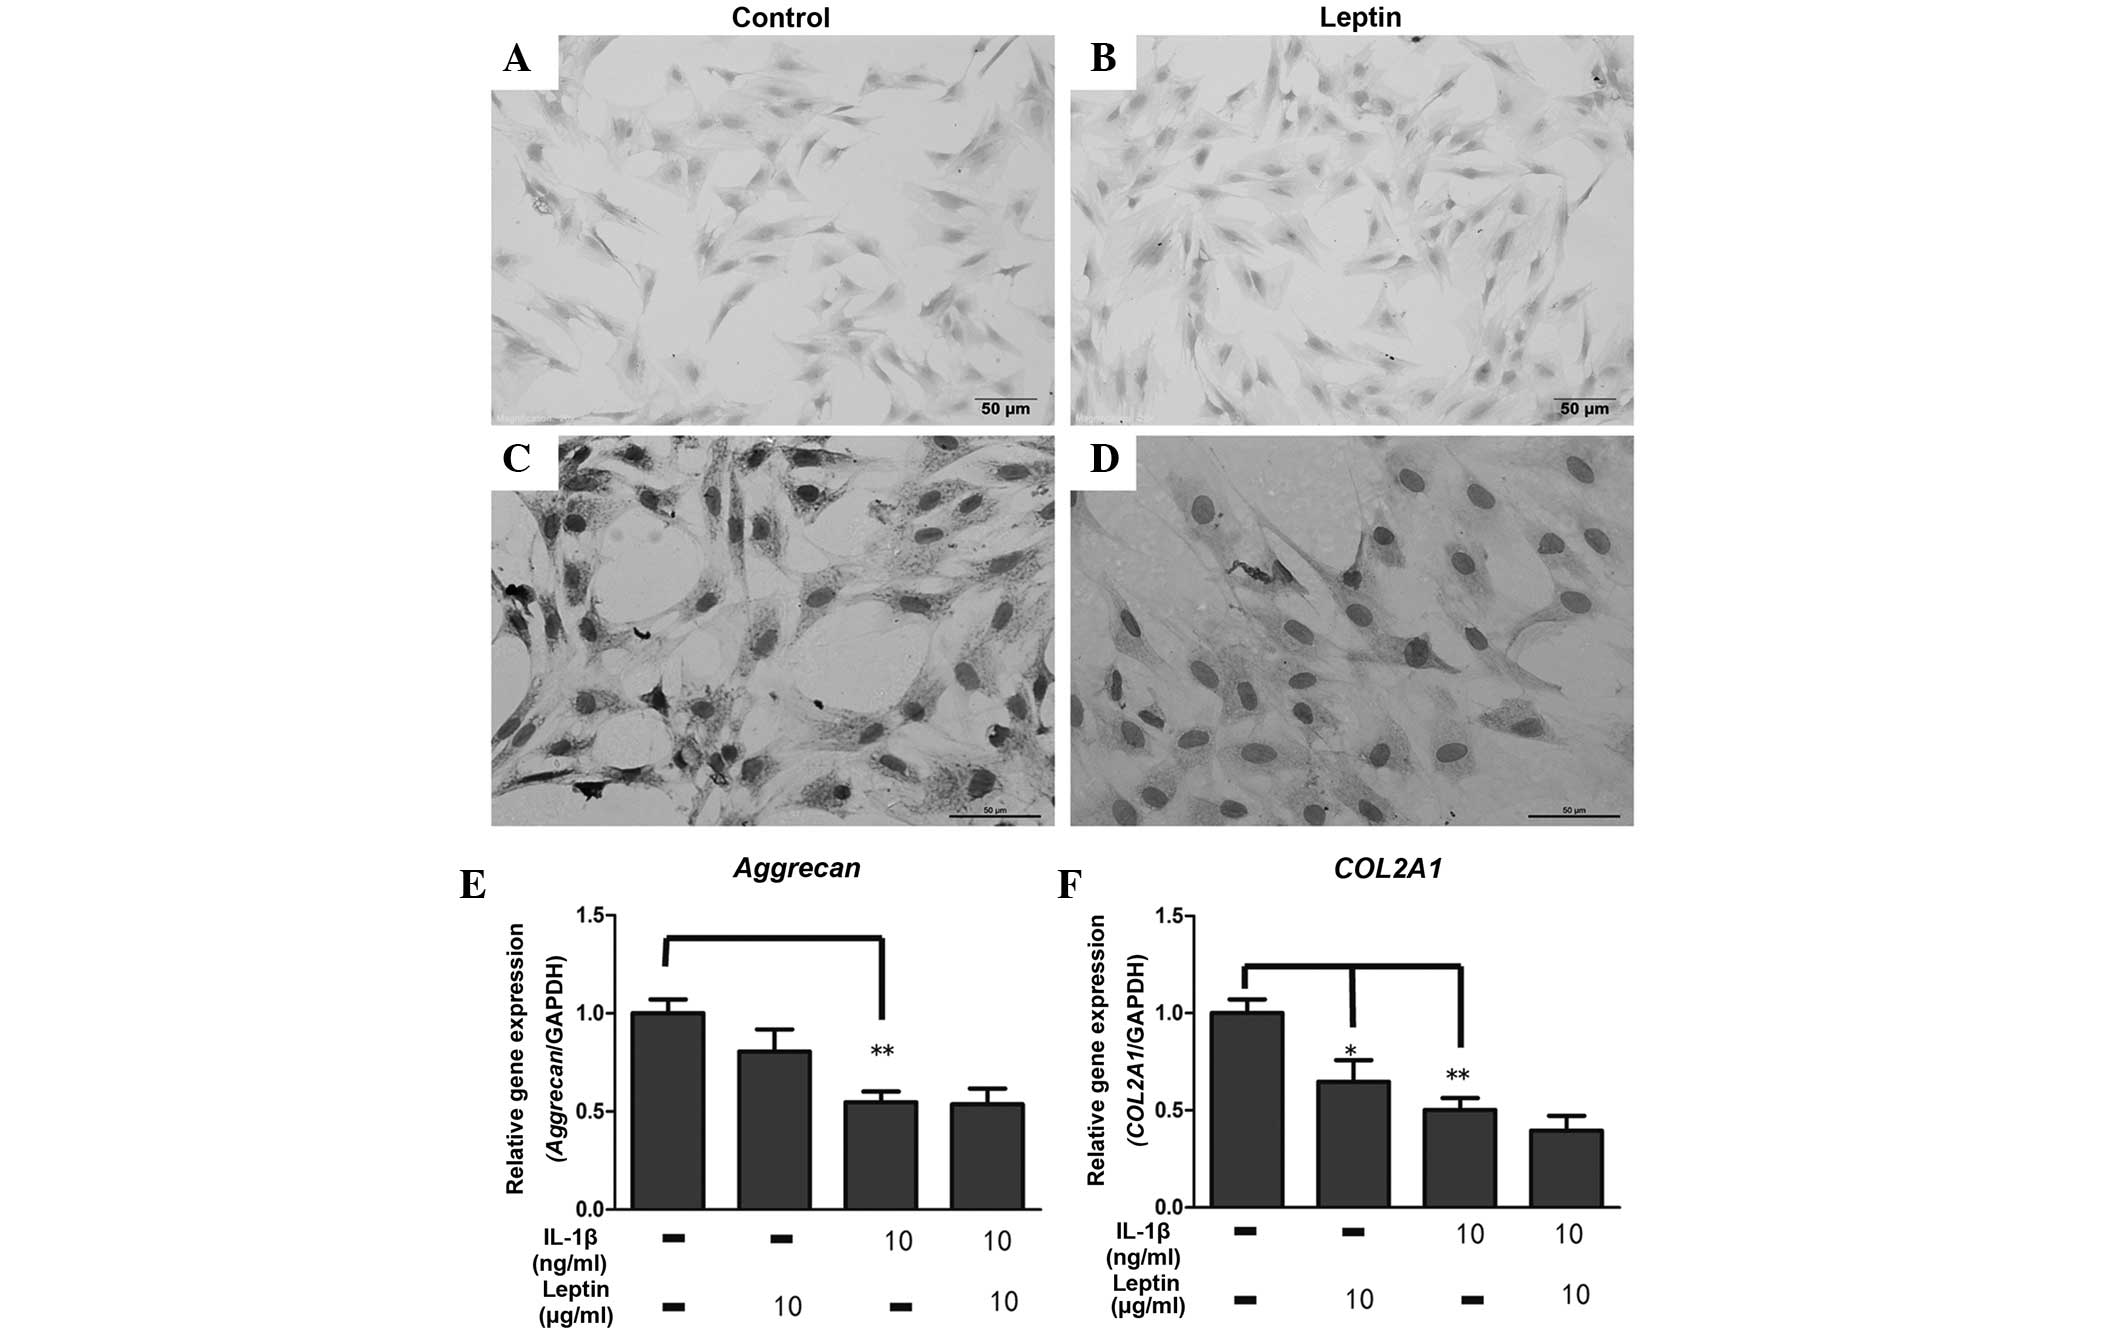
Leptin reduces the mRNA and protein
expression levels of collagen II
According to the above results, the present study
subsequently investigated the expression levels of proteoglycan and
collagen II, which were degraded by these catabolic enzymes. The
intensity of the Alcian blue staining, used to detect the
proteoglycan levels, was similar between the control group and the
leptin group, in which the cells were treated with leptin (10
µg/ml) for 1 week (Fig. 3A and
B). By contrast, the expression of collagen II markedly
declined in the leptin-induced cells compared with the control
group, as evidenced in the immunocytochemical analysis of collagen
II (Fig. 3C and D). The results of
the RT-qPCR for aggrecan were consistent with those of the
Alcian blue staining, demonstrating that 10 µg/ml leptin had
no effect on the mRNA expression of aggrecan following
exposure for 48 h (Fig. 3E).
However, the mRNA expression of COL2A1 was significantly
(P<0.05) reduced by leptin (Fig.
3E). When the cells were co-cultured with IL-1β and leptin, no
synergistic effect on the expression of ECM was observed.
Leptin activates the MAPK, PI3K/Akt and
JAK2/STAT3 pathways
The mechanism by which leptin regulated the
catabolic enzyme in NP cells was investigated by western blotting
to analyze the expression levels of the MAPK, PI3K/Akt and
JAK2/STAT3 pathways. At 60 min post-stimulation with 10
µg/ml leptin, the expression of p-JNK, p-ERK and p38, which
comprise the MAPK pathway, were all activated, evidenced by the
increased intensity of the protein bands (Fig. 4A). The induction of Akt
phosphorylation was detected as early as 10 min post-stimulation
(Fig. 4B), and a time-dependent
increase in the phosphorylation of STAT3, induced by leptin, was
detected at 60 min (Fig. 4C).
Whether the JNK, ERK, p38, PI3K/Akt and JAK2/STAT3 pathway
inhibitors (SP600125, U0216, SB220025 wortannim and AG490,
repectively) inhibited the activation of these pathways was also
examined. As shown in Fig. 4, when
the cells were co-treated with leptin and the inhibitors, the
phosphorylation level of each protein declined significantly.
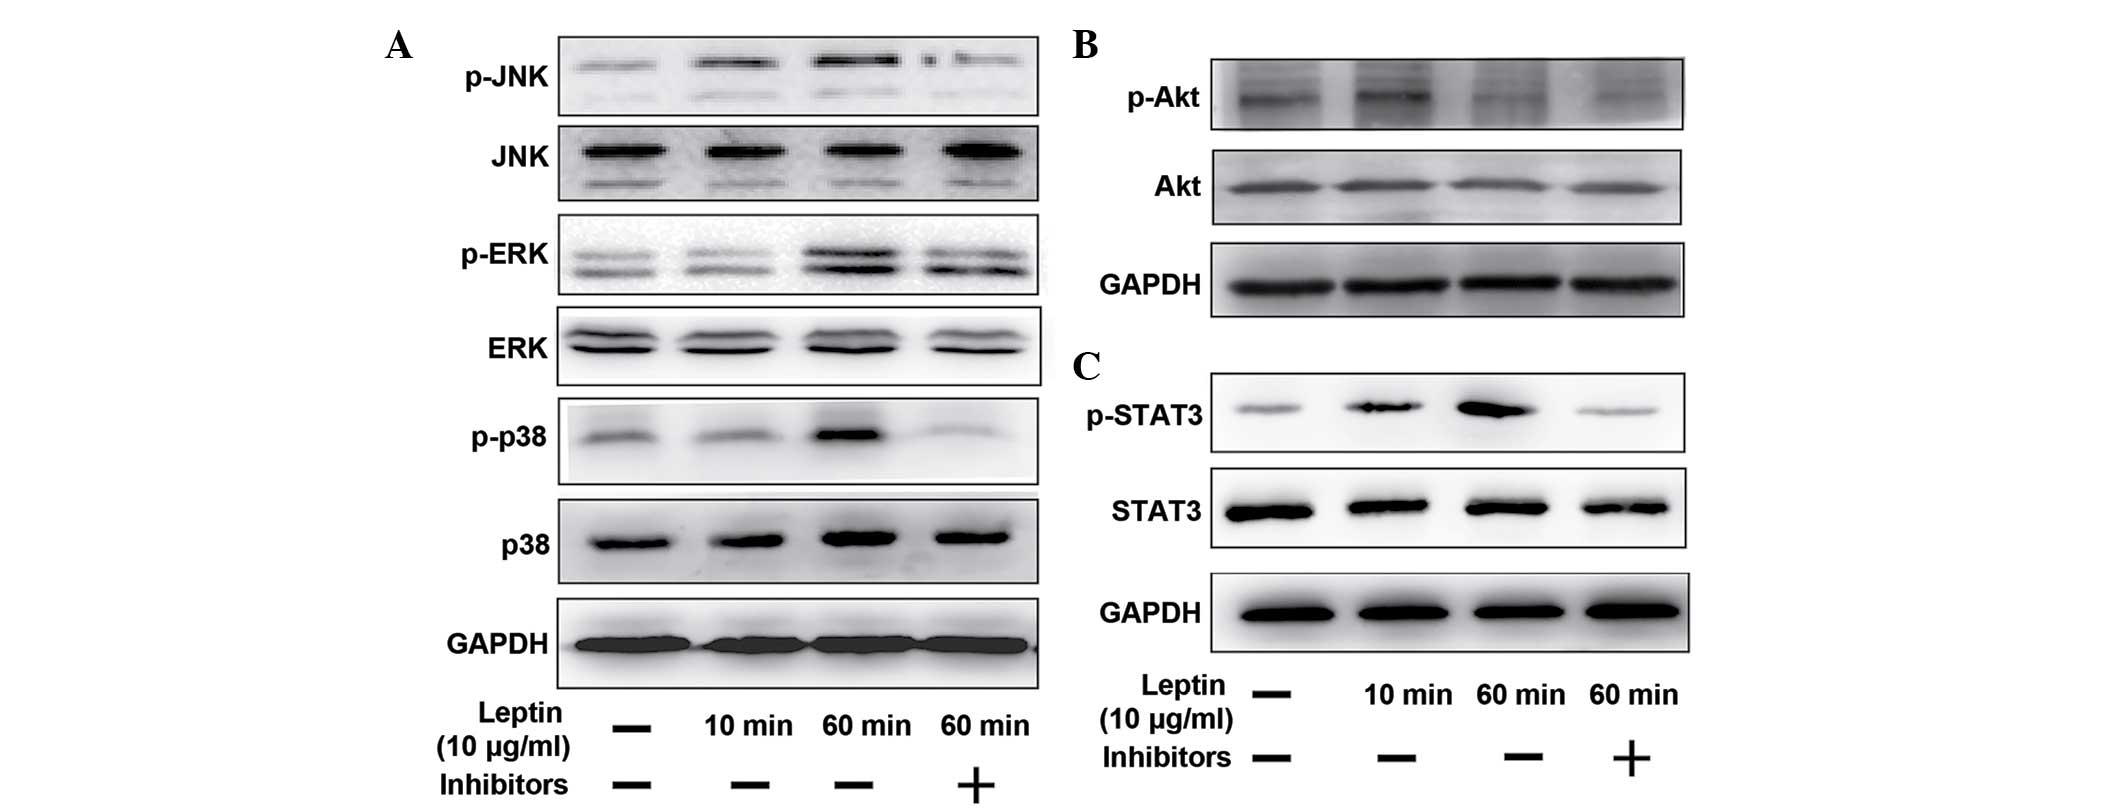 | Figure 4Different signaling pathways
regulated by leptin and theit relevant pharmacological inhibitors.
The NP cells were treated with leptin (10 µg/ml) alone for
10 min and 60 min, or with leptin (10 µg/ml) in combination
with different signaling pathway inhibitors for 60 min, followed by
the western blotting. The inhibitors were added 30 min prior to
leptin. To regulate the mitogen-activated protein kinase pathways
(A) SP600125 (10 µM, JNK inhibitor), U0216 (5 µM, ERK
inhibitor) and SB220025 (10 µM, p38 inhibitor) were added.
(B) Wortannim (20 nM) was added to inhibit the PI3K/Akt pathway.
(C) AG490 (40 µM) was used to inhibit the JAK2/STAT3
pathway. JNK, c-Jun-N-terminal kinase, p-, phosphorylated; ERK,
extracellular signal-regulated kinase; PI3K, phosphatidylinositol
3-kinase; JAK, Janus kinase; GAPDH, glyceraldehyde phosphate
dehydrogenase. |
Effect of pathway inhibitors on the
expression of catabolic enzymes
In order to further confirm the involvement of the
pathways in the increased expression of enzymes, the NP cells were
treated with leptin, either alone or in combination with the
pathway inhibitors, followed by RT-qPCR to determine the mRNA
levels. With regard to the mRNA level of MMP-1, the JNK inhibitor
(10 µM SP600125), ERK inhibitor (5 µM U0216) and
JAK2/STAT3 inhibitor (40 µM AG490) reversed the induced by
leptin (Fig. 5A; P<0.05). By
contrast, the expression levels were not affected by the p38
inhibitor (10 µM SB220025) or the PI3K/Akt inhibitor (20 nM
wortannim. The mRNA level of MMP-13 induced by leptin was reduced
significantly by SP600125, U0216 and AG490 at the same
concentration (Fig. 5B;
P<0.05). The PI3K/Akt inhibitor failed to inhibit MMP-1 and
MMP-13, suggesting that the PI3K/Akt pathway may not be involved in
the process.
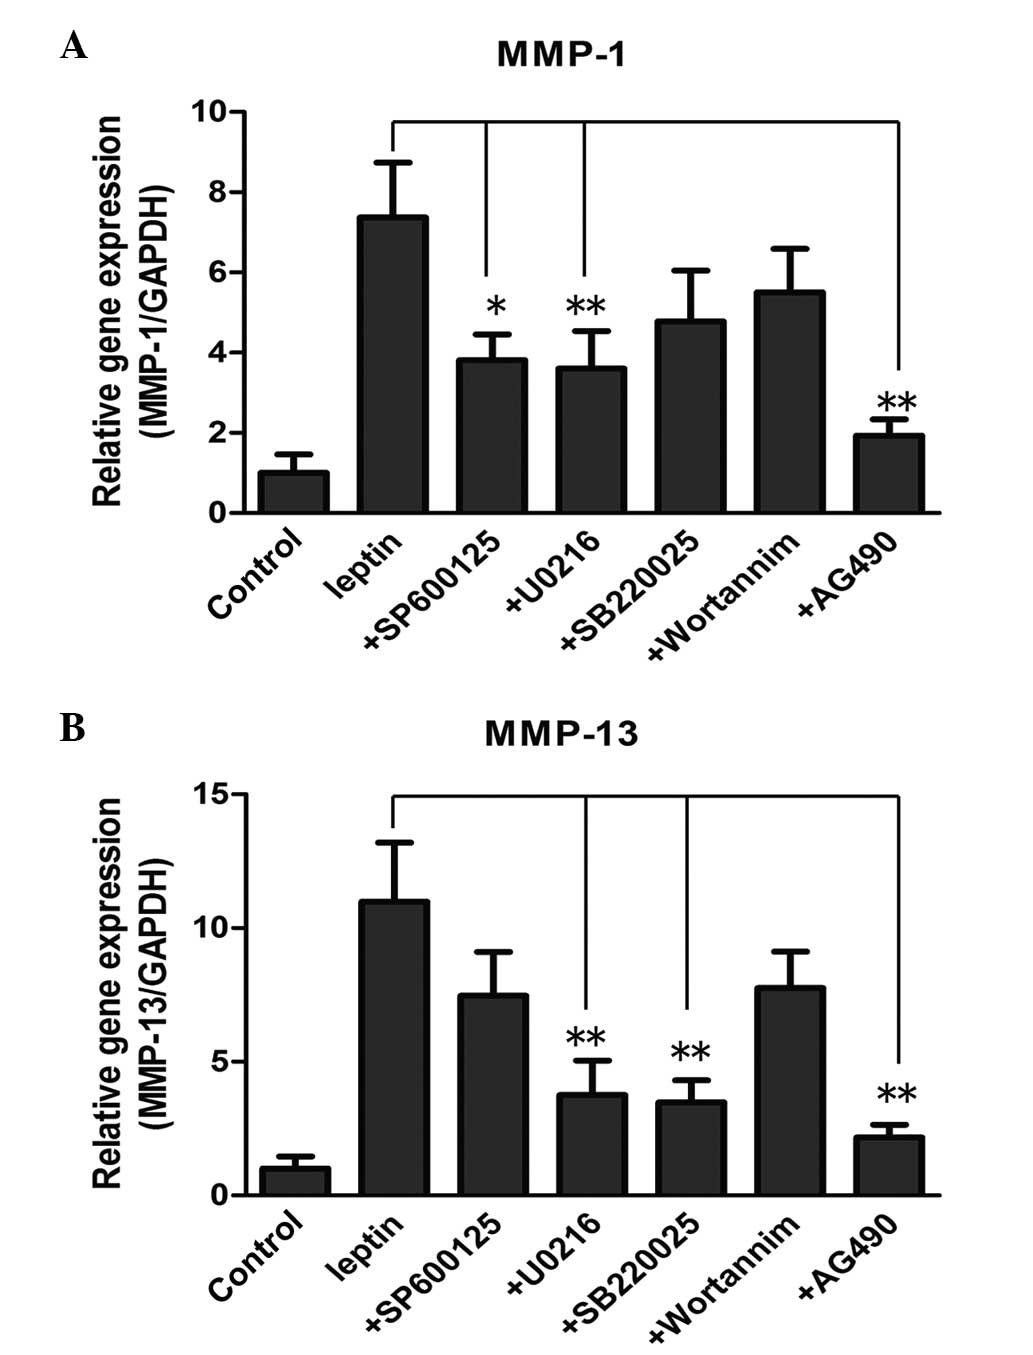 | Figure 5Effect of different pathway
inhibitors on the mRNA levels of (A) MMP-1 and (B)
MMP-13 in NP cells. The NP cells were treated with leptin,
alone or in combination with pathway inhibitors, for 48 h. These
inhibitors included SP600125 (10 µM, JNK inhibitor), U0216
(5 µM, ERK inhibitor) SB220025 (10 µM, p38
inhibitor), wortannim (20 nM, PI3K/Akt inhibitor) and AG490 (40
µM, JAK2/STAT3 inhibitor), which were added to the culture
medium 30 min prior to the addition of leptin. The mRNA levels of
MMP-1 and MMP-13, were each normalized against the
expression of GAPDH and expressed as the mean fold change ±
standard deviation compared with the control, detected using
reverse transcription-quantitative polymerase chain reaction.
*P<0.05 and**P<0.01, compared with the
control (n=6). |
Discussion
The importance obesity in the progression of IDD has
attracted significant attention. Previous studies have demonstrated
that obesity is a risk factor for LBP, which is associated with IDD
(22,23). In addition, compared with that in
individuals without IDD, body mass index (BMI), regarded as a
measurement of body fat, is significantly higher in southern
Chinese patients with IDD (24).
In addition, Takatalo et al (25) suggested that abdominal diameter
(AD), sagittal diameter (SAD) and waist circumference were
associated with disc degeneration, according to the magnetic
resonance imaging.
The potential mechanisms underlying the effect of
obesity on IDD may include increased mechanical loading and
atherosclerosis caused by obesity (25), however, the role of adipocytokines,
and leptin in particular, in disc degeneration remains to be
elucidated. It has been reported that leptin can stimulate the
proliferation of rat NP cells and human annulus fibrosus cells
in vitro (13,14), contributing to the formation of
cell clusters, which is a mark of disc degeneration (26). Furthermore, cytoskeleton proteins,
including β-actin, F-actin and vimentin, can be dysregulated and
reorganized by leptin, indicating cytoskeletal remodeling in
leptin-treated cells (21). In the
present study, treatment with leptin alone promoted the mRNA
expression levels of MMP-1, MMP-13, ADAMTS-4
and ADAMTS-5, and reduced the protein and mRNA level of
collagen II in the NP cells, indicating the pro-catabolic effect of
leptin on the metabolism of discs. In addition to the close
association between leptin levels and obesity, the results of the
present study suggested that leptin may partly account for the
effect of obesity on IDD. In addition, the catabolic effect induced
by leptin may contribute to the compensatory proliferation of NP
cells, however, this requires further investigation.
During the development of IDD, a significant
increase in the expression and activity levels of MMPs and AMAMTSs,
including MMP-1, 3, 7, 9, and 13, and ADAMTS-1, 4, 5, 9 and 15,
have been found (5). The findings
of Le Maitre et al (27),
that MMP-1 and MMP-13 were expressed highly in degenerated NP
tissue, may explain why the mRNA expression levels of MMP-1
and MMP-13, rather than MMP-3 and MMP-9 were
increased significantly by the leptin in the present study. As the
predominant target of MMP-13 is collagen II, the mRNA expression of
COL2A1 and protein expression of collagen II were inhibited
in the leptin-treated cells. Similarly, Hui et al (16) found that leptin significantly
induced collagen release in bovine cartilage. Although the mRNA
expression of ADAMTS in NP cells was increased to a certain
extent, the Alcian blue staining and mRNA level of aggrecan
were similar between the leptin-treated cells and the control
cells. This result indicated that the aggrecanase, MMP-3, which was
not affected by leptin, was also important in regulating the
expression of aggrecan.
The network comprising leptin and pro-inflammatory
mediators is complex. In the present study, synergy between leptin
and IL-1β was observed in the increased expression levles of MMP-1,
MMP-3 and ADAMTS-5, suggesting that leptin sensitized the NP cells
to the IL-1β-induced catabolic response in vitro. However,
the synergy was not observed in the mRNA expression of
COL2A1 and aggrecan. It has also been reported that
leptin can induce pro-inflammatory mediators, including the IL-6,
IL-8, NO and prostaglandin E2 (PGE2), which activate the expression
of catabolic enzymes (17,18,28).
Leptin exerts its biological effect in cells via
several pathways. JAK2, PI3K, MEK-1 and p38 kinase are all involved
in the process and leptin, in synergy with IL-1, enhances the
expression of NOS in human chondrocytes (18). In the microglia, the
IRS-1/PI3K/Akt/NF-κB and p300 signaling pathway also mediates the
production of IL-6, induced by leptin (28). In addition, the increased
expression levels of MMP-1, MMP-3 and MMP-13 in chondrocytes,
induced by leptin, is associated with the activation of the STAT,
MAPK, NF-κB and Akt signaling pathways (15,16).
In the present study, the results of the western blotting
demonstrated that the MAPK, Akt and JAK2/STAT3 pathways were all
activated by leptin in the NP cells, and the Akt pathway was
activated earlier than the other pathways. However, when these
pathways were inhibited, the p38 and PI3K/Akt pathway were found
not to be involved in the regulation of the mRNA expression of
MMP-1, and the JNK and PI3K/Akt pathways did not affects the
regulation of the mRNA expression of MMP-13. Neither the
mRNA expression of MMP-1 nor MMP-13 were affected by
the PI3K/Akt pathway, indicating that the PI3K/Akt pathway was not
involved in the increase of catabolic enzymes regulated by leptin
in NP cells.
In conclusion, the results of the present study
suggested that leptin, either alone or in synergy with IL-1β
promoted the mRNA expression levels of MMP-1, MMP-9, MMP-3,
ADAMTS-4 and ADAMTS-5. In addition, the mRNA level of
COL2A1 and collagen protein declined in the leptin-treated
NP cells. Although leptin activated the MAPK, PI3K/Akt and
JAK2/STAT3 pathways, the PI3K/Akt pathway was not involved in the
regulating the expression of MMP-1 and MMP-13.
References
|
1
|
Luoma K, Riihimaki H, Luukkonen R,
Raininko R, Viikari-Juntura E and Lamminen A: Low back pain in
relation to lumbar disc degeneration. Spine (Phila Pa 1976).
25:487–492. 2000. View Article : Google Scholar
|
|
2
|
Rihn JA, Kurd M, Hilibrand AS, et al: The
influence of obesity on the outcome of treatment of lumbar disc
herniation: analysis of the spine patient outcomes research trial
(SPORT). J Bone Joint Surg Am. 95:1–8. 2013. View Article : Google Scholar :
|
|
3
|
Hughes SP, Freemont AJ, Hukins DW,
McGregor AH and Roberts S: The pathogenesis of degeneration of the
intervertebral disc and emerging therapies in the management of
back pain. J Bone Joint Surg Br. 94:1298–1304. 2012. View Article : Google Scholar : PubMed/NCBI
|
|
4
|
Nomura T, Mochida J, Okuma M, Nishimura K
and Sakabe K: Nucleus pulposus allograft retards intervertebral
disc degeneration. Clin Orthop Relat Res. 94:1012001.
|
|
5
|
Le Maitre CL, Pockert A, Buttle DJ,
Freemont AJ and Hoyland JA: Matrix synthesis and degradation in
human inter-vertebral disc degeneration. Biochem Soc Trans.
35:652–655. 2007. View Article : Google Scholar : PubMed/NCBI
|
|
6
|
Rastogi A, Kim H, Twomey JD and Hsieh AH:
MMP-2 mediates local degradation and remodeling of collagen by
annulus fibrosus cells of the intervertebral disc. Arthritis Res
Ther. 15:R572013. View
Article : Google Scholar : PubMed/NCBI
|
|
7
|
Clark SL, Cotton DB, Gonik B, Greenspoon J
and Phelan JP: Central hemodynamic alterations in amniotic fluid
embolism. Am J Obstet Gynecol. 158:1124–1126. 1988. View Article : Google Scholar : PubMed/NCBI
|
|
8
|
Millward-Sadler SJ, Costello PW, Freemont
AJ and Hoyland JA: Regulation of catabolic gene expression in
normal and degenerate human intervertebral disc cells: implications
for the pathogenesis of intervertebral disc degeneration. Arthritis
Res Ther. 11:R652009. View
Article : Google Scholar : PubMed/NCBI
|
|
9
|
Trayhurn P: Hypoxia and adipose tissue
function and dysfunction in obesity. Physiol Rev. 93:1–21. 2013.
View Article : Google Scholar : PubMed/NCBI
|
|
10
|
Vignaux G, Besnard S, Ndong J, Philoxene
B, Denise P and Elefteriou F: Bone remodeling is regulated by inner
ear vestibular signals. J Bone Miner Res. 28:2136–2144. 2013.
View Article : Google Scholar : PubMed/NCBI
|
|
11
|
Ge JF, Qi CC and Zhou JN: Imbalance of
leptin pathway and hypothalamus synaptic plasticity markers are
associated with stress-induced depression in rats. Behav Brain Res.
249:38–43. 2013. View Article : Google Scholar : PubMed/NCBI
|
|
12
|
Zhang Y, Proenca R, Maffei M, Barone M,
Leopold L and Friedman JM: Positional cloning of the mouse obese
gene and its human homologue. Nature. 372:425–432. 1994. View Article : Google Scholar : PubMed/NCBI
|
|
13
|
Zhao CQ, Liu D, Li H, Jiang LS and Dai LY:
Expression of leptin and its functional receptor on disc cells:
contribution to cell proliferation. Spine (Phila Pa 1976).
33:E858–E864. 2008. View Article : Google Scholar
|
|
14
|
Gruber HE, Ingram JA, Hoelscher GL and
Hanley EN Jr: Leptin expression by annulus cells in the human
intervertebral disc. Spine J. 7:437–443. 2007. View Article : Google Scholar : PubMed/NCBI
|
|
15
|
Koskinen A, Vuolteenaho K, Nieminen R,
Moilanen T and Moilanen E: Leptin enhances MMP-1, MMP-3 and MMP-13
production in human osteoarthritic cartilage and correlates with
MMP-1 and MMP-3 in synovial fluid from OA patients. Clin Exp
Rheumatol. 29:57–64. 2011.PubMed/NCBI
|
|
16
|
Hui W, Litherland GJ, Elias MS, et al:
Leptin produced by joint white adipose tissue induces cartilage
degradation via upregulation and activation of matrix
metalloproteinases. Ann Rheum Dis. 71:455–462. 2012. View Article : Google Scholar
|
|
17
|
Gomez R, Scotece M, Conde J, Gomez-Reino
JJ, Lago F and Gualillo O: Adiponectin and leptin increase IL-8
production in human chondrocytes. Ann Rheum Dis. 70:2052–2054.
2011. View Article : Google Scholar : PubMed/NCBI
|
|
18
|
Otero M, Lago R, Lago F, Reino JJ and
Gualillo O: Signalling pathway involved in nitric oxide synthase
type II activation in chondrocytes: synergistic effect of leptin
with interleukin-1. Arthritis Res Ther. 7:R581–R591. 2005.
View Article : Google Scholar : PubMed/NCBI
|
|
19
|
Chen H, Charlat O, Tartaglia LA, et al:
Evidence that the diabetes gene encodes the leptin receptor:
identification of a mutation in the leptin receptor gene in db/db
mice. Cell. 84:491–495. 1996. View Article : Google Scholar : PubMed/NCBI
|
|
20
|
Lee GH, Proenca R, Montez JM, et al:
Abnormal splicing of the leptin receptor in diabetic mice. Nature.
379:632–635. 1996. View
Article : Google Scholar : PubMed/NCBI
|
|
21
|
Li Z, Shen J, Wu WK, et al: The role of
leptin on the organization and expression of cytoskeleton elements
in nucleus pulposus cells. J Orthop Res. 31:847–857. 2013.
View Article : Google Scholar : PubMed/NCBI
|
|
22
|
Wu Z, Yang Y and Qiu G: Association study
between the polymorphisms of the fat mass and obesity-associated
gene with the risk of intervertebral disc degeneration in the han
chinese population. Genet Test Mol Biomarkers. 17:756–762. 2013.
View Article : Google Scholar : PubMed/NCBI
|
|
23
|
Urquhart DM, Berry P, Wluka AE, et al:
2011 Young Investigator Award winner: Increased fat mass is
associated with high levels of low back pain intensity and
disability. Spine. 36:1320–1325. 2011. View Article : Google Scholar : PubMed/NCBI
|
|
24
|
Samartzis D, Karppinen J, Mok F, Fong DY,
Luk KD and Cheung KM: A population-based study of juvenile disc
degeneration and its association with overweight and obesity, low
back pain and diminished functional status. J Bone Joint Surg Am.
93:662–670. 2011. View Article : Google Scholar : PubMed/NCBI
|
|
25
|
Takatalo J, Karppinen J, Taimela S, et al:
Association of abdominal obesity with lumbar disc degeneration-a
magnetic resonance imaging study. PLoS One. 8:e562442013.
View Article : Google Scholar
|
|
26
|
Johnson WE, Eisenstein SM and Roberts S:
Cell cluster formation in degenerate lumbar intervertebral discs is
associated with increased disc cell proliferation. Connect Tissue
Res. 42:197–207. 2001. View Article : Google Scholar
|
|
27
|
Le Maitre CL, Freemont AJ and Hoyland JA:
Localization of degradative enzymes and their inhibitors in the
degenerate human intervertebral disc. J Pathol. 204:47–54. 2004.
View Article : Google Scholar : PubMed/NCBI
|
|
28
|
Tang CH, Lu DY, Yang RS, et al:
Leptin-induced IL-6 production is mediated by leptin receptor,
insulin receptor substrate-1, phos-phatidylinositol 3-kinase, Akt,
NF-kappaB and p300 pathway in microglia. J Immunol. 179:1292–1302.
2007. View Article : Google Scholar : PubMed/NCBI
|