Introduction
Glioma is the most common and most aggressive
malignant primary brain tumor in humans, with a morbidity rate of
6/100,000 and a five-year survival rate of 20–30% (1). Gliomas are classified into low-grade
types (I or II) with slow or relatively slow growth, and high-grade
types (III or IV), with fast growth and spread into normal brain
tissue based on the World Health Organization (WHO) grading system
(2). Patients with glioblastoma,
the highest-grade glioma, survive for no more than one year
following diagnosis, as there are still no efficient treatment
protocols at present (3).
Therefore, early diagnosis of gliomas is crucial for improving the
survival of patients.
At present, diagnosis of gliomas is mainly based on
histological detection, which, however, cannot reflect the
pathological changes at the cellular and molecular levels timely
and efficiently. Although the importance of numerous genes,
including TP53, PTEN, EGFR, MDM2,
CDKN2A and CDKN2B (4–6),
during glioma progression has been proven, assays for individual
genes/proteins or in combination with histological features are
neither predictive of survival of glioma patients nor able to guide
therapeutic decisions (7). By
constrast, microarrays can provide tremendous information at the
transcription level, and are thus likely to reveal dynamic changes
in the expression of multiple genes simultaneously. To date,
microarray analysis has been successfully used to identify unknown
tumor glioma subtypes (8), and
gene-based classification has been proven to better correlate with
patient survival than histological classification (9).
In the present study, microarray analysis data were
subjected to bioinformatics analysis in order to investigate
changes at the transcript level that are associated with
spontaneous glioma progression, with the objective to discover
novel targets for glioma diagnosis and therapy. First, gene
expression profile data of glioma samples were compared with
non-cancerous samples from epilepsy patients to detect the
differentially expressed genes (DEGs) by the significance analysis
of microarray (SAM) method. Then, the short time-series expression
miner (STEM) method was applied to class these DEGs based on their
degree of differentiation in the process of tumor progression.
Finally, EnrichNet was used to analyze the enrichment of classified
DEGs on Kyoto Encyclopedia of Genes and Genomes (KEGG) pathways
based on a protein-protein interaction (PPI) network.
Materials and methods
Affymetrix microarray data
The expression profile of GSE4290 (10) was acquired from the Gene Expression
Omnibus (GEO, http://www.ncbi.nlm.nih.gov/geo/) database. The
platform of those data is GPL570 [HG-U133_Plus_2] Affymetrix Human
Genome U133 Plus 2.0 Array. In total, 23 brain tissue samples from
epilepsy patients as non-tumor (control) samples and 157 glioma
samples, including 26 astrocytoma samples (7 grade II and 19 grade
III), 50 oligodendroglioma samples (38 grade II and 12 grade III)
and 81 glioblastoma samples (grade IV) were used.
Data pre-processing
First, the expression microarray data-sets of the
glioma and control samples were extracted using the R affy package
(http://www.bioconductor.org/packages/release/bioc/html/affy.html).
Then, the Robust Multiarray Average (RMA) method, practically
supported by the justRMA function of the R affy package, was used
to normalize the data through log 2 transformation (11).
DEG screening and clustering
Significance analysis of micro-array (SAM) of two
classes of unpaired measurements was performed for DEG
identification using the MeV software (12). Only genes with |log fold change
(FC)|≥2 and a false detection rate (FDR) <0.05 were regarded as
DEGs between the control and the tumor samples. Regardless of the
cell type, DEGs at three grades (II, III and IV) were obtained.
Using the Short Time Series Expression Miner (STEM) method
specifically designed for the analysis of short time series gene
expression data by Ernst and Bar-Joseph (13), these DEGs were classified according
to their differential expression degrees during tumor
progression.
Construction of PPI network and KEGG
pathway enrichment analysis
The web-accessible online bioinformatics tool
EnrichNet (http://www.enrichnet.org/) was used
to perform a functional enrichment analysis of the classified DEGs
(14) through calculating the
overlaps between KEGG pathway and PPI network built with the
self-defined gene sets. Unlike the methods (e.g. WebGestalt,
http://bioinfo.vanderbilt.edu/webgestalt/ and DAVID,
http://david.abcc.ncifcrf.gov/) that
only consider overlaps between self-defined gene sets and a known
KEGG pathway gene and address the importance of overlaps based on
the q-value by statistical tests (eg. one-sided Fisher’s exact
test), EnrichNet is an analytical method based on protein-protein
interaction (PPI) networks. First, a PPI network was built using
the Search Tool for the Retrieval of Interacting Genes (STRING)
database (15). Then, by comparing
the PPI network with the KEGG database, the similarity degree
between PPI and a certain pathway was determined using EnrichNet,
which is expressed as the XD-score, with a higher XD-score meaning
a greater similarity, indicating higher probability of enrichment
in a certain KEGG pathway. To help set the XD-score threshold,
EnrichNet also calculated the significance score (q-value) by the
classical overlap-based Fisher test, followed by linear regression
analysis with XD-score, by which the XD-score corresponding to the
q-value of 0.05 was selected as the threshold. Eventually, the
obtained Pearson correlation coefficient was 0.85, and the XD-score
was set at 0.96.
Results
Screening of DEGs
Through microarray analysis, a total of 4,506 DEGs
were detected and the number of DEGs increased with the increasing
glioma grade, with the largest number of DEGs (2,580) in grade IV
cells. The top ten up- and downregulated DEGs at each grade were
listed by their FC value (Table
I).
 | Table ITop ten down- and upregulated
differentially expressed genes in grade II, grade III and grade IV
glioma samples. |
Table I
Top ten down- and upregulated
differentially expressed genes in grade II, grade III and grade IV
glioma samples.
| DEGs | Grade II | Grade III | Grade IV |
|---|
| Downregulated | SERPINF1 | BRSK1 | PRCD |
| EPHA5 | MAFK | KIAA1324L |
| TMEFF2 | C6orf114 | KCNIP2 |
| FLJ30594 | LOC730125 | PPP2R2B |
| KIFC2 | SEC61A2 | TGFA |
| FEZF2 | BTBD9 | ARHGEF4 |
| STOX2 | MEF2C | C10orf84 |
| AP1S1 | ENTPD4 | DPY19L2P2 |
| ADARB1 | CACNB3 | TMEM16E |
| YWHAB | BRUNOL6 | PLCL2 |
| Upregulated | TMEM100 | SOX11 | TOP2A |
| LPL | hCG_1815491 | IGFBP2 |
| MTHFD2 | TOP2A | PTX3 |
| SOX11 | LPL | hCG_1815491 |
| BMP2 | EGFR | POSTN |
| DLL3 | PBK | EGFR |
| C20orf42 | TMEM100 | MEOX2 |
| TIMP4 | RRM2 | NNMT |
| SOX4 | TMSL8 | RRM2 |
| EGFR | TIMP4 | IBSP |
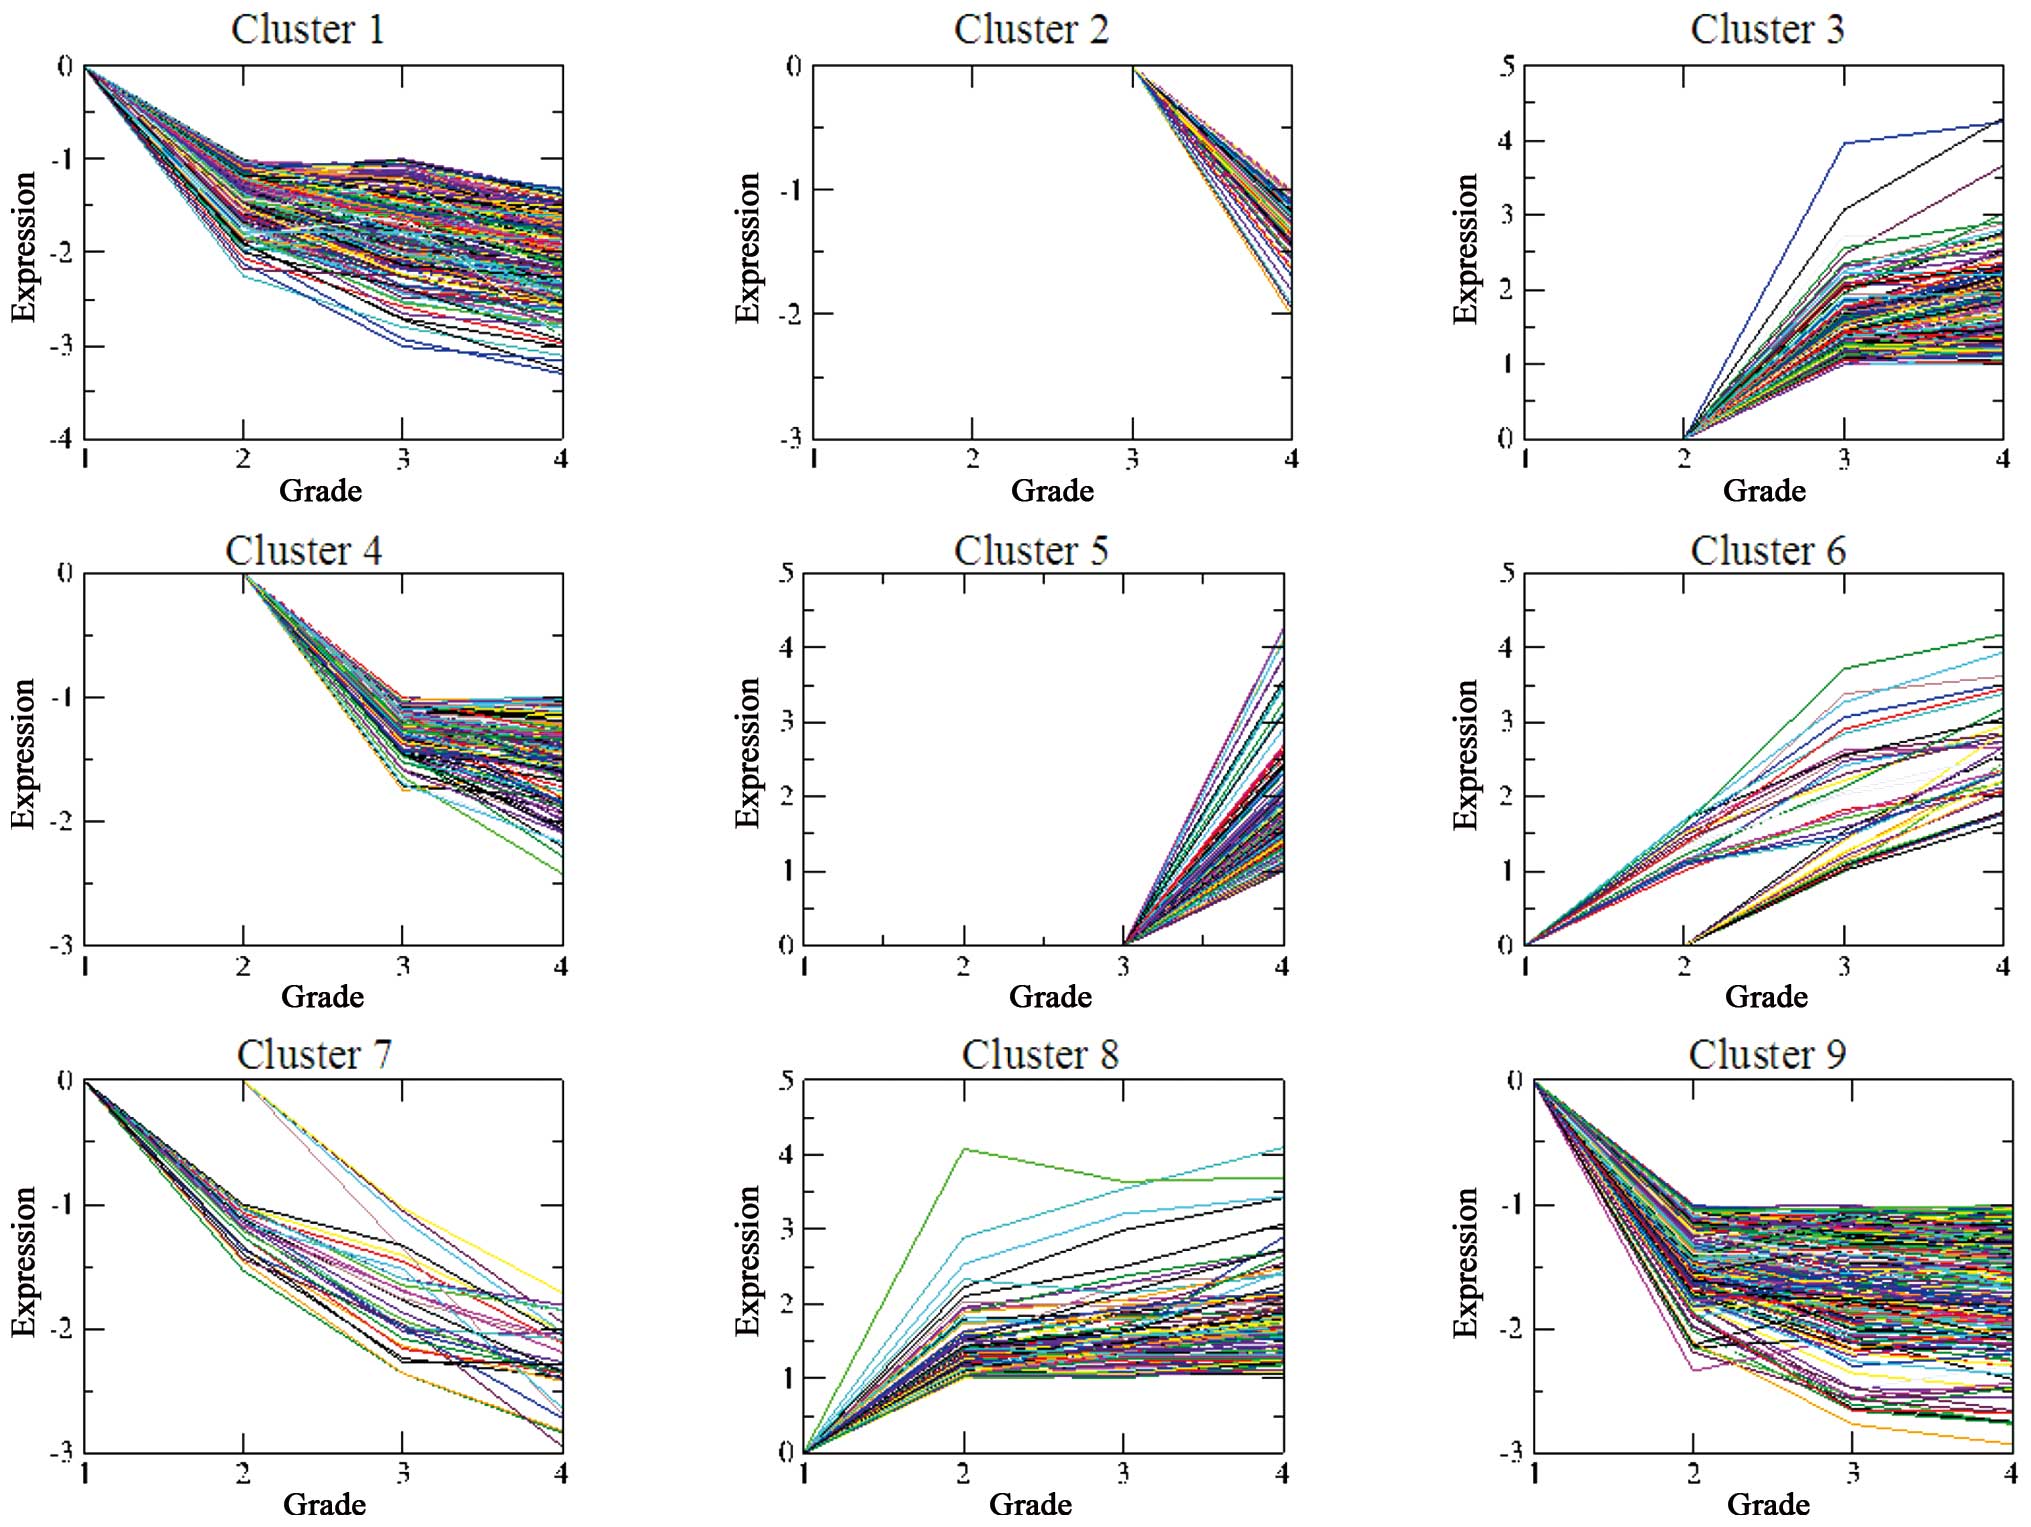
Grade-dependent gene clustering
Several genes were not differentially expressed at
all the three grades, and the missing expression value was assigned
as 0. According to STEM analysis, the DEGs were grouped into nine
important gene clusters, which were ranked according to their
significance (P-value) (Table
II). The differences in the expression values of almost all the
DEGs increased with the increasing grade: DEGs in clusters 1, 6, 7,
8 and 9 revealed differential expressions at grade II, while DEGs
in clusters 3 and 4 revealed differential expression at grade III,
and DEGs in clusters 2 and 5 exhibited differential expression at
grade IV (Fig. 1).
| Table IIDifferentially expressed genes
clustered by the short time-series expression miner method. |
Table II
Differentially expressed genes
clustered by the short time-series expression miner method.
| Cluster | Number of
genes | P-value |
|---|
| 1 | 269 |
1.60×10−187 |
| 2 | 374 |
2.30×10−54 |
| 3 | 296 |
5.20×10−53 |
| 4 | 264 |
8.00×10−39 |
| 5 | 478 |
3.70×10−36 |
| 6 | 36 |
2.80×10⁻²¹ |
| 7 | 32 |
1.20×10⁻¹⁷ |
| 8 | 127 |
1.40×10⁻⁷ |
| 9 | 323 |
6.30×10⁻⁴ |
Pathway enrichment analysis of the PPI
network
A total of 2,199 genes in the nine clusters were
submitted to EnrichNet to construct a PPI network, followed by KEGG
pathway enrichment analysis. Finally, 11 KEGG pathways with
XD-scores larger than the threshold (0.96) were re-ranked according
to their corresponding Fisher q-values (Table III). If q-value <0.05 was set
as the threshold, only the first six pathways were enriched.
| Table IIIEnriched Kyoto Encyclopedia of Genes
and Genomes pathways for differentially expressed genes in the
protein-protein interaction network. |
Table III
Enriched Kyoto Encyclopedia of Genes
and Genomes pathways for differentially expressed genes in the
protein-protein interaction network.
| Rank | Pathway | XD-score | Fisher q-value | Overlapping gene
number |
|---|
| 1 | hsa04512:
Extracellular matrix-receptor interaction | 1.7601 |
7.58×10⁻⁶ | 29 |
| 2 | hsa04720: Long-term
potentiation | 1.6560 |
4.84×10⁻⁴ | 22 |
| 3 | hsa04145:
Phagosome | 1.0851 |
4.95×10⁻⁴ | 36 |
| 4 | hsa05110: Vibrio
cholerae infection | 1.9504 |
6.95×10⁻⁴ | 18 |
| 5 | hsa05120:
Epithelial cell signaling in Helicobacter pylori
infection | 1.1594 |
4.78×10⁻³ | 19 |
| 6 | hsa04940: Type I
diabetes mellitus | 1.3101 |
1.69×10⁻² | 13 |
| 7 | hsa03030: DNA
replication | 1.3351 |
6.49×10⁻² | 10 |
| 8 | hsa04964: Proximal
tubule bicarbonate reclamation | 1.8351 |
6.77×10⁻² | 7 |
| 9 | hsa04320:
Dorso-ventral axis formation | 1.1829 |
1.17×10⁻¹ | 7 |
| 10 | hsa04966:
Collecting duct acid secretion | 1.3551 |
1.40×10⁻¹ | 7 |
| 11 | hsa00910: Nitrogen
metabolism | 0.9779 |
3.53×10⁻¹ | 5 |
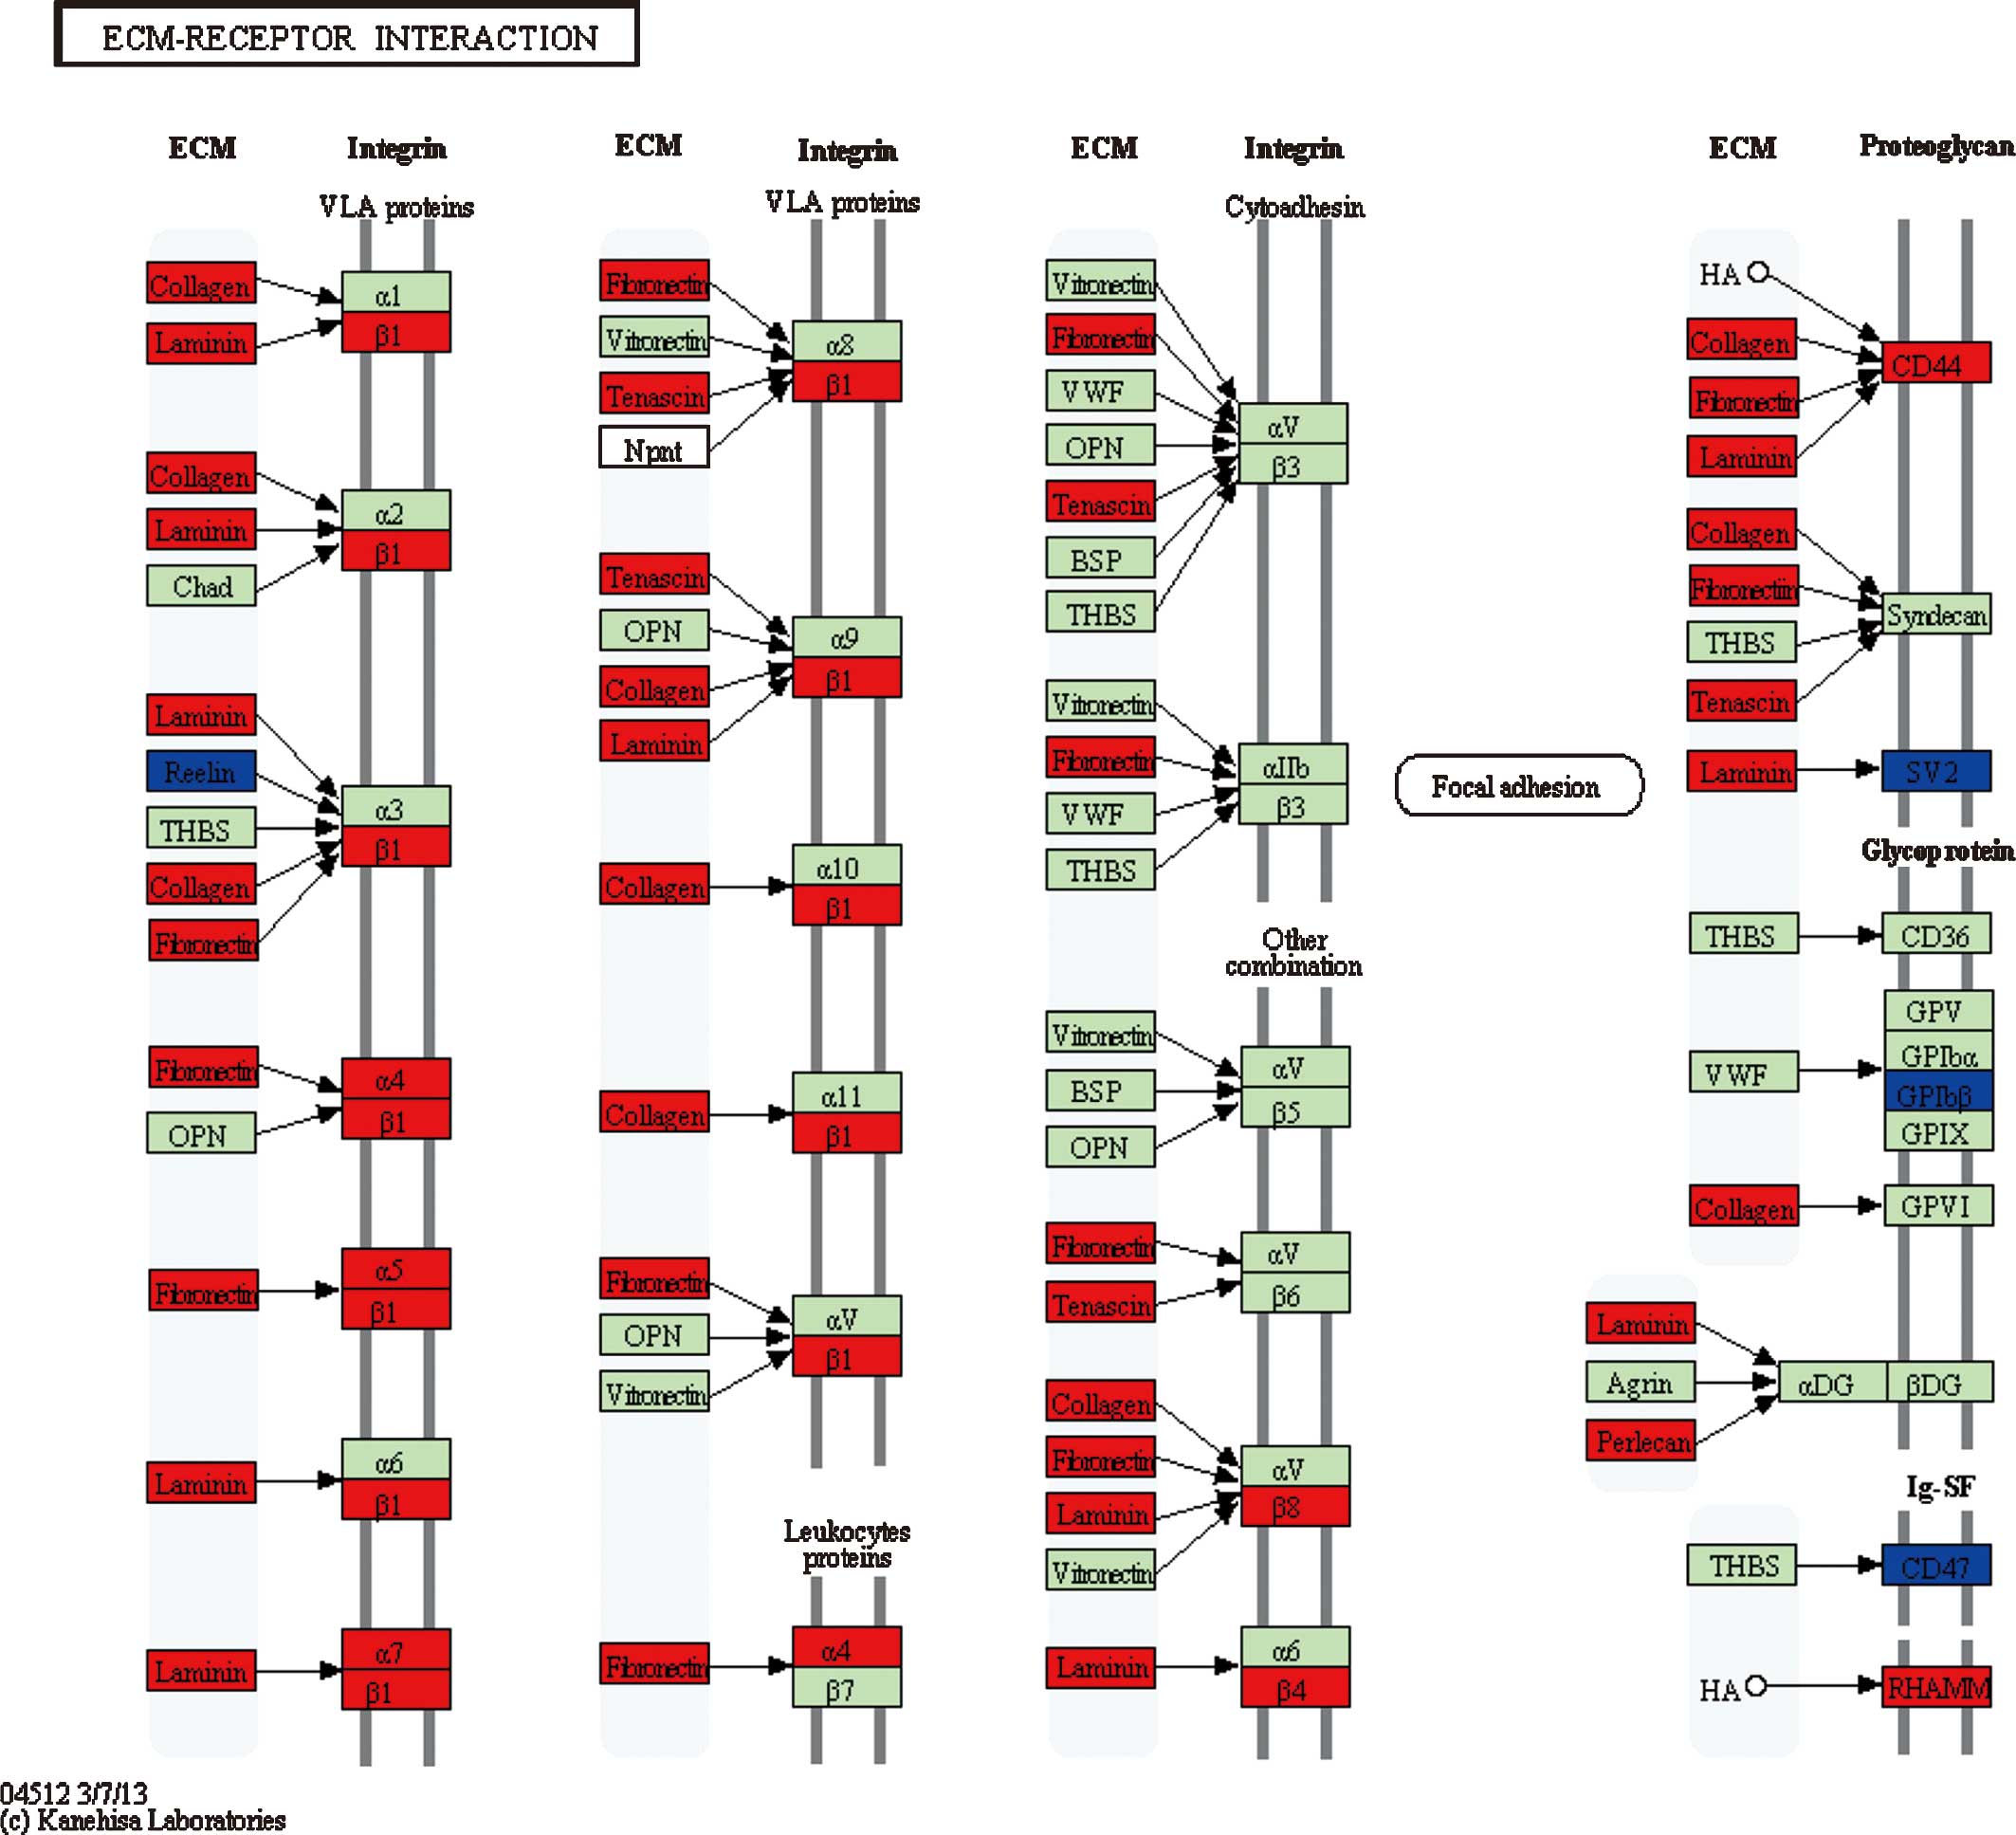
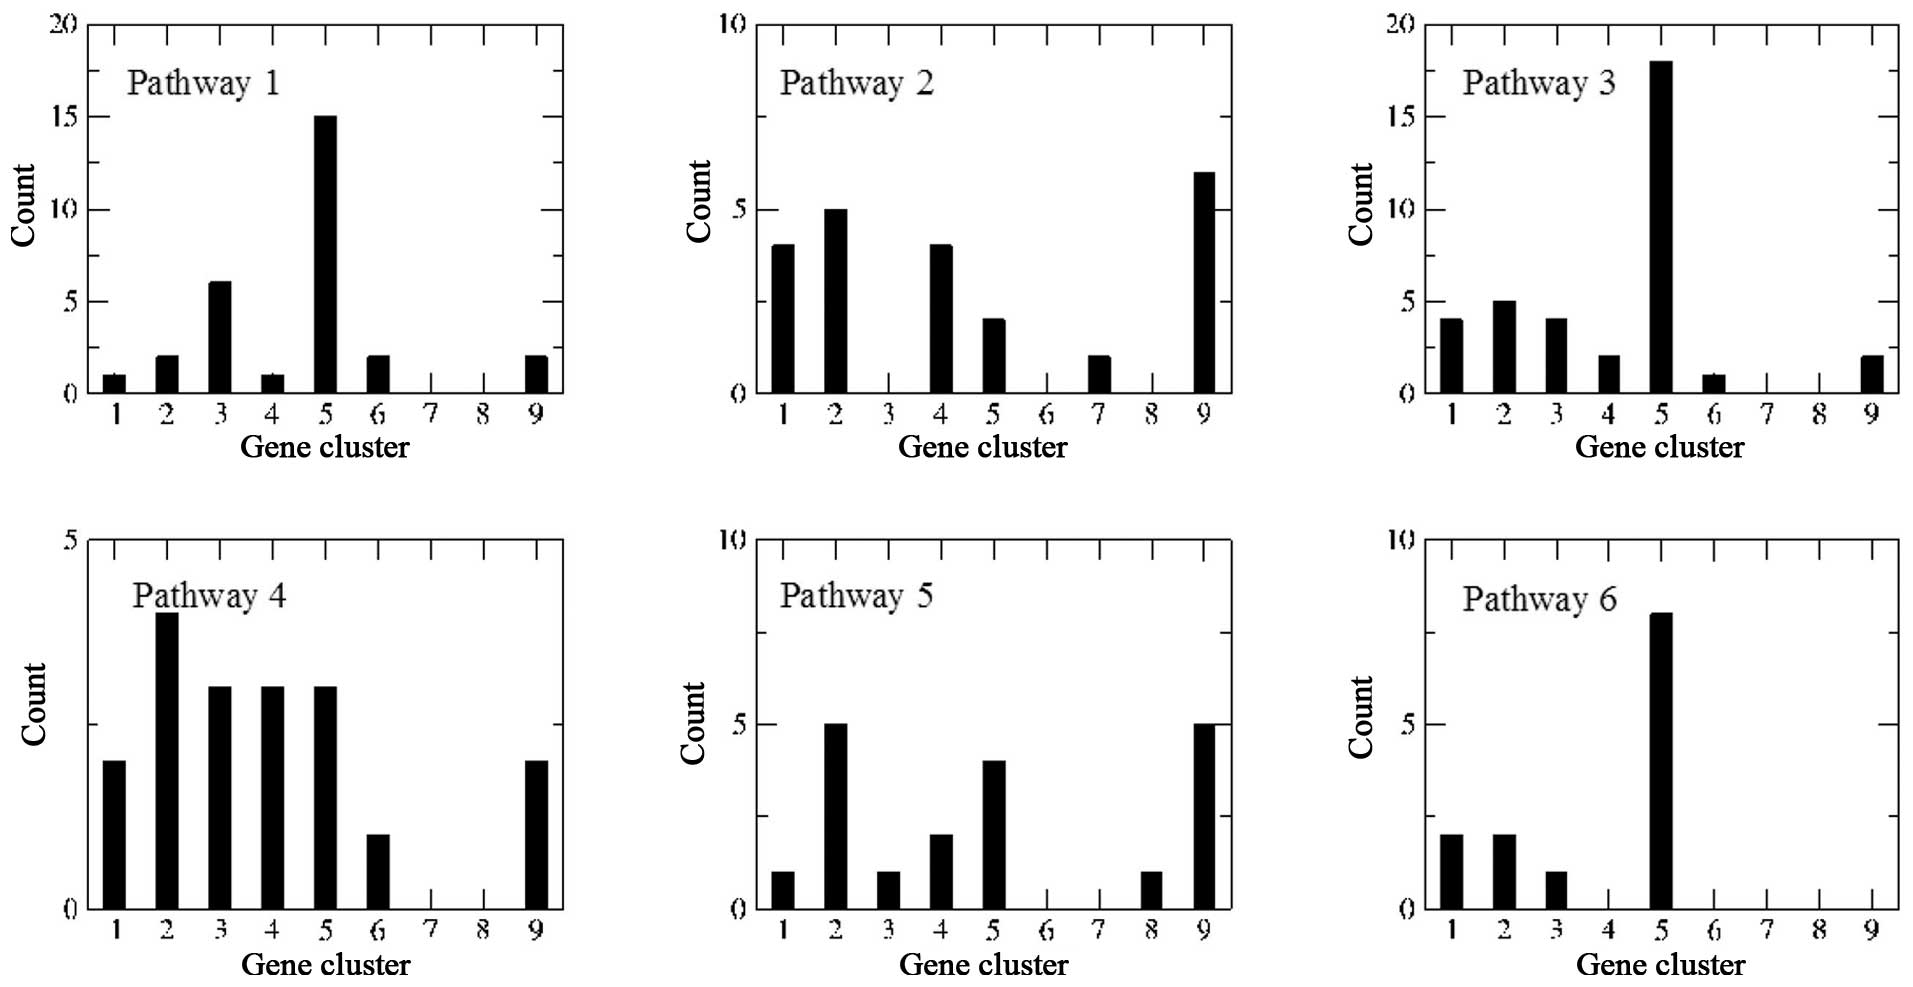
For pathway 1 [extracellular matrix (ECM)-receptor
interaction] (Fig. 3), 3
(phagosome) and 6 (type I diabetes mellitus), genes participating
in these three pathways largely belonged to cluster 5. For example,
the collagen-encoding genes (COL1A2, COL3A1,
COL4A1 and COL6A2) and integrin-encoding genes
(ITGA and ITGB) in pathways 1 and 3, and HLA
genes (HLA-DPA1, HLA-DPB1, HLA-DQB1, HLA-DRA,
HLA-DRB1 and HLA-G) in pathways 3 and 6 may have
important roles in the development progress of malignant gliomas.
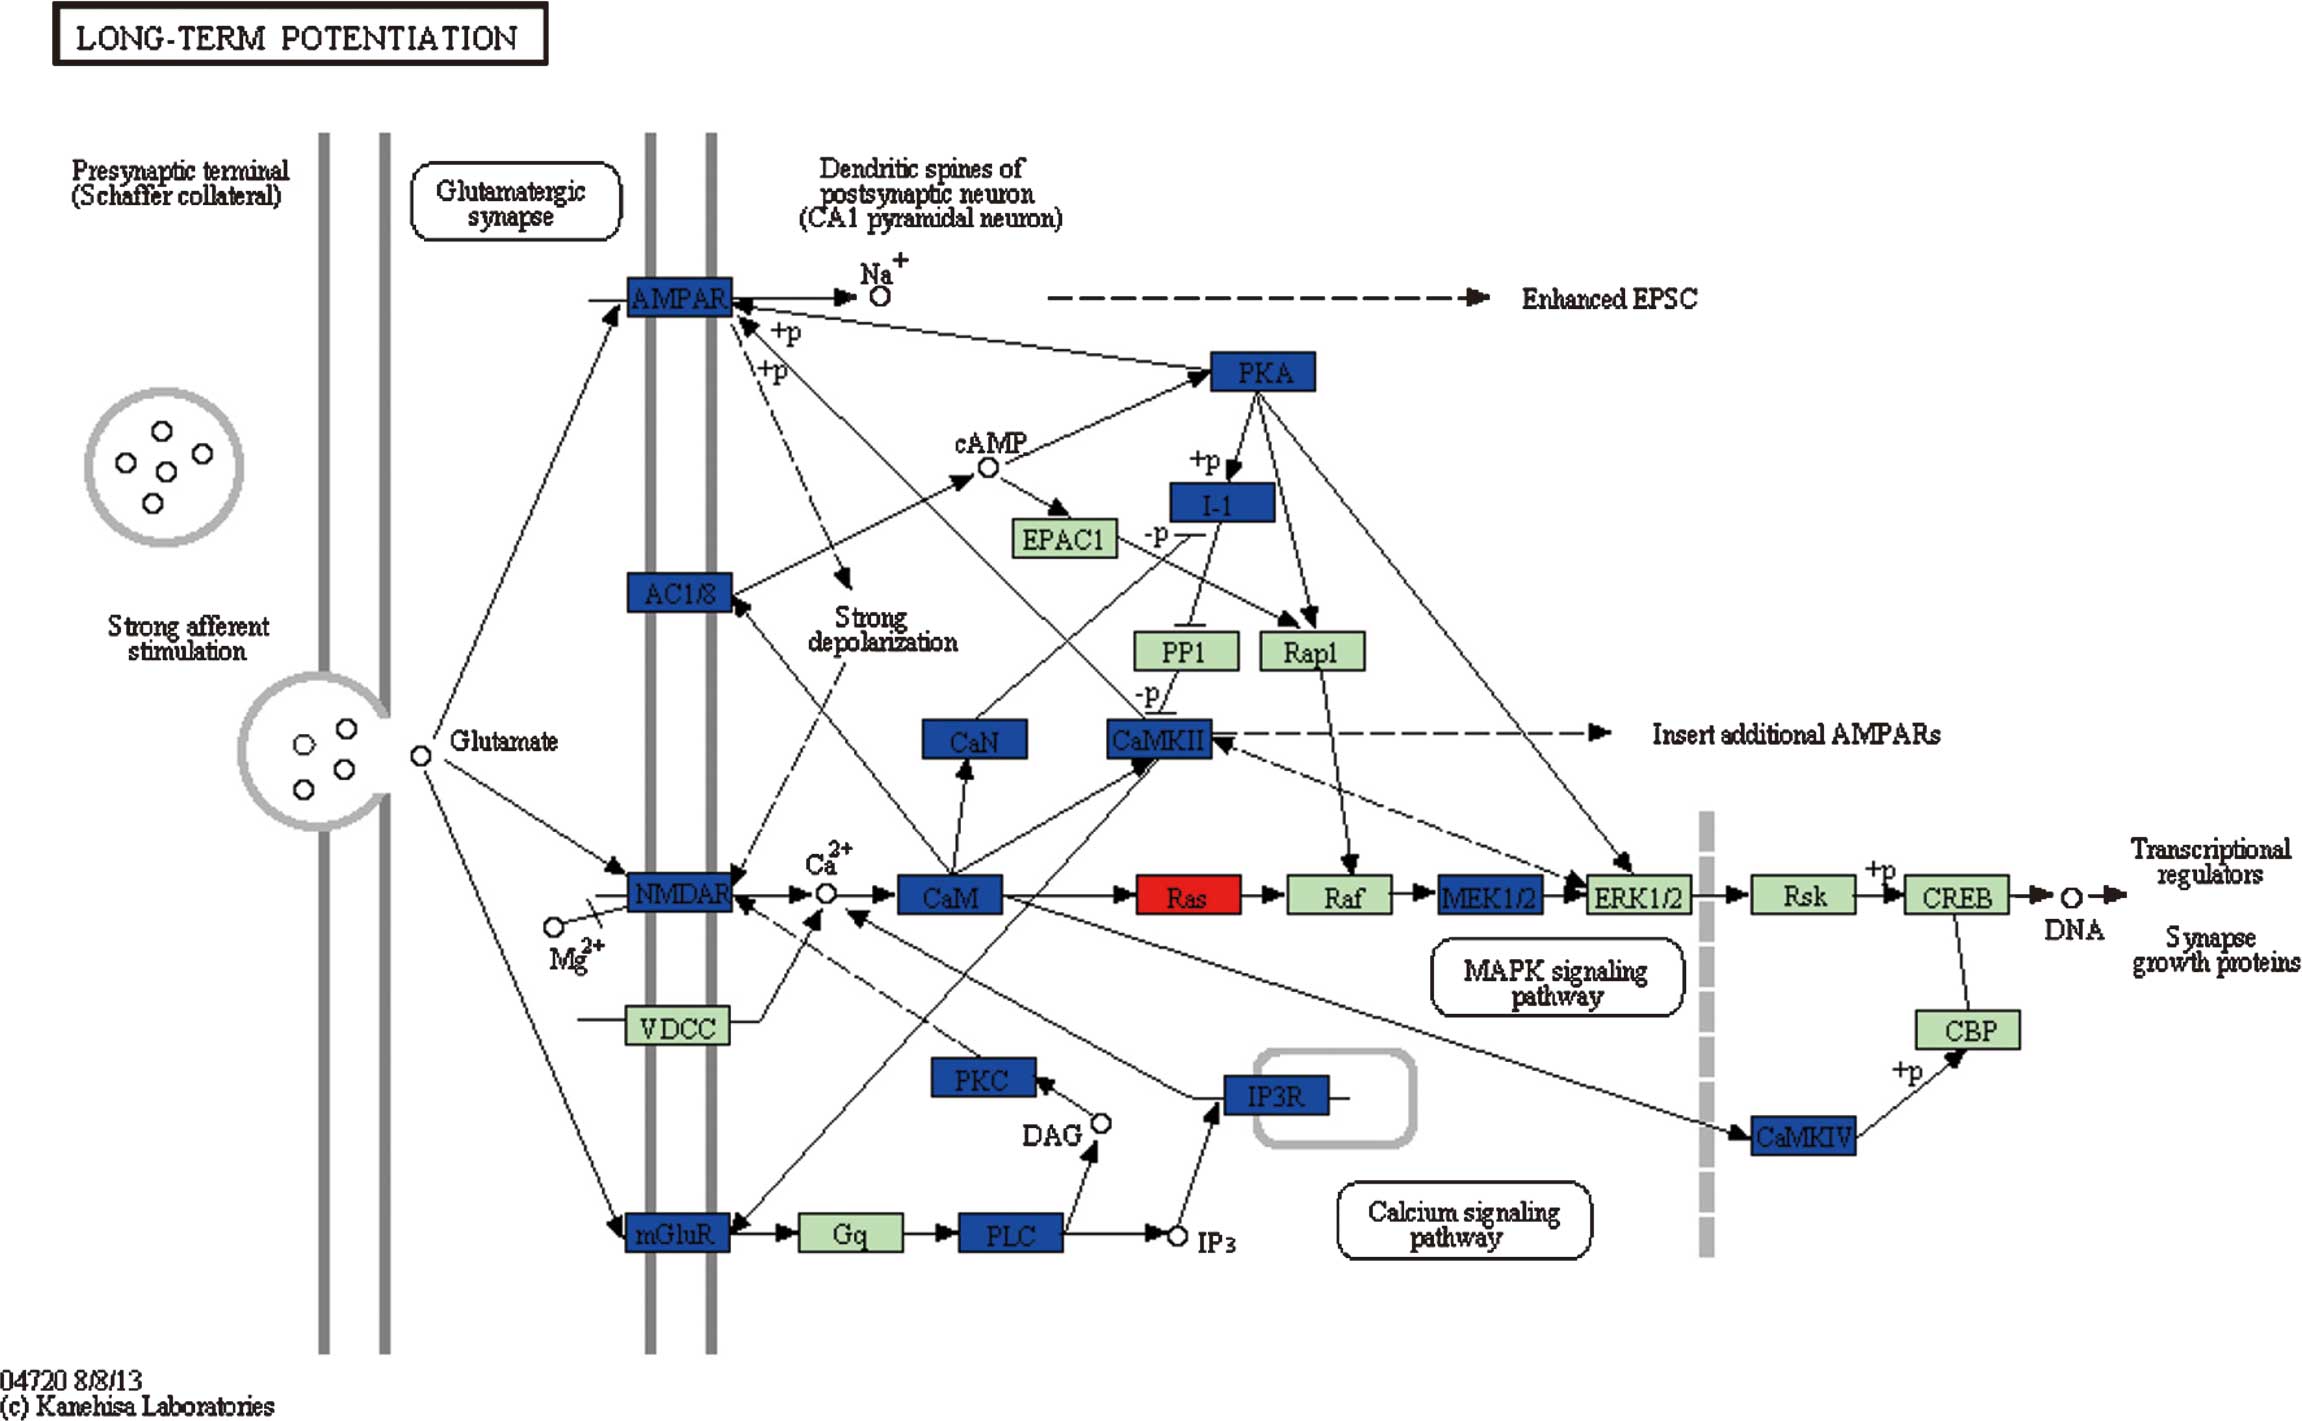
For pathways 2 (long-term potentiation) (Fig. 4), 4 (Vibrio cholerae
infection) and 5 (epithelial cell signaling in Helicobacter
pylori infection), genes involved in these three pathways
belonged to different clusters, indicating that these genes may be
associated with the occurrence of glioma. In particular, genes
belonging to clusters 1, 8 and 9, which were differentially
expressed in grade II glioma cells, accounted for nearly 50% of
DEGs in pathway 2 (Fig. 2).
Discussion
In the present study, the DEGs enriched in pathways
1, 3 and 6 mainly belonged to cluster 5 and were differentially
expressed at grade IV, indicating that these pathways and their
associated DEGs may have important roles in the deterioration of
glioma into glioblastoma. Among these DEGs, integrin-encoding genes
(ITGA and ITGB) were observed to be upregulated in
pathways 1 and 3. Taking the ECM-receptor interaction pathway as an
example, it refers to the interaction between ECM components and
glioma cells, during which cellular matrix receptors function as
mediators, and this interaction was previously reported to be
responsible for the clinically important features of malignant
gliomas, including cerebral invasion and leptomeningeal spread
(16). Integrins, a major group of
ECM receptors, which are involved in the adhesion and basement
membrane invasion of glioma cells (16), were upregulated in this pathway.
Collagen-encoding genes, which were markedly upregulated, took a
large proportion of DEGs in the first pathway and mostly belonged
to cluster 5, suggesting their important role in the deterioration
of glioma into glioblastoma. Collagens are primary components in
the ECM of most cell types and have been reported to be elevated in
gliomas compared to those in normal adult brain cells as well as to
have an important role in driving tumor progression (17). In this pathway, a small number of
genes, including SV2 (SV2B and SV2C), were
differentially expressed very early at grade II. Synaptic vesicle
glycoproteins (SV2; with the three different isoforms SV2A, SV2B
and SV2C) are a group of integral transmembrane proteins (18) with an important role in the
development of the central nervous system (19,20).
According to a study on patients orally administrated with
levetiracetam following surgery, an obvious increase in SV2
expression was observed in those with a good response (21), suggesting that higher SV2
levels may indicate a good prognosis. Thus, the significant
decrease in SV2 expression at grade II in this pathway was
speculated to correlate with the occurrence of glioma. In addition,
human leukocyte antigen (HLA) genes, including
HLA-DPA1, HLA-DPB1, HLA-DQB1, HLA-DRA,
HLA-DRB1 and HLA-G, took a large proportion of DEGs
in either pathway 3 or 6, particularly in pathway 6, in which these
genes were upregulated at grade IV, conforming to the significant
expression of HLA-DQB1 and HLA-DRB1 in patients with
high-grade glioma (HGG) observed by La Torre et al (22), and the positive correlation between
HLA-DRB1 and symptomatic cerebral glioma reported by Guerini
et al (23). Furthermore,
introduction of HLA-G1 or HLA-G5 into
HLA-G-negative glioma cells (U87MG) rendered them highly
resistant to direct alloreactive lysis, inhibited the
alloproliferative response and prevented efficient priming of
cytotoxic T cells (24); thus,
this gene may contribute to the immune escape in human
glioblastoma.
Furthermore, DEGs exclusively detected at grade IV
with large FC values (i.e., IGFBP2 and GABRA5)
revealed huge variation in expression levels compared to previous
grades, which was speculated to be closely correlated with the
significant changes during the development of glioma into
glioblastoma. IGFBP2 was reported to be overexpressed in
glioblastoma and promote glioma tumor stem cell expansion and
survival (25). Gamma-aminobutyric
acid (GABA) A receptor, alpha 5 (GABRA5) (26) is a part of the extrasynaptic GABA
A-channels and involved in tonic currents (27). The lowest GABRA5 mRNA levels
were found in glioblastoma compared to gliomas of lower malignancy
(28), which is consistent with
the remarkable decrease in GABRA5 expression.
Since the DEGs participating in pathways 2, 4 and 5
belong to different clusters, it can be inferred that these
pathways and their associated DEGs may have a role at each stage
during glioma progression. As the long-term potentiation pathway
contained a large proportion of DEGs from clusters 1, 8 and 9,
which were differentially expressed in very low-grade glioma cells,
it is presumed that this pathway is closely associated with the
occurrence of glioma. This pathway has been widely considered as
one of the major cellular mechanisms that underlies learning and
memory (29). Memory reduction is
the most important and distinctive feature in high-grade glioma,
thus it can be inferred that memory impairment in high-grade glioma
patients is associated with the pathological changes in this
molecular process, which may be attributed to the alterations in
gene expression in this pathway. Compared to changes observed by
Dong et al (30) in the LTP
enrichment pathway, there were no significant changes observed in
the expression of PP1, Rap1, Raf and
ERK1/2, with downregulation of I-1,
AMPAR and AC1/8 expression, and upregulation
of Ras in the present study. The difference in the
expression of these genes may be attributed to the difference in
sample size, and should be further investigated. Additionally, Dong
et al (30) observed the
downregulation of mGluR5 expression in this pathway at grade
II, which is consistent with a previous study that reported the
impaired learning and reduced CA1 LTP in mice lacking mGluR5
(31).
In conclusion, long-term potentiation and
ECM-receptor interaction were discovered to have an important role
in the occurrence and development of gliomas, which may provide a
novel and comprehensive view for the treatment of gliomas. The
associated DEGs, including SV2, NMDAR and
mGluRs, can be considered to be used as biomarkers or
therapeutic targets for gliomas. However, the results of the
present study require to be further confirmed by additional
experiments.
References
|
1
|
Mamelak AN and Jacoby DB: Targeted
delivery of antitumoral therapy to glioma and other malignancies
with synthetic chlorotoxin (TM-601). Expert Opin Drug Deliv.
4:175–186. 2007. View Article : Google Scholar : PubMed/NCBI
|
|
2
|
Goebell E, Paustenbach S, Vaeterlein O, et
al: Low-grade and anaplastic gliomas: differences in architecture
evaluated with diffusion-tensor MR imaging. Radiology. 239:217–222.
2006. View Article : Google Scholar : PubMed/NCBI
|
|
3
|
Fine HA, Dear KB, Loeffler JS, Black PM
and Canellos GP: Meta-analysis of radiation therapy with and
without adjuvant chemotherapy for malignant gliomas in adults.
Cancer. 71:2585–2597. 1993. View Article : Google Scholar : PubMed/NCBI
|
|
4
|
Stark AM, Hugo H, Witzel P, Mihajlovic Z
and Mehdorn HM: Age-related expression of p53, Mdm2, EGFR and Msh2
in glioblastoma multiforme. Zentralbl Neurochir. 64:30–36. 2003.
View Article : Google Scholar : PubMed/NCBI
|
|
5
|
Li J, Yen C, Liaw D, et al: PTEN, a
putative protein tyrosine phosphatase gene mutated in human brain,
breast and prostate cancer. Science. 275:1943–1947. 1997.
View Article : Google Scholar : PubMed/NCBI
|
|
6
|
Simon M, Köster G, Menon AG and Schramm J:
Functional evidence for a role of combined CDKN2A
(p16-p14ARF)/CDKN2B (p15) gene inactivation in malignant gliomas.
Acta Neuropathol. 98:444–452. 1999. View Article : Google Scholar : PubMed/NCBI
|
|
7
|
Freije WA, Castro-Vargas FE, Fang Z, et
al: Gene expression profiling of gliomas strongly predicts
survival. Cancer Res. 64:6503–6510. 2004. View Article : Google Scholar : PubMed/NCBI
|
|
8
|
Shai R, Shi T, Kremen TJ, et al: Gene
expression profiling identifies molecular subtypes of gliomas.
Oncogene. 22:4918–4923. 2003. View Article : Google Scholar : PubMed/NCBI
|
|
9
|
Nutt CL, Mani D, Betensky RA, et al: Gene
expression-based classification of malignant gliomas correlates
better with survival than histological classification. Cancer Res.
63:1602–1607. 2003.PubMed/NCBI
|
|
10
|
Sun L, Hui AM, Su Q, et al: Neuronal and
glioma-derived stem cell factor induces angiogenesis within the
brain. Cancer Cell. 9:287–300. 2006. View Article : Google Scholar : PubMed/NCBI
|
|
11
|
Gruber HE, Ingram JA, Hoelscher GL,
Zinchenko N, Hanley EN Jr and Sun Y: Asporin, a susceptibility gene
in osteoarthritis, is expressed at higher levels in the more
degenerate human inter-vertebral disc. Arthritis Res Ther.
11:R472009. View
Article : Google Scholar
|
|
12
|
Larsson O, Wahlestedt C and Timmons JA:
Considerations when using the significance analysis of microarrays
(SAM) algorithm. BMC Bioinformatics. 6:1292005. View Article : Google Scholar : PubMed/NCBI
|
|
13
|
Ernst J and Bar-Joseph Z: STEM: a tool for
the analysis of short time series gene expression data. BMC
Bioinformatics. 7:1912006. View Article : Google Scholar : PubMed/NCBI
|
|
14
|
Glaab E, Baudot A, Krasnogor N, Schneider
R and Valencia A: EnrichNet: network-based gene set enrichment
analysis. Bioinformatics. 28:i451–i457. 2012. View Article : Google Scholar : PubMed/NCBI
|
|
15
|
Szklarczyk D, Franceschini A, Kuhn M, et
al: The STRING database in 2011: functional interaction networks of
proteins, globally integrated and scored. Nucleic Acids Res.
39(Database Issue): 561–568. 2011. View Article : Google Scholar
|
|
16
|
Paulus W and Tonn JC: Interactions of
glioma cells and extracellular matrix. J Neurooncol. 24:87–91.
1995. View Article : Google Scholar : PubMed/NCBI
|
|
17
|
Payne LS and Huang PH: The pathobiology of
collagens in glioma. Mol Cancer Res. 11:1129–1140. 2013. View Article : Google Scholar : PubMed/NCBI
|
|
18
|
Bajjalieh SM, Peterson K, Shinghal R and
Scheller RH: SV2, a brain synaptic vesicle protein homologous to
bacterial transporters. Science. 257:1271–1273. 1992. View Article : Google Scholar : PubMed/NCBI
|
|
19
|
Dong M, Yeh F, Tepp WH, et al: SV2 is the
protein receptor for botulinum neurotoxin A. Science. 312:592–596.
2006. View Article : Google Scholar : PubMed/NCBI
|
|
20
|
Crèvecoeur J, Foerch P, Doupagne M, et al:
Expression of SV2 isoforms during rodent brain development. BMC
Neurosci. 14:872013. View Article : Google Scholar : PubMed/NCBI
|
|
21
|
de Groot M, Aronica E, Heimans JJ and
Reijneveld JC: Synaptic vesicle protein 2A predicts response to
levetiracetam in patients with glioma. Neurology. 77:532–539. 2011.
View Article : Google Scholar : PubMed/NCBI
|
|
22
|
La Torre D, Maugeri R, Angileri FF, et al:
Human leukocyte antigen frequency in human high-grade gliomas: a
case-control study in Sicily. Neurosurgery. 64:1082–1088. 2009.
View Article : Google Scholar : PubMed/NCBI
|
|
23
|
Guerini FR, Agliardi C, Zanzottera M, et
al: Human leukocyte antigen distribution analysis in North Italian
brain glioma patients: an association with HLA-DRB1*14. J
Neurooncol. 77:213–217. 2006. View Article : Google Scholar
|
|
24
|
Wiendl H, Mitsdoerffer M, Hofmeister V, et
al: A functional role of HLA-G expression in human gliomas: an
alternative strategy of immune escape. J Immunol. 168:4772–4780.
2002. View Article : Google Scholar : PubMed/NCBI
|
|
25
|
Hsieh D, Hsieh A, Stea B and Ellsworth R:
IGFBP2 promotes glioma tumor stem cell expansion and survival.
Biochem Biophys Res Commun. 397:367–372. 2010. View Article : Google Scholar : PubMed/NCBI
|
|
26
|
Otani K, Ujike H, Tanaka Y, et al: The
GABA type A receptor α5 subunit gene is associated with bipolar I
disorder. Neurosci Lett. 381:108–113. 2005. View Article : Google Scholar : PubMed/NCBI
|
|
27
|
Belelli D, Harrison NL, Maguire J,
Macdonald RL, Walker MC and Cope DW: Extrasynaptic GABAA receptors:
form, pharmacology and function. J Neurosci. 29:12757–12763. 2009.
View Article : Google Scholar : PubMed/NCBI
|
|
28
|
Smits A, Jin Z, Elsir T, et al: GABA-A
channel subunit expression in human glioma correlates with tumor
histology and clinical outcome. PLoS One. 7:e370412012. View Article : Google Scholar : PubMed/NCBI
|
|
29
|
Bliss TV and Collingridge GL: A synaptic
model of memory: long-term potentiation in the hippocampus. Nature.
361:31–39. 1993. View
Article : Google Scholar : PubMed/NCBI
|
|
30
|
Dong H, Siu H, Luo L, Fang X, Jin L and
Xiong M: Investigation gene and microRNA expression in
glioblastoma. BMC Genomics. 11(Suppl 3): 162010. View Article : Google Scholar
|
|
31
|
Lu YM, Jia Z, Janus C, et al: Mice lacking
metabotropic glutamate receptor 5 show impaired learning and
reduced CA1 long-term potentiation (LTP) but normal CA3 LTP. J
Neurosci. 17:5196–5205. 1997.PubMed/NCBI
|