Introduction
Gastric cancer remains the fourth most common type
of cancer and the second most common cause of cancer-associated
mortality worldwide (1). The
majority of cases of gastric cancer are diagnosed at an advanced
stage of development and, in patients no longer suitable for
surgery or in cases of post-surgery recurrence, no effective
treatment is currently available. Chemotherapy and radiotherapy
often cause serious side effects as, in addition to causing cancer
cell death, they affect normal tissue cells (2).
Cell-cell adhesion determines cell polarity and is
involved in cell differentiation and the maintenance of tissue
homeostasis. This cell-cell adhesion is disturbed during
oncogenesis, resulting in changes in signaling, loss of contact
inhibition and altered cell migration (3). There is increasing evidence
implicating cell-cell adhesion molecules in cancer, as potent
suppressors or as proto-oncogenic proteins (4). T-cadherin, also termed cadherin-13
(CDH13), is an atypical member of the cadherin superfamily, which
is anchored to cell membranes via glycosylphosphatidylinositol
(GPI) anchors, rather than transmembrane domains (5). Several previous studies have led to
T-cadherin being considered a tumor suppressor, as it is frequently
silenced in various types of cancer, including hepatocellular
carcinoma (6), colon carcinoma
(7), gallbladder carcinoma
(8), melanoma (9), lung cancer (10) and breast cancer (11). Previous studies have demonstrated
that the re-expression of T-cadherin may suppress cell
proliferation, angiogenesis and invasiveness, increase sensitivity
to apoptosis and decrease tumor growth (3).
Tang et al (12) revealed that the expression of
T-cadherin was significantly reduced in tumor tissue samples
compared with the adjacent normal tissue, and can be used as a
biomarker for the progression and prognosis of gastric cancer.
However, its tumor-suppressor mechanism in gastric cancer remains
to be elucidated. Angiogenesis is required for invasive tumor
growth and metastasis, and constitutes an important stage in the
control of cancer progression (13,14).
A previous study demonstrated that the hyperexpression of
T-cadherin in melanoma cells suppresses the growth of tumor masses
and angiogenesis in vivo (15). However, Hebbar et al
(16) demonstrated that T-cadherin
promotes tumor angiogenesis in breast cancer. Therefore, the
association between the expression of T-cadherin and angiogenesis
remains inconsistent.
The present study aimed to evaluate the expression
of T-cadherin in gastric cancer, and analyze the association
between the expression of T-cadherin and clinicopathological
features in a larger number of patients. In addition, the
association between the expression of T-cadherin and angiogenesis
was investigated.
Materials and methods
Specimens and samples
Specimens of primary gastric cancer and matched
adjacent normal tissue were obtained from 166 patients who
underwent surgery at The Second Affiliated Hospital of College of
Xi’an Jiaotong University (Xi’an, China), between 2010 and 2012.
The mean patient age was 62.3 years (range, 41–82). The tissue
samples were frozen in liquid nitrogen immediately following
resection and rinsing with phosphate-buffered saline (PBS), and
were maintained at −80ºC until RNA and protein extraction. Data on
the gender, age, smoking, alcohol intake, Helicobacter
pylori (Hp) infection, tumor size, lymph node metastasis
and the tumor-lymph node-metastasis (TNM) stage of the patients
with gastric carcinoma was also obtained. The International Union
against Cancer TNM staging system (17) was used to classify the patients.
Information on the survival rates of the 166 patients was followed
up through written and telephone communication. The present study
was approved by the Ethics Committee of The Second affiliated
hospital of College of Xi’an Jiaotong University.
Reverse transcription-quantitative
polymerase chain reaction (RT-qPCR)
Total RNA was extracted from the gastric cancer and
adjacent normal tissue samples using a TRIzol kit (Gibco BRL, Grand
Island, NY, USA), according to the manufacturer’s instructions. The
concentration of the total RNA was measured by spectrophotometry
(ND-1000; Thermo Fisher Scientific, Waltham, MA, USA). The RNA was
subsequently reverse-transcribed into cDNA using reverse
transcriptase reagents (dNTP mixture and RNase free
dH2O; Takara Bio Inc., Otsu, Shiga, Japan). RT-qPCR was
performed using the SYBR GreenI fluorescent dye method (SYBR Premix
Ex Taq™ II; Takara Bio Inc.) and a Rotor Gene 3000 RT-qPCR
apparatus (Qiagan, Shanghai, China). The following primers from
(Beijing AuGCT Biotechnology Co., Ltd., Beijing, China) were used:
T-cadherin, forward 5′-GATGTTGGCAAGGTAGTCGAT-3′ and reverse
5′-GCTCCCTGTGTTCTCATTGAT and β-actin, forward
5′-ATCGTGCGTGACATTAAGGAGAAG-3′ and reverse
5′-AGGAAGGAAGGCTGGAAGAGTG-3′. The expression of β-actin was used as
an internal control to assess the relative expression of
T-cadherin. The PCR reaction was performed in a final volume of 20
μl, which contained 10 μl SYBR Premix Ex TaqTM II, 1
μl cDNA, 0.5 μl of each primer and 8 μl
enzyme-free water. The PCR conditions were as follows:
Predenaturing at 95ºC for 3 min, followed by 40 cycles of
denaturation at 95ºC for 10 sec and annealing/extension at 60ºC for
30 sec. The amplification specificity was assessed by melting curve
analysis. The PCR products were run on a 2% agarose gel
(Sigma-Aldrich, St. Louis, MO, USA) stained with ethidium bromide
(Shaanxi Pioneer Biotech Co., Ltd., Xi’an, China) and were observed
to be 177 base pairs in size. The 2−∆∆CT method
(18) was used to calculate the
relative expression levels of the target gene produced, using a
Bio-Rad Real-Time analysis system (Bio-Rad Laboratories, Hercules,
CA, USA).
Western blotting
The cytosolic protein extraction from the gastric
cancer and adjacent normal tissuse samples were performed, as
described previously. Samples of 50 μg protein were mixed
with gel loading buffer (Beyotime Institute of Biotechnology,
Shanghai, China), boiled for 5 min and loaded onto 8 or 10%
polyacrylamide gels (Shaanxi Pioneer Biotech Co., Ltd.).
Electrophoresis was performed and the proteins were transferred
onto nitrocellulose membranes (Millipore, Billerica, MA, USA).
Non-specific antibody binding was blocked by pre-incubation of the
membranes with 1X Tris-buffered saline (TBS; Beijing ComWin Biotech
Co., Ltd., Beijing, China), containing 5% non-fat milk (Yili Group,
Inner Mongolia, China) for 2 h at room temperature. The membranes
were incubated overnight at 4ºC with primary antibodies against
human T-cadherin (rabbit polyclonal; 1:1,000; ABT121; Millipore) or
β-actin (mouse monoclonal; 1:1,000; sc-47778; Santa Cruz
Biotechnology, Inc., Santa Cruz, CA, USA) in 1X TBS, containing 5%
non-fat milk. Following washing with TBS for 5 min 3 times, the
membranes were incubated with horseradish peroxidase-conjugated
anti-rabbit immuno-globulin G (1:4,000; sc-2004; Santa Cruz
Biotechnology, Inc.) for 2 h at room temperature. The bands were
visualized using a SuperSignal Substrate Chemiluminescence kit
(Millipore).
Immunohistochemistry
Paraffin-embedded (Sigma-Aldrich) tissue sections
were de-waxed in xylene (Xi’an Chemical Reagent Factory, Xi’an,
China) and rehydrated with a graded ethanol (Xi’an Chemical Reagent
Factory) series. The slides used were from Wuhan Boster Biological
Technology Ltd. (Wuhan, China). The tissue sections were
subsequently treated with 3% hydrogen peroxidase (Zhongshan Jinqiao
Bio., Beijing, China) for 15 min at room temperature, followed by
incubation overnight at 4ºC with diluted primary antibodies against
T-cadherin (1:100) or vascular epidermal growth factor (VEGF; mouse
monoclonal; 1:100; sc-7269; Santa Cruz Biotechnology, Inc.,). The
tissue sections were then incubated with secondary antibody.
Specific reactivity was detected using a 3,3′-Diaminobenzidine
Tetrahydrochloride kit (Zhongshan Jinqiao Bio.) and counterstained
with hematoxylin (Sigma-Aldrich). The immunostaining was assessed
by two independent pathologists in a blinded-manner. The slide used
as a negative control was incubated with PBS rather than primary
antibody. The positive controls used were cardiac muscle tissues
known to exhibit high protein expression levels of T-cadherin. The
cells were considered positive for the protein expression of
T-cadherin when the cell membrane was stained. Each slide was
evaluated in five randomly selected fields with an E100 microscope
(Nikon, Tokyo, Japan) at a magnification of ×400, and 100–200 cells
per field were counted. The immunohistochemical (IHC) scores
comprise the product of the scores of intensity (0, no staining; 1,
weakly stained; 2, moderately stained; 3, markedly stained) and
area (0, <5%; 1, 5–25%; 2, 25–50%; 3, >50%) of the staining
signals. Based on the expression of T-cadherin, the gastric cancer
tissues were divided into two groups: A low T-cadherin expression
group (IHC scores≤3) and the high T-cadherin expression group (IHC
scores>3). The same method was used for the expression of VEGF,
which was also divided into low and high expression groups.
Statistical analysis
All statistical analyses were performed using SPSS
13.0 software (SPSS, Inc., Chicago, IL, USA). The mRNA and protein
expression levels of T-cadherin in the gastric cancer and matched
adjacent tissues were analyzed using a paired sample t-test. The
association between the protein expression levels of T-cadherin and
various clinicopathological characteristics were assessed using a
χ2 test. The overall survival curves were calculated
using the Kaplan-Meier method and were analyzed using the log-rank
test. A Cox Proportional-Hazards regression model was produced to
determine which variables demonstrated individual prognostic value
in determining patient survival rates. Cox regression analysis was
performed at multivariate levels. P<0.05 was considered to
indicate a statistically significant difference and data are
expressed as the mean ± standard deviation.
Results
Expression levels of T-cadherin analyzed
by RT-qPCR, western blotting and immunochemistry
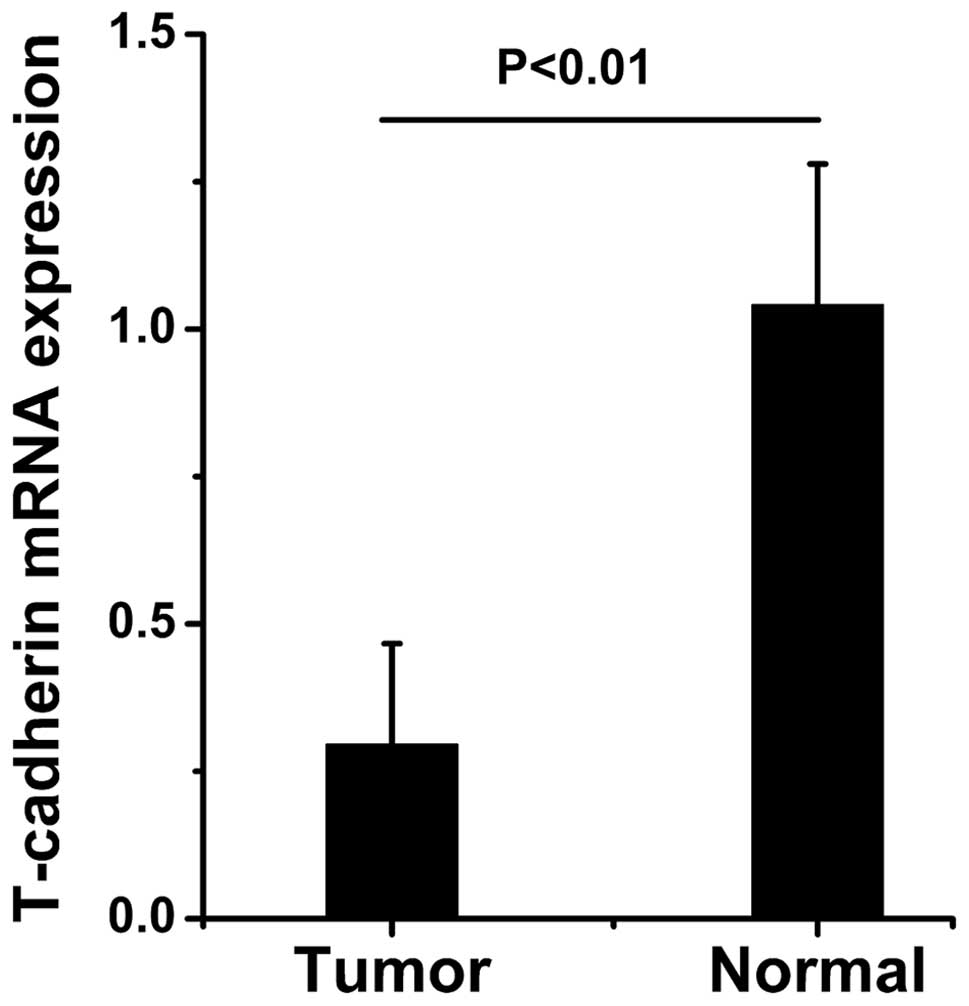
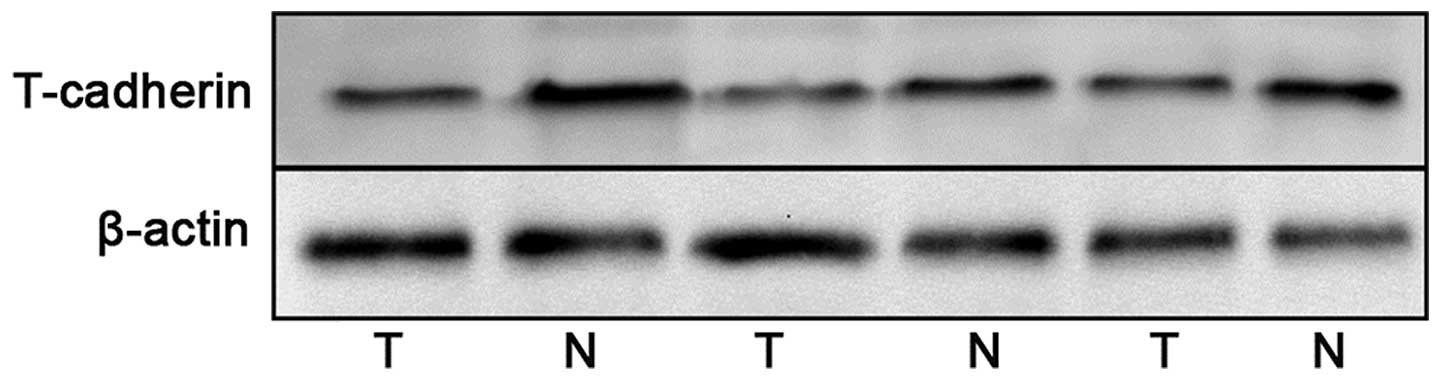
The mRNA expression levels of T-cadherin in the
tumor tissues and paired adjacent normal tissues were detected by
RT-qPCR. The protein expression levels of T-cadherin were detected
by western blotting and immunochemistry. The mRNA and protein
expression levels of T-cadherin were significantly reduced in the
gastric cancer tissue samples compared with the adjacent normal
tissue samples (Figs. 1Figure 2–3).
Clinical and pathological significance of
the expression of T-cadherin in gastric cancer
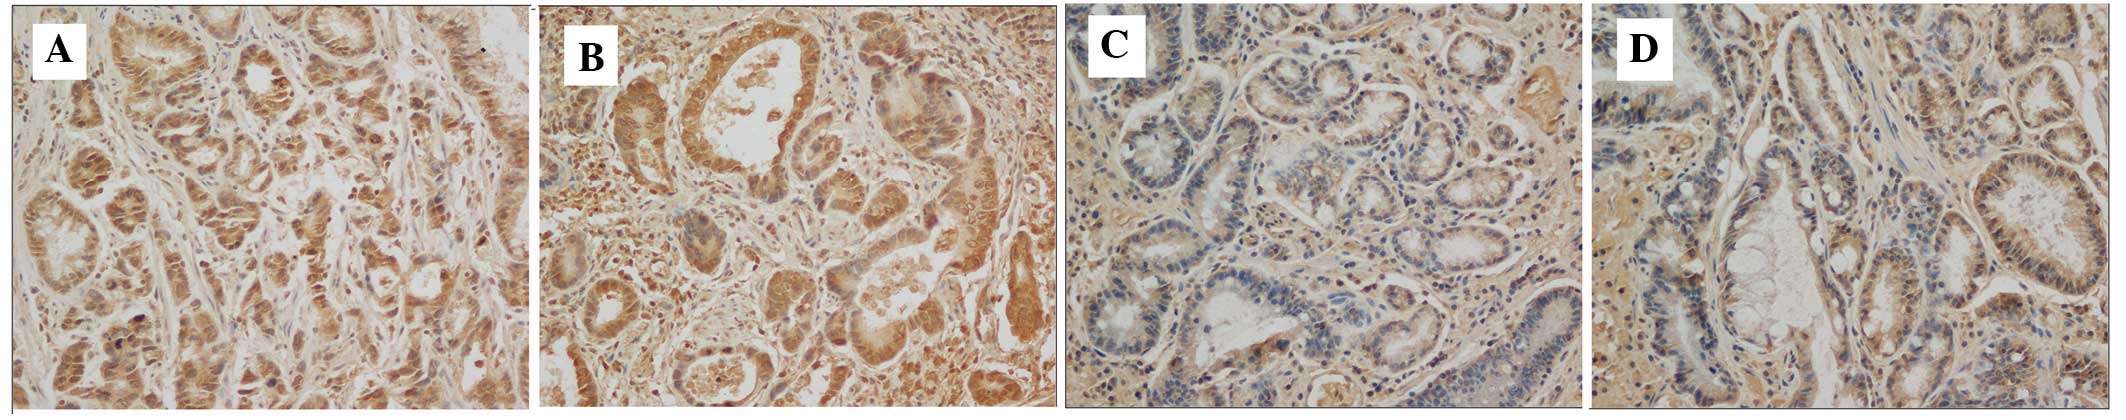
The present study demonstrated that T-cadherin was
expressed in the cell membrane and that the expression levels
varied in the gastric cancer tissue and the adjacent normal tissue
samples (Fig. 3). Among the 166
gastric cancer samples, 87 samples exhibited high expression
levels, whereas the remaining 81 cases exhibited low expression
levels (Table I). The adjacent
normal tissue samples revealed the most marked levels of T-cadherin
positive staining (Fig. 3).
Decreased protein expression levels of T-cadherin were found to
correlate with smoking, large tumor size (diameter >4 cm), lymph
node metastasis and a higher TNM stage (P<0.05 or P<0.01).
However, the protein expression levels of T-cadherin did not
correlate with gender, age, alcohol intake, Hp infection or
differentiation (P>0.05; Table
I).
 | Table ICorrelation between the expression of
T-cadherin and clinicopathological variables in gastric cancer. |
Table I
Correlation between the expression of
T-cadherin and clinicopathological variables in gastric cancer.
| Variable | Case (n) | Expression of
T-cadherin
| χ2 | P-value |
|---|
| Low (n) | High (n) |
|---|
| Gender | | | | | |
| Male | 108 | 52 | 56 | 0.052 | 0.820 |
| Female | 58 | 29 | 29 |
| Age (years) | | | | | |
| <60 | 80 | 42 | 38 | 0.848 | 0.357 |
| ≥60 | 86 | 39 | 47 |
| Smoking | | | | | |
| Yes | 69 | 43 | 26 | 8.643 | 0.003 |
| No | 97 | 38 | 59 |
| Alcohol
consumption | | | | | |
| Yes | 99 | 45 | 54 | 1.096 | 0.295 |
| No | 67 | 36 | 31 |
| Hp
infection | | | | | |
| Positive | 122 | 58 | 64 | 0.290 | 0.590 |
| Negative | 44 | 23 | 21 |
| Tumor size
(cm) | | | | | |
| ≤4 | 99 | 39 | 60 | 8.677 | 0.003 |
| >4 | 67 | 42 | 25 |
|
Differentiation | | | | | |
| Well-moderate | 63 | 25 | 38 | 3.375 | 0.066 |
| Poor | 103 | 56 | 47 |
| Histopathological
type | | | | | |
| Intestinal | 99 | 49 | 50 | 0.048 | 0.826 |
| Diffuse | 67 | 32 | 35 |
| Lymph node
metastasis | | | | | |
| Yes | 115 | 63 | 52 | 5.371 | 0.020 |
| No | 51 | 18 | 33 |
| TNM stage | | | | | |
| I–II stage | 79 | 28 | 51 | 10.755 | 0.001 |
| III–IV stage | 87 | 53 | 34 |
Correlation between the expression levels
of T-cadherin and VEGF
The present study determined the expression levels
of VEGF using immunochemistry in the tissue samples from 166 cases
of gastric cancer. The result revealed that the expression levels
of VEGF were not associated with the expression of T-cadherin
(P>0.05; Fig. 4, Table II).
| Table IICorrelation between the expression
levels of T-cadherin and VEGF in gastric cancer. |
Table II
Correlation between the expression
levels of T-cadherin and VEGF in gastric cancer.
| VEGF | T-cadherin
| r-value | P-value |
|---|
| Low | High |
|---|
| Low | 64 | 29 | −0.084 | 0.283 |
| High | 102 | 55 |
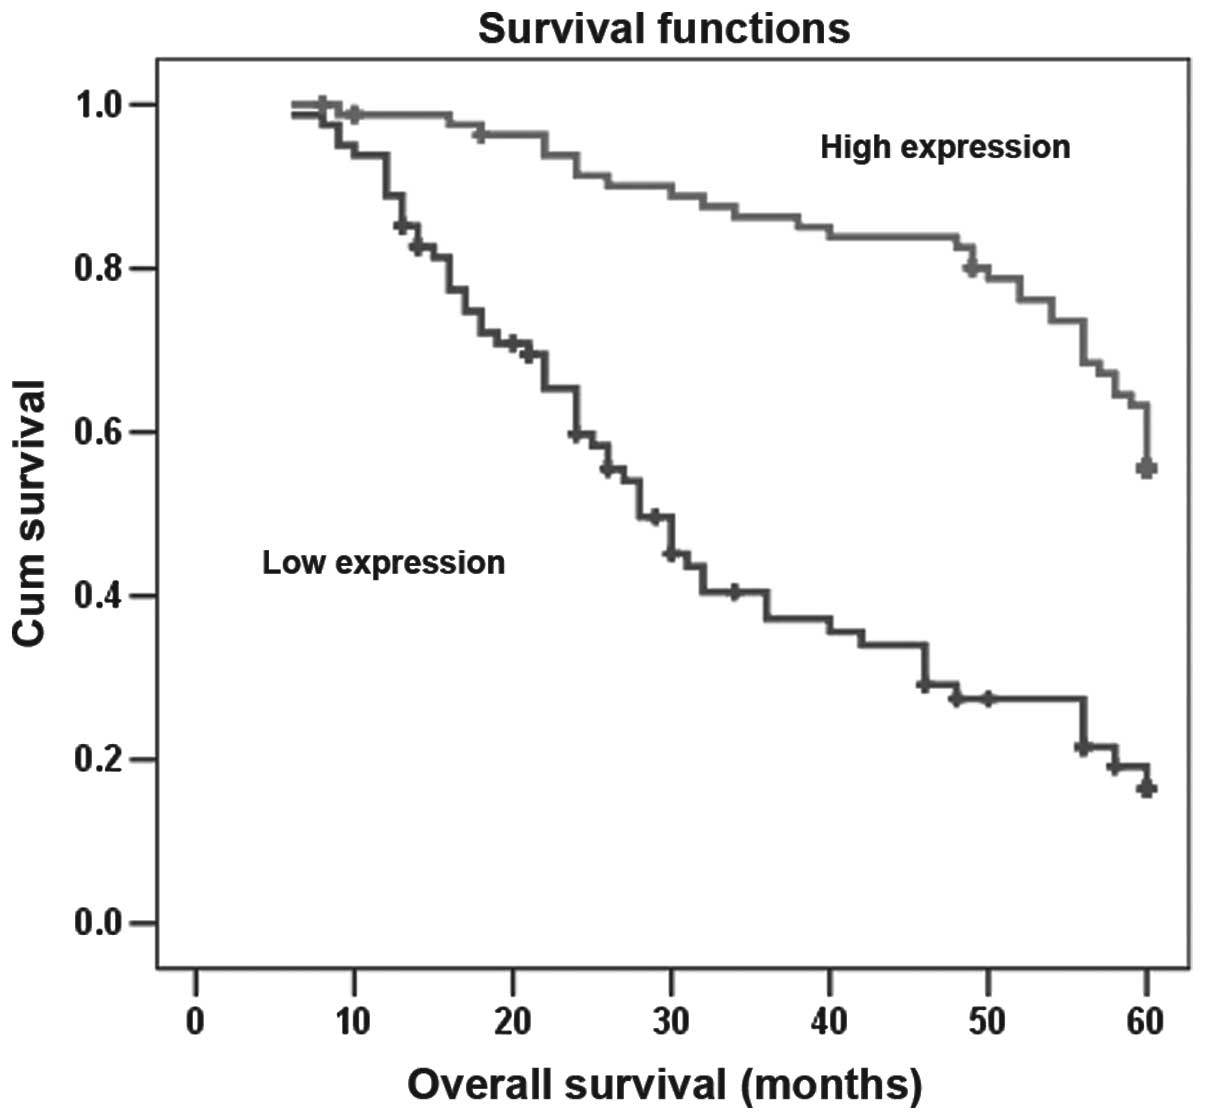
Correlation between the expression of
T-cadherin and the overall survival rates of patients with gastric
cancer
The patients with high expression levels of
T-cadherin in their tissue sample had a significantly improved
overall survival rate compared with patients exhibiting low
expression levels of T-cadherin (P<0.01; Fig. 5). The multivariate Cox regression
analysis demonstrated that smoking, smaller tumor sizes (diameter
<4 cm), no lymph node metastasis, good differentiation, a lower
TNM stage and higher expression levels of T-cadherin were closely
associated with a higher overall survival rate and were independent
risk factors for gastric cancer (P<0.05; Table III). However, the survival rate
did not correlate with gender, age, alcohol intake, Hp
infection or histopathological type (P>0.05).
| Table IIICox regression analysis of the
association between clinicopathological variables, expression of
T-cadherin and patient survival rates in gastric cancer. |
Table III
Cox regression analysis of the
association between clinicopathological variables, expression of
T-cadherin and patient survival rates in gastric cancer.
| Variable | HR (95% CI) | P-value |
|---|
| Gender
(male/female) | 0.943
(0.535–1.663) | 0.839 |
| Age (<60 or ≥60
years) | 1.005
(0.649–1.556) | 0.983 |
| Smoking
(no/yes) | 1.923
(1.064–3.475) | 0.030 |
| Alcohol
(no/yes) | 0.644
(0.360–1.152) | 0.138 |
| Hp infection
(no/yes) | 0.877
(0.505–1.523) | 0.640 |
| Tumor size (≤4
cm/>4 cm) | 1.761
(1.080–2.872) | 0.023 |
| Differentiation
(well or moderate/poorly) | 2.094
(1.257–3.488) | 0.005 |
| Histopathological
(intestinal/diffuse) | 0.840
(0.529–1.333) | 0.460 |
| Lymph node
metastasis (no/yes) | 2.121
(1.176–3.825) | 0.012 |
| TNM stages
(I–II/III–IV) | 2.159
(1.293–3.605) | 0.003 |
| T-cadherin
expression (low/high) | 0.384
(0.230–0.640) | 0.000 |
Discussion
Previous studies have demonstrated that cancer
progression is a multi-step process, in which cell-cell adhesion is
important for the development of recurrent, invasive and distant
metastasis (19). Multiple lines
of evidence have indicated that alterations in the adhesion
properties of cancer cells is vital in the development and
progression of cancer. Loss of intercellular adhesion allows
malignant cells to escape from their site of origin, degrade the
extracellular matrix and acquire a more invasive and metastatic
phenotype (20). Early evidence
demonstrated certain adhesion molecules, which have been implicated
in cancer as putative tumor suppressors, including E-cadherin
(21). However, there certain
adhesion molecules are also considered as pro-oncogenic proteins,
including P-cadherin (22) and
N-cadherin (23). CDH13, also
termed T- or H-cadherin, is the only cadherin known to be
membrane-anchored via a GPI anchor, rather than a trans-membrane
domain. The human CDH13 gene is often silenced in several
types of cancer and it has long been considered to act against
carcinogenesis (3). It has been
suggested that T-cadherin may inhibit tumor progression, including
proliferation, invasion and angiogenesis, through multiple
pathways, including the Akt and SET7/9-p53 pathways (8,24).
However, only one previous study has investigated the correlation
between the expression of T-cadherin and the clinicopatho-logical
features of gastric cancer, and this included a relatively small
sample size (12).
Previous studies have revealed that the loss of
T-cadherin is associated with methylation, and that treatment with
a demethylating agent reactivates its expression (6,7,25).
The present study demonstrated that the T-cadherin protein was
expressed in the cell membrane of the normal and the malignant
gastric mucosa. The mRNA and protein expression levels of
T-cadherin were reduced in the gastric cancer tissue samples
compared with the corresponding normal tissue samples. In addition,
its expression exhibited a close association with the
clinicopathological features of gastric cancer. The decreased
protein expression of T-cadherin was associated with a larger tumor
size, lymph node metastasis and a higher TNM stage, however it was
not associated with gender, age, alcohol intake differentiation or
histopathological type. These results suggested that T-cadherin may
be important in tumor growth, invasion and metastasis. This result
was consistent with previous studies. Yan et al demonstrated
an increased expression of T-cadherin and reduced cell
proliferation in HepG2 cells (26), Philippova et al revealed
that a loss of T-cadherin increases the metastatic potential and
aggressiveness of squamous cell carcinoma (27) and Hebbard et al demonstrated
that the loss of T-cadherin promotes tumor angiogenesis and
metastasis in breast cancer (12).
VEGF is the key mediator of angiogenesis and metastasis in cancer,
and is upregulated by the expression of oncogenes (28,29).
Although the loss of T-cadherin has been considered to exhibit a
prometastatic effect, the underlying mechanism remains to be
elucidated. The present study assessed the expression of VEGF in
gastric cancer and analyzed its association with the expression
T-cadherin. The result demonstrated that the expression of VEGF was
not associated with the expression of T-cadherin in the gastric
cancer tissue samples, which suggested that other mechanism are
responsible for prometastatic effects following loss of T-cadherin
loss.
Liu et al indicated that T-cadherin may be
used as an independent prognostic biomarker for bladder
transitional cell carcinoma (30),
wheras Kim et al demonstrated that T-cadherin may be used as
a prognostic marker for patients with non-small cell lung cancer
(10). In the present study, the
survival rates of the patients revealed that those with high
expression levels of T-cadherin had a significantly higher
postoperative survival rate compared with those exhibiting low
expression levels of T-cadherin. Therefore, patients with gastric
cancer and reduced expression levels of T-cadherin may be a
high-risk group with poor survival rates and may require more
aggressive additional post-surgical systemic therapy. These results
suggested that measurement of the protein expression levels of
T-cadherin can assist in monitoring patient condition. According to
the Cox regression analysis, a smaller tumor size, lack of lymph
node metastasis, good level of differentiation, lower TNM stage and
higher expression levels of T-cadherin were closely associated with
increased overall survival rates, and the positive expression of
T-cadherin appeared to be the most important independent prognostic
predictor in gastric cancer.
Previous studies have demonstrated that smoking
(31), alcohol consumption
(32) and Hp infection
(33) are risk factors for gastric
cancer. Therefore, the present study investigated the possible
associations between the expression of T-cadherin and smoking,
alcohol and Hp infection. The results revealed that patients
with a history of smoking exhibited low expression levels of
T-cadherin. However, alcohol and Hp infection had no effect
on the expression of T-cadherin. In addition, the survival rates of
the patients suggested that those with a history of smoking had
lower postoperative survival rates compared with the patients
without a history of smoking, however, the overall survival rates
were not associated with alcohol and Hp infection.
In conclusion, the expression of T-cadherin was
found to decrease in gastric cancer and the expression levels were
associated with smoking, tumor size, lymph node metastasis and TNM
stage. The expression of T-cadherin may serve as an independent
prognostic predictor and be used as a biomarker to predict the
progression and prognosis of gastric cancer, however, no clear
association was observed between the expression levels of VEGF and
T-cadherin. In addition the results suggested that T-cadherin may
exhibit a tumor suppressor function in gastric cancer and has the
potential to be used as a target for therapeutic interventions for
gastric cancer.
Acknowledgments
This study was supported by the National Natural
Science Foundation of China (no. 81070328).
References
|
1
|
Jemal A, Bray F, Center MM, Ferlay J, Ward
E and Forman D: Global cancer statistics. CA Cancer J Clin.
61:69–90. 2011. View Article : Google Scholar : PubMed/NCBI
|
|
2
|
Ali Z, Deng Y and Ma C: Progress of
research in gastric cancer. J Nanosci Nanotechnol. 12:8241–8248.
2012. View Article : Google Scholar
|
|
3
|
Berx G and van Roy F: Involvement of
members of the cadherin superfamily in cancer. Cold Spring Harb
Perspect Biol. 1:a0031292009. View Article : Google Scholar
|
|
4
|
Makrilia N, Kollias A, Manolopoulos L and
Syrigos K: Cell adhesion molecules: role and clinical significance
in cancer. Cancer Invest. 27:1023–1037. 2009. View Article : Google Scholar : PubMed/NCBI
|
|
5
|
Philippova M, Joshi MB, Kyriakakis E,
Pfaff D, Erne P and Resink TJ: A guide and guard: the many faces of
T-cadherin. Cell Signal. 21:1035–1044. 2009. View Article : Google Scholar : PubMed/NCBI
|
|
6
|
Chan DW, Lee JM, Chan PC and Ng IO:
Genetic and epigenetic inactivation of T-cadherin in human
hepatocellular carcinoma cells. Int J Cancer. 123:1043–1052. 2008.
View Article : Google Scholar : PubMed/NCBI
|
|
7
|
Ren JZ and Huo JR: Correlation between
T-cadherin gene expression and aberrant methylation of T-cadherin
promoter in human colon carcinoma cells. Med Oncol. 29:915–918.
2012. View Article : Google Scholar
|
|
8
|
Adachi Y, Takeuchi T, Nagayama T and
Furihata M: T-cadherin modulates tumor-associated molecules in
gallbladder cancer cells. Cancer Invest. 28:120–126. 2010.
View Article : Google Scholar : PubMed/NCBI
|
|
9
|
Duan XS, Lu J, Ge ZH, Xing EH, Lu HT and
Sun LX: Effects of T-cadherin expression on B16F10 melanoma cells.
Oncol Lett. 5:1205–1210. 2013.PubMed/NCBI
|
|
10
|
Kim DS, Kim MJ, Lee JY, Kim YZ, Kim EJ and
Park JY: Aberrant methylation of E-cadherin and H-cadherin genes in
nonsmall cell lung cancer and its relation to clinicopathologic
features. Cancer. 110:2785–2792. 2007. View Article : Google Scholar : PubMed/NCBI
|
|
11
|
Toyooka KO, Toyooka S, Virmani AK, et al:
Loss of expression and aberrant methylation of the CDH13
(H-cadherin) gene in breast and lung carcinomas. Cancer Res.
61:4556–4560. 2001.PubMed/NCBI
|
|
12
|
Tang Y, Dai Y and Huo J: Decreased
expression of T-cadherin is associated with gastric cancer
prognosis. Hepatogastroenterology. 59:1294–1298. 2012.PubMed/NCBI
|
|
13
|
Folkman J: Role of angiogenesis in tumor
growth and metastasis. Semin Oncol. 29:15–18. 2002. View Article : Google Scholar
|
|
14
|
Saharinen P, Eklund L, Pulkki K, Bono P
and Alitalo K: VEGF and angiopoietin signaling in tumor
angiogenesis and metastasis. Trends Mol Med. 17:347–362. 2011.
View Article : Google Scholar : PubMed/NCBI
|
|
15
|
Iurlova EI, Rubina KA, Sysoeva V, et al:
T-cadherin suppresses the cell proliferation of mouse melanoma
B16F10 and tumor angiogenesis in the model of the chorioallantoic
membrane. Ontogenez. 41:261–270. 2010.In Russian. PubMed/NCBI
|
|
16
|
Hebbard LW, Garlatti M, Young LJ, Cardiff
RD, Oshima RG and Ranscht B: T-cadherin supports angiogenesis and
adiponectin association with the vasculature in a mouse mammary
tumor model. Cancer Res. 68:1407–1416. 2008. View Article : Google Scholar : PubMed/NCBI
|
|
17
|
Zhang J, Zhou Y and Jiang K: Evaluation of
the seventh AJCC TNM staging system for gastric cancer: a
meta-analysis of cohort studies. Tumour Biol. 35:8525–8532. 2014.
View Article : Google Scholar : PubMed/NCBI
|
|
18
|
Livak KJ and Schmittgen TD: Analysis of
relative gene expression data using real-time quantitative PCR and
the 2-(−Delta Delta C(T)) Method. Methods. 25:402–408. 2001.
View Article : Google Scholar
|
|
19
|
Okegawa T, Pong RC, Li Y and Hsieh JT: The
role of cell adhesion molecule in cancer progression and its
application in cancer therapy. Acta Biochim Pol. 51:445–457.
2004.PubMed/NCBI
|
|
20
|
Zigler M, Dobroff AS and Bar-Eli M: Cell
adhesion: implication in tumor progression. Minerva Med.
101:149–162. 2010.PubMed/NCBI
|
|
21
|
Auerkari EI: Methylation of tumor
suppressor genes p16 (INK4a), p27 (Kip1) and E-cadherin in
carcinogenesis. Oral Oncol. 42:5–13. 2006. View Article : Google Scholar
|
|
22
|
Albergaria A, Ribeiro AS, Vieira AF, et
al: P-cadherin role in normal breast development and cancer. Int J
Dev Biol. 55:811–822. 2011. View Article : Google Scholar : PubMed/NCBI
|
|
23
|
Mariotti A, Perotti A, Sessa C and Rüegg
C: N-cadherin as a therapeutic target in cancer. Expert Opin
Investig Drugs. 16:451–465. 2007. View Article : Google Scholar : PubMed/NCBI
|
|
24
|
Joshi MB, Ivanov D, Philippova M, Erne P
and Resink TJ: Integrin-linked kinase is an essential mediator for
T-cadherin-dependent signaling via Akt and GSK3beta in endothelial
cells. FASEB J. 21:3083–3095. 2007. View Article : Google Scholar : PubMed/NCBI
|
|
25
|
Hibi K, Kodera Y, Ito K, Akiyama S and
Nakao A: Methylation pattern of CDH13 gene in digestive tract
cancers. Br J Cancer. 91:1139–1142. 2004.PubMed/NCBI
|
|
26
|
Yan Q, Zhang ZF, Chen XP, et al: Reduced
T-cadherin expression and promoter methylation are associated with
the development and progression of hepatocellular carcinoma. Int J
Oncol. 32:1057–1063. 2008.PubMed/NCBI
|
|
27
|
Philippova M, Pfaff D, Kyriakakis E, et
al: T-cadherin loss promotes experimental metastasis of squamous
cell carcinoma. Eur J Cancer. 49:2048–2058. 2013. View Article : Google Scholar : PubMed/NCBI
|
|
28
|
Welti J, Loges S, Dimmeler S and Carmeliet
P: Recent molecular discoveries in angiogenesis and antiangiogenic
therapies in cancer. J Clin Invest. 123:3190–3200. 2013. View Article : Google Scholar : PubMed/NCBI
|
|
29
|
Liu W, Xu J, Wang M, Wang Q, Bi Y and Han
M: Tumor-derived vascular endothelial growth factor (VEGF)-a
facilitates tumor metastasis through the VEGF-VEGFR1 signaling
pathway. Int J Oncol. 39:1213–1220. 2011.PubMed/NCBI
|
|
30
|
Lin YL, Liu XQ, Li WP, Sun G and Zhang CT:
Promoter methylation of H-cadherin is a potential biomarker in
patients with bladder transitional cell carcinoma. Int Urol
Nephrol. 44:111–117. 2012. View Article : Google Scholar
|
|
31
|
La Torre G, Chiaradia G, Gianfagna F, et
al: Smoking status and gastric cancer risk: an updated
meta-analysis of case-control studies published in the past ten
years. Tumori. 95:13–22. 2009.PubMed/NCBI
|
|
32
|
Duell EJ, Travier N, Lujan-Barroso L, et
al: Alcohol consumption and gastric cancer risk in the European
Prospective Investigation into Cancer and Nutrition (EPIC) cohort.
Am J Clin Nutr. 94:1266–1275. 2011. View Article : Google Scholar : PubMed/NCBI
|
|
33
|
Kato M and Asaka M: Recent knowledge of
the relationship between Helicobacter pylori and gastric cancer and
recent progress of gastroendoscopic diagnosis and treatment for
gastric cancer. Jpn J Clin Oncol. 40:828–837. 2010. View Article : Google Scholar : PubMed/NCBI
|