Introduction
Laryngeal squamous cell carcinoma (LSCC) is the most
common type of laryngeal cancer. It is able to spread to regional
cervical lymph nodes, or to more distant tissues, for example the
lung. Improvements in current therapies have resulted in an
improved quality of life for patients with LSCC (1). However, survival rates have not been
significantly improved, which identifies the need for a change in
clinical approach, requiring novel biomarkers for diagnosis,
prognostic assessment and drug design (2).
Certain achievements have been made in the
identification of biomarkers of LSCC. Järvinen et al
(3) performed high-resolution copy
number and gene expression microarray analyses to identify 739
genes overexpressed in LSCC. Gajecka et al (4) reported that polymorphisms of CYP1A1,
CYP2D6, CYP2E1, NAT2, GSTM1 and GSTT1 were associated with an
increased risk of LSCC. HLA class I antigen downregulation was
identified as a poor prognostic marker for LSCC, which may reflect
the reduction in the extent of CD8(+) T cell infiltration in LSCC
lesions (5). Overexpression of
osteopontin enhances the proliferation and invasiveness of LSCC
(6), suggesting that it may
represent a potential therapeutic target.
MicroRNAs (miRNAs) are short regulatory RNAs that
modulate gene expression at the post-transcriptional level, and are
involved in the pathogenesis of numerous types of cancer (7). Multiple miRNAs have been associated
with LSCC. Overexpression of miR-21 contributes to the malignant
phenotype of LSCC via inhibition of BTG family member 2 (8). miR-203 inhibits the proliferation of
laryngeal carcinoma cells by modulating their survival (9). In addition, let-7a (10), miR-16 (11) and hsa-miR-34c (12) also have roles in laryngeal
carcinoma.
Microarray technology provides global patterns of
gene expression and therefore facilitates biomarker discovery. Lian
et al (13) investigated
tumorigenesis and regional lymph node metastasis in LSCC, whereas
the present study focused specifically on the discovery of
biomarkers associated with tumorigenesis. In the present study,
gene expression profiles of LSCC were analyzed with a variety of
bioinformatics tools, including functional enrichment and network
analyses, in order to identify novel potential biomarkers.
Additionally, miRNAs targeting these genes were also predicted. The
identification of such biomarkers may be useful in the diagnosis
and/or treatment of LSCC.
Materials and methods
Gene expression data
A gene expression data set (accession number
GSE51985), which included ten LSCC tissue samples and ten adjacent
non-neoplastic tissue samples, was downloaded from the Gene
Expression Omnibus (http://www.ncbi.nlm.nih.gov/geo) (13). Gene expression levels were measured
using the Illumina HumanHT-12 V4.0 expression beadchip platform
(Illumina, San Diego, CA, USA; http://www.ncbi.nlm.nih.gov/geo/query/acc.cgi?acc=GPL10558).
Platform annotation files were also acquired.
Pretreatment and differential
analysis
According to the annotation files, probes were
initially mapped into the genes. If more than one probe was mapped
into a single gene, levels of the probes were averaged as the final
expression level for the specific gene. Following normalization,
differential analysis was performed between the ten LSCC tissues
and corresponding adjacent non-neoplastic tissues using the Linear
Models for Microarray Analysis package (limma; http://www.bioconductor.org/packages/release/bioc/html/limma.html)
(14) of R. P<0.05 and
|log2 (fold change)|>1 were set as the threshold levels for the
identification of differentially expressed genes (DEGs).
Functional enrichment analysis
Functional enrichment analysis facilitated the
identification of altered biological functions. In the present
study, functional enrichment analysis was performed on the DEGs
using the Database for Annotation, Visualization and Integration
Discovery, version 6.7 (DAVID; http://david.abcc.ncifcrf.gov/) (15), which is able to reveal enriched
Gene Ontology (GO) terms; the Kyoto Encyclopedia of Genes and
Genomes (KEGG) for pathways (16)
and InterPro, version 34.0 for protein domains (17) based on the hypergeometric
distribution. P<0.05 was set as the threshold.
Construction of protein-protein
interaction (PPI) networks
Proteins ‘work together’ to exert certain biological
functions, and the genome-wide identification of PPIs represents a
significant step in the elucidation of the underlying molecular
mechanisms. In present study, PPI networks were constructed for the
protein products using information from the Search Tool for the
Retrieval of Interacting Genes/Proteins (STRING, version 9.1;
http://string-db.org/) (18). Interactions with a score (i.e.
required confidence) >0.4 were retained in the network.
The proteins in the network serve as the ‘nodes’,
and each pairwise protein interaction is represented by an
undirected link. The ‘degree’ of a node corresponds to the number
of interactions of that particular protein. The most highly
connected nodes (those of a high degree) were considered to be the
network ‘hubs’.
Module analysis of the network
The PPI networks and regulatory associations between
miRNAs and target genes were combined and subsequently visualized
with Cytoscape, version 2.6.3 (http://cytoscape.org/) (19). Functional modules of the network
were explored using ClusterONE, version 1.0 (http://www.paccanarolab.org/clusterone), a Cytoscape
software plugin (20). P<0.01
was set as the cut-off value.
Prediction of miRNAs
The miRNAs regulating the identified DEGs were
predicted using WEB-based Gene Set Analysis Toolkit, version 2.0
(WebGestalt; http://bioinfo.vanderbilt.edu/webgestalt/) (21). Count ≥2 and false discovery rate
(false positive rate, multiple testing corrected P-value) <0.1
were set as the threshold values.
Results
DEGs in LSCC
According to the criteria outlined (|log2(fold
change)|>1; P<0.05), a total of 461 DEGs were identified in
LSCC, of which 297 were upregulated and 164 were downregulated.
Functional enrichment analysis
GO and KEGG pathway enrichment analyses were applied
to the up- and downregulated genes using DAVID tools. The results
are presented in Tables I and
II.
 | Table IGO enrichment analysis result for up-
and downregulated genes in laryngeal squamous cell carcinoma. |
Table I
GO enrichment analysis result for up-
and downregulated genes in laryngeal squamous cell carcinoma.
| Category | Term | Count | P-value |
|---|
| Upregulated
genes |
| Cluster 1 | Enrichment score:
14.33726443940616 | | |
| BP | GO: 0007049~cell
cycle | 63 |
3.98×10⁻²⁷ |
| BP | GO: 0000278~mitotic
cell cycle | 46 |
4.67×10⁻²⁷ |
| BP | GO: 0022402~cell
cycle process | 50 |
8.03×10⁻²³ |
| BP | GO: 0000279~M
phase | 37 |
3.88×10⁻²⁰ |
| BP | GO: 0000280~nuclear
division | 30 |
1.39×10⁻¹⁸ |
| BP | GO:
0007067~mitosis | 30 |
1.39×10⁻¹⁸ |
| BP | GO: 0000087~M phase
of mitotic cell cycle | 30 |
2.30×10⁻¹⁸ |
| BP | GO:
0048285~organelle fission | 30 |
4.23×10⁻¹⁸ |
| BP | GO: 0022403~cell
cycle phase | 38 |
1.02×10⁻¹⁷ |
| CC | GO:
0043232~intracellular non-membrane-bounded organelle | 91 |
1.87×10⁻¹⁵ |
| CC | GO:
0043228~non-membrane-bounded organelle | 91 |
1.87×10⁻¹⁵ |
| BP | GO: 0051301~cell
division | 29 |
3.35×10⁻¹⁴ |
| CC | GO:
0005819~spindle | 21 |
1.24×10⁻¹³ |
| CC | GO:
0015630~microtubule cytoskeleton | 35 |
4.61×10⁻¹² |
| CC | GO:
0044430~cytoskeletal part | 41 |
6.61×10−09 |
| BP | GO:
0007017~microtubule-based process | 20 |
2.68×10−08 |
| CC | GO:
0005856~cytoskeleton | 49 |
6.72×10−08 |
| CC | GO:
0005815~microtubule organizing center | 17 |
2.28×10−06 |
| CC | GO:
0005813~centrosome | 16 |
2.37×10−06 |
| CC | GO:
0005874~microtubule | 14 |
3.79×10−04 |
| Cluster 2 | Enrichment score:
10.562682054877438 | | |
| CC | GO: 0031981~nuclear
lumen | 64 |
11×10−14 |
| CC | GO:
0070013~intracellular organelle lumen | 69 |
3.57×10⁻¹³ |
| CC | GO:
0031974~membrane-enclosed lumen | 70 |
8.50×10⁻¹³ |
| CC | GO:
0043233~organelle lumen | 69 |
1.07×10⁻¹² |
| CC | GO:
0005654~nucleoplasm | 38 |
2.84×10−08 |
| CC | GO:
0005730~nucleolus | 29 |
4.12×10−06 |
| Cluster 3 | Enrichment score:
9.848444253761741 | | |
| CC | GO:
0005694~chromosome | 34 |
1.72×10⁻¹³ |
| CC | GO:
0000775~chromosome, centromeric region | 19 |
7.04×10⁻¹³ |
| CC | GO:
0044427~chromosomal part | 30 |
1.90×10⁻¹² |
| CC | GO:
0000793~condensed chromosome | 17 |
1.60×10⁻¹⁰ |
| CC | GO:
0000779~condensed chromosome, centromeric region | 12 |
5.30×10−09 |
| CC | GO:
0000777~condensed chromosome kinetochore | 11 |
1.91×10−08 |
| CC | GO:
0000776~kinetochore | 11 |
3.10×10−07 |
| Cluster 4 | Enrichment score:
7.286973695097799 | | |
| MF | GO:
0005524~adenosine triphosphate binding | 52 |
9.82×10−09 |
| MF | GO: 0032559~adenyl
ribonucleotide binding | 52 |
1.54×10−08 |
| MF | GO: 0030554~adenyl
nucleotide binding | 53 |
3.18×10−08 |
| MF | GO: 0001883~purine
nucleoside binding | 53 |
5.25×10−08 |
| MF | GO:
0001882~nucleoside binding | 53 |
6.58×10−08 |
| MF | GO: 0017076~purine
nucleotide binding | 59 |
8.65×10−08 |
| MF | GO:
0032553~ribonucleotide binding | 57 |
1.19×10−07 |
| MF | GO: 0032555~purine
ribonucleotide binding | 57 |
1.19×10−07 |
| MF | GO:
0000166~nucleotide binding | 65 |
1.29×10−07 |
| Cluster 5 | Enrichment score:
5.683294675111861 | | |
| BP | GO:
0007017~microtubule-based process | 20 |
2.68×10−08 |
| BP | GO:
0000226~microtubule cytoskeleton organization | 15 |
1.06×10−07 |
| BP | GO: 0007051~spindle
organization | 7 |
7.88×10−05 |
| BP | GO:
0007010~cytoskeleton organization | 20 |
8.29×10−05 |
| Downregulated
genes |
| Cluster 1 | Enrichment score:
2.991494823613603 | | |
| BP | GO:
0006414~translational elongation | 9 |
3.72×10−07 |
| MF | GO:
0003735~structural constituent of ribosome | 10 |
2.59×10−06 |
| CC | GO:
0033279~ribosomal subunit | 9 |
4.39×10−06 |
| CC | GO:
0022626~cytosolic ribosome | 7 |
2.80×10−05 |
| CC | GO:
0005840~ribosome | 10 |
2.81×10−05 |
| BP | GO:
0006412~translation | 11 |
7.45×10−05 |
| CC | GO: 0015934~large
ribosomal subunit | 6 |
1.30×10−04 |
| CC | GO:
0044445~cytosolic part | 7 |
8.82×10−04 |
| CC | GO:
0022625~cytosolic large ribosomal subunit | 4 |
2.70×10−03 |
| CC | GO:
0030529~ribonucleoprotein complex | 11 |
4.49×10−03 |
| MF | GO:
0005198~structural molecule activity | 12 |
4.68×10−03 |
| Table IIKyoto Encyclopedia of Genes and
Genomes pathway enrichment analysis result for up-regulated genes
in laryngeal squamous cell carcinoma. |
Table II
Kyoto Encyclopedia of Genes and
Genomes pathway enrichment analysis result for up-regulated genes
in laryngeal squamous cell carcinoma.
| Term | Count | P-value |
|---|
| Upregulated
genes |
| Hsa04110: Cell
cycle | 16 |
4.12×10−09 |
| Hsa03050:
Proteasome | 11 |
6.84×10−09 |
| Hsa03030: DNA
replication | 6 |
4.21×10−04 |
| Hsa04114: Oocyte
meiosis | 8 |
3.54×10−03 |
| Hsa03040:
Spliceosome | 8 |
7.43×10−03 |
| Downregulated
genes |
| Hsa03010:
Ribosome | 8 |
5.59×10−06 |
| Hsa00071: Fatty
acid metabolism | 4 |
4.19×10−03 |
The top five gene clusters with enrichment scores
>2 are listed in Table I. The
following molecular functional terms were significantly
over-represented amongst the upregulated genes: ATP binding (GO:
0005524), adenyl ribonucleotide binding (GO: 0032559), adenyl
nucleotide binding (GO: 0030554), purine nucleoside binding (GO:
0001883), nucleoside binding (GO: 0001882), purine nucleotide
binding (GO: 0017076), ribonucleotide binding (GO: 0032553), purine
ribonucleotide binding (GO: 0032555) and nucleotide binding (GO:
0000166). Amongst the downregulated genes, structural constituent
of ribosome (GO: 0003735) and structural molecule activity (GO:
0005198) were significantly enriched.
In addition, the cell cycle (hsa04110), proteasome
(hsa03050) and DNA replication (hsa03030) pathways were
significantly enriched in the upregulated genes, while ribosome
(hsa03010) was significantly enriched in the downregulated
genes.
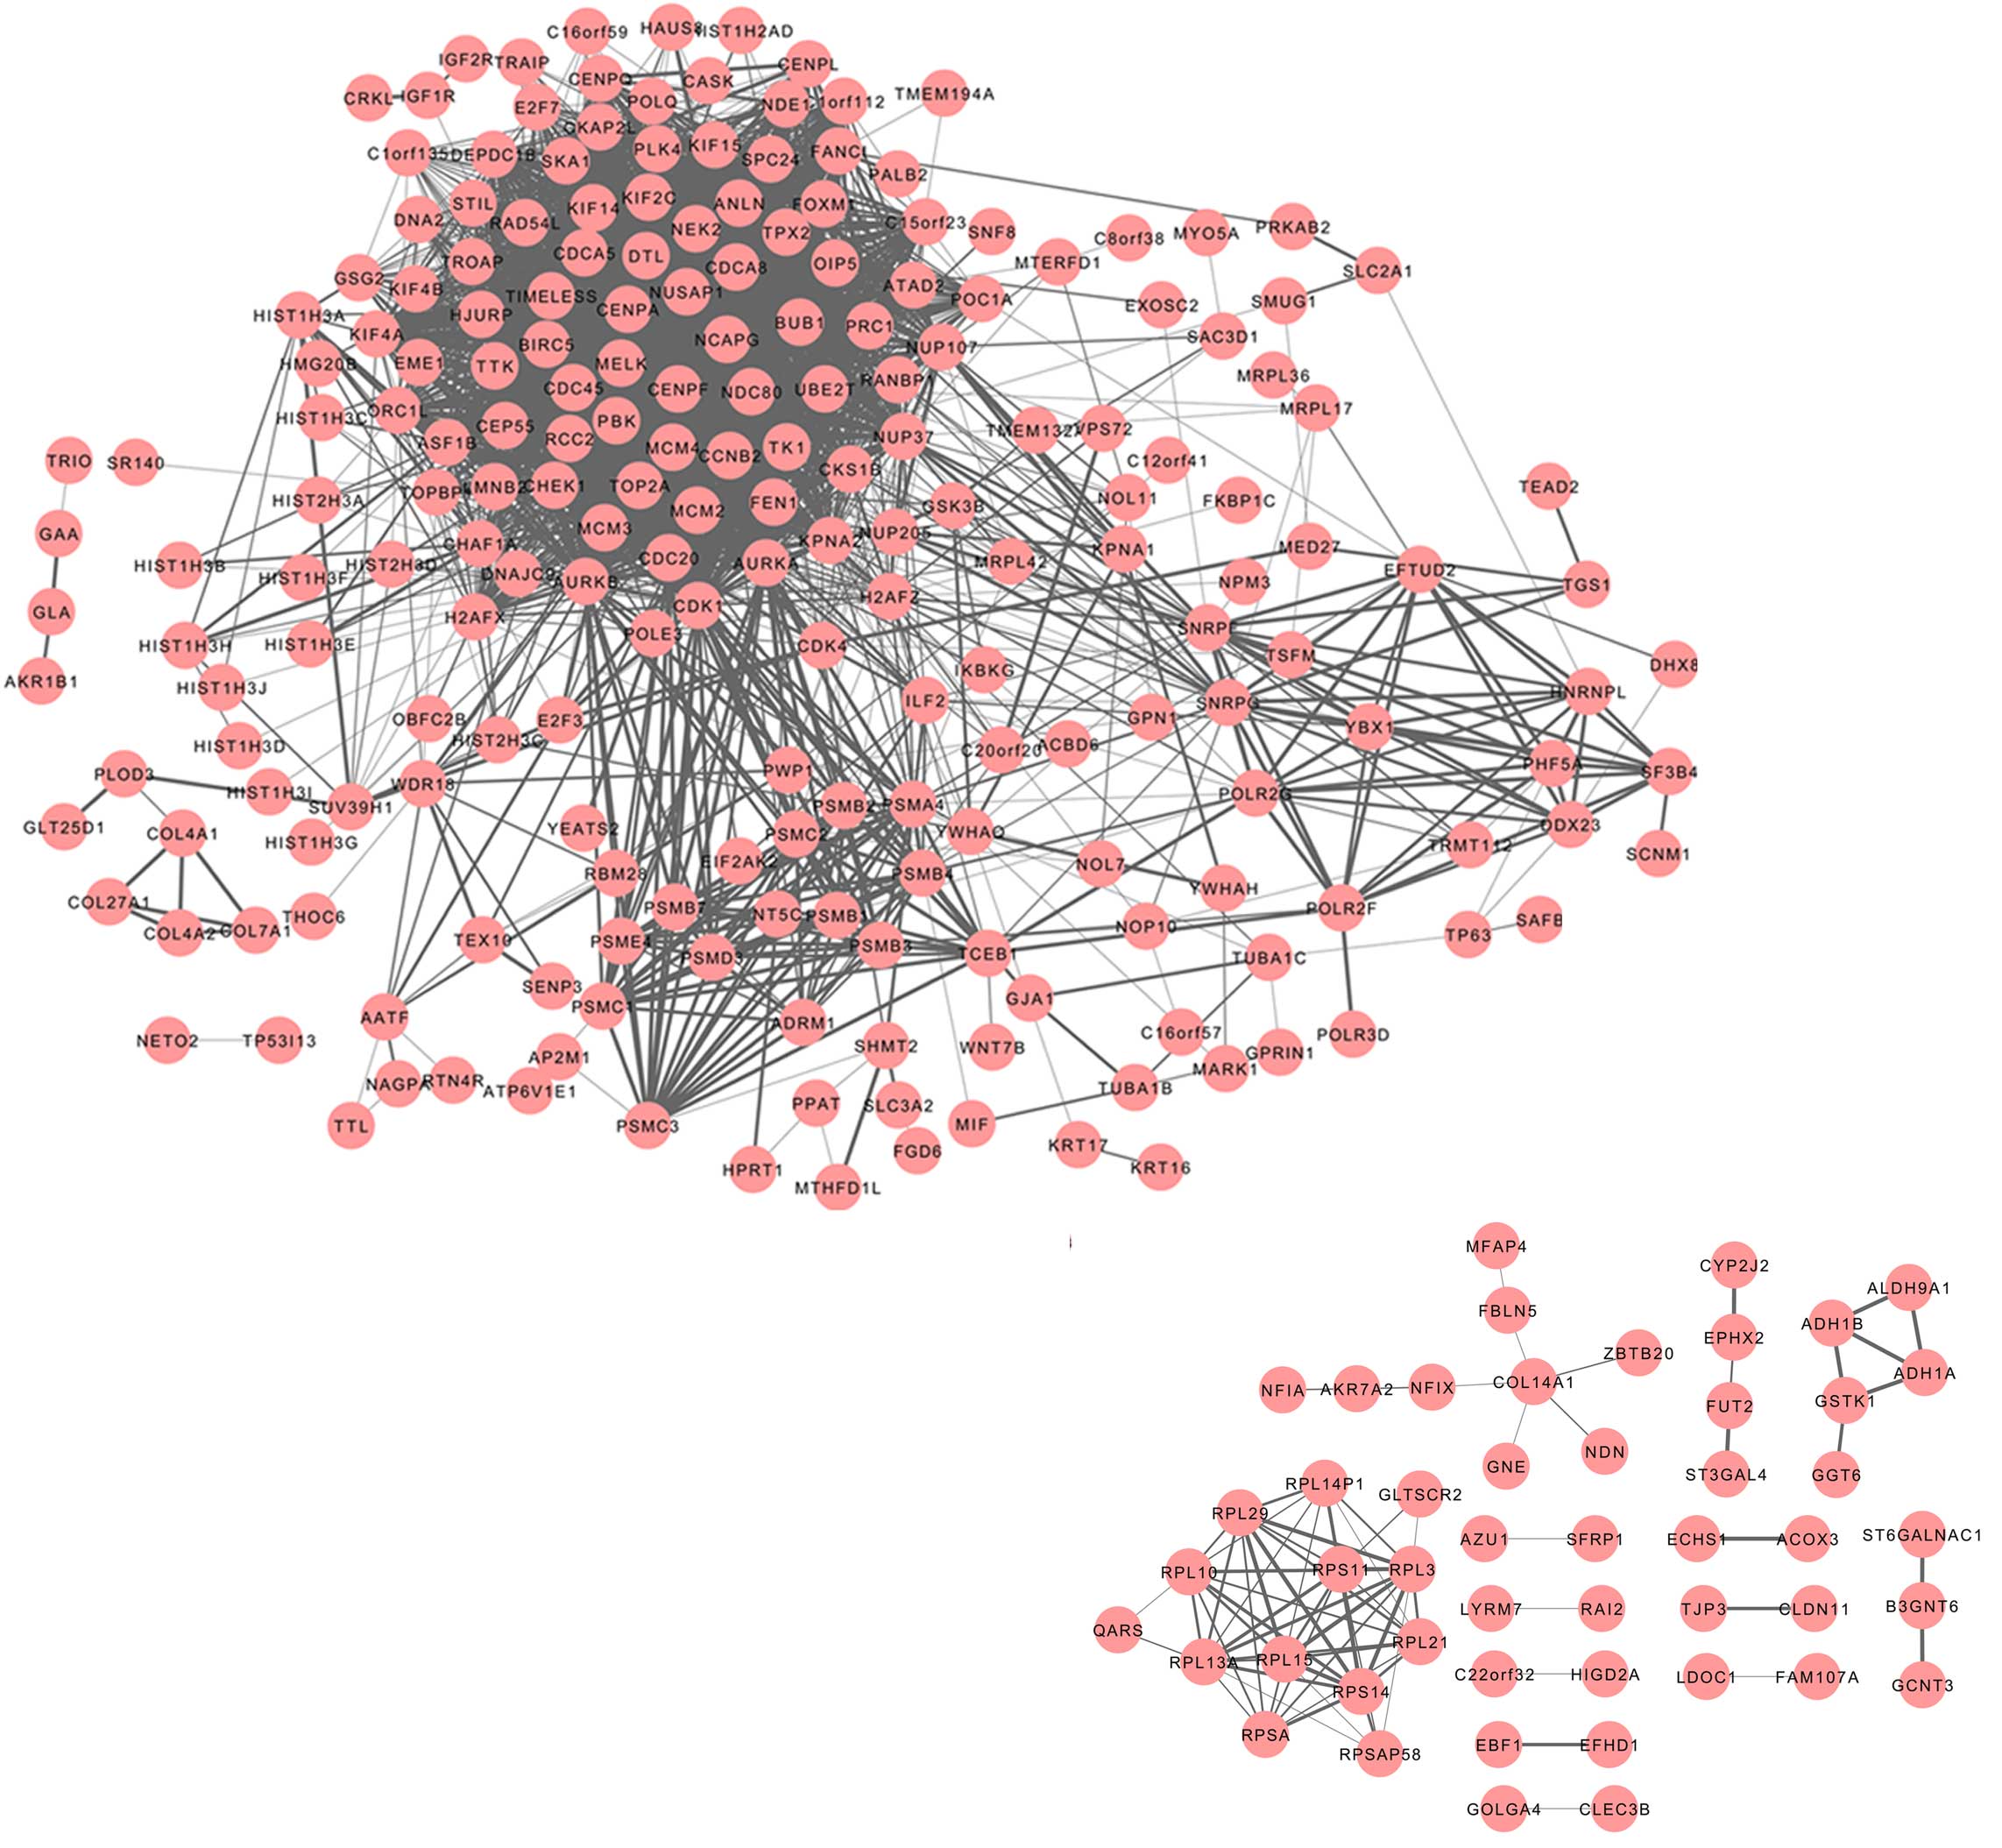
PPI networks of the DEGs
A PPI network was constructed for the protein
products of the DEGs using STRING. Interactions with a combined
score of >0.4 were included in the network.
A network consisting of 213 proteins (nodes) and
2719 interactions (edges) was generated for the upregulated genes
(Fig. 1). The top nodes, or hubs,
characterized by a degree of >70, were aurora kinase B (AURKB),
cyclin dependent kinase (CDK)1, cell division cycle (CDC) 20
homolog, AURKA, CDC45-like, budding uninhibited by benzimidazoles 1
homolog (BUB1), PDZ binding kinase (PBK), non-SMC condensin I
complex subunit G (NCAPG), cell division cycle associated 8
(CDCA8), ubiquitin-conjugating enzyme E2T (UBE2T), minichromosome
maintenance complex component 2 (MCM2), centromere protein F
(CENPF), MCM4, NDC80 homolog kinetochore complex component (NDC80),
CENPA, baculoviral IAP repeat-containing 5 (BIRC5), denticleless
homolog (DTL), CHK1 checkpoint homolog (CHEK1), kinesin family
member 2C (KIF2C), maternal embryonic leucine zipper kinase (MELK),
topoisomerase (DNA) II α 170kDa (TOP2A) and cell division cycle
associated 5 (CDCA5). Furthermore, a network comprised of 50 nodes
and 80 edges was obtained for the downregulated genes. Few PPIs
were observed amongst the downregulated genes, and therefore the
subsequent analyses were focused on the upregulated genes.
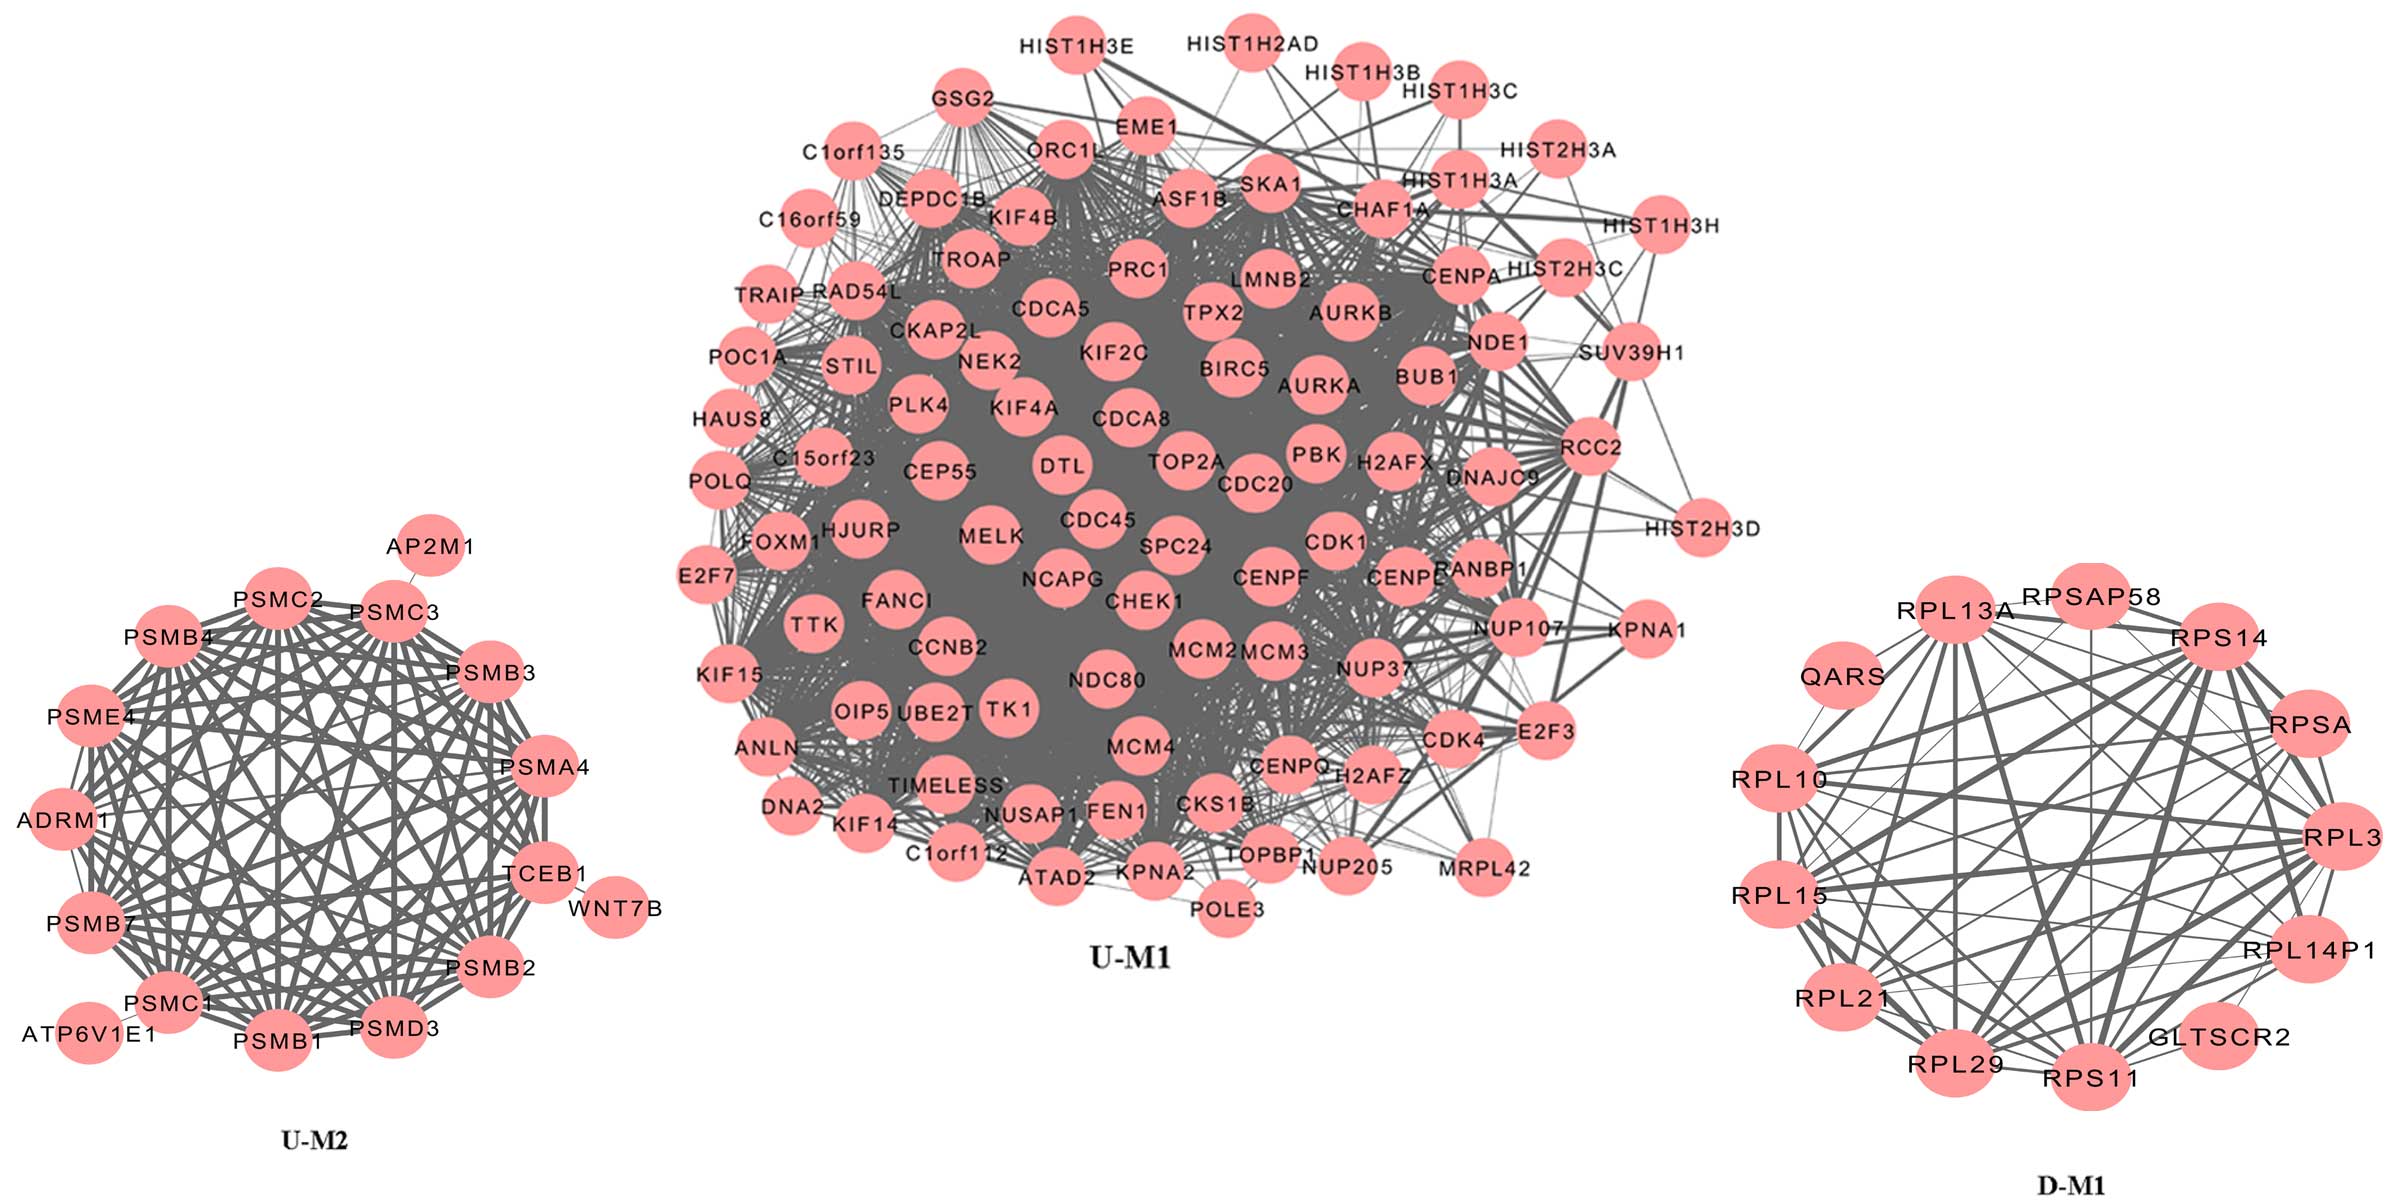
Module analysis
Module analysis was performed using ClusterONE to
predict protein complexes, and the results are presented in
Fig. 2. Two modules were
identified amongst the upregulated genes: Module 1 (P<0.000) and
Module 2 (P=5.559×10⁻⁴). Protein domain enrichment
analysis was applied to the genes in the two modules using InterPro
and the results are displayed in Table III. Serine/threonine protein
kinase, active site (IPR008271); protein kinase, ATP binding site
(IPR017441) and protein kinase, core (IPR000719) were significantly
enriched amongst the genes from Module 1. No significantly enriched
term was identified in the genes from Module 2. One module was
generated by the downregulated genes (Fig. 2), but no significantly enriched
protein domain was identified.
| Table IIISignificantly over-represented
protein domains in the genes from the Module 1 network of
upregulated genes. |
Table III
Significantly over-represented
protein domains in the genes from the Module 1 network of
upregulated genes.
| Term | Count | P-value |
|---|
| IPR008271:
Serine/threonine protein kinase, active site | 11 |
1.61×10−06 |
| IPR017441: Protein
kinase, ATP binding site | 12 |
2.11×10−06 |
| IPR000719: Protein
kinase, core | 12 |
3.25×10−06 |
| IPR002290:
Serine/threonine protein kinase | 9 |
1.01×10−05 |
| IPR017442:
Serine/threonine protein kinase-related | 10 |
1.46×10−05 |
| IPR018525:
DNA-dependent ATPase MCM, conserved site | 3 |
4.52×10−04 |
| IPR001208:
DNA-dependent ATPase MCM | 3 |
5.80×10−04 |
| IPR019821: Kinesin,
motor region, conserved site | 4 |
6.66×10−04 |
| IPR001752: Kinesin,
motor region | 4 |
6.66×10−04 |
| IPR007125: Histone
core | 4 |
8.16×10−04 |
| IPR009072:
Histone-fold | 4 |
1.39×10−03 |
| IPR002119: Histone
H2A | 3 |
2.68×10ss03 |
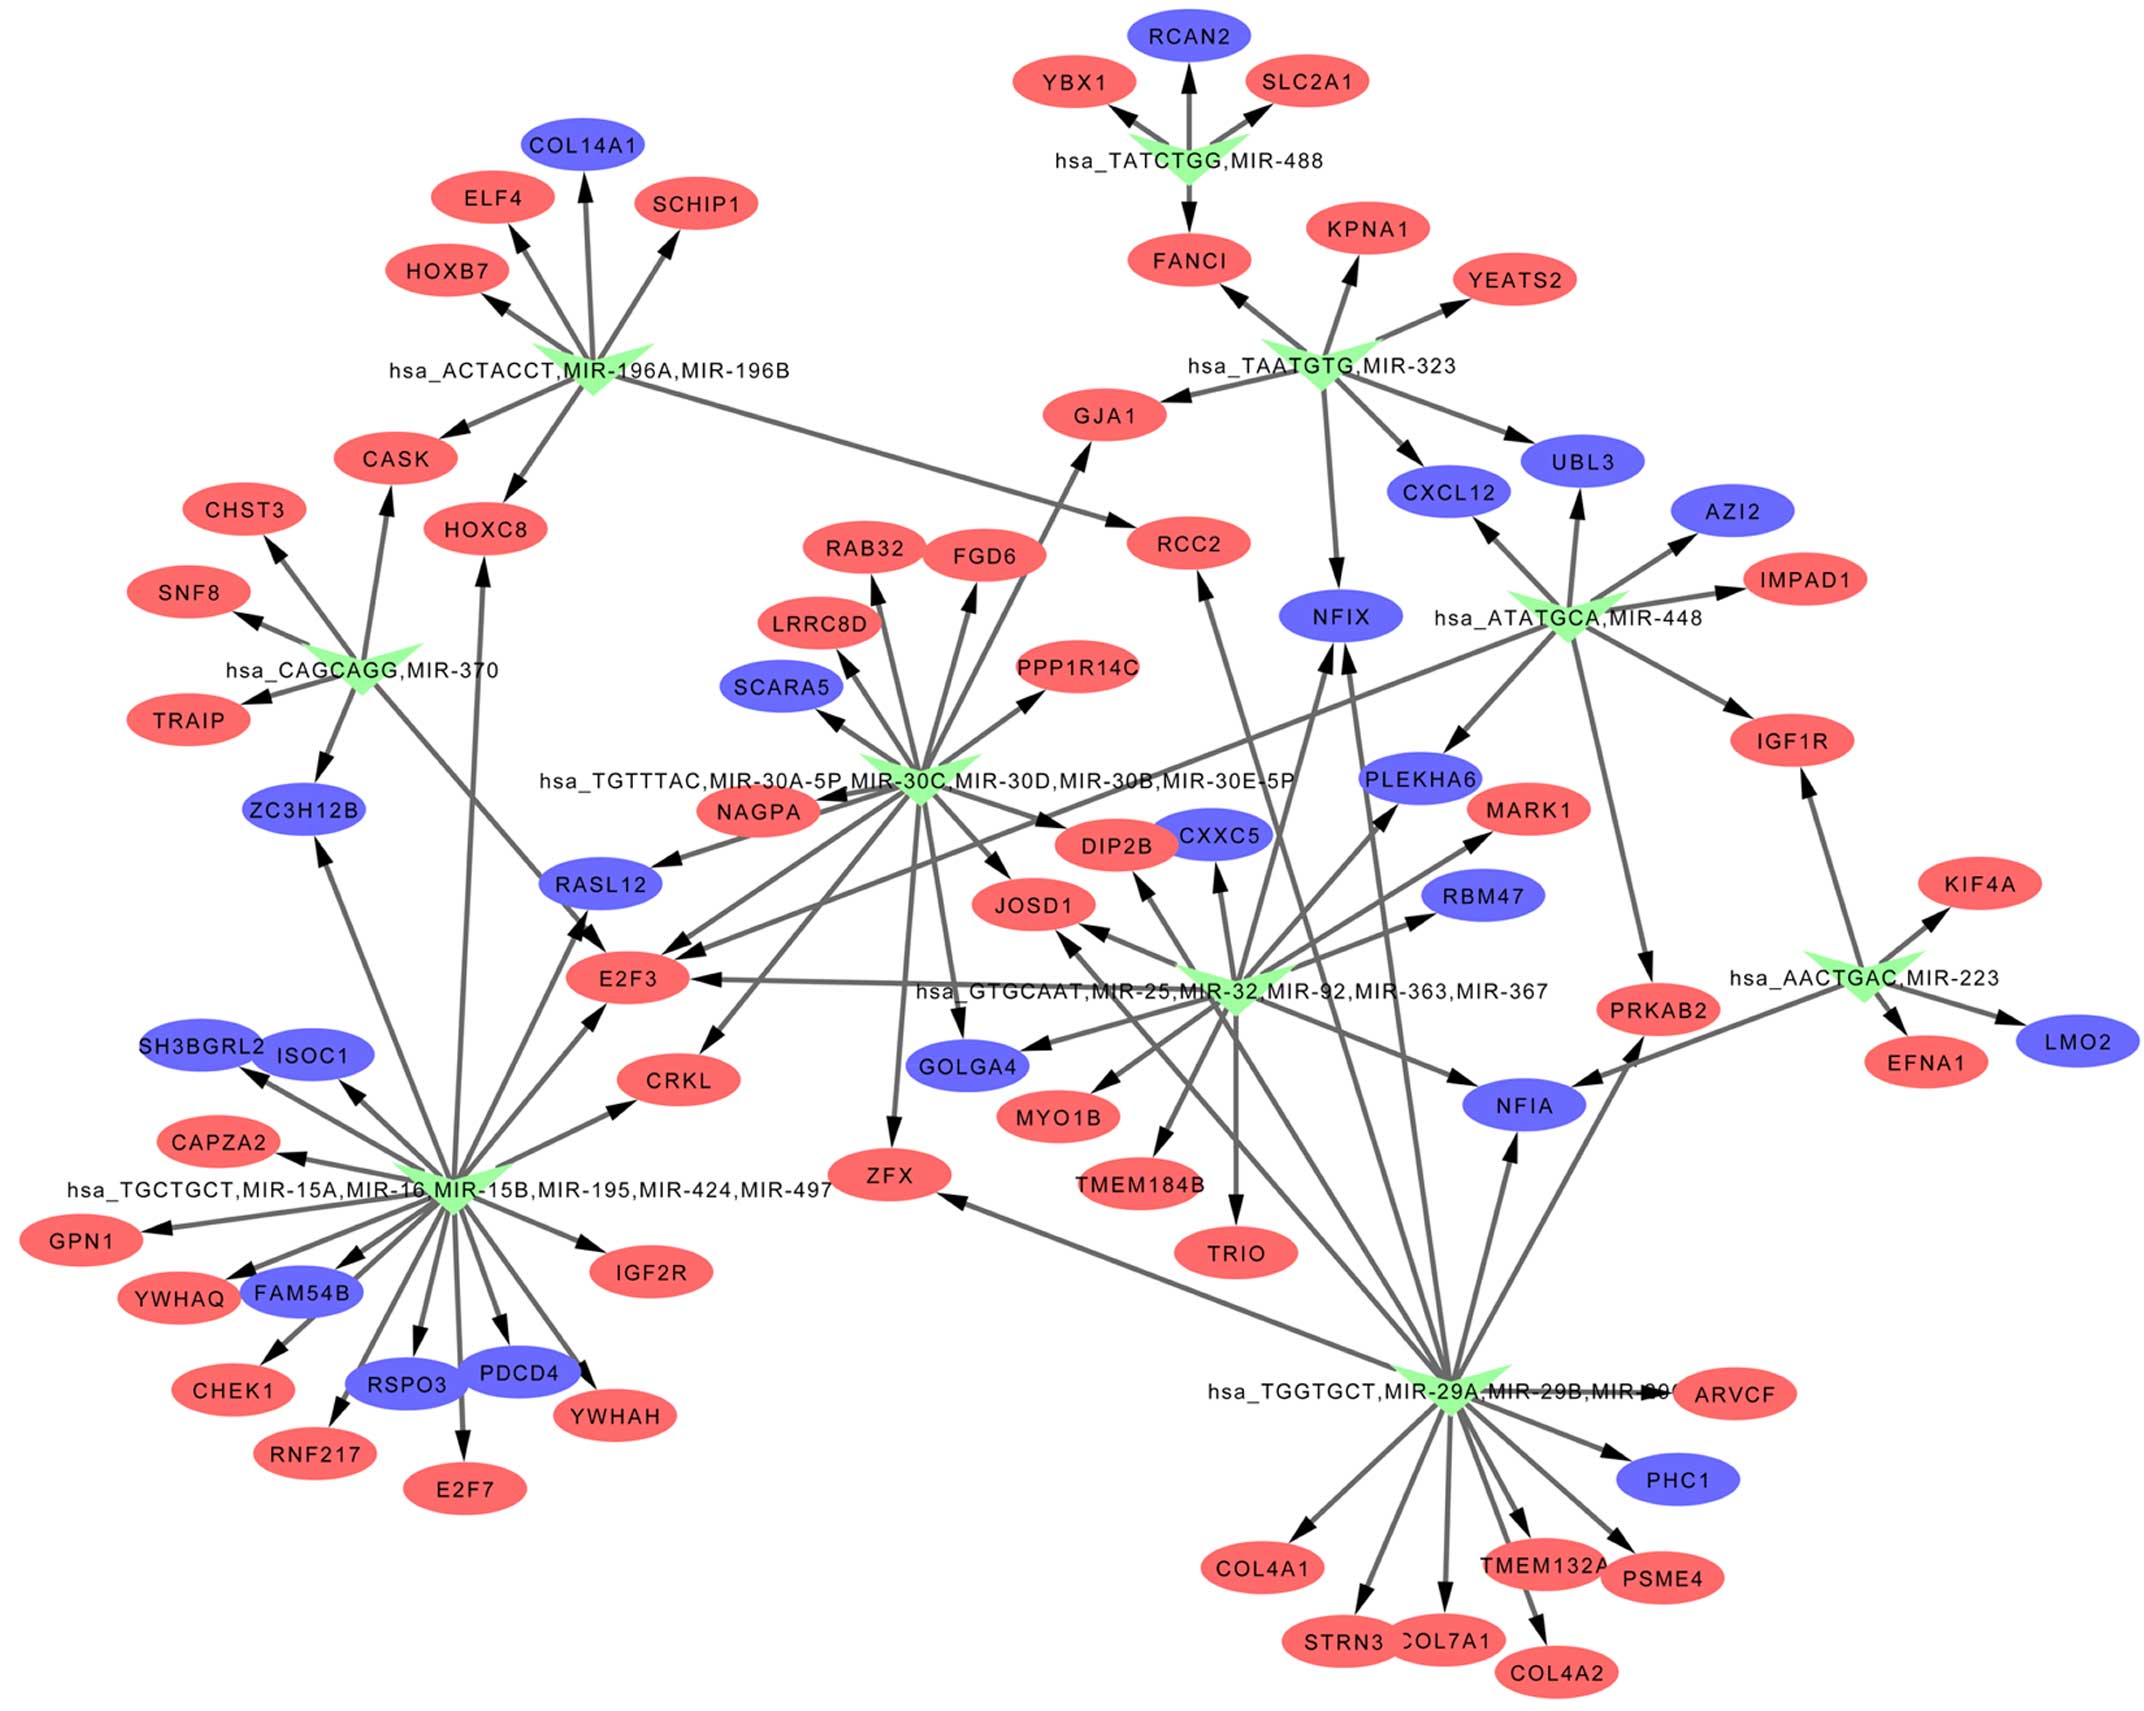
miRNA-target interactions
miRNAs regulating the DEGs were predicted by
WebGestalt, and the results are exhibited in Table IV and Fig. 3. hsa_GTGCAAT, miR-25, miR-32,
miR-92, miR-363, miR-367, hsa_TGCTGCT, miR-15A, miR-16, miR-15B,
miR-195, miR-424, miR-497, hsa_TGGTGCT, miR-29A, miR-29B and
miR-29C were included in the list of identified miRNAs.
| Table IVPredicted miRNAs regulating the
DEGs. |
Table IV
Predicted miRNAs regulating the
DEGs.
| miRNA | Count | C | O | E | R | rawP | adjP |
|---|
| Hsa_GTGCAAT,
miR-25, miR-32, miR-92, miR-363, miR-367 | 12 | 308 | 12 | 3.42 | 3.51 | 0.0002 | 0.0123 |
| Hsa_TGCTGCT,
miR-15A, miR-16, miR-15B, miR-195, miR-424, miR-497 | 18 | 593 | 18 | 6.59 | 2.73 | 0.0001 | 0.0123 |
| Hsa_TGGTGCT,
miR-29A, miR-29B, miR-29C | 15 | 515 | 15 | 5.72 | 2.62 | 0.0007 | 0.0287 |
| Hsa_ACTACCT,
miR-196A, miR-196B | 7 | 143 | 7 | 1.59 | 4.41 | 0.0011 | 0.0338 |
| Hsa_ATATGCA,
miR-448 | 8 | 208 | 8 | 2.31 | 3.46 | 0.0024 | 0.0492 |
| Hsa_TAATGTG,
miR-323 | 7 | 158 | 7 | 1.75 | 3.99 | 0.0020 | 0.0492 |
| Hsa_AACTGAC,
miR-223 | 5 | 94 | 5 | 1.04 | 4.79 | 0.0040 | 0.0703 |
| Hsa_TATCTGG,
miR-488 | 4 | 62 | 4 | 0.69 | 5.81 | 0.0050 | 0.0724 |
| Hsa_TGTTTAC,
miR-30A-5P, miR-30C, miR-30D, miR-30B, miR-30E-5P | 14 | 572 | 14 | 6.35 | 2.20 | 0.0053 | 0.0724 |
| Hsa_CAGCAGG,
miR-370 | 6 | 153 | 6 | 1.70 | 3.53 | 0.0075 | 0.0922 |
Gene regulatory networks
The miRNA-target interactions were visualized by
Cytoscape and thereby a gene regulatory network was established
(Fig. 3).
Discussion
Through the comparative analysis of gene expression
data of LSCC and adjacent non-neoplastic control tissues, a total
of 461 DEGs were identified in LSCC, of which 297 were upregulated
and 164 were downregulated. Functional enrichment analysis
indicated that the cell cycle, proteasome and relevant biological
pathways were over-represented amongst the upregulated genes. Cell
cycle progression is closely associated with multiple types of
cancer (22–23), which indicated that the analysis
results were of high confidence.
According to the results of previous studies,
specific DEGs including CDK4, CDK1, MCM2, MCM3 and MCM4, have been
implicated in LSCC (13,24). CDK4 is required for cell cycle
G1 phase progression (25). Dong et al (26) reported that CDK4 was overexpressed
in LSCC and suggested that it may have a critical role in cell
proliferation together with cyclin D1. MCM2 has been implicated in
the initiation of eukaryotic genome replication, which has been
proposed as a marker of dysplasia and malignancy (27). Chatrath et al (28) reported aberrant expression of MCM2
in LSCC, while Torres-Rendon et al (29) indicated that MCM2 may be an
indicator of growth and may provide a useful prognostic tool for
oral epithelial dysplasia. MCM3 and MCM4 were also identified as
DEGs in the present study. These findings were consistent with the
results presented in a study by Lian et al (13).
Additional potential biomarkers were discovered in
the present study. There is emerging evidence that glycogen
synthase kinase (GSK)3β may be a tumor suppressor in oral cancer
(30). It was therefore
hypothesized that GSK3β may function in a similar way in LSCC.
Several subunits of the proteasome were also identified in LSCC,
including proteasome subunit β type 4 (PSMB4), PSMB7, PSMB1 and
PSMC3. The ubiquitin-proteasome system is a critical regulator of
cell growth and apoptosis (31),
and proteasome inhibitors have been developed for use in cancer
therapy (32–33). PSMB4 was identified as the first
proteasomal subunit with oncogenic properties, promoting cancer
cell survival and tumor growth in vivo (34). Elevated expression of PSMB4 is
associated with poor prognosis in human cancer (34). PSMB7 was identified to be a
prognostic biomarker in breast cancer (35). Therefore, further study of these
subunits may reveal novel biomarkers for LSCC.
Network and module analyses were performed for the
DEGs, and the identification of hub nodes and interactions may aid
the elucidation of the underlying molecular mechanisms. AURKA and
AURKB had a high degree in the PPI network for upregulated genes.
Overexpression and hyperactivation of AURKA and AURKB have major
roles in tumorigenesis, and therefore their inhibitors are already
regarded as promising therapeutics for various types of cancer
(36), including head and neck
squamous-cell carcinoma (37).
MCM2 and MCM4 also had a degree of >70, confirming their
significant roles in the pathogenesis of LSCC.
Considering that miRNAs are closely involved in
multiple types of cancer, a number of miRNAs targeting the DEGs
were predicted by WebGestalt, including miR-15, miR-16, miR-25 and
miR-195. Wu et al (11)
reported that miR-16 was upregulated in LSCC and that it targets
zyxin and promotes cell motility in human laryngeal carcinoma cell
line HEp-2. Other miRNAs have been reported to have roles in
various types of cancer. miR-15a forms a cluster with miR-16 at the
chromosomal region 13q14, and functions as a putative tumor
suppressor by targeting the oncogene BCL2 (38,39).
miR-25 regulates apoptosis by targeting Bim in human ovarian cancer
(40) and miR-195 is regarded as a
predictor of poor prognosis in adrenocortical cancer (41). Future studies of these miRNAs may
better describe the regulatory mechanisms underlying LSCC.
In conclusion, a number of key genes in LSCC were
identified, which may represent novel biomarkers for diagnosis,
prognosis and therapy. In addition, relevant miRNAs were also
explored, and these may offer therapeutic targets for the
modulation of abnormal gene expression in LSCC.
References
|
1
|
Schorn VJ and Miles BA: Laryngeal squamous
cell carcinoma. ENT Board Prep. Lin F and Patel Z: Springer; New
York: pp. 227–233. 2014, View Article : Google Scholar
|
|
2
|
Almadori G, Bussu F, Cadoni G, Galli J,
Paludetti G and Maurizi M: Molecular markers in laryngeal squamous
cell carcinoma: towards an integrated clinicobiological approach.
Eur J Cancer. 41:683–693. 2005. View Article : Google Scholar : PubMed/NCBI
|
|
3
|
Järvinen AK, Autio R, Haapa-Paananen S, et
al: Identification of target genes in laryngeal squamous cell
carcinoma by high-resolution copy number and gene expression
microarray analyses. Oncogene. 25:6997–7008. 2006. View Article : Google Scholar : PubMed/NCBI
|
|
4
|
Gajecka M, Rydzanicz M, Jaskula-Sztul R,
Kujawski M, Szyfter W and Szyfter K: CYP1A1, CYP2D6, CYP2E1, NAT2,
GSTM1 and GSTT1 polymorphisms or their combinations are associated
with the increased risk of the laryngeal squamous cell carcinoma.
Mutat Res. 574:112–123. 2005. View Article : Google Scholar : PubMed/NCBI
|
|
5
|
Ogino T, Shigyo H, Ishii H, et al: HLA
class I antigen down-regulation in primary laryngeal squamous cell
carcinoma lesions as a poor prognostic marker. Cancer Res.
66:9281–9289. 2006. View Article : Google Scholar : PubMed/NCBI
|
|
6
|
Celetti A, Testa D, Staibano S, et al:
Overexpression of the cytokine osteopontin identifies aggressive
laryngeal squamous cell carcinomas and enhances carcinoma cell
proliferation and invasiveness. Clin Cancer Res. 11:8019–8027.
2005. View Article : Google Scholar : PubMed/NCBI
|
|
7
|
Zimmerman AL and Wu S: MicroRNAs, cancer
and cancer stem cells. Cancer Lett. 300:10–19. 2011. View Article : Google Scholar
|
|
8
|
Liu M, Wu H, Liu T, et al: Regulation of
the cell cycle gene, BTG2, by miR-21 in human laryngeal carcinoma.
Cell Res. 19:828–837. 2009. View Article : Google Scholar : PubMed/NCBI
|
|
9
|
Bian K, Fan J, Zhang X, et al:
MicroRNA-203 leads to G1 phase cell cycle arrest in laryngeal
carcinoma cells by directly targeting survivin. FEBS Lett.
586:804–809. 2012. View Article : Google Scholar : PubMed/NCBI
|
|
10
|
Long XB, Sun GB, Hu S, et al: Let-7a
microRNA functions as a potential tumor suppressor in human
laryngeal cancer. Oncol Rep. 22:1189–1195. 2009.PubMed/NCBI
|
|
11
|
Wu H, Liu T, Wang R, et al: MicroRNA-16
targets zyxin and promotes cell motility in human laryngeal
carcinoma cell line HEp-2. IUBMB Life. 63:101–108. 2011.PubMed/NCBI
|
|
12
|
Cai KM, Bao XL, Kong XH, et al:
Hsa-miR-34c suppresses growth and invasion of human laryngeal
carcinoma cells via targeting c-Met. Int J Mol Med. 25:565–571.
2010. View Article : Google Scholar : PubMed/NCBI
|
|
13
|
Lian M, Fang J, Han D, et al: Microarray
gene expression analysis of tumorigenesis and regional lymph node
metastasis in laryngeal squamous cell carcinoma. PLoS One.
8:e848542013. View Article : Google Scholar
|
|
14
|
Diboun I, Wernisch L, Orengo CA and
Koltzenburg M: Microarray analysis after RNA amplification can
detect pronounced differences in gene expression using limma. BMC
Genomics. 7:2522006. View Article : Google Scholar : PubMed/NCBI
|
|
15
|
Huang DW, Sherman BT, Tan Q, et al: The
DAVID gene functional classification tool: a novel biological
module-centric algorithm to functionally analyze large gene lists.
Genome Biol. 8:R1832007. View Article : Google Scholar : PubMed/NCBI
|
|
16
|
Aoki-Kinoshita KF and Kanehisa M: Gene
annotation and pathway mapping in KEGG. Methods Mol Biol.
396:71–91. 2007.PubMed/NCBI
|
|
17
|
Hunter S, Jones P, Mitchell A, et al:
InterPro in 2011: new developments in the family and domain
prediction database. Nucleic Acids Res. 40:D306–D312. 2012.
View Article : Google Scholar :
|
|
18
|
von Mering C, Huynen M, Jaeggi D, Schmidt
S, Bork P and Snel B: STRING: a database of predicted functional
associations between proteins. Nucleic Acids Res. 31:258–261. 2003.
View Article : Google Scholar : PubMed/NCBI
|
|
19
|
Shannon P, Markiel A, Ozier O, et al:
Cytoscape: a software environment for integrated models of
biomolecular interaction networks. Genome Res. 13:2498–2504. 2003.
View Article : Google Scholar : PubMed/NCBI
|
|
20
|
Nepusz T, Yu H and Paccanaro A: Detecting
overlapping protein complexes in protein-protein interaction
networks. Nat Methods. 9:471–472. 2012. View Article : Google Scholar : PubMed/NCBI
|
|
21
|
Zhang B, Kirov S and Snoddy J: WebGestalt:
an integrated system for exploring gene sets in various biological
contexts. Nucleic Acids Res. 33:W741–W748. 2005. View Article : Google Scholar : PubMed/NCBI
|
|
22
|
Evan GI and Vousden KH: Proliferation,
cell cycle and apoptosis in cancer. Nature. 411:342–348. 2001.
View Article : Google Scholar : PubMed/NCBI
|
|
23
|
Kastan MB and Bartek J: Cell-cycle
checkpoints and cancer. Nature. 432:316–323. 2004. View Article : Google Scholar : PubMed/NCBI
|
|
24
|
Cai K, Luo Y and Li L: Expression of MCM2
protein and its biological characteristic in human laryngeal
squamous cell carcinoma. J Acta Academiae Medicinae Jiangxi.
3:58–60. 2008.
|
|
25
|
Sherr CJ: G1 phase progression: cycling on
cue. J Cell. 79:551–555. 1994. View Article : Google Scholar
|
|
26
|
Dong Y, Sui L, Sugimoto K, Tai Y and
Tokuda M: Cyclin D1. CDK4 complex, a possible critical factor for
cell proliferation and prognosis in laryngeal squamous cell
carcinomas. Int J Cancer. 95:209–215. 2001. View Article : Google Scholar : PubMed/NCBI
|
|
27
|
Freeman A, Morris LS, Mills AD, et al:
Minichromosome maintenance proteins as biological markers of
dysplasia and malignancy. Clin Cancer Res. 5:2121–2132.
1999.PubMed/NCBI
|
|
28
|
Chatrath P, Scott IS, Morris LS, et al:
Aberrant expression of minichromosome maintenance protein-2 and
Ki67 in laryngeal squamous epithelial lesions. Br J Cancer.
89:1048–1054. 2003. View Article : Google Scholar : PubMed/NCBI
|
|
29
|
Torres-Rendon A, Roy S, Craig G and
Speight P: Expression of Mcm2, geminin and Ki67 in normal oral
mucosa, oral epithelial dysplasias and their corresponding
squamous-cell carcinomas. Br J Cancer. 100:1128–1134. 2009.
View Article : Google Scholar : PubMed/NCBI
|
|
30
|
Mishra R: Glycogen synthase kinase 3 beta:
can it be a target for oral cancer. Mol Cancer. 9:1442010.
View Article : Google Scholar : PubMed/NCBI
|
|
31
|
Almond JB and Cohen GM: The proteasome: a
novel target for cancer chemotherapy. Leukemia. 16:433–443. 2002.
View Article : Google Scholar : PubMed/NCBI
|
|
32
|
Orlowski RZ and Kuhn DJ: Proteasome
inhibitors in cancer therapy: lessons from the first decade. Clin
Cancer Res. 14:1649–1657. 2008. View Article : Google Scholar : PubMed/NCBI
|
|
33
|
Rajkumar SV, Richardson PG, Hideshima T
and Anderson KC: Proteasome inhibition as a novel therapeutic
target in human cancer. J Clin Oncol. 23:630–639. 2005. View Article : Google Scholar : PubMed/NCBI
|
|
34
|
Lee GY, Haverty PM, Li L, et al:
Comparative oncogenomics identifies PSMB4 and SHMT2 as potential
cancer driver genes. Cancer Res. 74:3114–3126. 2014. View Article : Google Scholar : PubMed/NCBI
|
|
35
|
Munkacsy G, Abdul-Ghani R, Mihaly Z, et
al: PSMB7 is associated with anthracycline resistance and is a
prognostic biomarker in breast cancer. Br J Cancer. 102:361–368.
2010. View Article : Google Scholar :
|
|
36
|
Dar AA, Goff LW, Majid S, Berlin J and
El-Rifai W: Aurora kinase inhibitors-rising stars in cancer
therapeutics? Mol Cancer Ther. 9:268–278. 2010. View Article : Google Scholar : PubMed/NCBI
|
|
37
|
Mehra R, Serebriiskii IG, Burtness B,
Astsaturov I and Golemis EA: Aurora kinases in head and neck
cancer. Lancet Oncol. 14:e425–e435. 2013. View Article : Google Scholar : PubMed/NCBI
|
|
38
|
Bonci D, Coppola V, Musumeci M, et al: The
miR-15a-miR-16-1 cluster controls prostate cancer by targeting
multiple oncogenic activities. Nat Med. 14:1271–1277. 2008.
View Article : Google Scholar : PubMed/NCBI
|
|
39
|
Cimmino A, Calin GA, Fabbri M, et al:
miR-15 and miR-16 induce apoptosis by targeting BCL2. Proc Natl
Acad Sci USA. 102:13944–13949. 2005. View Article : Google Scholar : PubMed/NCBI
|
|
40
|
Zhang H, Zuo Z, Lu X, Wang L, Wang H and
Zhu Z: MiR-25 regulates apoptosis by targeting Bim in human ovarian
cancer. Oncol Rep. 27:594–598. 2012.
|
|
41
|
Soon PS, Tacon LJ, Gill AJ, et al: miR-195
and miR-483-5p identified as predictors of poor prognosis in
adrenocortical cancer. Clin Cancer Res. 15:7684–7692. 2009.
View Article : Google Scholar : PubMed/NCBI
|