Introduction
Diabetes is a prevalent metabolic disorder,
characterized by increased levels of blood glucose (GLU). Diabetic
macrovascular disease, characterized by atherosclerosis, is a
chronic complication observed in patients with diabetes and is the
predominant contributor to morbidity and mortality rates in
patients with diabetes (1). Type 2
diabetes is considered equivalent to a previous history of
myocardial infarction (MI) in terms of the MI risk stratification.
The risk of MI in patients with Type 2 diabetes is ~20%, compared
with 19% in patients with a history of MI, and coronary mortality
rates are 15%, compared with 16% in patients with a history of MI
(2). Dyslipidemia and inflammation
are important in atherosclerosis (3). Activated macrophages are involved in
the progression of atherosclerosis, the formation of foam cells and
in inflammatory reactions (4).
Interleukin (IL)-18 and IL-6 are important in the chronic
inflammatory response and are primarily produced by macrophages
(5–8).
Binding of IL-18 to the IL-18 receptor (IL-18R)
directly activates nuclear factor-κB (NF-κB) and stimulates
T-helper (Th)2 responses (IL-4 and IL-13) (9) and IL-5 and IL-10 (10). IL-18 also increases cell adhesion
molecules (11), nitric oxide
synthesis (12), chemokine
production (11) and induction of
the Fas ligand (13). IL-18 is
associated with obesity (14),
metabolic syndrome (15),
polycystic ovary syndrome (16),
insulin resistance (17) and the
risk of developing diabetes (18).
IL-18 may also be a specific biomarker for atherosclerosis-prone
patients with metabolic syndrome (19). Il-18 is a clear predictor of
coronary mortality in patients with MI (20) and IL-18 polymorphisms are
associated with an increased risk of MI (21). Therefore, the expression of IL-18
may be indicative of diabetic atherosclerosis.
In diabetic patients, GLU levels are rarely
sustained throughout an entire day and they fluctuate according to
the fasting state during the night and the successive postprandial
states during the day (22).
Previous studies have demonstrated that fluctuation in GLU levels
during postprandial periods trigger higher levels of oxidative
stress, inflammation and a higher risk of heart failure, compared
with chronically sustained hyperglycemia (23–25).
Blunting these fluctuations improves the levels of oxidative stress
and inflammation in patients with type 2 diabetes (26). A previous in vivo study
demonstrated that postprandial GLU fluctuations increased monocyte
adhesion in the rat aorta (27).
Fat cells exposed to GLU fluctuations exhibited increased
expression levels of IL-18 (28),
therefore, GLU fluctuations may be involved in diabetic
macrovascular complications.
The c-Jun NH2-terminal kinase (JNK)
pathway is involved in oxidative stress and inflammation (29). JNK is primarily activated by
cytokines and by various cellular stresses (29). The activation of JNK induces the
phosphorylation of c-Jun, which, in turn, activates the activator
protein-1 (AP-1) transcription factor, which controls the
expression levels of a number of genes, including IL-18 (30,31).
However, the associations between high and
fluctuating GLU levels, JNK, macrophages and IL-18 remain to be
elucidated. Consequently, the present study assessed the expression
and secretion levels of IL-18 in mouse peritoneal macrophages
(MPMs) exposed to high and fluctuating concentrations of GLU, and
examined the involvement of the JNK pathway in this association
using SP600125, a JNK inhibitor.
Materials and methods
Animals
Male Kunming mice (n=6; pathogen-free, 5–7 weeks
old) weighing 20–25 g were obtained from the Experimental Animal
Center of Bengbu Medical College (Anhui, China). The mice were
housed under standard conditions (12 h/day light; 25°C) with free
access to a basal diet (cat. no. GB14924.3-2001; Vital River
Limited Company, Beijing, China) and water. All procedures and
animal experiments were approved by the Animal Care and Use
Committee of Bengbu Medical College (Anhui, China; Approval no.
2011001).
Isolation and purification of MPMs
The MPMs were isolated, as described previously
(8). Briefly, each mouse was
injected with 2 ml 6% starch broth (Sigma-Aldrich, St. Louis, MO,
USA). The abdomen was repeatedly rubbed for 2 min following
injection, and the injection was repeated the following morning (12
h later). Following eye phlebotomy to reduce the quantity of blood
in the animal and to prevent blood contamination of the peritoneal
cavity, the mice were administered katamine (10 mg/ml, 0.2
ml/mouse; Jiangsu Hengrui Medicine Co., Ltd., Jiangsu, China) and
sacrificed by cervical dislocation. The skin was wiped with 75%
alcohol (Sinopharm Chemical Reagent Co., Ltd., Shanghai, China),
and pre-cooled phosphate-buffered saline (10 ml) was injected
intraperitoneally. Peritoneal fluid (9 ml) was collected from each
mouse and centrifuged for l5 min at 250 × g at 4°C to obtain the
MPMs. The MPM suspension was inoculated into cell culture plates
(2.5×10⁶ cells/ml) and cultured in RPMI-1640 medium
(KeGen BioTech, Nanjing, China), containing 10% fetal calf serum
(KeyGen Biotech. Co., Ltd., Nanjing, China) for 3 h in a 5%
CO2 incubator at 37°C. The non-adherent cells were
subsequent removed by gently washing the plates four times with
D-Hanks’ balanced salt solution. The MPMs were identified by
hematoxylin and eosin (H&E) staining and lysozyme
immunocytochemical staining (Kecai Bio-engineering Limited Company.
Shanghai, China).
Briefly, the tissue sections were deparaffinized
twice in xylene for 10 min each and then re-hydrated twice in
absolute alcohol (5 min each time), in 95% alcohol for 2 min and in
70% alcohol for 2 min. The tissue sections were washed briefly in
distilled water and stained in Harris hematoxylin solution for 8
min and were subsequently washed in running tap water for 5 min and
incubated in 1% acid alcohol for 30 sec. The tissue sections were
washed in running tap water for 1 min and stained in 0.2% ammonia
water or saturated lithium carbonate solution for 30 sec to 1 min.
Sections were washed in running tap water for 5 min and rinsed ten
times in 95% alcohol. The tissue sections were counterstained in
eosin-phloxine solution for 30 sec to 1 min and the sections were
dehydrated using 95% alcohol and twice in of absolute alcohol, 5
min each time. Finally the tissue sections were cleared twice in
xylene for 5 min each time and mounted with xylene-based mounting
medium. The tissue sections were visualized using a microscope
(Olympus BX41; Olympus, Tokyo, Japan).
Study design
The purified MPMs were cultured (3×10⁵
cells/ml) in RPMI-1640 medium, containing 4 mM D-GLU (normal GLU;
NG; KeyGen Biotech. Co., Ltd.), supplemented with 10%
heat-inactivated fetal calf serum (KeyGen Biotech. Co., Ltd.) and
penicillin (100 U/ml; KeyGen Biotech. Co., Ltd.) for 12 h. The MPMs
were treated with specific concentrations of GLU for 6 h to form
six groups with varying GLU conditions: 1) Continuous 4 mM GLU; 2)
continuous 8 mM GLU; 3) continuous 16 mM GLU; 4) continuous 24 mM
GLU; 5) continuous 32 mM GLU and 6) alternating 4 mM GLU and 24 mM
GLU every 1.5 h. The MPMs were also treated with 32 mM GLU for 3,
6, 12 or 18 h. In additional experiments, MPMs (3×10⁵
cells/ml) were pretreated for 30 min with either SP600125 JNK
inhibitor (Selleckchem, Houston, TX, USA), dissolved in 100%
dimethyl sulfoxide (DMSO; Sigma-Aldrich), and then diluted in
culture medium or an equal volume of 0.1% DMSO as a negative
control. The MPMs were then incubated at 37°C in 32 mM D-GLU (high
GLU; HG) for 12 h.
Reverse transcription-quantitative
polymerase chain reaction (RT-qPCR)
Total RNA was extracted from the MPMs using TRIzol
reagent (Tiangen Biotech Co., Ltd., Beijing, China), and the RNA
purity was determined by measuring the absorbance at 260 and 280 nm
(A260/280) using a U-3900 UV spectrophotometer (Hitachi, Tokyo,
Japan). The RNA was reverse transcribed into cDNA using SuperScript
II reverse transcriptase and oligo d(T) (Tiangen Biotech Co.,
Ltd.), according to the manufacturer’s instructions. Primer
sequences for IL-18 and β-actin were designed, based on published
sequence data from the NCBI database (http://www.ncbi.nlm.nih.gov/). The primers were
synthesized by Sangon Biotech (Shanghai, China). All reactions were
performed in triplicate. The primer sequences were as follows:
IL-18, forward 5′-ATGGAGACCTGGAATCAGACA-3′ and reverse
5′-CTTCACAGAGAGGGTCACAGC-3′ (218 bp) and β-actin, forward
5′-TGGAATCCTGTGGCATCCATGAAAC-3′ and reverse
5′-TAAAACGCAGCTCAGTAACAGTCCG-3′ (349 bp). RT-qPCR was performed
using the following cycle conditions: 94°C for 10 min, 94°C for 30
sec and 30 cycles of 60°C for 30 sec and 72°C for 45 sec, using a
Stepone Plus system (Applied Biosystems, Foster City, CA, USA). The
PCR products were separated by 1.4% agarose (BioWest Agarose,
Madrid, Spain) gel electrophoresis and scanned for grayscale
intensity using the FluorChem HD2 Multifunction digital gel imaging
analysis system (ProteinSimple, Santa Clara, CA, USA) with
AlphaView 1.2.1.0 Image Analysis software (ProteinSimple). The
relative mRNA expression levels of IL-18 were normalized against
β-actin.
IL-18 release determination using
ELISA
The cells were seeded into 96-well plates with 200
μl medium, containing 2×10⁶ MPMs/ml. Following
the different GLU treatments, each collected culture medium was
centrifuged at 250 × g at 4°C to separate the floating cells, and
the supernatant was stored at −80°C. The levels of IL-18 were
measured using a specific mouse IL-18 immunoassay kit (Wuhan Boster
Bio-engineering Limited Company, Wuhan, China).
Statistical analysis
The data are expressed as the mean ± standard
deviation. The data were analyzed using SPSS 16.0 software (SPSS
Inc., Chicago, IL, USA). Normally distributed variables were
analyzed by analysis of variance, with Fisher’s least significant
difference test for post hoc analysis. P<0.05 was considered to
indicate a statistically significant difference.
Results
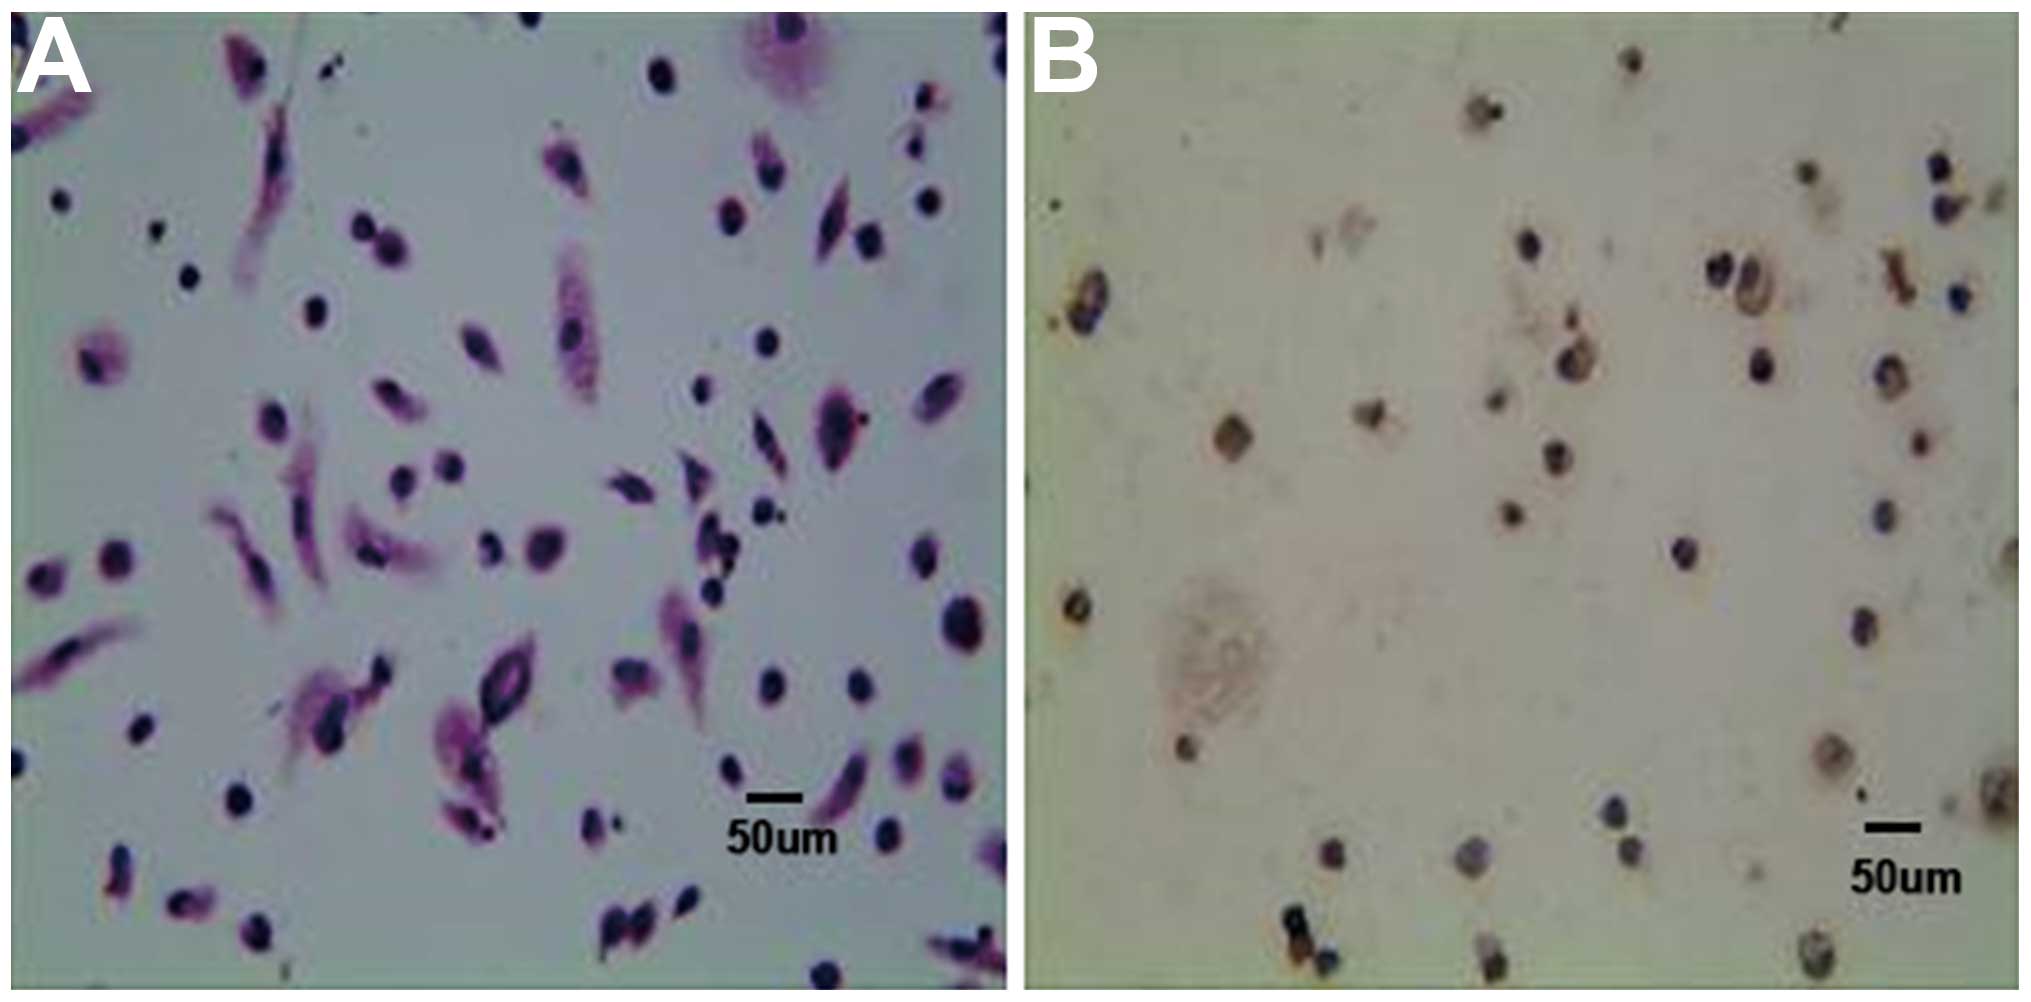
Identification of MPMs
The presence of MPMs was confirmed based on H&E
staining (Fig. 1A) and on lysozyme
positivity using immunocytochemistry (Fig. 1B). The purity of the MPM culture
was >95%. The morphology of the inactive MPMs was round or oval,
however, when the MPMs were stimulated with 6% starch broth, they
exhibited extended pseudopodia, with numerous brown particles or
vacuoles in the cytoplasm and darkly staining nuclei (Fig. 1A).
High and fluctuating levels of GLU
increase the expression and secretion levels of IL-18 in a
dose-dependent manner in MPMs
High GLU levels increased the mRNA expression and
secretion levels of IL-18 in a dose-dependent manner (Fig. 2). The gene expression levels of
IL-18 were increased 8-, 5.1-, 3.2- and 1.9-fold following
treatment with 32, 24, 16 and 8 mM D-GLU, respectively, compared
with 4 mM D-GLU (all P<0.01; Fig.
2A and B). The protein levels of IL-18 in the medium
demonstrated similar results to those of the mRNA (Fig. 2C). Compared with stable 24 mM GLU,
this increase was more notable when the GLU levels fluctuated
between 4 and 24 mM every 1.5 h (RT-qPCR, 0.78±0.05, vs. 0.66±0.07;
ELISA, 188.23±20.32, vs. 143.16±13.07 pg/ml; P<0.05) as shown in
Fig. 2.
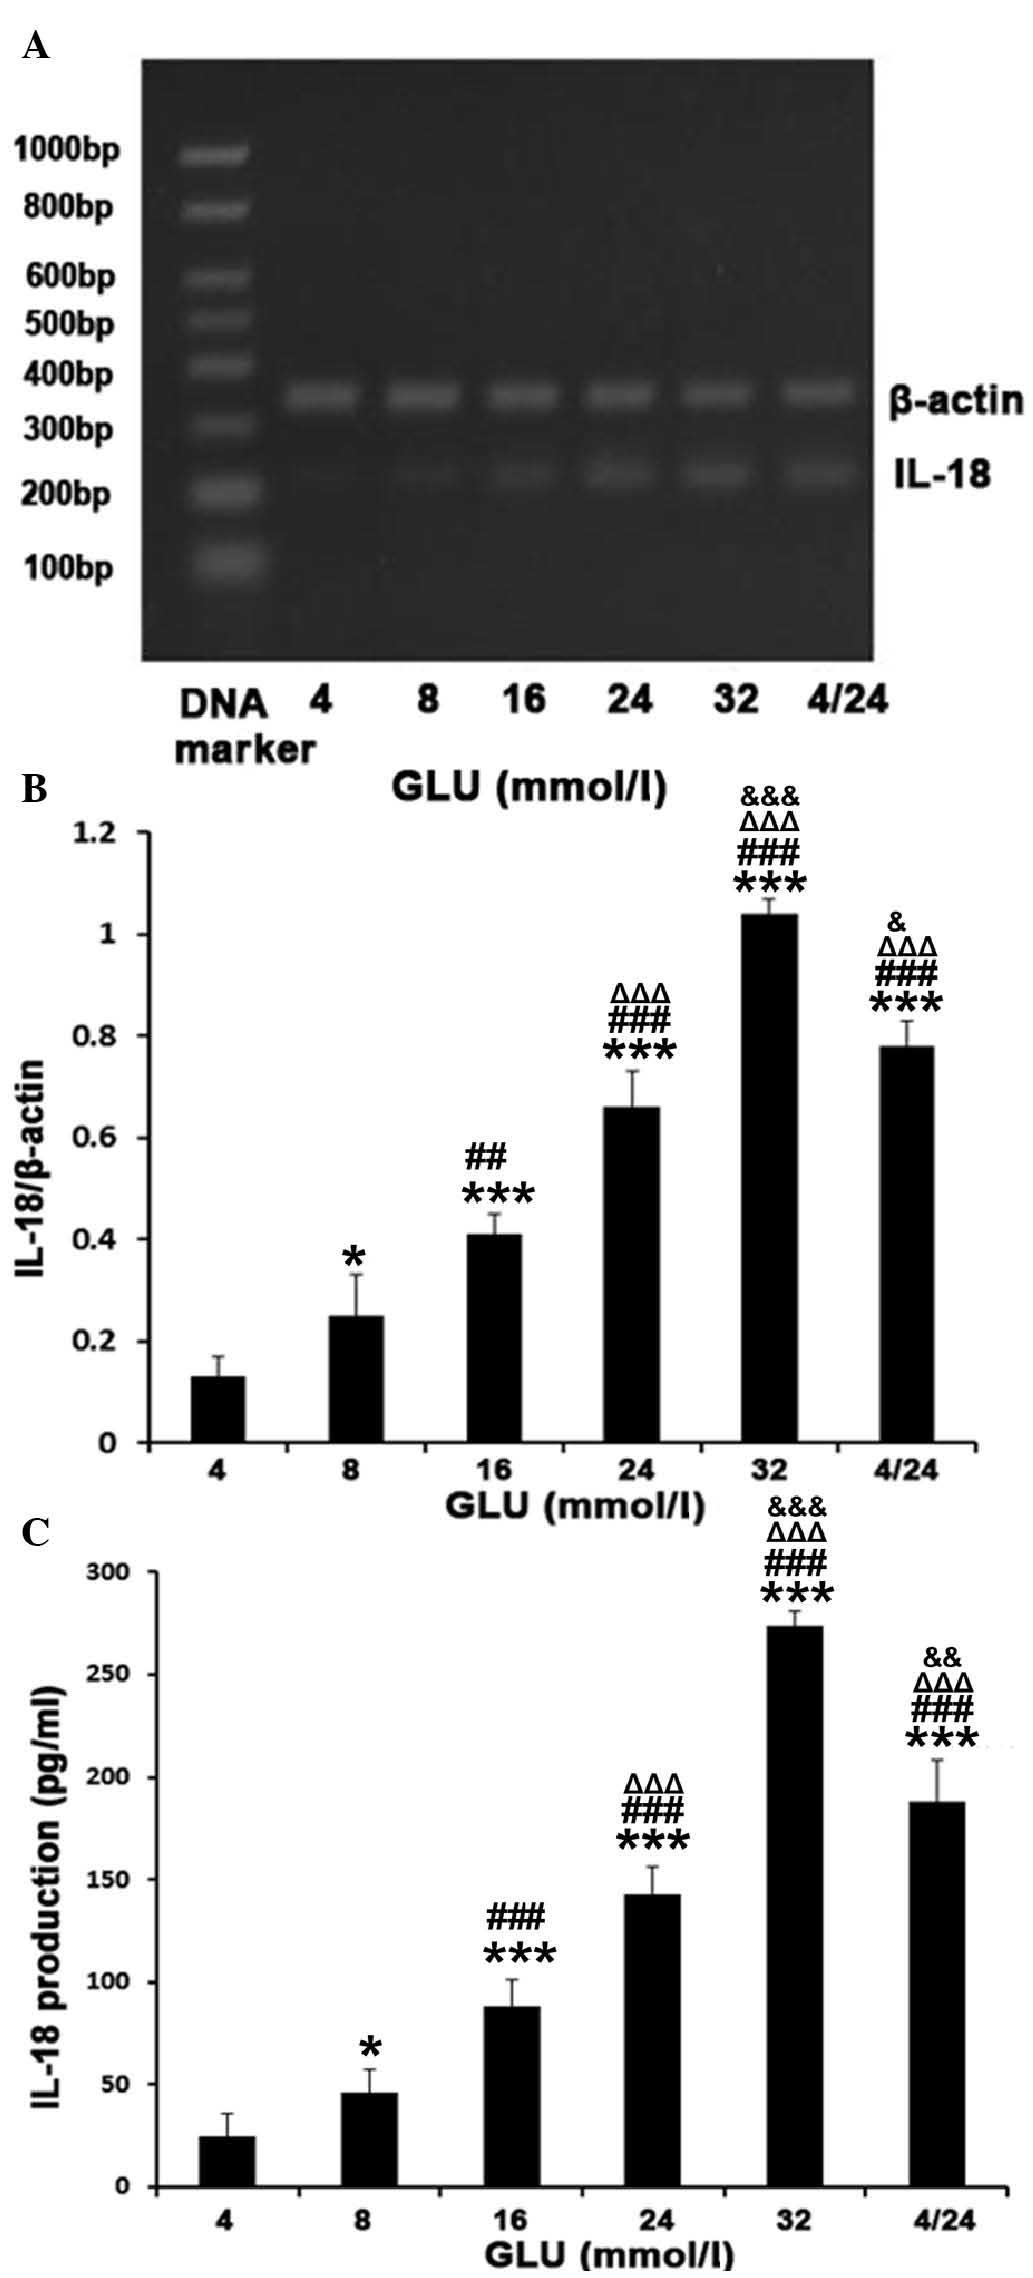 | Figure 2GLU increased the expression levels
and secretion of IL-18 in a dose-dependent manner in MPMs. The MPMs
were treated with different concentrations of GLU, including
continuous treatment with either 4, 8, 16, 24 or 32 mM GLU, or 4
and 24 mM GLU fluctuating every 1.5 h for 6 h. (A and B) The mRNA
expression levels were determined by reverse
transcription-quantitative polymerase chain reaction. β-actin was
used as an internal reference. (C) The secretion of IL-18 was
determined by ELISA. The results are expressed as the mean ±
standard deviation from three independent experiments
(*P<0.05 and ***P<0.001, vs. 4 mM GLU;
##P<0.01 and ###P<0.001, vs. 8 mM GLU;
ΔΔΔP<0.001, vs. 16 mM GLU; &P<0.05,
&&P<0.01 and
&&&P<0.001, vs. 24 mM GLU). GLU, glucose;
MPMs, mouse peritoneal macrophages; IL, interleukin. |
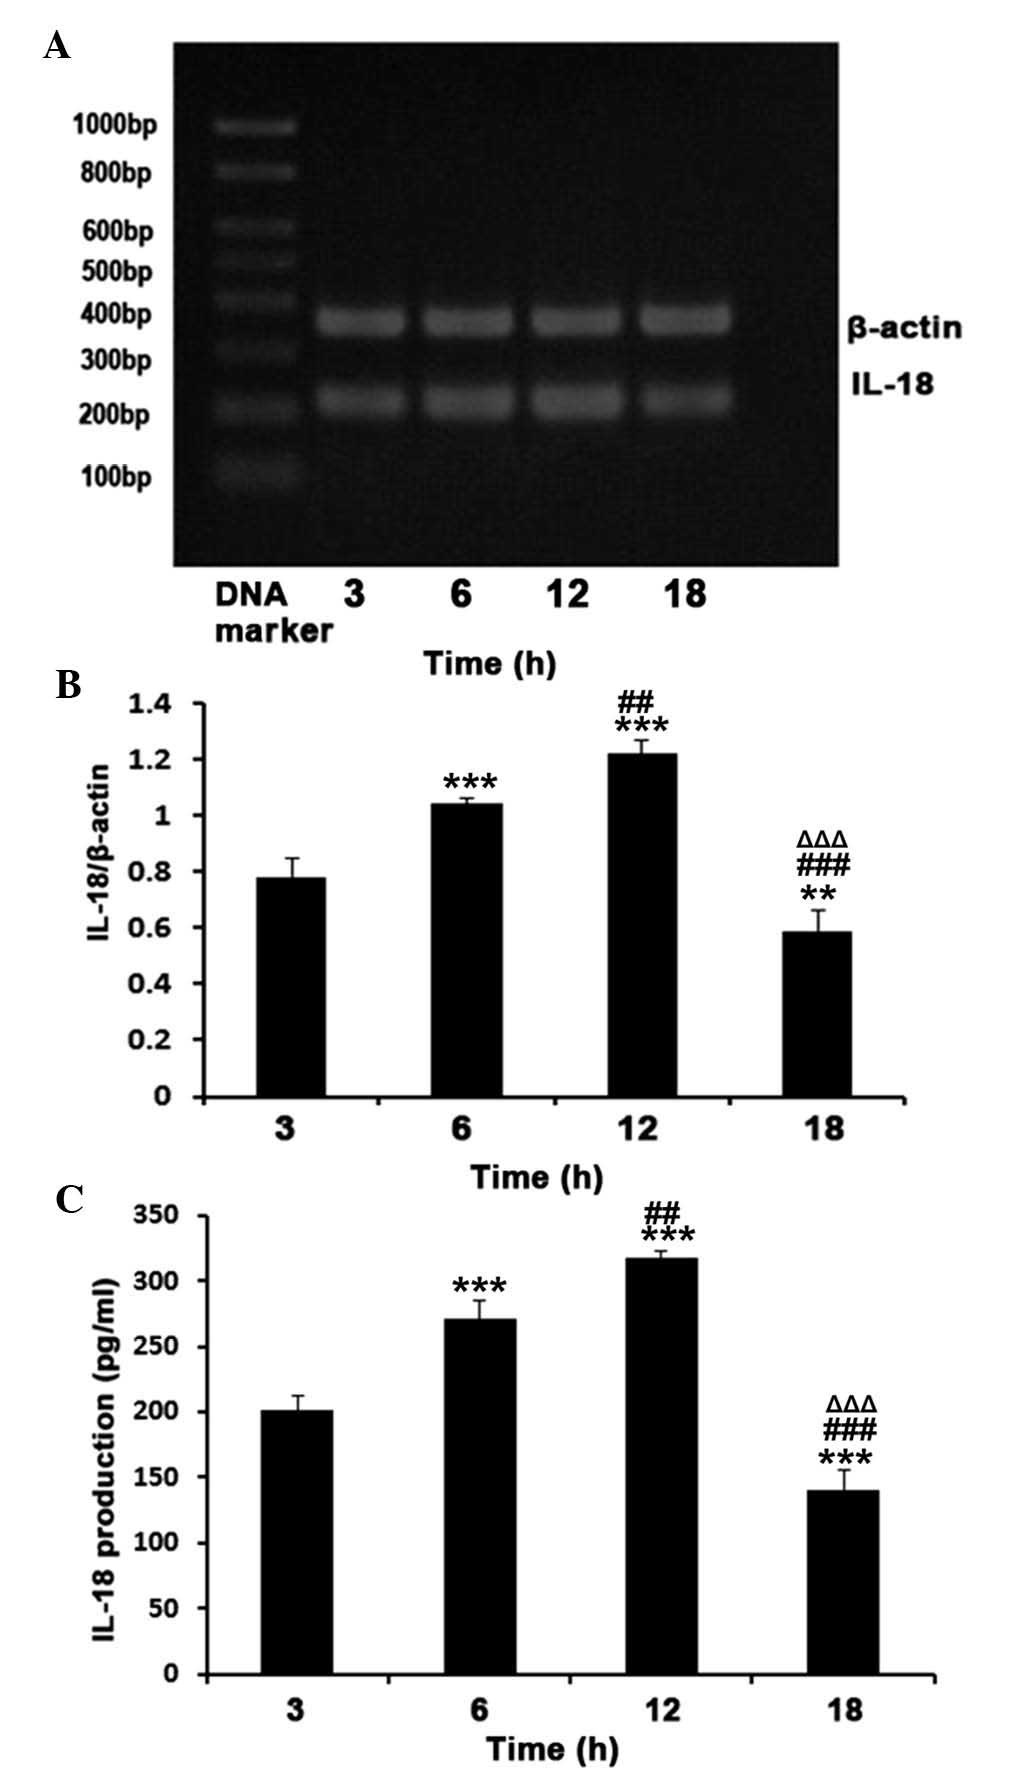
Effects of the duration of high GLU
treatment on the expression and secretion of IL-18 in MPMs
A significant increase in the mRNA expression and
secretion levels of IL-18 were observed following 3 h treatment
with 32 mM D-GLU (HG), following which levels of IL-18 continued to
increase and reached a maximum at 12 h. At 18 h, the levels
decreased compared with those observed at 3 h (P<0.01; Fig. 3). Following HG treatment for 6 h
and 12 h, the mRNA expression levels of IL-18 increased 1.3- and
1.6-fold, respectively compared with 3 h treatment (P<0.01).
There was a significant decrease at 18 h, with a 24.4% reduction
compared with that at 3 h (P<0.01; Fig. 3A and B). The secretion of IL-18
followed the same trend as the mRNA expression levels (Fig. 3C).
Role of JNK in HG-induced expression and
secretion of IL-18 in MPMs
Treatment with the JNK inhibitor, SP600125,
significantly inhibited the HG-induced expression and secretion
levels of IL-18 in a dose-dependent manner (Fig. 4). The reductions in the mRNA
expression levels of IL-18 were 15.6, 39.3 and 53.3% when
pretreated with 5, 10 and 15 μM SP600125, respectively,
compared with the MPMs treated with HG alone as a negative control
(P<0.01; Fig. 4A and B). The
protein levels of IL-18 in the medium followed the same trend
(Fig. 4C).
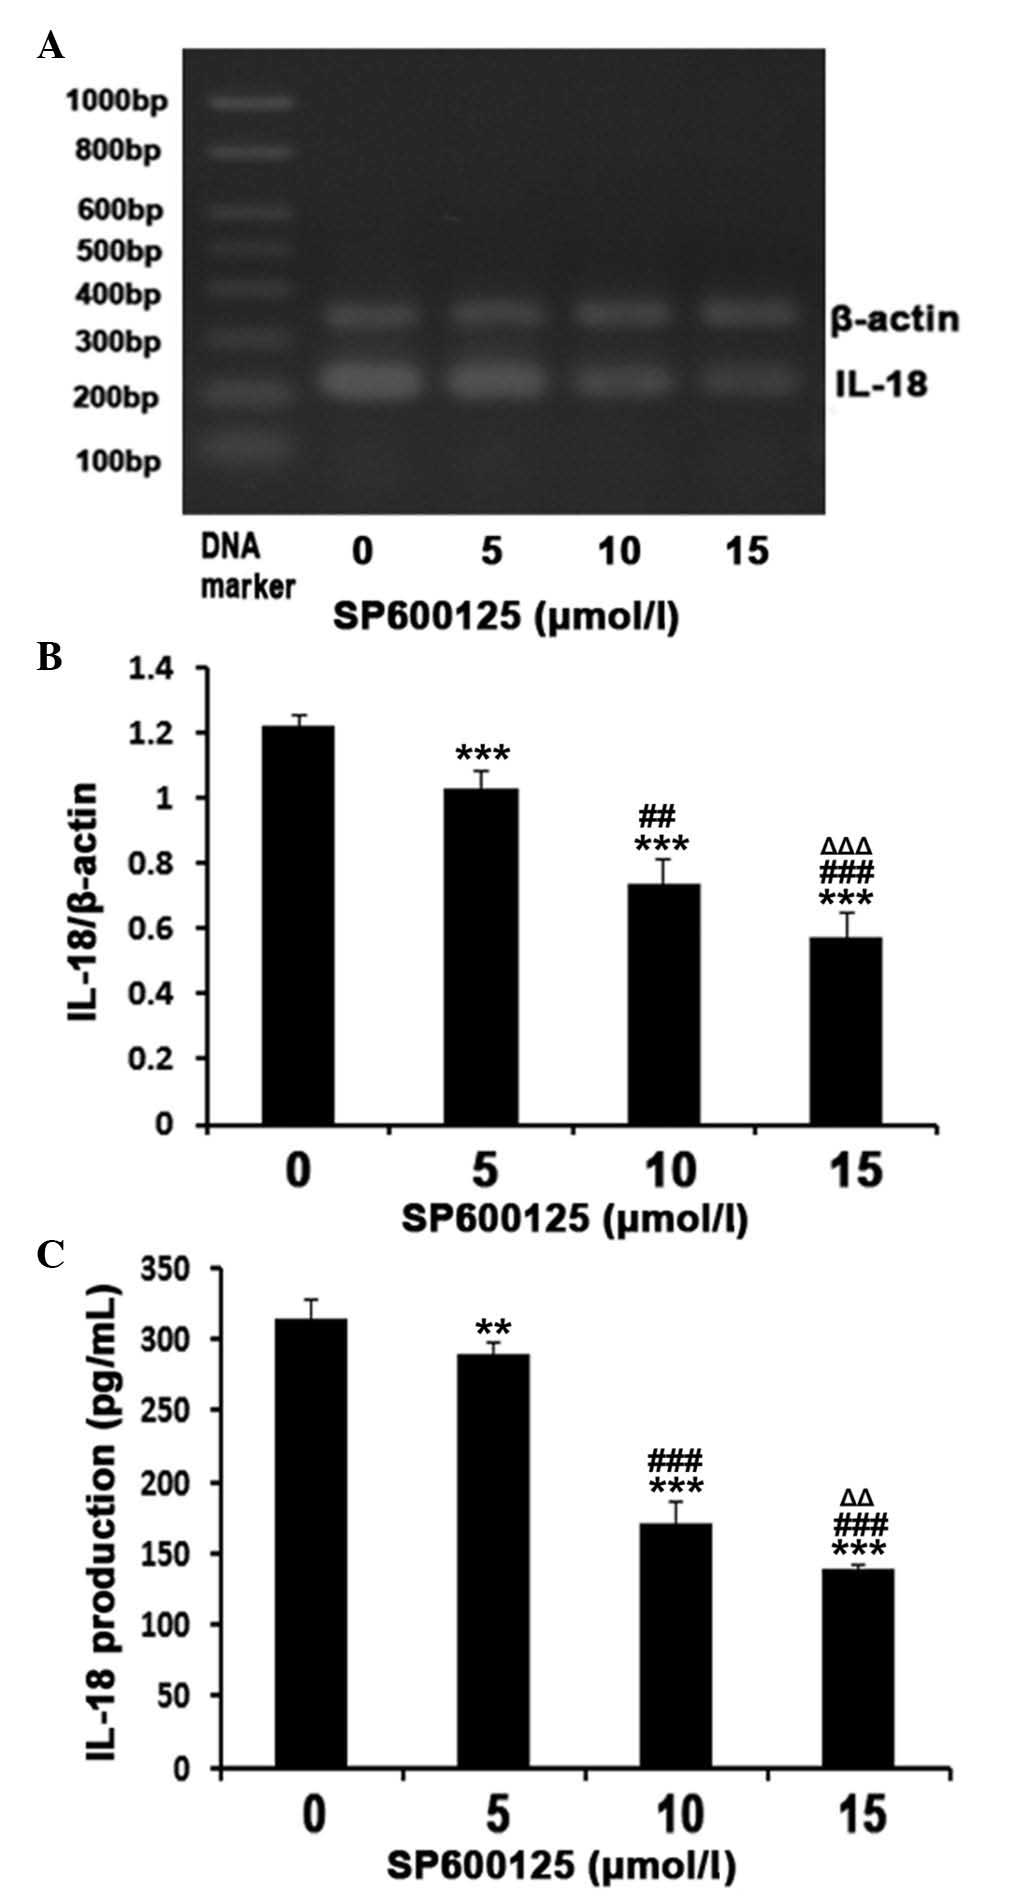 | Figure 4Inhibitory effect of the JNK
inhibitor, SP600125, on the 32 mM GLU-induced mRNA expression and
secretion of IL-18 in MPMs. The MPMs were pre-treated with
different concentrations of SP600125 for 30 min, and the cells were
subsequently incubated with 32 mM GLU in the presence of SP600125
at the indicated doses. (A and B) mRNA expression levels were
determined by reverse transcription-quantitative polymerase chain
reaction, using β-actin as an internal reference. (C) Secretion of
IL-18 was determined by ELISA. The results are expressed as the
mean ± standard deviation from three independent experiments
(**P<0.05 and ***P<0.01, vs. 0
μM SP600125; ##P<0.05 and
###P<0.001, vs. 5 μM SP600125 and
ΔΔP<0.05 and ΔΔΔP<0.001, vs. 10
μM SP600125). GLU, glucose; IL, interleukin; MPMs, mouse
peritoneal macrophages; JNK, c-Jun N-terminal kinase. |
Discussion
Previous studies have demonstrated that the
expression of IL-18 is increased in metabolic syndrome (15), diabetes, obesity (14), and polycystic ovary syndrome
(16). It has also been revealed
that IL-18 is associated with the development of vascular lesions
and diabetic atherosclerosis (32). Notably, diabetes (18) and cardiovascular diseases (33) have been associated with higher
expression levels of IL-18 at baseline, therefore, IL-18 may be
involved in the development of diabetes-associated
atherosclerosis.
The present study investigated the effects of
different concentrations of GLU on the secretion and mRNA
expression levels of the proinflammatory cytokine, IL-18, in MPMs.
The results demonstrated that HG induced a significant increase in
the secretion and mRNA expression levels of IL-18, and these
effects occurred in a dose-dependent manner. In addition, GLU
fluctuations significantly promoted the expression and secretion of
IL-18 compared with stable GLU concentrations. It was further
demonstrated that the expression and secretion levels of IL-18 were
increased at 8 and 12 h following exposure to HG, and decreased at
18 h. These results suggested that the effects of GLU on IL-18 were
mediated by the JNK pathway, since SP600125, a JNK inhibitor,
decreased the production of IL-18 production in a dose-dependent
manner. However, comprehensive pathway analysis is required to
elucidate the underlying mechanisms.
It has been well established that GLU increases the
expression levels of a number of cytokines, including IL-6, IL-12
and IL-18, ~2.0-fold at a 10 mM concentration of GLU, and that this
effect is dose-dependent (8).
Compared with previous studies, the present study used lower
concentration increments of GLU, providing refined details on the
GLU-mediated expression of IL-18. The highest concentration used,
32 mM, induced the highest expression levels of IL-18, suggesting
that using higher concentrations of GLU may induce higher
expression levels of IL-18.
By contrast to a previous study by Wen et al
(8), where the authors used
constant GLU levels only, the present study included a fluctuating
GLU group, in which GLU levels alternated between 4 and 24 mM every
1.5 h, simulating postprandial cycles. In this group, the mRNA
expression levels of IL-18 were higher compared with the stable 14
mM group. A previous study demonstrated a significant increase in
the expression levels of IL-18 in fat cells exposed to GLU
fluctuations (28). These results
and those of the present study suggested that the stimulatory
function of GLU fluctuation on IL-18 is more significant than
stable GLU concentrations. These results concur with results
previously observed in patients (23–25),
suggesting that patients may benefit from strict glycemic control
to maintain GLU levels as stable as possible.
The present study demonstrated that the HG-induced
mRNA expression of IL-18 occurred as early as 3 h, peaked at 12 h
and decreased at 18 h. However, a previous study revealed that the
peak occurred at 3 h, which differed from the results of the
present study (8). This
discrepancy may be due to a number of factors. Firstly, the
controls were not identical, as the present study examined time
course of IL-18 at only one GLU concentration, whereas the previous
study measured the expression of IL-18 in different concentration
groups at a single time-point. Secondly, a number of factors may
affect the expression of IL-18 other that GLU concentration, and
these factors may not have been controlled in the previous study.
Previous animal and clinical investigations have demonstrated the
existence of a peak in the expression of IL-18 under different
stresses (8,28,34,35),
and the results of the present study are consistent with these
studies, even if the peak did not occur at the same time-point.
IL-18 is well known to be modulated by inflammation
(31,36–38).
In addition, clinical trials have demonstrated that plasma levels
of IL-18 correlate with insulin resistance (17). JNK belongs to the mitogen-activated
protein kinase (MAPK) family and contributes to inflammatory
responses, cell proliferation, apoptosis and tissue morphogenesis
(29,39). A previous study reported that JNK
inhibitors significantly reduce the LPS-stimulated expression of
IL-18 in murine keratinocytes (40). Another study revealed that HG
stimulated the activation of protein kinase C, p38, MAPK-p38, JNK
and nuclear transcription factor-kB kinase, and that inhibitors of
these pathways all reduce the mRNA expression levels of IL-12 in
MPMs (8). To examine whether the
JNK pathway is involved in the effects of HG on IL-18, the present
study used SP600125, a highly selective inhibitor of JNK1, JNK2 and
JNK3, which was observed to inhibit the HG-induced expression of
IL-18 in a dose-dependent manner. These results suggested that the
JNK pathway was involved in the HG-induced mRNA expression of
IL-18.
The present study had several limitations. Firstly,
whether the expression levels of IL-8 in MPMs peak at the same
time-point in different concentrations of GLU was not investigated.
Secondly, further investigations are required to elucidate the
association between the HG-induced expression of IL-18 and JNK
inhibitors and the duration of treatment. Furthermore, the
underlying mechanisms remain to be elucidated. As a proinflammatory
cytokine, the overexpression of IL-18 is not an isolated event in
the human body, and further investigation is required to evaluate
the association between IL-18 and other proinflammatory factors,
including IL-1, IL-6, IL-12, IL-18, tumor necrosis factor-α and
interferon-γ, all of which are significantly increased under HG
(8).
In conclusion, HG increased the expression and
secretion of IL-18 in MPMs in a dose-dependent manner. GLU
fluctuations had an impact on the expression and secretion of
IL-18, and the JNK signaling pathway may be a mechanism involved in
the effects of HG. These results suggested that HG-induced
expression and secretion of IL-18 in macrophages may be involved in
the development of diabetes and long-term vascular
complications.
Acknowledgments
This study was supported by the Natural Science
Foundation of the Anhui Higher Education Institutions, China (no.
KJ2014A156) and Health Department issues of Anhui province (no.
09A014).
References
|
1
|
Kannel WB and McGee DL: Diabetes and
cardiovascular disease. The Framingham study. JAMA. 241:2035–2038.
1979. View Article : Google Scholar : PubMed/NCBI
|
|
2
|
Haffner SM, Lehto S, Rönnemaa T, et al:
Mortality from coronary heart disease in subjects with type 2
diabetes and in nondiabetic subjects with and without prior
myocardial infarction. N Engl J Med. 339:229–234. 1998. View Article : Google Scholar : PubMed/NCBI
|
|
3
|
Hansson GK: Inflammation, atherosclerosis
and coronary artery disease. N Engl J Med. 352:1685–1695. 2005.
View Article : Google Scholar : PubMed/NCBI
|
|
4
|
Shalhoub J, Falck-Hansen MA, Davies AH and
Monaco C: Innate immunity and monocyte-macrophage activation in
atherosclerosis. J Inflamm (Lond). 8:92011. View Article : Google Scholar
|
|
5
|
Formigli L, Manneschi LI, Nediani C, et
al: Are macrophages involved in early myocardial reperfusion
injury? Ann Thorac Surg. 71:1596–1602. 2001. View Article : Google Scholar : PubMed/NCBI
|
|
6
|
Herskowitz A, Choi S, Ansari AA and
Wesselingh S: Cytokine mRNA expression in postischemic/reperfused
myocardium. Am J Pathol. 146:419–428. 1995.PubMed/NCBI
|
|
7
|
Lotz M: Interleukin-6. Cancer Invest.
11:732–742. 1993. View Article : Google Scholar : PubMed/NCBI
|
|
8
|
Wen Y, Gu J, Li SL, et al: Elevated
glucose and diabetes promote interleukin-12 cytokine gene
expression in mouse macrophages. Endocrinology. 147:2518–2525.
2006. View Article : Google Scholar : PubMed/NCBI
|
|
9
|
Nakanishi K, Yoshimoto T, Tsutsui H and
Okamura H: Interleukin-18 is a unique cytokine that stimulates both
Th1 and Th2 responses depending on its cytokine milieu. Cytokine
Growth Factor Rev. 12:53–72. 2001. View Article : Google Scholar : PubMed/NCBI
|
|
10
|
Hoshino T, Kawase Y, Okamoto M, et al:
Cutting edge: IL-18-transgenic mice: in vivo evidence of a broad
role for IL-18 in modulating immune function. J Immunol.
166:7014–7018. 2001. View Article : Google Scholar : PubMed/NCBI
|
|
11
|
Pope RM and Tschopp J: The role of
interleukin-1 and the inflammasome in gout: implications for
therapy. Arthritis Rheum. 56:3183–3188. 2007. View Article : Google Scholar : PubMed/NCBI
|
|
12
|
Hoshino K, Tsutsui H, Kawai T, et al:
Cutting edge: generation of IL-18 receptor-deficient mice: evidence
for IL-1 receptor-related protein as an essential IL-18 binding
receptor. J Immunol. 162:5041–5044. 1999.PubMed/NCBI
|
|
13
|
Tsutsui H, Nakanishi K, Matsui K, et al:
IFN-gamma-inducing factor up-regulates Fas ligand-mediated
cytotoxic activity of murine natural killer cell clones. J Immunol.
157:3967–3973. 1996.PubMed/NCBI
|
|
14
|
Esposito K, Pontillo A, Ciotola M, et al:
Weight loss reduces interleukin-18 levels in obese women. J Clin
Endocrinol Metab. 87:3864–3866. 2002. View Article : Google Scholar : PubMed/NCBI
|
|
15
|
Hung J, McQuillan BM, Chapman CM, et al:
Elevated interleukin-18 levels are associated with the metabolic
syndrome independent of obesity and insulin resistance.
Arterioscler Thromb Vasc Biol. 25:1268–1273. 2005. View Article : Google Scholar : PubMed/NCBI
|
|
16
|
Escobar-Morreale HF, Botella-Carretero JI,
Villuendas G, et al: Serum interleukin-18 concentrations are
increased in the polycystic ovary syndrome: relationship to insulin
resistance and to obesity. J Clin Endocrinol Metab. 89:806–811.
2004. View Article : Google Scholar : PubMed/NCBI
|
|
17
|
Fischer CP, Perstrup LB, Berntsen A, et
al: Elevated plasma interleukin-18 is a marker of
insulin-resistance in type 2 diabetic and non-diabetic humans. Clin
Immunol. 117:152–160. 2005. View Article : Google Scholar : PubMed/NCBI
|
|
18
|
Thorand B, Kolb H, Baumert J, et al:
Elevated levels of interleukin-18 predict the development of type 2
diabetes: results from the MONICA/KORA Augsburg Study, 1984–2002.
Diabetes. 54:2932–2938. 2005. View Article : Google Scholar : PubMed/NCBI
|
|
19
|
Yamaoka-Tojo M, Tojo T, Wakaume K, et al:
Circulating interleukin-18: A specific biomarker for
atherosclerosis-prone patients with metabolic syndrome. Nutr Metab
(Lond). 8:32011. View Article : Google Scholar
|
|
20
|
Blankenberg S, Tiret L, Bickel C, et al:
Interleukin-18 is a strong predictor of cardiovascular death in
stable and unstable angina. Circulation. 106:24–30. 2002.
View Article : Google Scholar : PubMed/NCBI
|
|
21
|
Tiret L, Godefroy T, Lubos E, et al:
Genetic analysis of the interleukin-18 system highlights the role
of the interleukin-18 gene in cardiovascular disease. Circulation.
112:643–650. 2005. View Article : Google Scholar : PubMed/NCBI
|
|
22
|
Hansen AP and Johansen K: Diurnal patterns
of blood glucose, serum free fatty acids, insulin, glucagon and
growth hormone in normals and juvenile diabetics. Diabetologia.
6:27–33. 1970. View Article : Google Scholar : PubMed/NCBI
|
|
23
|
Monnier L, Mas E, Ginet C, et al:
Activation of oxidative stress by acute glucose fluctuations
compared with sustained chronic hyperglycemia in patients with type
2 diabetes. JAMA. 295:1681–1687. 2006. View Article : Google Scholar : PubMed/NCBI
|
|
24
|
Chang CM, Hsieh CJ, Huang JC and Huang IC:
Acute and chronic fluctuations in blood glucose levels can increase
oxidative stress in type 2 diabetes mellitus. Acta Diabetol.
49:S171–S177. 2012. View Article : Google Scholar : PubMed/NCBI
|
|
25
|
Node K and Inoue T: Postprandial
hyperglycemia as an etiological factor in vascular failure.
Cardiovasc Diabetol. 8:232009. View Article : Google Scholar : PubMed/NCBI
|
|
26
|
Rizzo MR, Barbieri M, Marfella R and
Paolisso G: Reduction of oxidative stress and inflammation by
blunting daily acute glucose fluctuations in patients with type 2
diabetes: role of dipeptidyl peptidase-IV inhibition. Diabetes
Care. 35:2076–2082. 2012. View Article : Google Scholar : PubMed/NCBI
|
|
27
|
Azuma K, Kawamori R, Toyofuku Y, et al:
Repetitive fluctuations in blood glucose enhance monocyte adhesion
to the endothelium of rat thoracic aorta. Arterioscler Thromb Vasc
Biol. 26:2275–2280. 2006. View Article : Google Scholar : PubMed/NCBI
|
|
28
|
Sun J, Xu Y, Dai Z and Sun Y: Intermittent
high glucose stimulate MCP-l, IL-18 and PAI-1, but inhibit
adiponectin expression and secretion in adipocytes dependent of
ROS. Cell Biochem Biophys. 55:173–180. 2009. View Article : Google Scholar
|
|
29
|
Gill R, Tsung A and Billiar T: Linking
oxidative stress to inflammation: Toll-like receptors. Free Radic
Biol Med. 48:1121–1132. 2010. View Article : Google Scholar : PubMed/NCBI
|
|
30
|
Davis RJ: Signal transduction by the JNK
group of MAP kinases. Cell. 103:239–252. 2000. View Article : Google Scholar : PubMed/NCBI
|
|
31
|
Kim YM, Im JY, Han SH, et al: IFN-gamma
up-regulates IL-18 gene expression via IFN consensus
sequence-binding protein and activator protein-1 elements in
macrophages. J Immunol. 165:3198–3205. 2000. View Article : Google Scholar : PubMed/NCBI
|
|
32
|
Mallat Z, Corbaz A, Scoazec A, et al:
Interleukin-18/interleukin-18 binding protein signaling modulates
atherosclerotic lesion development and stability. Circ Res.
89:E41–E45. 2001. View Article : Google Scholar : PubMed/NCBI
|
|
33
|
Everett BM, Bansal S, Rifai N, et al:
Interleukin-18 and the risk of future cardiovascular disease among
initially healthy women. Atherosclerosis. 202:282–288. 2009.
View Article : Google Scholar :
|
|
34
|
Arndt PG, Fantuzzi G and Abraham E:
Expression of interleukin-18 in the lung after endotoxemia or
hemorrhage-induced acute lung injury. Am J Respir Cell Mol Biol.
22:708–713. 2000. View Article : Google Scholar : PubMed/NCBI
|
|
35
|
Esposito K, Nappo F, Marfella R, et al:
Inflammatory cytokine concentrations are acutely increased by
hyperglycemia in humans: role of oxidative stress. Circulation.
106:2067–2072. 2002. View Article : Google Scholar : PubMed/NCBI
|
|
36
|
Kim YM, Kang HS, Paik SG, et al: Roles of
IFN consensus sequence binding protein and PU. 1 in regulating
IL-18 gene expression. J Immunol. 163:2000–2007. 1999.PubMed/NCBI
|
|
37
|
Alsaleh G, Suffert G, Semaan N, et al:
Bruton’s tyrosine kinase is involved in miR-346-related regulation
of IL-18 release by lipopolysaccharide-activated rheumatoid
fibroblast-like synoviocytes. J Immunol. 182:5088–5097. 2009.
View Article : Google Scholar : PubMed/NCBI
|
|
38
|
Cordoba-Rodriguez R, Fang H, Lankford CS
and Frucht DM: Anthrax lethal toxin rapidly activates caspase-1/ICE
and induces extracellular release of interleukin (IL)-1beta and
IL-18. J Biol Chem. 279:20563–20566. 2004. View Article : Google Scholar : PubMed/NCBI
|
|
39
|
Zhu J, Krishnegowda G and Gowda DC:
Induction of proinflammatory responses in macrophages by the
glycosylphosphatidylinositols of Plasmodium falciparum: the
requirement of extracellular signal-regulated kinase, p38, c-Jun
N-terminal kinase and NF-kappaB pathways for the expression of
proinflammatory cytokines and nitric oxide. J Biol Chem.
280:8617–8627. 2005. View Article : Google Scholar
|
|
40
|
Yun W and Li C: JNK pathway is required
for TNCB-induced IL-18 expression in murine keratinocytes. Toxicol
In Vitro. 24:1064–1069. 2010. View Article : Google Scholar : PubMed/NCBI
|