Introduction
Breast cancer is one of the most common types of
malignancy and is the second leading cause of cancer-associated
mortality among females, with an increasing incidence in several
countries, including China (1,2).
Over the past few decades, novel techniques and methods for
diagnosis and treatment have been developed, improving long-term
survival rates of patients with breast cancer (3) Currently, clinical examination,
ultrasound and mammography, plasma carcinoembryonic antigen (CEA)
and carbohydrate antigen 15-3 (CA15-3) are the most widely applied
techniques and parameters for auxiliary diagnosis, monitoring
recurrence or metastasis in treated patients and predicting
response or resistance to therapies. However, these methods either
lack specificity, to a degree, or have poor positive predictive
values (4,5). Noninvasive and specific biomarkers
for the early diagnosis of breast cancer remain an urgent
requirement.
Nuclear matrix proteins (NMPs), the structural
framework scaffolding of the nucleus, have been demonstrated to be
involved in several vital cellular functions, including steroid
hormone binding, DNA replication, gene transcription and
translation. Due to the important roles of the nuclear matrix in
these vital cellular functions, changes in the structure or
components of NMPs may be implicated in the alteration in cellular
and nuclear structure of cancer cells, and alterations of several
NMPs have been demonstrated as cancer-specific biomarkers, as they
can be detected at elevated levels in the plasma of cancer patients
due to the release from dying cells in a soluble form (6). Therefore, plasma cancer-specific NMPs
may be a candidate marker with improved specificity and sensitivity
(7,8).
Debald et al (9) identified five nuclear matrix
proteins, which were upregulated in human breast cancer tissue, but
were absent in healthy and benign controls. One of the breast
cancer-specific proteins was confirmed as calponin-h2, a member of
the calponin-h2 family. Calponin-h2 is expressed in smooth muscle
and non-muscle cells, and is upregulated in growing smooth muscles,
including the embryonic stomach, urinary bladder, and the uterus
during early pregnancy in mice (10,11).
An appropriate level of h2-calponin may be critical to maintain the
physiological function of different cells, including cell
proliferation, remodeling, motility and phagocytosis (11–13).
However, the association between plasma calponin-h2 and breast
cancer remains to be elucidated. The aims of the present study were
to investigate the plasma levels of calponin-h2 in patients with
breast cancer, benign breast diseases and in healthy controls, to
examine the association between plasma levels of calponin-h2 and
clinicopathological parameters of breast cancer, and to compare the
tissue levels of calponin-h2 levels between breast cancer and
healthy controls.
Patients and methods
Patients
The population examined in the present study
included 156 females, recruited from The Second Affiliated Hospital
of Guangzhou Medical University (Guangzhou, China) between 2010 and
2012, comprising 100 patients with breast cancer, 30 patients with
benign breast disease, and 26 healthy controls. All breast cancer
and benign breast diseases underwent breast mass resection with
histological confirmation of diagnosis. Patients with severe
infection, active clinical comorbidities or a history of any other
malignancy were excluded from the investigation. The healthy
controls were recruited from the check-up center at The Second
Hospital of Guanzhou Medical University and presented a negative
mammogram result, indicating the absence of breast cancer, with no
history of cancer, chronic disease or medications, excluding
hormonal contraception. The present study was approved by the
Guangzhou Medical University Ethics Committee (Guangzhou, China).
Written informed consent was obtained from each patient and control
individual prior to obtaining blood samples. The
clinicopathological characteristics of the population are
summarized in Table I.
 | Table IClinicopathalogical parameters of
patients with breast cancer.s |
Table I
Clinicopathalogical parameters of
patients with breast cancer.s
| Characteristic | Number of patients
(%) |
|---|
| Age (years) | |
| ≤50 | 50 (50) |
| >50 | 50 (50) |
| Histological
type | |
| IDC | 71 (71) |
| DCIS | 14 (14) |
| Other | 15 (15) |
| Tumor size (cm) | |
| ≤2 | 37 (37) |
| >2, ≤5 | 51 (51) |
| >5 | 6 (6) |
| Undetermined | 6 (6) |
| Lymph node
status | |
| N0 | 54 (54) |
| N1 | 28 (28) |
| N2 | 6 (6) |
| N3 | 8 (8) |
| Undetermined | 4 (4) |
| Distant
metastasis | |
| M0 | 90 (90) |
| M1 | 6 (6) |
| Undetermined | 4 (4) |
| Stage | |
| I/II | 69 (69) |
| III/IV | 24 (24) |
| Undetermined | 7 (7) |
| Grade | |
| G1 | 12 (12) |
| G2 | 32 (32) |
| G3 | 34 (34) |
| Undetermined | 7 (7) |
| ER status | |
| Negative | 33 (33) |
| Positive | 64 (64) |
| Undetermined | 3 (3) |
| PR status | |
| Negative | 49 (49) |
| Positive | 48 (48) |
| Undetermined | 3 (3) |
| HER2 status | |
| 0 | 65 (65) |
| 1 | 32 (32) |
| Undetermined | 3 (3) |
| P53 status | |
| Negative | 52 (52) |
| Positive | 46 (46) |
| Undetermined | 2 (2) |
| EGFR status | |
| Negative | 67 (67) |
| Positive | 17 (17) |
| Undetermined | 16 (16) |
| Ki-67 status | |
| Negative | 75 (75) |
| Positive | 25 (25) |
| Undetermined | 0 (0) |
| BCL-2 status | |
| Negative | 38 (38) |
| Positive | 43 (43) |
| Undetermined | 19 (19) |
Samples
Non-fasting venous blood samples (4 ml) were
collected from patients with breast cancer, benign breast disease
and the healthy controls into heparin blood tubes. The blood
samples were centrifuged at 1,610 × g for 10 min at room
temperature and the plasma was aliquoted into micro-centrifuge
tubes and stored at −20°C until use. The blood samples from the
patients with breast cancer and breast benign disease were obtained
prior to surgery.
Enzyme-linked immunosorbent assay (ELISA)
analysis
The plasma concentrations of calponin-h2 were
determined using a commercially available quantitative kit
(E98410HU; USCN Life Science, Inc., Wuhan, China), according to the
manufacturer’s instructions. Briefly, 100 μl each dilution
of the standard, blank and samples (1:5 dilution) were incubated
for 2 h at 37°C. Subsequently, the medium of each well was replaced
with detection reagent A(100 μl/well) and incubated for 1 h
at 37°C. Following removal of the medium and washing three times,
100 μl detection reagent B was added, followed by incubation
for 30 min at 37°C. The wells were washed five times and 90
μl substrate solution was added to each well and incubated
for 15 min at 37°C. Following incubation, 50 μl stop
solution was added to each well and the absorbance was read at 450
nm using a spectrophotometer (SLT Lab Instruments, Salzburg,
Austria). The concentration of calponin-h2 in the plasma was
interpolated from a standard curve, which was generated using the
recombinant protein with the CurveExpert 1.3 software (http://www.curveexpert.net).
Chemiluminescent microparticle
immunoassay
Plasma CEA and CA15-3, which regarded as useful
tumor markers for breast cancer, were routinely assessed using a
chemiluminescent microparticle immunoassay with a commercially
available kit (ARCHITECT CEA; Abbott Laboratories, Abbot Park, IL
USA). The cut-off values for CEA and CA 153, recommended by the
manufacturer, were 5.0 ng/ml and 31.3 μ/ml,
respectively.
Immunohistochemical staining
Comparative analysis was performed on tissue samples
from 12 cases of breast infiltrating ductal carcinoma and 12 normal
breast tissues. The tissue samples (~1×1×0.3 cm) were obtained from
Clinical Pathology of The Second Affiliated Hospital of Guangzhou
Medical University. The tissues were fixed in 10% neutral buffered
formalin. Briefly, the samples were dehydrated through an ethanol
series then the tissue was cleared using xylene (Tianjin Zhiyuan
Chemical Reagent Co., Ltd., Tianjin, China). The tissue samples
were then immersed in paraffin then embedded in a paraffin block.
Sections (4 μm) were prepared from paraffin-embedded samples
using a microtome (Leica RM2135; Leica Microsystems GmbH, Wetzlar,
Germany). The slides were then washed in xylene and rehydrated
using an ethanol series. The slides were then rinsed for 5 min
using phosphate-buffered saline (PBS). The samples were incubated
for 10 min in 3% H2O2 to block endogenous
peroxidases, then, slides were rinsed for 5 min using PBS.
Paraffin-embedded tissue sections were blocked with 5% normal goat
plasma for 30 min following deparaffinization, rehydration and
quenching of endogenous peroxidase activity. The samples were
incubated with monoclonal mouse anti-calponin-h2 primary antibody
(1:400; cat. no. Hoooo1265-M01A; Abnova, Taiwan, China) at 4°C
overnight and peroxidase-labeled polyclonal goat anti-mouse
immunoglobulin (Ig)M κ (1:500; cat. no. 074-1803; KPL,
Gaithersburg, Maryland, USA) at room temperature for 1 h.
Diaminobenzidine (Beyotime Institute of Biotechnology, Nantong,
China) was used as a chromogen. Slides were counterstained with
hematoxylin (Beyotime Institute of Biotechnology), and the
specimens were mounted on slides using Aquatex mounting solution
(Merck, Darmstadt, Germany). The slides were evaluated under a
light microscope (Olympus BH-2; Olympus, Tokyo, Japan), and the
tissues were classified into two categories, 0 or 1, corresponding
to low levels and high levels of expression, respectively.
Statistical analysis
Statistical analysis was performed using SPSS 17.0
software (SPSS Inc., Chicago, IL, USA). Comparisons between the
levels of CEA, CA15-3 and calponin-h2 in the blood were performed
using a Mann-Whitney U test, Kruskal-Wallis test or Wilcoxon signed
rank test, when appropriate. The differences in the levels of
calponin-h2 in the tissues of the breast cancer and healthy control
samples were evaluated using a χ2 test or Fisher exact
test. Receiver operator characteristic (ROC) curve analysis and
calculation of the area under the curve (AUC) were performed in
order to assess the ability of using plasma levels of CEA, CA15-3
and calponin-h2 to correctly distinguish between patients with
breast cancer and healthy individuals, and patients with benign
breast disease. An optimum diagnostic cut-off point for the
population was selected to maximize the clinical sensitivity and
specificity. The combination of CEA, CA15-3 and calponin-h2 were
evaluated by logistic regression and ROC. P<0.05 was considered
to indicate a statistically significant difference.
Results
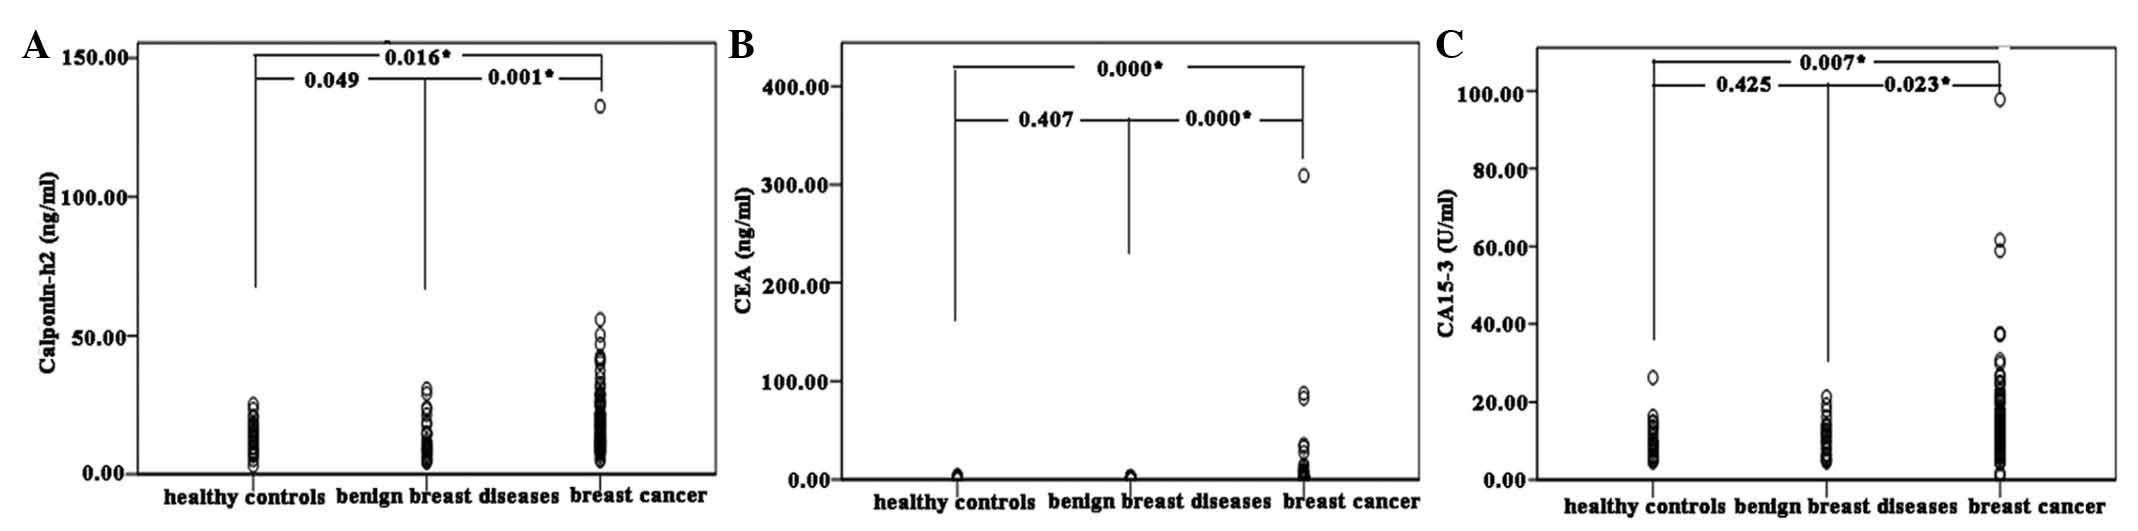
Increased plasma levels of calponin-h2
levels in patients with breast cancer
Comparison between the plasma levels of calponin-h2
in 26 healthy controls, 30 patients with benign breast disease and
100 patients with breast cancer were performed using ELISA. The
median plasma levels of calponin-h2 in the healthy controls,
patients with benign breast disease and patients with breast cancer
were 12.81 (range 3.11–25.25), 10.35 (range 4.36–30.76) and 15.93
ng/ml (range 4.93–132.66 ng/ml) respectively. The plasma levels of
calponin-h2 in the patients with breast cancer were significantly
higher than those in the healthy control (P=0.016) and benign
breast disease (P=0.001) groups. There were also significant
differences in the plasma levels of CEA and CA15-3 between the
patients with breast cancer and benign breast disease, and the
controls (P<0.05). The median plasma levels of CEA and CA15-3
were 2.27 ng/ml (range 0.64–309.20 ng/ml) and 12.85 U/ml (range
4.30–97.70 U/ml) in the breast cancer group, 1.26 ng/ml (range
0.50–3.24 ng/ml) and 10.55 U/ml (range 4.60–21.30 U/ml) in the
benign breast disease group, 0.96 ng/ml (range 0.50–4.06) and 8.95
U/ml (range 4.70–26.3) in the healthy control group (Fig. 1).
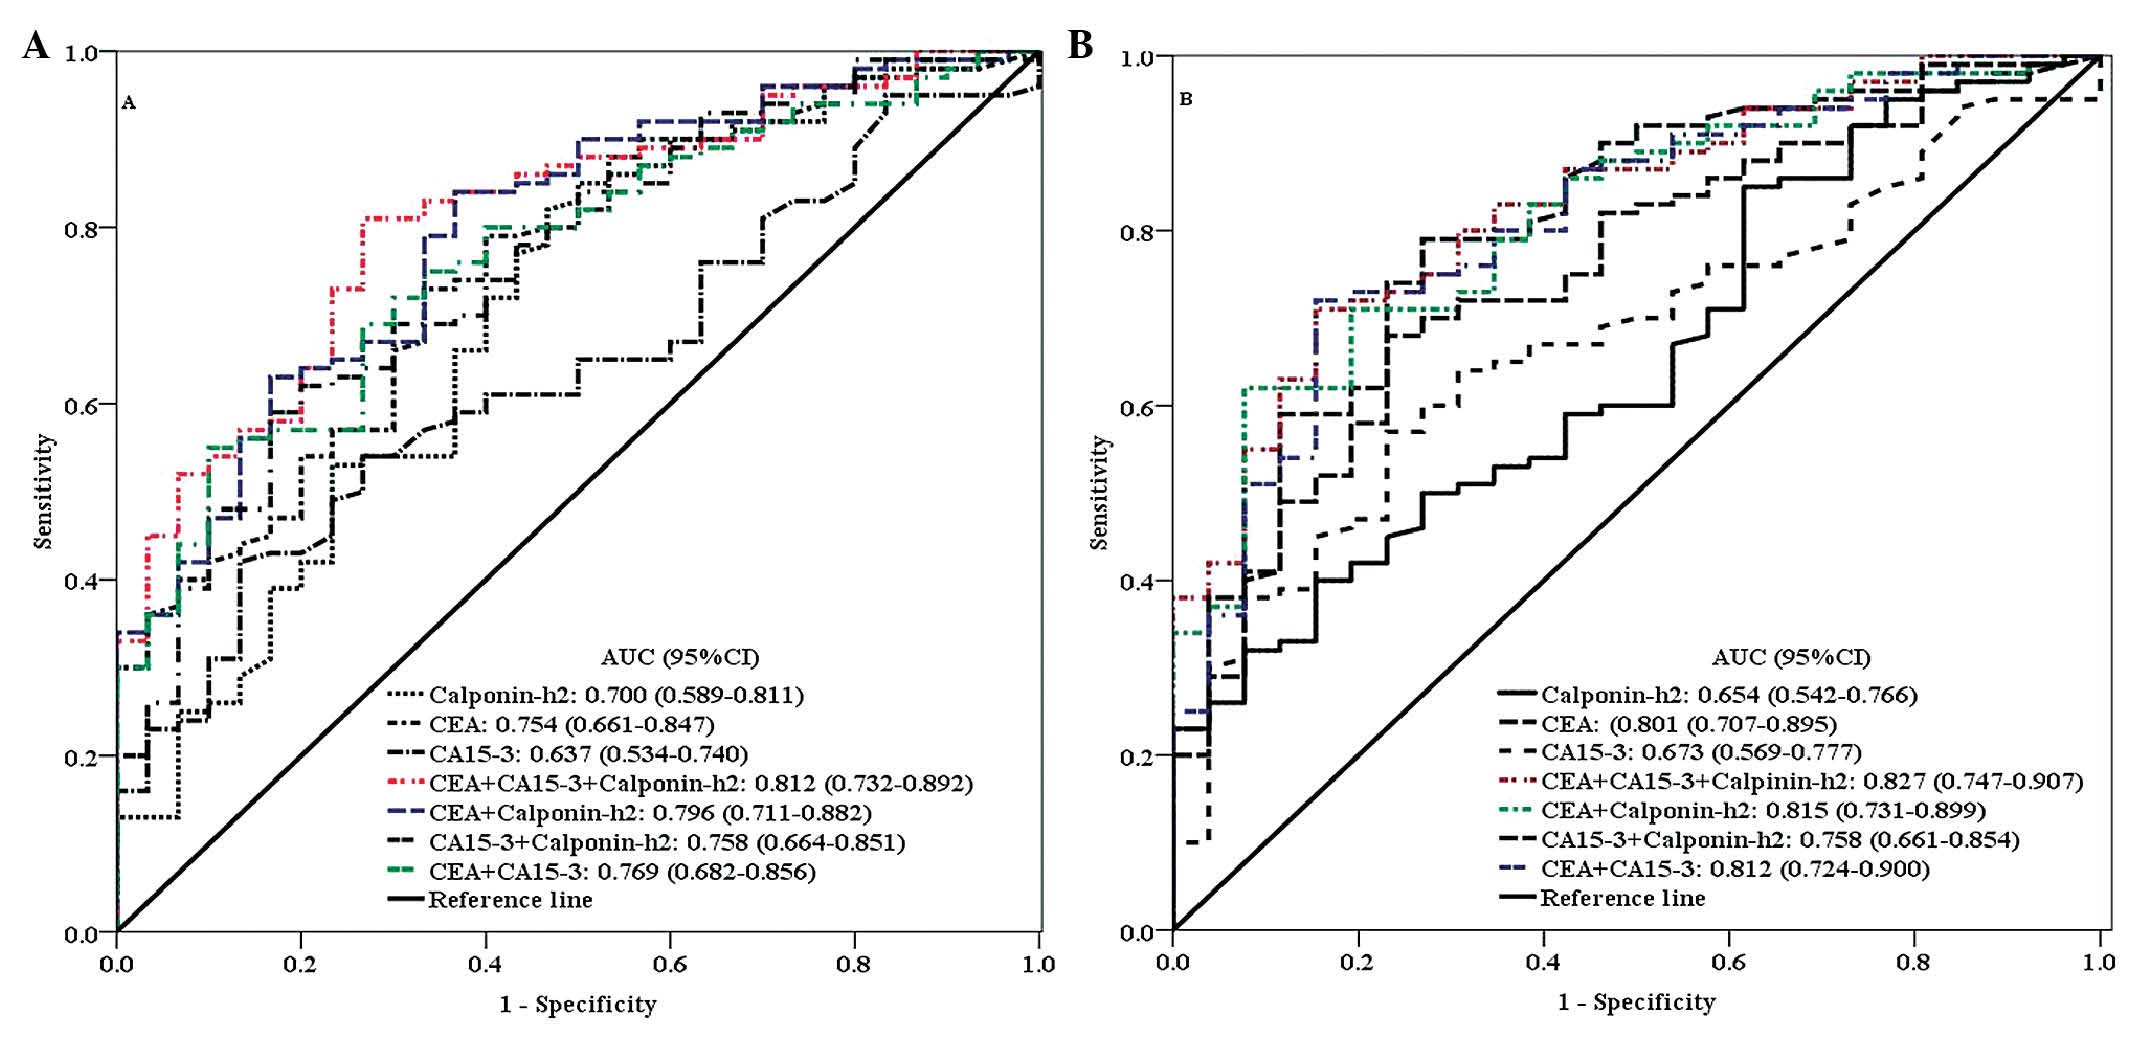
Diagnostic value of plasma CEA, CA15-3
and calponin-h2
To evaluate the diagnostic value of plasma levels of
calponin-h2, CEA and CA15-3, the present study used ROC methods to
calculate the sensitivity and specificity of plasma levels of
calponin-h2, CEA and CA15-3. The AUC of the levels of calponin-h2,
CEA and CA15-3 in the blood from differentiating breast cancer and
benign breast disease were 0.700 [95% confidence interval (CI),
0.589–0.811], 0.754 (95% CI, 0.661–0.847) and 0.637 (95% CI,
0.534–0.740), respectively (Fig.
2). The optimal cut-off of point for the plasma level of
calponin-h2 was 15.14 ng/ml, based on maximization of the Yuden
index, resulting in 53.0% sensitivity, 76.7% specificity, 69.4%
positive predictive value (PPV), and 62.0% negative predictive
value (NPV). Notably, the AUC of the combination of the three
markers reached 0.812 (95% CI, 0.732–0.892) and the AUC of the
association between CEA and calponin-h2, CA15-3 and calponin-h2,
and CEA and CA15-3 reached 0.796 (95% CI, 0.711–0.882), 0.758 (95%
CI, 0.664–0.851) and 0.769 (95% CI, 0.682–0.856), respectively
(Fig. 2). Additionally, the AUC of
the levels of calponin-h2, CEA and CA15-3 between patients with
breast cancer and healthy controls were 0.654 (95% CI,
0.542–0.766), 0.801 (95% CI, 0.707–0.895) and 0.673 (95% CI,
0.569–0.777), respectively (Fig.
3). The optimal cut-off of plasma calponin-h2 level was 10.04
ng/ml, based on the maximization of Yuden index, resulting in 85.0%
sensitivity, 39.5% specificity, 58.4% PPV, and 72.5% NPV. The AUC
of the combination of the three markers reached 0.827 (95% CI,
0.747–0.907), and the AUC of the combination of CEA and
calponin-h2, CA15-3 and calponin-h2 and CEA and CA15-3 were 0.815
(95% CI, 0.731–0.899), 0.758 (95% CI, 0.661–0.854) and 0.812 (95%
CI, 0.724–0.900), respectively (Fig.
3). These data suggested that the combination of calponin-h2,
CA15-3 and CEA may increase the diagnostic accuracy of breast
cancer.
Association between plasma CEA, CA15-3
and calponin-h2 and clinicopathological parameters
To examinee the potential prognostic roles of plasma
calponin-h2 in breast cancer, the present study further analyzed
the association between the levels of plasma calponin-h2 and the
clinicopathological parameters of breast cancer. However, the
plasma level of calponin-h2 was not associated with the tumour
size, lymph node metastasis, distant metastasis,
tumor-node-metastasis stage, endoplasmic reticulum, human epidermal
growth factor (HER-2), Ki67, P53 or B-cell lymphoma 2. However, the
plasma levels of calponin-h2 in PR- breast cancer was significantly
higher, compared with PR+ breast cancer (P= 0.033), and plasma
level of calponin-h2 levels in patients with breast cancer aged
>50 years were significantly higher, compared with that in
patients ≤50 years old (P=0.001). The plasma level of CA15-3 in the
HER-2+ breast cancer, was higher than that in HER-2- breast cancer
(P=0.026). Plasma levels of CEA were also associated with the
stages of breast cancer (P=0.035). Overall, these results indicated
that plasma CEA and CA15-3 were not linked to the other
clinicopathological parameters of breast cancer (Table II).
| Table IIAssociation between the plasma levels
of calponin-h2, CEA, CA15-3, and clinicopathological parameters of
breast cancer. |
Table II
Association between the plasma levels
of calponin-h2, CEA, CA15-3, and clinicopathological parameters of
breast cancer.
| Characteristic | Calponin-h2
(ng/ml) | P-value | CA15-3 (U/ml) | P-value | CEA (ng/ml) | P-value |
|---|
| Age (years) | | 0.001a | | 0.288 | | 0.226 |
| ≤50 | 12.05
(4.93–55.78) | | 13.90
(4.30–97.70) | | 1.98
(0.73–309.20) | |
| >50 | 19.67
(6.45–132.66) | | 12.80
(4.60–37.60) | | 2.62
(0.64–35.56) | |
| Histological
type | | 0.972 | | 0.364 | | 0.137 |
| IDC | 16.11
(4.94–132.66) | | 13.80
(4.30–97.70) | | 2.27
(0.64–309.20) | |
| DCIS | 14.77
(7.84–42.41) | | 12.05
(5.70–24.90) | | 2.08
(1.06–9.44) | |
| Others | 20.94
(8.10–50.24) | | 12.80
(6.00–26.50) | | 2.77
(0.95–15.44) | |
| Tumor size
(cm) | | 0.426 | | 0.280 | | 0.156 |
| ≤2 | 17.43
(6.45–132.66) | | 12.10
(4.50–37.60) | | 2.26
(0.64–15.44) | |
| >2, ≤5 | 15.30
(4.93–46.95) | | 15.15
(4.30–97.70) | | 2.77
(0.78–309.20) | |
| >5 | 14.38
(11.00–21.50) | | 15.20
(10.3–20.00) | | 2.48
(2.11–4.89) | |
| Lymph node
status | | 0.265 | | 0.152 | | 0.194 |
| N0 | 16.80
(4.93–132.7) | | 12.80
(4.30–97.70) | | 2.27
(0.64–87.73) | |
| N1 | 14.86
(7.91–41.59) | | 15.15
(4.50–58.90) | | 2.19
(0.89–9.11) | |
| N2 | 22.69
(9.16–37.24) | | 9.60
(6.00–16.60) | | 3.875
(1.65–309.2) | |
| N3 | 13.07
(5.26–18.18) | | 15.00
(6.00–37.50) | | 2.46
(1.04–82.76) | |
| Distant
metastasis | | 0.711 | | 0.633 | | 0.068 |
| M0 | 15.93
(4.93–132.7) | | 13.00
(4.50–61.60) | | 2.275
(0.64–82.76) | |
| M1 | 16.78
(10.9–41.24) | | 15.90
(4.30–97.70) | | 19.80
(0.99–309.2) | |
| Stage | | 0.690 | | 0.448 | | 0.035a |
| I/II | 15.74
(4.93–132.66) | | 13.10
(4.50––61.60) | | 2.26
(0.64––32.90) | |
| III/IV | 15.49
(5.26–41.24) | | 12.60
(4.30–97.70) | | 2.88
(0.99–309.20) | |
| Grades | | 0.222 | | 0.510 | | 0.955 |
| G1 | 18.38
(10.61–46.95) | | 11.10
(5.70–21.00) | | 2.18
(1.31–9.44) | |
| G2 | 12.90
(4.93–132.65) | | 13.70
(4.50–97.70) | | 2.30
(0.64–309.2) | |
| G3 | 17.30
(6.45–55.78) | | 12.90
(4.30–37.60) | | 2.28
(0.78–35.56) | |
| ER status | | 0.201 | | 0.591 | | 0.918 |
| Negative | 17.43
(6.45–41.59) | | 12.80
(4.30–58.90) | | 2.35
(0.84–309.20) | |
| Positive | 14.36
(4.93–132.66) | | 13.20
(4.50–97.70) | | 2.28
(0.64–87.73) | |
| PR status | | 0.033a | | 0.429 | | 0.928 |
| Negative | 17.43
(6.45–55.78) | | 12.80
(4.30–58.90) | | 2.30
(0.78–35.56) | |
| Positive | 12.75
(4.93–132.66) | | 13.45
(4.50–97.70) | | 2.28
(0.64–309.2) | |
| HER-2 status | | 0.696 | | 0.026a | | 0.621 |
| 0 | 16.11
(7.25–132.66) | | 12.6
(4.30–97.70) | | 2.27
(0.64–87.73) | |
| 1 | 15.56
(4.93–55.78) | | 15.65
(5.70–61.60) | | 2.44
(0.95–309.2) | |
| P53 status | | 0.656 | | 0.172 | | 0.850 |
| Negative | 16.22
(7.25–55.78) | | 12.80
(4.30–97.70) | | 2.26
(0.64–309.20) | |
| Positive | 15.56
(4.93–132.66) | | 14.45
(4.60–61.60) | | 2.33
(0.73–82.76) | |
| EGFR status | | 0.717 | | 0.376 | | 0.609 |
| Negative | 15.38
(4.93–132.66) | | 13.70
(4.5–97.7) | | 2.51
(0.64–309.20) | |
| Positive | 17.43
(6.45–41.24) | | 13.10
(4.3–24.8) | | 2.61
(0.99–7.46) | |
| Ki67 status | | 0.167 | | 0.471 | | 0.366 |
| Negative | 14.88
(5.26–132.66) | | 12.80
(4.30–97.70) | | 2.26
(0.64–309.20) | |
| Positive | 17.65
(4.93–55.78) | | 14.80
(6.00–61.60) | | 2.57
(0.78–35.56) | |
| BCL2 status | | 0.443 | | 0.247 | | 0.095 |
| Negative | 16.77
(6.45–132.66) | | 12.85
(4.3–58.9) | | 2.9
(0.89–82.76) | |
| Positive | 15.22
(4.93–46.95) | | 13.8
(5.6–61.6) | | 2.225
(0.64–309.2) | |
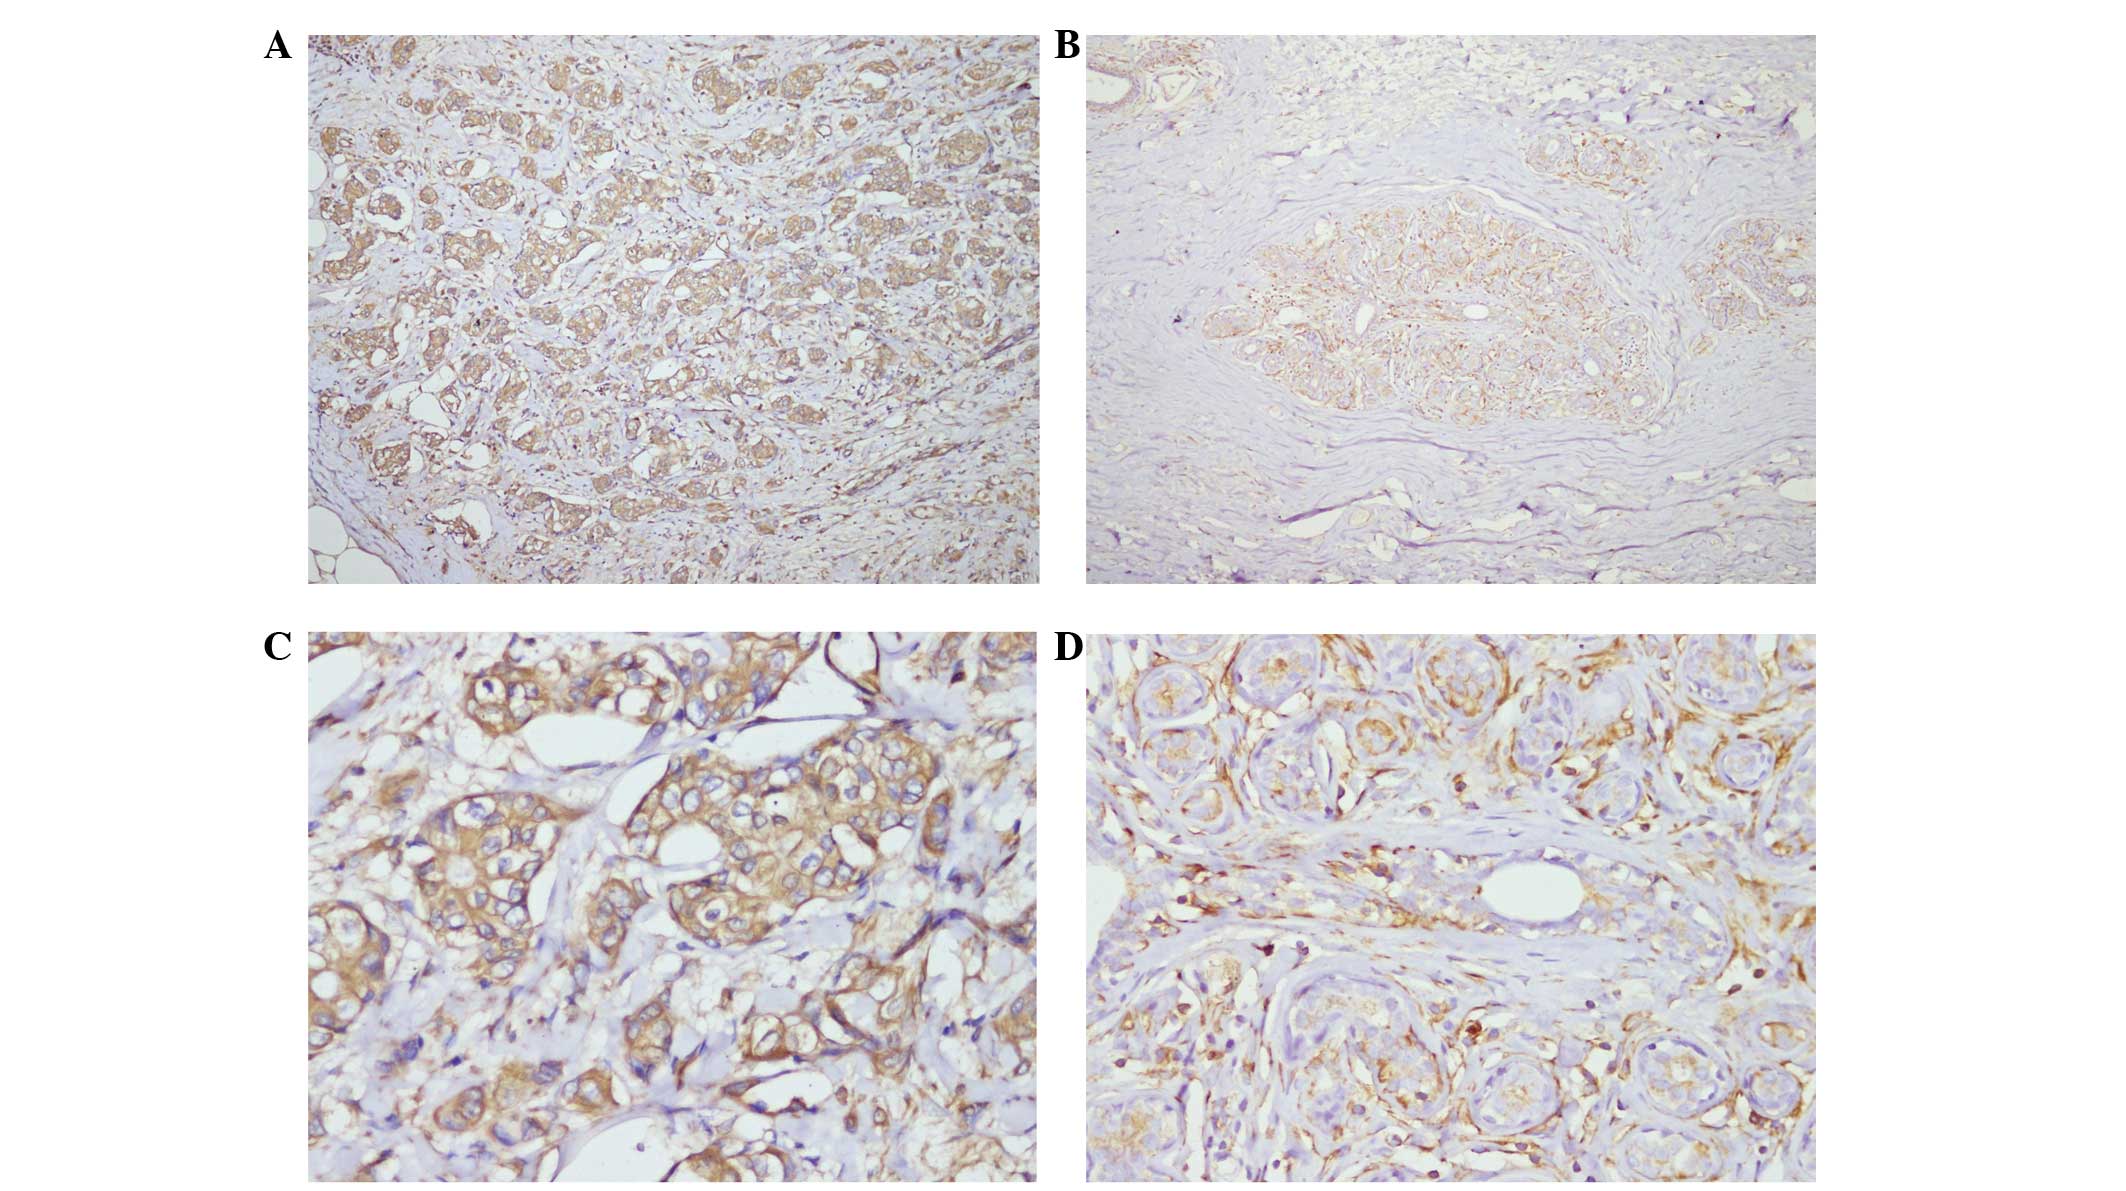
Upregulation of calponin-h2 in human
breast cancer tissues
The present study subsequently analyzed tissue
expression levels of calponin-h2 in 12 normal breast epithelia and
12 invasive ductal carcinoma samples using immunohistochemistry.
The results demonstrated that the breast cancer group exhibited a
significantly higher rate of upregulated expression of calponin-h2,
compared with the control group, at 66.7 (8/12) and 16.7%(2/12),
respectively (P=0.036; Table
III). It is noteworthy that calponin-h2 was located
predominantly in the cytomembrane of the breast cancer tissues
(Fig. 3).
| Table IIIProportion of low and high expression
levels of calponin-h2 in breast cancer and healthy control tissue
samples. |
Table III
Proportion of low and high expression
levels of calponin-h2 in breast cancer and healthy control tissue
samples.
| Group | Sample (n) | Expression level of
calponin-h2 [n (%)]
| P-value |
|---|
| Low (%) | High (%) |
|---|
| Invasive ductal
carcinoma | 12 | 4 (33.3) | 8 (66.7) | 0.036a |
| Healthy
control | 12 | 10 (83.3) | 2 (16.7) |
Discussion
In the last few decades, the incidence of breast
cancer has increased, however the relative survival rates of breast
cancer have improved, due to early diagnosis and treatment of
primary and second breast cancer (3). Early detection is vital to improve
the prognosis of patients with cancer (14,15).
Although current breast cancer screening methods have contributed
substantially to the reduction in breast cancer mortality rates, it
is limited due to low specificity. Therefore, more specific
non-invasive methods are urgently required, and plasma markers may
offer a better alternative option.
Changes in the structure or components of NMPs may
be an ideal marker for cancer diagnosis and prognosis (8,16).
Debald et al (9) found that
the calponin-h2 NMP was upregulated in human breast cancer tissue
and absent in healthy and benign control tissues. As NMPs can be
released into plasma, the present study comparatively analyzed the
plasma levels of calponin-h2 in patients with breast cancer,
patients with benign breast disease and healthy controls, and found
that plasma levels of calponin-h2 were higher in breast cancer than
in benign breast disease, but not healthy controls. The AUC of the
level of calponin-h2 of calponin-h2 levels in differentiating
breast cancer and benign breast diseases (0.700; 0.734–0.868;
P=0.0001) was higher than that of CA15-3, and lower than that of
CEA (Fig. 2). It has been proposed
that a combination of multiple markers improves the capacity to
diagnose cancer, as single markers have a low capacity in the
diagnosis of breast cancer. The present results demonstrated that a
combination of the three markers was able to improve the diagnosis
capacity.
The present study also analyzed the association
between plasma levels of CEA, CA15-3 and calponin-h2, and the
clinicopathological parameters of breast cancer. The plasma level
of calponin-h2 was not associated with tumor stage or grade, tumor
size, lymph and distant metastasis, ER, HER-2, Ki-67 or P53
(Table II). Notably, the plasma
level of calponin-h2 was associated with the expression of PR and
the age of the patient with breast cancer. The present study also
demonstrated a the positive correlation between plasma CEA and the
stage of breast cancer. Previous larger population studies
indicated that higher preoperative levels of CA15-3 and CEA were
significantly associated with a larger tumor size, axillary node
metastases and advanced stage (17). The difference in these results to
those of the present study may be linked to the smaller sample size
in the present study. Therefore, the roles of plasma calponin-h2 in
breast cancer diagnosis and its association with the
clinicopathological parameters of breast cancer require further
investigation.
The present study also compared the expression of
calponin-h2 in breast cancer tissue and normal breast epithelium
using immunohistochemistry, and found that calponin-h2 was
significantly overexpressed in breast cancer tissue, compared with
normal breast tissues, particularly in the cytomembrane of the
breast cancer cells. Debald M et al (9) reported, via one-dimensional
immuniblotting, that calponin-h2 is expressed in the NMP- fraction
of histologically different human breast cancer entities (ductal,
lobular and mucinous) and breast cancer lines, but not in the NMP-
fraction of healthy human breast tissue and cytoplasmic proteins of
breast cancer. Congruously, the present study revealed no
expression of calponin-h2 in the cytoplasmic fraction of human
breast cancer tissues. Calponin-h2 is also overexpressed in human
rectal carcinoma and cutaneous squamous cell carcinoma, indicating
that the overexpression of calponin-h2 is involved in the
pathogenesis of several types of cancer, although its function
remains to be elucidated (18,19).
In conclusion, the results of the present study
indicated that calponin-h2 was upregulated in the tissue and plasma
of patients with breast cancer, and may be a promising marker of
breast cancer. The involvement and underlying mechanisms of
calponin-h2 in carcinogenesis require further investigation.
Acknowledgments
The authors would like to thank all the patients
involved. This study was partially supported by the Guangzhou
Medical College Science Foundation Program (grant. no.
2012A08).
References
|
1
|
Benson JR and Jatoi I: The global breast
cancer burden. Future Oncol. 8:697–702. 2012. View Article : Google Scholar : PubMed/NCBI
|
|
2
|
Chen WQ, Zhang SW, Zou XN and Zhao P:
Cancer incidence and mortality in china, 2006. Chin J Cancer Res.
23:3–9. 2011. View Article : Google Scholar : PubMed/NCBI
|
|
3
|
Coleman MP, Forman D, Bryant H, et al:
Cancer survival in Australia, Canada, Denmark, Norway, Sweden and
the UK, 1995–2007 (the International Cancer Benchmarking
Partnership): an analysis of population-based cancer registry data.
Lancet. 377:127–138. 2011. View Article : Google Scholar :
|
|
4
|
Chérel P, Hagay C, Benaim B, et al:
Mammographic evaluation of dense breasts: techniques and limits. J
Radiol. 89:1156–1168. 2008.In French. View Article : Google Scholar
|
|
5
|
Safi F, Kohler I, Rottinger E, Suhr P and
Beger HG: Comparison of CA15-3 and CEA in diagnosis and monitoring
of breast cancer. Int J Biol Markers. 4:207–214. 1989.PubMed/NCBI
|
|
6
|
Miller TE, Beausang LA, Winchell LF and
Lidgard GP: Detection of nuclear matrix proteins in serum from
cancer patients. Cancer Res. 52:422–427. 1992.PubMed/NCBI
|
|
7
|
Leman ES and Getzenberg RH: Nuclear
structure as a source of cancer specific biomarkers. J Cell
Biochem. 104:1988–1993. 2008. View Article : Google Scholar
|
|
8
|
Higgins G, Roper KM, Watson IJ, et al:
Variant Ciz1 is a circulating biomarker for early-stage lung
cancer. Proc Natl Acad Sci USA. 109:E3128–E3135. 2012. View Article : Google Scholar : PubMed/NCBI
|
|
9
|
Debald M, Franken S, Heukamp LC, et al:
Identification of specific nuclear structural protein alterations
in human breast cancer. J Cell Biochem. 112:3176–3184. 2011.
View Article : Google Scholar : PubMed/NCBI
|
|
10
|
Wu KC and Jin JP: Calponin in non-muscle
cells. Cell Biochem Biophys. 52:139–148. 2008. View Article : Google Scholar : PubMed/NCBI
|
|
11
|
Hossain MM, Hwang DY, Huang QQ, Sasaki Y
and Jin JP: Developmentally regulated expression of calponin
isoforms and the effect of h2-calponin on cell proliferation. Am J
Physiol Cell Physiol. 284:C156–C167. 2003. View Article : Google Scholar
|
|
12
|
Huang QQ, Hossain MM, Wu K, Parai K, Pope
RM and Jin JP: Role of H2-calponin in regulating macrophage
motility and phagocytosis. J Biol Chem. 283:25887–25899. 2008.
View Article : Google Scholar : PubMed/NCBI
|
|
13
|
Ulmer B, Hagenlocher C, Schmalholz S, et
al: Calponin 2 acts as an effector of noncanonical Wnt-mediated
cell polarization during neural crest cell migration. Cell Rep.
3:615–621. 2013. View Article : Google Scholar : PubMed/NCBI
|
|
14
|
Walters S, Maringe C, Butler J, et al:
Breast cancer survival and stage at diagnosis in Australia, Canada,
Denmark, Norway, Sweden and the UK, 2000–2007: a population-based
study. Br J Cancer. 108:1195–1208. 2013. View Article : Google Scholar : PubMed/NCBI
|
|
15
|
Houssami N, Ciatto S, Martinelli F,
Bonardi R and Duffy SW: Early detection of second breast cancers
improves prognosis in breast cancer survivors. Ann Oncol.
20:1505–1510. 2009. View Article : Google Scholar : PubMed/NCBI
|
|
16
|
Santoni M, Catanzariti F, Minardi D, et
al: Pathogenic and Diagnostic Potential of BLCA-1 and BLCA-4
Nuclear Proteins in Urothelial Cell Carcinoma of Human Bladder. Adv
Urol. 2012:3974122012. View Article : Google Scholar : PubMed/NCBI
|
|
17
|
Lee JS, Park S, Park JM, Cho JH, Kim SI
and Park BW: Elevated levels of preoperative CA15-3 and CEA serum
levels have independently poor prognostic significance in breast
cancer. Ann Oncol. 24:1225–1231. 2013. View Article : Google Scholar
|
|
18
|
Choi SY, Jang JH and Kim KR: Analysis of
differentially expressed genes in human rectal carcinoma using
suppression subtractive hybridization. Clin Exp Med. 11:219–226.
2011. View Article : Google Scholar : PubMed/NCBI
|
|
19
|
Dang C, Gottschling M, Manning K, et al:
Identification of dysregulated genes in cutaneous squamous cell
carcinoma. Oncol Rep. 16:513–519. 2006.PubMed/NCBI
|