Introduction
Sonodynamic therapy (SDT), using low-intensity
ultrasound combined with a sonosensitizer, is a promising approach
to cancer therapy, which has rapid progressed in previous years
(1,2). In vitro and in vivo
experiments have demonstrated that SDT can effectively inhibit
several types of cancer cells (3–7).
5-Aminolevulinic acid (5-ALA) itself is not a sonosensitizer,
however, it is the prodrug of protoporphyrin IX (PpIX). PpIX is a
sonosensitizer, which preferentially accumulates in tumor cells,
but not in normal tissues (8) due
to an imbalance of porphobilinogen deaminase activity and thus
ferrochelatase activity in neoplastic tissues (9,10).
Schick et al (11) and Wyld
et al (12) reported that,
compared with resting cells, proliferating cells generate more PpIX
following incubation with 5-ALA. Thus, 5-ALA may produce different
quantities of PpIX in different cell cycle phases, leading to
differential sensitivity to 5-ALA-SDT. Therefore, the presents
study hypothesized that susceptibility to SDT is likely to be
associated with certain phases of the cell cycle of tumor
cells.
Previous studies have suggested that the antitumor
effects of several cancer therapeutic approaches are associated
with the phase of the cell cycle (13–16).
Certain appropriate chemotherapeutic agents, which induce cell
cycle arrest at the S phase or G2/M phase increase the
overall viral replication and then potentiate viral oncolysis
(15,17,18).
In human myeloma cell lines, the cytotoxicity induced by
bortezomib, is markedly amplified in synchronous S phase entry and
progression (16). Thus, the phase
of the cell cycle can affect tumor sensitivity to anticancer
treatments.
At present, the mechanisms underlying SDT-induced
cancer cell death remain to be fully elucidated. Few studies have
investigated the association between cell cycle phase and the
effect of SDT on tumor cells. Our previous investigations
demonstrated the effects of 5-ALA-induced SDT on human tongue
squamous carcinoma (19,20). The present study aimed to
investigate the production of PpIX in different phases of the cell
cycle and the effects of these phases on the susceptibility of the
cells to SDT-induced cell death. The differential expression of
apoptosis-associated factors and enrichment of cyclins in certain
cell cycle phases were also examined. Determination of the likely
underlying mechanism may provide a theoretical basis for optimizing
the application of SDT in oncology.
Materials and methods
Cell culture
The human tongue cancer SAS cell line was obtained
from the Human Science Research Resources Bank (Osaka, Japan). The
SAS cells were cultured in Roswell Park Memorial Institute
(RPMI)-1640 medium (GE Healthcare, Logan, UT, USA) at 37°C and 5%
CO2. The RPMI 1640 medium was supplemented with 10%
heat-inactivated fetal bovine serum (FBS; GE Healthcare), 100 U/ml
penicillin and 100 μg/ml streptomycin (GE Healthcare).
Cell cycle synchronization
To synchronize the cells to the
G0/G1 phase, the SAS cells were arrested by
serum starvation (21). The
exponentially growing cells (1×10⁶ cells) were plated
onto dishes containing RPMI-1640 without FBS, and incubated at 37°C
for 48 h prior to harvesting. The SAS cells were synchronized to
the S phase using Banfalvi’s double thymidine block method
(22). The exponentially growing
cells were incubated at 37°C with 2 mM thymidine (Sigma-Aldrich,
St. Louis, MO, USA) for 21 h, washed with PBS (Hyclone, Logan City,
UT, USA) and placed in fresh RPMI-1640 medium with 10% FBS for 18
h. Subsequently, the cells were retreated with 2 mM thymidine for
21 h. Following release from the second inhibition at 37°C for 2 h,
the cells were synchronized to the S phase. To arrest the cells at
the G2/M junction, the SAS cells were incubated at 37°C
with 100 ng/ml nocodazole (Sigma-Aldrich) for 20 h, washed twice
with PBS, resuspended in fresh RPMI-1640 medium with 10% FBS for 1
h and harvested. Following synchronization to the G1, S
and G2/M phases, the cells from each phase were allowed
to grow in RPMI-1640 medium with 10% FBS. The present study used
cells that were normal cycling (N), G1-phase (G1), S-phase (S) and
G2/M-phase (G2/M) cells. The cells were sampled after 0, 1, 2, 3
and 4 h, following which flow cytometry analysis was performed to
assess cell cycle duration.
Flow cytometric analysis of DNA
content
Following cell cycle synchronization, the cells
(1×10⁶) were harvested by trypsinization (0.25% trypsin;
Hyclone) and washed twice in cold phosphate-buffered saline (PBS).
The cells were fixed in 70% ethanol (Luck Mouse, Changzhou, China)
and stored at 4°C overnight. The fixed cells were resuspended in
PBS containing 2.5 mg/ml RNase A (Sigma-Aldrich) and 1 mg/ml
propidium iodide (Sigma-Aldrich), and incubated for 30 min at 37°C.
Following filtration through a nylon mesh (300 mesh; Yuexing,
Guangzhou, China), the cells were evaluated using flow cytometry
(FACSCalibur; BD Biosciences, Franklin Lakes, NJ, USA), and the
results were analyzed using ModFit LT version 4.0 software (Verity
Software House, Topsham, ME, USA).
PpIX determination
The SpectraMax 5 microplate reader (Molecular
Devices, Sunnyvale, CA, USA) was selected to detect the production
of 5-ALA-induced PpIX in the SAS cells (excitation, 405 nm;
emission, 590 nm). The correlation between the fluorescence
intensity of the samples and the exogenous PpIX concentrations were
assessed, following which a standard curve of PpIX was constructed
using SPSS 13.0 softward (SPSS, Inc., Chicago, IL, USA). The SAS
cells were seeded into a 96-well plate (2×10⁴
cells/well) and cultivated for 24 h in RPMI-1640 medium. At the
time-points corresponding to each phase of the cell cycle following
synchronization, as described above, the cells were incubated with
1 mM 5-ALA in RPMI-1640 medium for 2 h in the dark at 37°C. The
cells were then washed three times with PBS and the concentrations
of PpIX in the cells in each cell cycle phase were determined using
the microplate reader. The fluorescence intensity indicated the
level of intracellular PpIX.
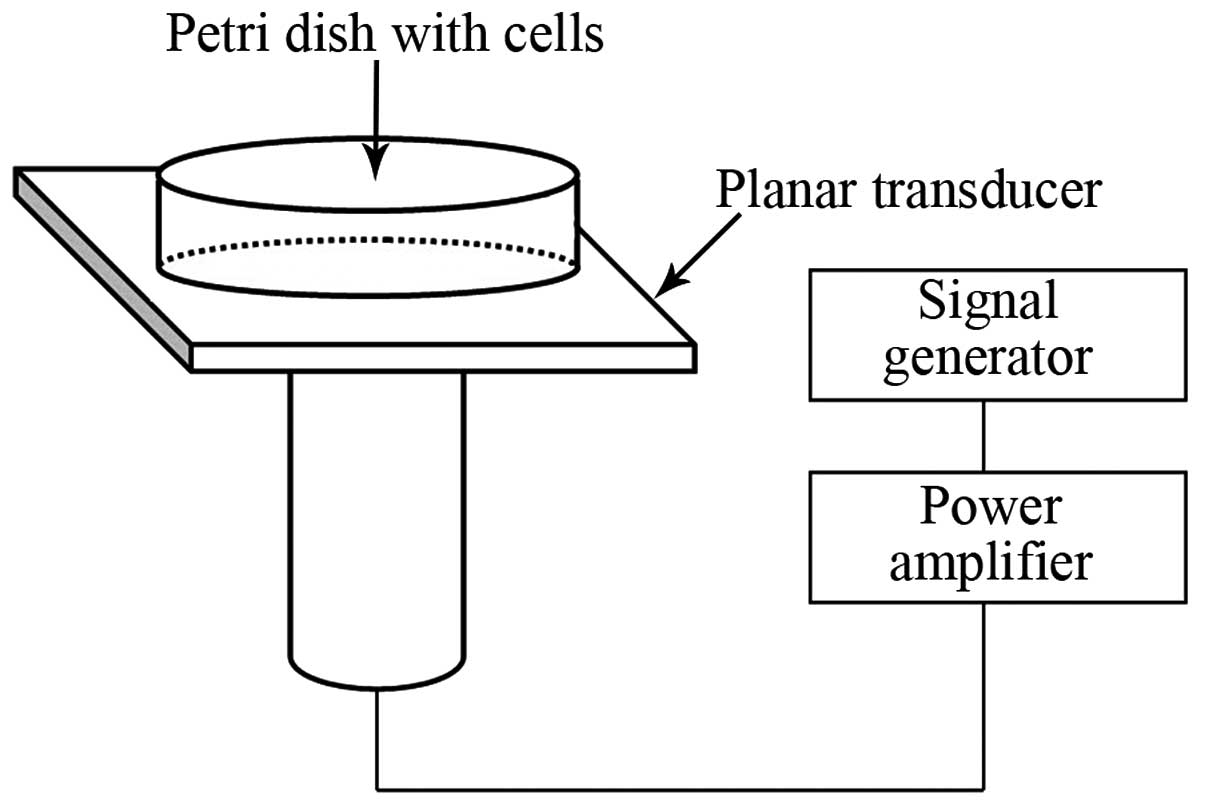
Ultrasonic device
Following synchronization, the cells treated with
SDT (Harbin Institute of Technology, Harbin, China) were incubated
with 1 mM 5-ALA in the dark for 2 h at 37°C. The ultrasound
treatment system used in the present study, as shown in Fig.1, was designed and manufactured by
the Harbin Institute of Technology (Harbin, China). This ultrasonic
device has been described in a previous publication (23). A 3.5 cm petri dish containing the
cultured cells was placed in center of the transducer. The cells
were exposed to ultrasound (1.0 MHz; 0.05 W/cm2; 10%
duty cycle) for varying durations (1, 2 and 3 min), in the dark.
Following treatment, the cells were either harvested or incubated
continuously for subsequent analyses.
Cell survival assays
Following treatment with SDT, the cells were
harvested and reseeded into 96-well plates at a density of
1×10⁴ cells/well for 24 h. The cell viability was
subsequently determined using a Cell Counting kit (CCK)-8 (Beyotime
Institute of Biotechnology, Nantong, China), according to the
manufacturer’s instructions. The absorbance value (AV) was measured
at 450 nm using a SpectraMax 5 microplate reader. The absorbance
data were expressed as the percentage survival, which were
corrected for background and compared with the controls using the
following formula: AV of test well / AV of control well × 100%.
Analysis of cell apoptosis
The cells of all the groups were harvested by
trypsinization without EDTA and were washed three times with
pre-cooled PBS. Apoptosis was detected using an Annexin V-Propidium
Iodide (PI) Apoptosis Detection kit (Biosea Biotechnology, Beijing,
China), according to the manufacturer’s instructions. The cells
were re-suspended in 200 μl binding buffer (Biosea
Biotechnology, Beijing, China) and stained with annexin V (10
μl) and PI (5 μl) sequentially. Following incubation
at 4°C for 30 min in the dark, the cells were counted using flow
cytometry on a FACSCalibur flow cytometer.
Immunoblotting
The cells were lysed in radioimmunopre-cipitation
buffer for protein extraction. Equal concentrations (50 μg)
of protein from each sample were resolved on 10%
polyacrylamide-sodium dodecyl sulfate gels (Beyotime Institute of
Biotechnology Co., Ltd., Nantong, China) and electrophoretically
transferred to polyvinylidene difluoride membranes (Beyotime
Institute of Biotechnology Co., Ltd.). The membranes were blocked
using non-fat dried milk (Wandashan, Harbin, China) for 1 h;
incubated overnight at 4°C with antibodies against human cyclin A
(cat.no. sc-751), B-cell lymphoma (Bcl)-2 (cat.no. sc-492),
caspase-3 (cat.no. sc-7148) and β-actin (cat.no. sc-130619; all
rabbit polyclonal antibodies used at 1:200 from Santa Cruz
Biotechnology Inc., Santa Cruz, CA, USA); and subsequently
incubated for 2 h at 4°C with an horseradish peroxidase-conjugated
goat anti-rabbit immunoglobulin G secondary antibody (1:5,000; cat.
no. ZDR-5306; ZSGB-BIO, Beijing, China). The immunoreactive
proteins were visualized, and the protein levels were normalized
with respect to the band density of β-actin as an internal control.
The protein bands were detected using an image analyzer (Quantity
One; Bio-Rad Laboratories, Inc., Hercules, CA, USA) and an
enzymatic chemilluminescence kit (Beyotime Institute of
Biotechnology, Nantong, China).
Statistical analysis
All data are presented as the mean ± standard
deviation. The differences between groups were analyzed using
Student’s t-test. Statistical differences were evaluated using SPSS
13.0 software (SPSS, Inc., Chicago, IL, USA). P<0.05 was
considered to indicate a statistically significant difference.
Results
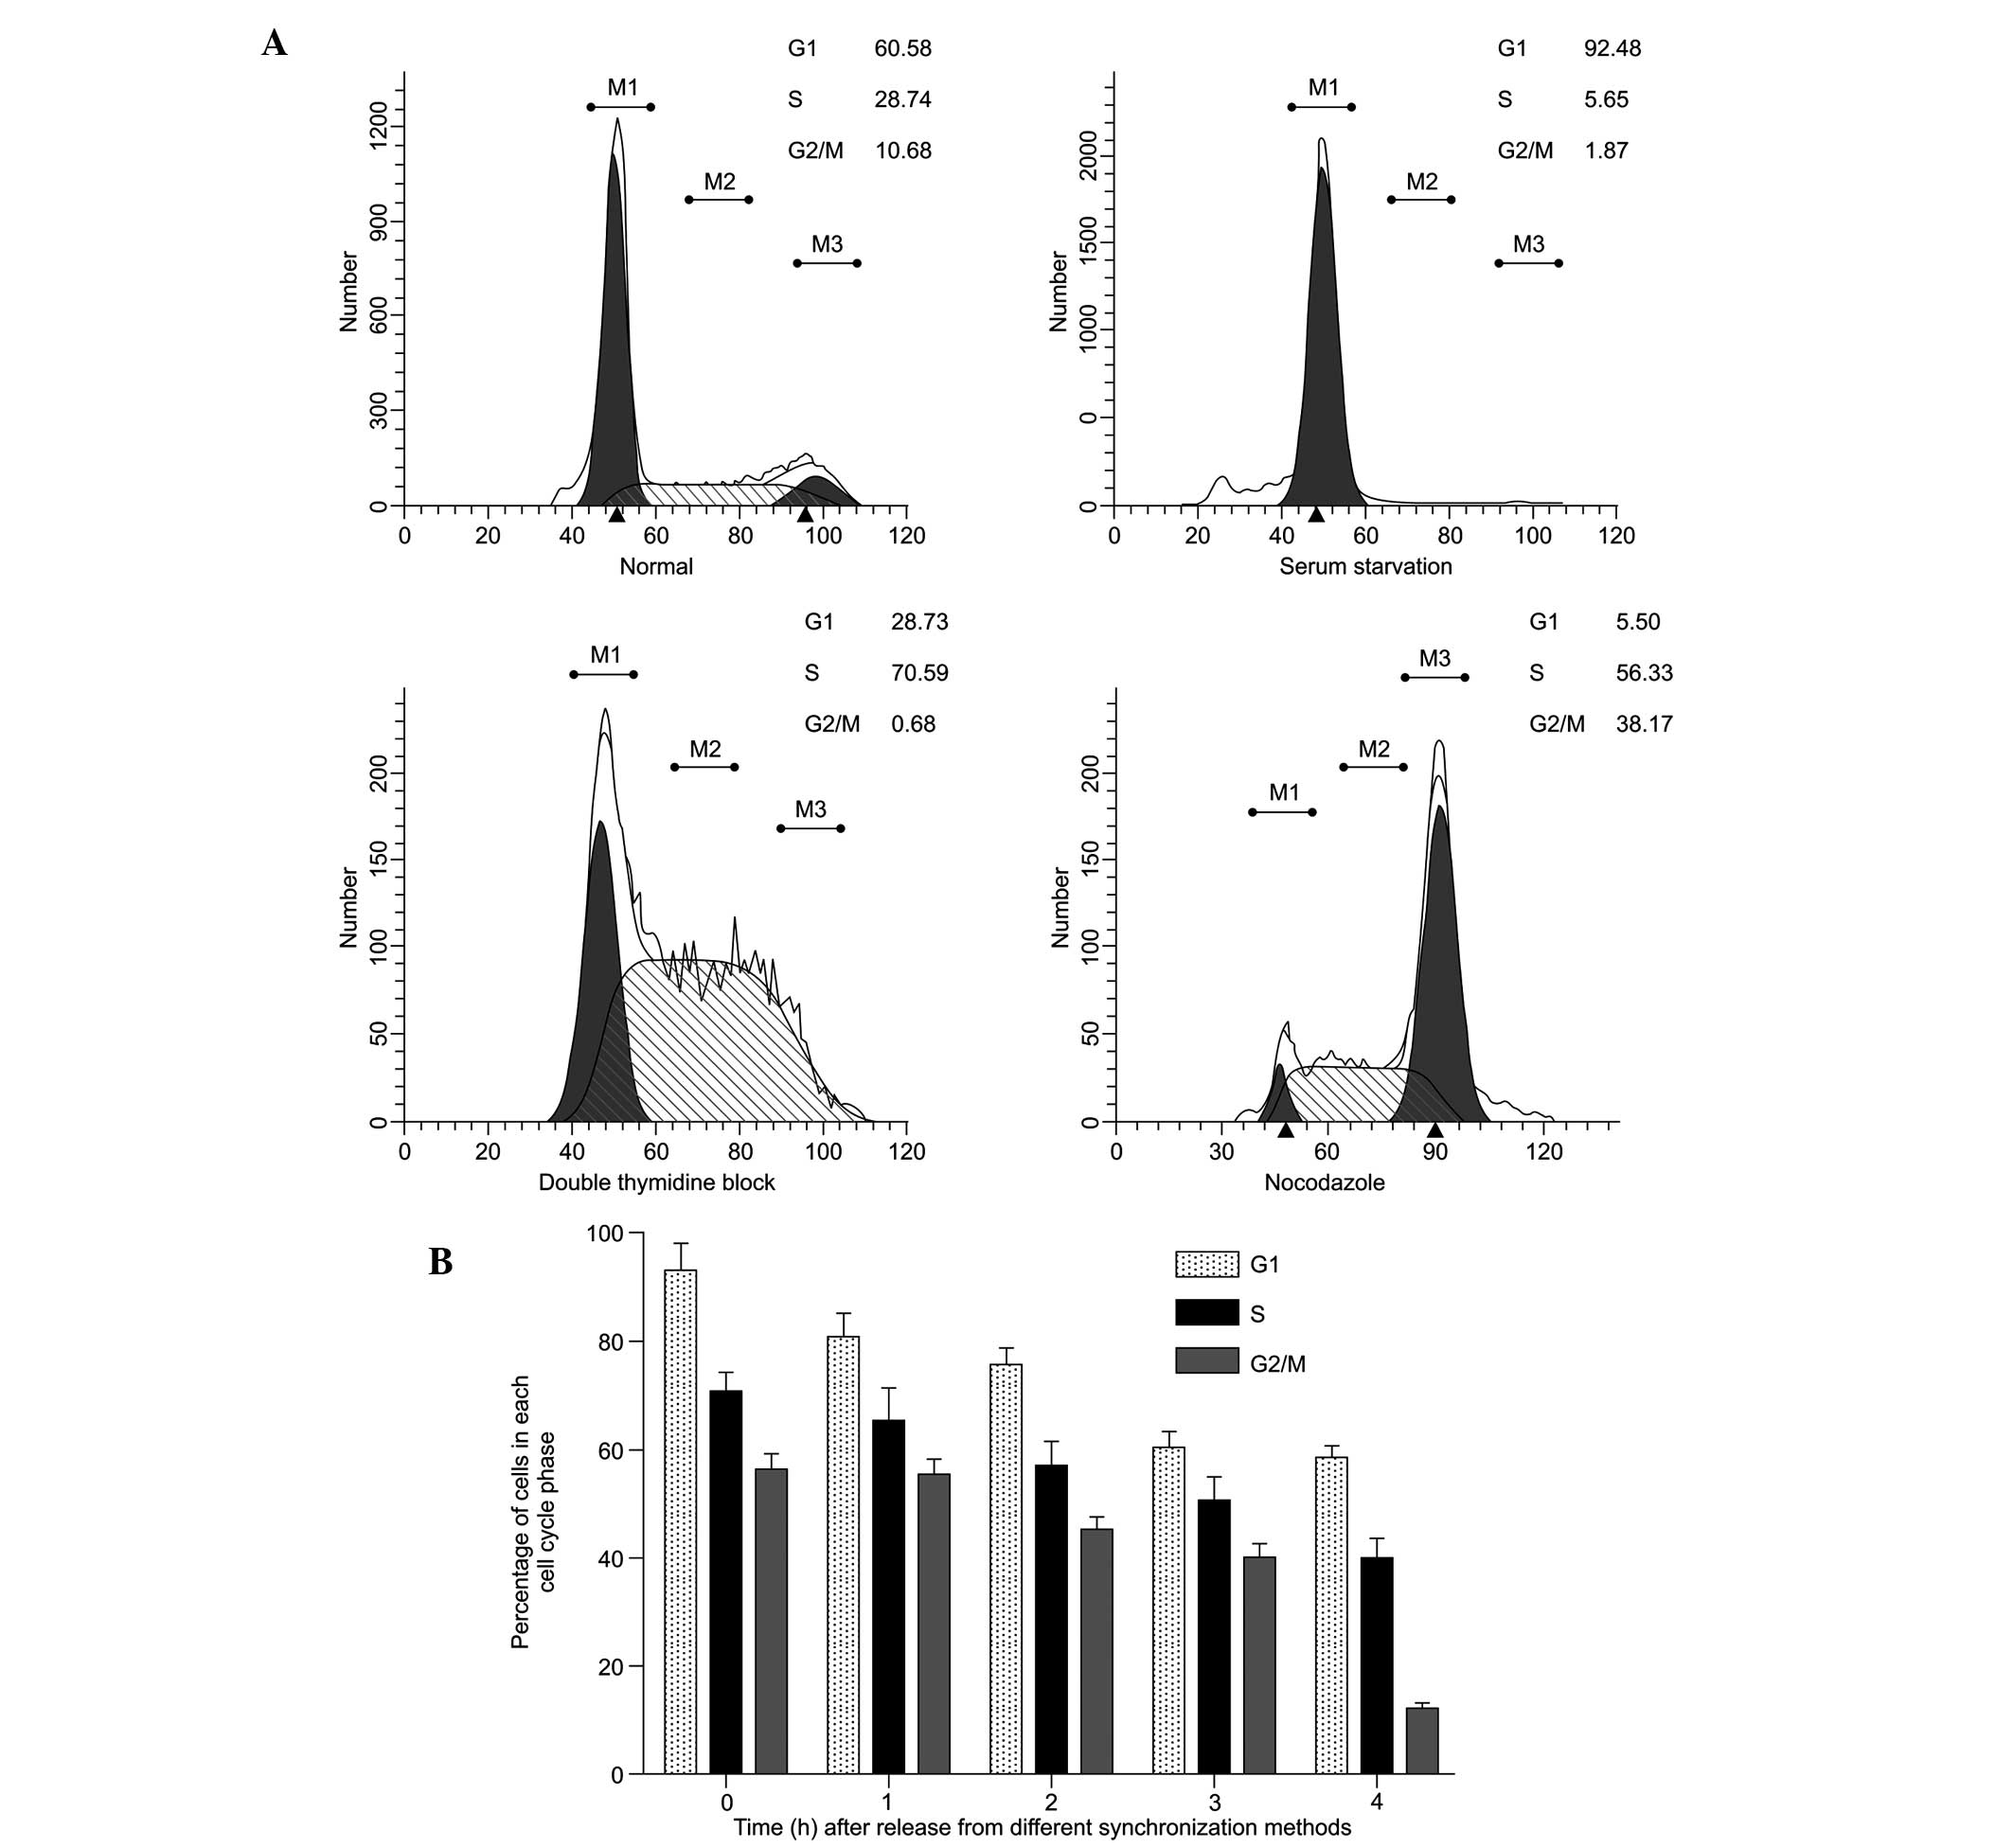
Synchronization effect and DNA content in
different phases of the cell cycle
Figure 2A shows a
histogram of the cell cycle based on flow cytometric analysis of
the SAS cells following treatment with various synchronization
methods. A single-parameter histogram of DNA enables discrimination
of cell populations existing in the G0/G1 (2C
DNA), S (between 2C and 4C) and G2/M (4C) phases of the
cell cycle. Based on these data, the synchronization performed in
the present study was successful. The percentages of cells in the
G0/G1, S and G2/M phases in the
normal SAS cells increased between 60.58±2.8, 28.74±1.1, and
10.68±0.9% and 92.48±9.4, 70.59±2.7 and 56.33±1.9%, respectively
(P<0.05). The durations of different phases of the cell cycle
were calculated 0, 1, 2, 3 and 4 h following release from the
different synchronization blocks (Fig.
2B). The percentage of cells in the G1- and S-phases remained
high between 0 and 4 h. The percentage of cells in the
G2/M phase decreased 4 h after release. These results
indicated that, following incubation with 5-ALA for 2 h following
phase synchronization, the cells remained within the limit of that
particular phase and did not transit to the next phase of the cell
cycle.
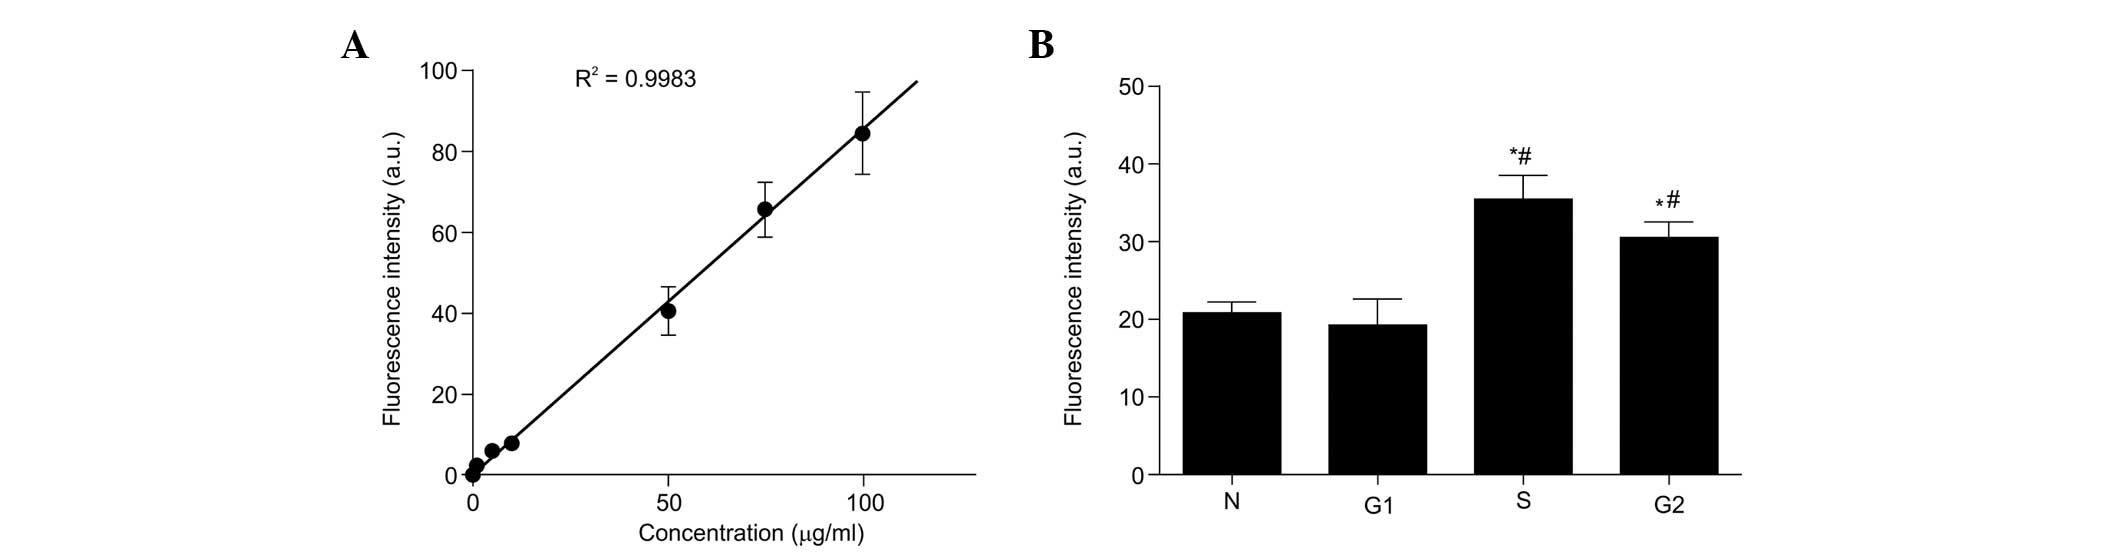
Production of PpIX in different cell
cycle phases
A standard curve was plotted, according to the
fluorescence intensity of a known gradient concentration of
exogenous PpIX (Fig. 3A). A
positive linear correlation was observed between the fluorescence
intensity and the concentrations of PpIX in the liquid phantom
(correlation index R2=0.9983). Therefore, the
fluorescence intensity was indicative of the level of 5-ALA-induced
PpIX in each phase of the cell cycle. Subsequently, the present
study investigated the production of PpIX from synchronized cells
treated with 5-ALA for 2 h. As shown in Fig. 3B, 5-ALA administration yielded significantly
higher PpIX fluorescence intensities in the S and G2/M
phases, compared with the normal cycling cells and G1
cells (P<0.05). These results suggested that the production of
PpIX from exogenous 5-ALA was higher in the S- and G2/M
phase compared with the G1 phase cells. Thus, it was
hypothesized that the increase in cell death was, at least in part,
due to an increase in the production of PpIX compared with that of
normal cycling cells and G1-phase cells.
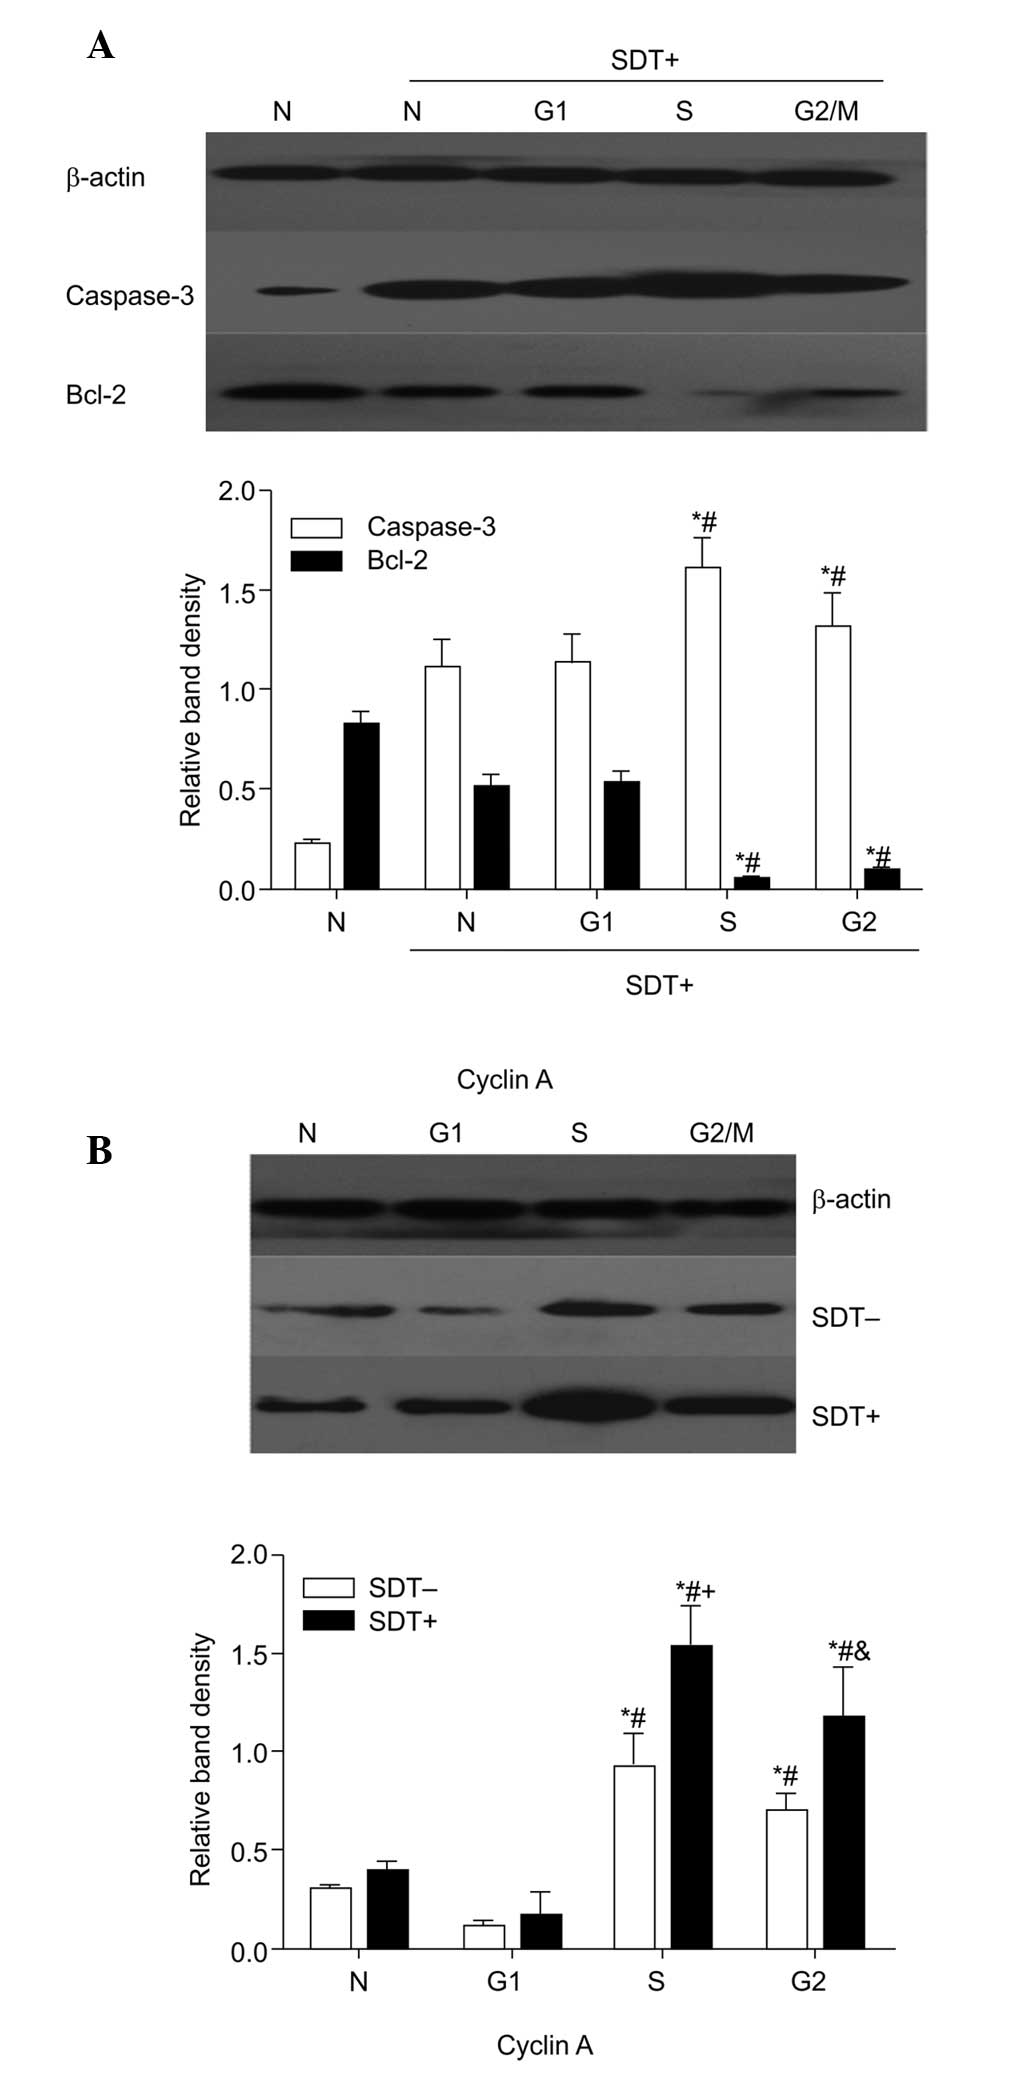 | Figure 5Effect of cell cycle on the
expression levels of caspase-3 and Bcl-2 and cyclin A following SDT
treatment. Data are presented as the mean ± standard deviation. (A)
Cells in each cell cycle group were lysed and subjected to western
blot analyses to determine the expression of caspase-3 and Bcl-2
(n=6). ; *P<0.05, vs. N + SDT group;
#P<0.05, vs. G1-phase + SDT group. (B) Expression
levels of cyclin A were examined using western blot analysis prior
to and following SDT treatment in four groups (n=6)..
*P<0.05, vs. N group; #P<0.05, vs.
G1-phase group;.+P<0.05, vs. S + SDT-,
&P<0.05, vs. G2/M + SDT-. SDT,
sonodynamic therapy; Bcl-2, B-cell lymphoma 2; SDT-, no SDT; SDT+,
1 min SDT; N, normal cycling. |
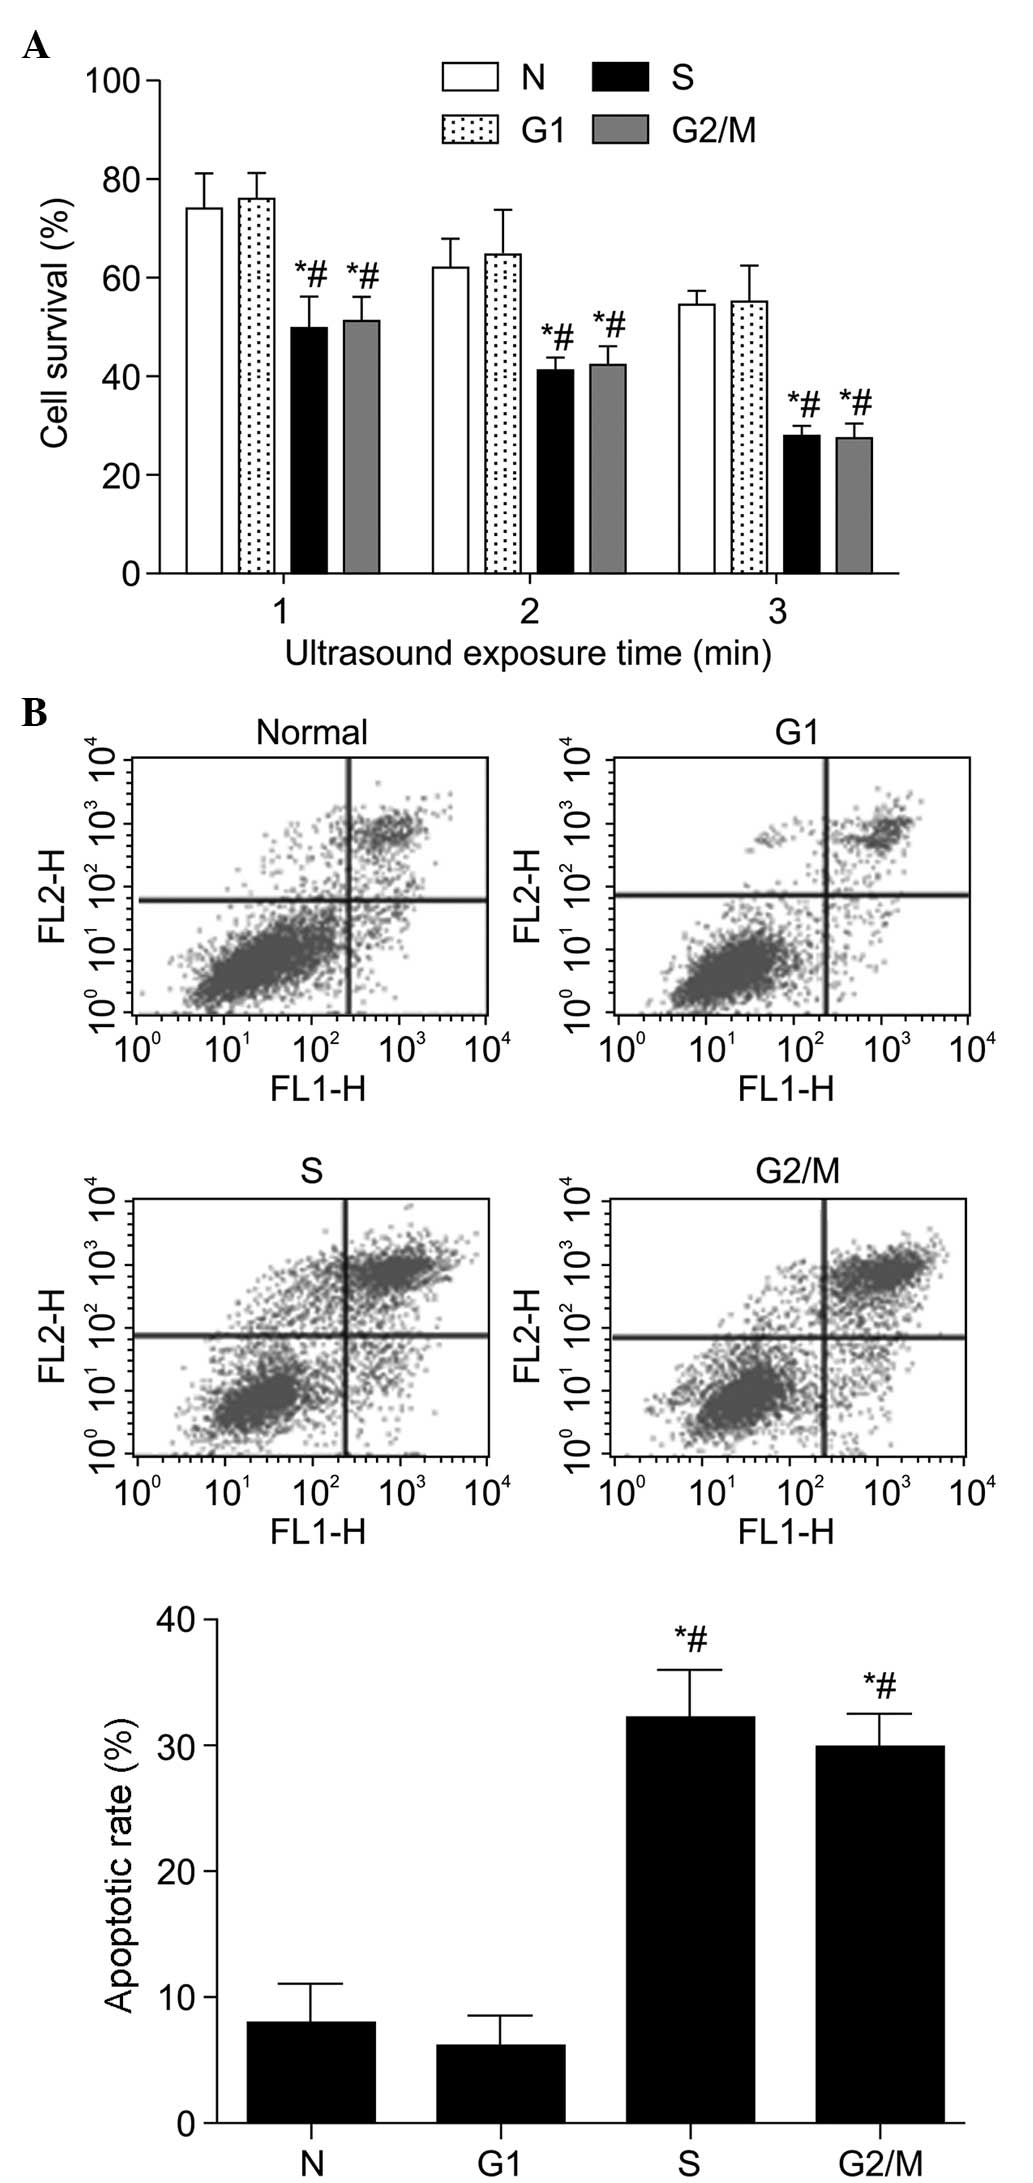
Cell survival and apoptosis in different
phases of the cell cycle following SDT
The CCK8 assay revealed that, following SDT, the
cell viability was higher in the asynchronous cells and G1 cells
compared with that in the S-phase and G2/M-phase cells
(P<0.05; Fig. 4A). The
sensitivity of S and G2/M cells to SDT increased
markedly as the duration of sonication increased between 1 and 3
min. The apoptotic rates of the cells were almost identical in the
normal cycling cells and G1 cells following SDT
treatment (Fig. 4B). However, the
cells in the S and G2/M phases exhibited a significantly
higher apoptotic rate, compared with the other groups (P<0.05).
Specifically, there was a 20.91% increase in apoptotic rate in the
S-phase cells, compared with the unsynchronized cells.
Effect of cell cycle on apoptotic
cytokines and cyclin A in SDT treatment
The results of the western blot analysis (Fig. 5), demonstrated that caspase-3 was
significantly increased in the cells in the S and G2/M
phases following SDT treatment (P<0.05), with the opposite
change in Bcl-2 (P<0.05). The expression of cyclin A also peaked
in the cells in the S and G2/M phases (P<0.05). SDT
caused a significant upregulation of cyclin A in all groups,
however this was most marked in the S-phase and
G2/M-phase cells. Cyclin A may have promoted SDT-induced
caspase-3 and inhibited Bcl-2, which may be another contributor to
the enhanced SDT-induced apoptosis in cells in the S and
G2/M phases.
Discussion
Cell cycle synchronization is a well-established
technique to augment the efficacy of conventional cytotoxic
anticancer therapy (24). The
metabolic activity of a cell and the activity of cellular enzymes
can vary with the phase of the cell cycle (12,13).
The effect of cancer treatment, including chemotherapy,
radiotherapy, photodynamic therapy (PTD) and oncolytic virus
therapy is associated with the cell cycle (13,15,16,25,26).
In the present study, the levels of 5-ALA-induced
PpIX were higher in the cells in the S and G2/M phases,
compared with those in the G1 phase and in the unsynchronized cells
(Fig. 2), similar to findings
reported by Wyld et al (13). Physiological processes, including
macromolecule synthesis, metabolism and DNA synthesis enzyme
activation are more active in the S and G2/M phases than
in other phases, which may be a major determinant of increased PpIX
production in these phases. The varying cell surface area in
different phases of the cell cycle has been considered to
contribute to the cell cycle-dependent uptake of a sonosensitizer
(14), however, the increase in
low-density lipoprotein receptors and tumor-specific glycoprotein
may also contribute (27).
Different levels of PpIX, produced from 5-ALA, may elicit differing
sensitivities to SDT in certain phases of the cell cycle.
In the present study, SAS cells were partially
synchronized in vitro using serum starvation, double
thymidine block and nocodazole to arrest the cells at the
G1, S and G2/M phases, respectively. The
subsequent analysis of the synchronized DNA content analyses
indicated a high level of synchronization and no damage to the
cells (Fig. 1). The rate of cell
survival following SDT treatment, following release from
synchronization, was measured. The CCK8 assays revealed that,
compared with the G1 phase and normal cycling SAS cells, the cells
in the S and G2/M phases were significantly more
sensitive to SDT following treatment with 5-ALA (Fig. 3). The susceptibility to SDT was
also positively correlated with the level of PpIX in the cells in
different phases. This variability in sensitivity to SDT with cell
cycle is in agreement with previous observations on the
susceptibility of cells to radiotherapy (28) and PDT with several
photosensitizers, including 5-ALA (13), photofrin II (26) and ATX-S10 (Na) (14).
In the present study, cancer cells with a high
percentage of cells in the S-phase or high proliferative activity
were more sensitive to SDT-induced apoptosis (Fig. 3B). The results revealed that the
levels of Bcl-2 and caspase-3 fluctuated in a cell cycle-dependent
manner. SDT treatment induced cells in the S and G2/M
phases to produce less Bcl-2 and more caspase-3 than the levels in
relative resting cells (Fig. 4A).
Caspase-3 is a critical effector in mediating several forms of
apoptosis, and our previous study demonstrated that SDT activates
caspase-3 to induce SAS cell apoptosis through the mitochondrial
signaling pathway (19). The level
of SDT-induced caspase-3 increased in the S and G2/M
phases, which may be due to these phases having a lower threshold
for caspase-3 activation (16).
Cell cycle protein regulation and the induction of
cell death may be closely associated, and these two events may
account for how the phase of the cell cycle affects tumor cell
sensitivity to SDT (29). Cyclin A
begins to accumulate during the S phase and maintains high levels
until metaphase (30). With the
exception of its functions in mitosis, cyclin A is involved in the
initiation and progression of DNA synthesis during the S phase
(31) and in the regulation of
apoptosis (32). The induction of
apoptosis is uniformly associated with the activation of cyclin A,
but not with cyclins E or B (33,34).
In addition, knockdown of the expression of cyclin A in K562 cells
suppresses doxorubicin-induced growth arrest and apop-tosis
(35). Therefore, the present
study investigated the role of cyclin A in the alteration in the
sensitivity of cells to SDT in different cell cycle phases. The
results confirmed that the protein expression levels of cyclin A
were higher in cells in the S and G2/M phases compared
with those in the G1-phase cells following synchronization, and SDT
caused a significant upregulation of cyclin A in all groups,
particularly the S and G2/M cells (Fig. 4B). The increased expression of
cyclin A has been previously observed to correlate well with the
activation of caspase-3 and increase in apoptotic rate (36,37),
in which the overexpression of cyclin A circumvents the
anti-apoptotic capacity of the Bcl-2 oncogene. Therefore, the
increase in cyclin A in cells in the S and G2/M phases
may also explain why cells in these phases exhibiter higher
apoptotic rates and sensitivity to SDT compared with those in the
G1 phase.
In conclusion, the present study demonstrated that
synchronizing SAS cells to the S or G2/M phase can
significantly enhance SDT-induced cell growth arrest and apoptosis.
This may be due to an increase in the production of PpIX in the S
and G2/M phases. In addition, increasing cyclin A in
cells in the S and G2/M phases may enhance the
sensitivity of the cells to SDT by inhibiting Bcl-2 and promoting
caspase-3. The results of the present study suggest the possibility
of combination therapy with SDT and chemotherapy. To enhance the
effect of SDT on cancer therapy and reduce tumor recurrence, a
tumor-cell synchronizing agent may be administered to induce the
cells into a more sensitive cell cycle phase prior to SDT
treatment.
Acknowledgments
The authors would like to thank Mr. Ming Fang
(Department of Anatomy, Basic Medical Science College, Harbin
Medical University, China), Mr. Chuanchuan Nan (Department of ICU,
The First Affiliated Hospital of Harbin Medical University, China),
Miss. Shan Wang and Miss. Xiuzi Gaozhong (Department of Anatomy,
Basic Medical Science College, Harbin Medical University, China)
for providing technical assistance.
References
|
1
|
Shibaguchi H, Tsuru H and Kuroki M:
Sonodynamic cancer therapy: a non-invasive and repeatable approach
using low-intensity ultrasound with a sonosensitizer. Anticancer
Res. 31:2425–2429. 2011.PubMed/NCBI
|
|
2
|
Rosenthal I, Sostaric JZ and Riesz P:
Sonodynamic therapy-a review of the synergistic effects of drugs
and ultrasound. Ultrason Sonochem. 11:349–363. 2004.PubMed/NCBI
|
|
3
|
Tsuru H, Shibaguchi H, Kuroki M and
Yamashita Y: Tumor growth inhibition by sonodynamic therapy using a
novel sonosensitizer. Free Radic Biol Med. 53:464–472. 2012.
View Article : Google Scholar : PubMed/NCBI
|
|
4
|
Yumita N, Okuyama N, Sasaki K and Umemura
S: Sonodynamic therapy on chemically induced mammary tumor:
pharmacokinetics, tissue distribution and sonody-namically induced
antitumor effect of gallium-porphyrin complex ATX-70. Cancer
Chemother Pharmacol. 60:891–897. 2007. View Article : Google Scholar : PubMed/NCBI
|
|
5
|
Komori C, Okada K, Kawamura K, Chida S and
Suzuki T: The sonodynamic antitumor effect of methylene blue on
sarcoma180 cells in vitro. Anticancer Res. 29:2411–2415.
2009.PubMed/NCBI
|
|
6
|
Liu Q, Li X, Xiao L, Wang P, Wang X and
Tang W: Sonodynamically induced antitumor effect of hematoporphyrin
on Hepatoma 22. Ultrason Sonochem. 15:943–948. 2008. View Article : Google Scholar : PubMed/NCBI
|
|
7
|
Ohmura T, Fukushima T, Shibaguchi H, et
al: Sonodynamic therapy with 5-aminolevulinic acid and focused
ultrasound for deep-seated intracranial glioma in rat. Anticancer
Res. 31:2527–2533. 2011.PubMed/NCBI
|
|
8
|
Peng Q, Berg K, Moan J, Kongshaug M and
Nesland JM: 5-Aminolevulinic acid-based photodynamic therapy:
principles and experimental research. Photochem Photobiol.
65:235–251. 1997. View Article : Google Scholar : PubMed/NCBI
|
|
9
|
Zenzen V and Zankl H: Protoporphyrin
IX-accumulation in human tumor cells following topical ALA- and
h-ALA-application in vivo. Cancer Lett. 202:35–42. 2003. View Article : Google Scholar : PubMed/NCBI
|
|
10
|
Wu SM, Ren QG, Zhou MO, Peng Q and Chen
JY: Protoporphyrin IX production and its photodynamic effects on
glioma cells, neuroblastoma cells and normal cerebellar granule
cells in vitro with 5-aminolevulinic acid and its hexylester.
Cancer Lett. 200:123–131. 2003. View Article : Google Scholar : PubMed/NCBI
|
|
11
|
Schick E, Kaufmann R, Ruck A, Hainzl A and
Boehncke WH: Influence of activation and differentiation of cells
on the effectiveness of photodynamic therapy. Acta Derm Venereol.
75:276–279. 1995.PubMed/NCBI
|
|
12
|
Wyld L, Burn JL, Reed MW and Brown NJ:
Factors affecting aminolaevulinic acid-induced generation of
protoporphyrin IX. Br J Cancer. 76:705–712. 1997. View Article : Google Scholar : PubMed/NCBI
|
|
13
|
Wyld L, Smith O, Lawry J, Reed MW and
Brown NJ: Cell cycle phase influences tumour cell sensitivity to
aminolaevulinic acid-induced photodynamic therapy in vitro. Br J
Cancer. 78:50–55. 1998. View Article : Google Scholar : PubMed/NCBI
|
|
14
|
Sano M, Furuta T, Takahira K, et al:
Cell-cycle-dependent efficacy of photodynamic therapy with
ATX-S10(Na). Lasers Med Sci. 20:1–5. 2005. View Article : Google Scholar : PubMed/NCBI
|
|
15
|
Heinemann L, Simpson GR, Annels NE, et al:
The effect of cell cycle synchronization on tumor sensitivity to
reovirus oncolysis. Mol Ther. 18:2085–2093. 2010. View Article : Google Scholar : PubMed/NCBI
|
|
16
|
Huang X, Di Liberto M, Jayabalan D, et al:
Prolonged early G(1) arrest by selective CDK4/CDK6 inhibition
sensitizes myeloma cells to cytotoxic killing through cell
cycle-coupled loss of IRF4. Blood. 120:1095–1106. 2012. View Article : Google Scholar : PubMed/NCBI
|
|
17
|
Hassan MAIA, Braam SR and Kruyt FAE:
Paclitaxel and vincristine potentiate adenoviral oncolysis that is
associated with cell cycle and apoptosis modulation, whereas they
differentially affect the viral life cycle in non-small-cell lung
cancer cells. Cancer Gene Ther. 13:1105–1114. 2006. View Article : Google Scholar
|
|
18
|
Connell CM, Wheatley SP and McNeish IA:
Nuclear survivin abrogates multiple cell cycle checkpoints and
enhances viral oncolysis. Cancer Res. 68:7923–7931. 2008.
View Article : Google Scholar : PubMed/NCBI
|
|
19
|
Lv Y, Fang M, Zheng J, et al:
Low-intensity ultrasound combined with 5-aminolevulinic acid
administration in the treatment of human tongue squamous carcinoma.
Cell Physiol Biochem. 30:321–333. 2012. View Article : Google Scholar : PubMed/NCBI
|
|
20
|
Song W, Cui H, Zhang R, Zheng J and Cao W:
Apoptosis of SAS cells induced by sonodynamic therapy using
5-aminolevulinic acid sonosensitizer. Anticancer Res. 31:39–45.
2011.PubMed/NCBI
|
|
21
|
Khammanit R, Chantakru S, Kitiyanant Y and
Saikhun J: Effect of serum starvation and chemical inhibitors on
cell cycle synchronization of canine dermal fibroblasts.
Theriogenology. 70:27–34. 2008. View Article : Google Scholar : PubMed/NCBI
|
|
22
|
Banfalvi G: Overview of cell
synchronization. Methods Mol Biol. 761:1–23. 2011.PubMed/NCBI
|
|
23
|
Gao Z, Zheng J, Yang B, et al: Sonodynamic
therapy inhibits angiogenesis and tumor growth in a xenograft mouse
model. Cancer Lett. 335:93–99. 2013. View Article : Google Scholar : PubMed/NCBI
|
|
24
|
Vokes EE: The promise of biochemical
modulation in combined modality therapy. Semin Oncol. 21:29–33.
1994.PubMed/NCBI
|
|
25
|
Humphrey RM and Dewey WC: Radiosensitivity
of normal and 5-bromodeoxyuridine treated mammalian cells during
different phases of the cell cycle. Exp Cell Res. 39:483–495. 1965.
View Article : Google Scholar : PubMed/NCBI
|
|
26
|
Ma LW, Moan J, Steen HB and Iani V:
Anti-tumour activity of photodynamic therapy in combination with
mitomycin C in nude mice with human colon adenocarcinoma. Br J
Cancer. 71:950–956. 1995. View Article : Google Scholar : PubMed/NCBI
|
|
27
|
Shibata Y, Matsumura A, Yoshida F, et al:
Cell cycle dependency of porphyrin uptake in a glioma cell line.
Cancer Lett. 129:77–85. 1998. View Article : Google Scholar : PubMed/NCBI
|
|
28
|
Terasima T and Tolmach LJ: Variations in
several responses of HeLa cells to x-irradiation during the
division cycle. Biophys J. 3:11–33. 1963. View Article : Google Scholar : PubMed/NCBI
|
|
29
|
Meikrantz W and Schlegel R: Apoptosis and
the cell cycle. J Cell Biochem. 58:160–174. 1995. View Article : Google Scholar : PubMed/NCBI
|
|
30
|
Yam CH, Fung TK and Poon RYC: Cyclin A in
cell cycle control and cancer. Cell Mol Life Sci. 59:1317–1326.
2002. View Article : Google Scholar : PubMed/NCBI
|
|
31
|
Pagano M, Pepperkok R, Verde F, Ansorge W
and Draetta G: Cyclin A is required at two points in the human cell
cycle. EMBO J. 11:961–971. 1992.PubMed/NCBI
|
|
32
|
Wang SJ, Hasham MG, Isordia-Salas I,
Tsygankov AY, Colman RW and Guo YL: Regulation of cardiovascular
signaling by kinins and products of similar converting enzyme
systems - Upregulation of Cdc2 and cyclin A during apoptosis of
endothelial cells induced by cleaved high-molecular-weight
kininogen. Am J Physiol Heart Circ Physiol. 284:H1917–H1923. 2003.
View Article : Google Scholar : PubMed/NCBI
|
|
33
|
Meikrantz W and Schlegel R: Suppression of
apoptosis by dominant negative mutants of cyclin-dependent protein
kinases. J Biol Chem. 271:10205–10209. 1996. View Article : Google Scholar : PubMed/NCBI
|
|
34
|
Meikrantz W, Gisselbrecht S, Tam SW and
Schlegel R: Activation of Cyclin a-Dependent Protein-Kinases during
Apoptosis. Proc Natl Acad Sci USA. 91:3754–3758. 1994. View Article : Google Scholar
|
|
35
|
Wang XH, Song YJ, Ren JS and Qu XG:
Knocking-Down Cyclin A(2) by siRNA Suppresses Apoptosis and
Switches Differentiation Pathways in K562 Cells upon Administration
with Doxorubicin. PLoS One. 4:e66652009. View Article : Google Scholar : PubMed/NCBI
|
|
36
|
Ekberg J and Persson J: Post-translational
modification of cyclin A1 is associated with staurosporine and TNF
alpha induced apoptosis in leukemic cells. Mol Cell Biochem.
320:115–124. 2009. View Article : Google Scholar
|
|
37
|
Hiromura K, Pippin JW, Blonski MJ, Roberts
JM and Shankland SJ: The subcellular localization of cyclin
dependent kinase 2 determines the fate of mesangial cells: role in
apoptosis and proliferation. Oncogene. 21:1750–1758. 2002.
View Article : Google Scholar : PubMed/NCBI
|