Introduction
Head and neck cancer is the sixth most common type
of cancer, with an annual incidence of 700,000 patients worldwide
(1,2). It is reported that 20–30% of cases of
head and neck cancer are laryngeal tumors (3). Laryngeal squamous cell carcinoma
(LSCC), originating in the squamous cells, is the most common type
of laryngeal carcinoma, accounting for ~25% of all cases of head
and neck squamous cell carcinoma (4), with high mortality rates and a poor
prognosis. The five-year survival rates are suggested to be between
52 and 94%, depending on the tumor site, stage and tumor therapy
(5,6).
LSCC is considered to be result from the
interactions of several genetic and environmental factors (7), including smoking, alcohol consumption
(8,9), air pollution and viral infection.
Efforts have been made to identify the genes involved in this type
of cancer in past few decades. It was demonstrated, by expression
profile screening, that protein tyrosine phosphatase receptor type
δ is a suppressor gene in LSCC (10). Alterations in the expression of
astrocyte elevated gene 1 exerts a predictive value in the
prognosis of LSCC (11). Recurrent
alterations in the levels of DNA methylation of Fanconi
anemia-associated genes including FANCA, BRCA1 and BRCA2 contribute
to the development of LSCC (12).
However, the pathogenesis of LSCC and associated biological process
and pathways remain to be elucidated.
Therefore, the aim of the present study was to
determine the pathogenesis of LSCC and to investigate the
differences between LSCC and non-neoplastic tissue samples at the
molecular level. Differentially expressed genes (DEGs) between LSCC
and normal samples were identified, followed by hierarchical
clustering and function and pathway enrichment. Furthermore,
functional interaction network analysis of the DEGs was performed.
The results of the present study may provide novel insights into
the therapeutics and assist in improving the survival rate and
prognosis of patients with LSCC.
Materials and methods
Microarray data
The gene expression profiles of GSE51985 (13) and GSE10288 (14) were obtained from the National
Center of Biotechnology Information Gene Expression Omnibus (GEO)
database (http://www.ncbi.nlm.gov/geo/). Larynx tissues with
regional lymph node metastasis and corresponding adjacent
non-neoplastic tissues samples from 10 patients (all males; age
range, 52–74 years) who underwent surgery for primary LSCC at the
Department of Head and Neck Surgery (Beijing Tongren Hospital,
Beijing, China) were available for GSE51985, while GSE10288
contained 13 lesion tissue samples of LSCC from LSCC patients (12
males and 1 female; age range, 44–73 years; two repeats were
obtained from each patient) and 10 non-matched normal larynx tissue
samples (each had two repeats) from non-neoplastic larynx from the
Arnaldo Vieira de Carvalho Hospital (São Paulo, Brazil).
Data preprocessing
The samples from GSE51985 were annotated using the
Illumina HumanHT-12 V4.0 expression beadchip platform (Illumina
Inc., San Diego, CA, USA). The expression values were subjected to
quantile data normalization using Illumina's Genome Studio v1
software (Illumina Inc.), followed by log2
transformation and gene annotation. The microarray detection
platform, CAGE Lab-Head and Neck carcinoma cDNA microarray
(Department of Biochemistry, Institute of Chemistry, University of
São Paulo, Brazil), was used for the annotation of the samples from
GSE10288. The probe data were initially normalized by a locally
weighted scatterplot smoothing algorithm (http://connection.ebscohost.com/c/articles/28834113/optimized-lowess-normalization-parameter-selection-dna-microarray-data)
(15) using GeneSpring software,
version 10.0 (Agilent Technologies, Inc., Foster City, CA, USA) and
then annotated for gene expression value as described above. In
cases where one gene corresponds to multiple probe sets, the
average was used as the gene expression value. Subsequently, the
normalized values were used to calculate
log2-transformed Cy5/Cy3 ratios (denoted
log2-ratios) for each gene using GeneSpring software,
version 10.0.
DEG analysis
To investigate the differences between the LSCC
samples and the non-neoplastic LSCC samples, the rowtest algorithm
of the genefilter package in R/Bioconductor (www.bioconductor.org/packages/2.3/bioc/html/genefilter.html)
(16) was used to identify the
DEGs in the two sample groups. The DEGs were required to meet the
criteria that |log2 fold change (FC)|>1 and
P<0.05. Subsequently, the DEGs obtained from the two microarray
data were compared using hierarchical clustering in R, version
3.0.2 234 (www.r-project.org). Heatmaps, based
on the gene expression values, were produced to verify the
distinguished effect of the identified genes on the LSCC and
non-neoplastic samples.
Function and pathway enrichment analysis
of DEGs
Gene Ontology (GO) analysis is widely used for
functional investigations of large-scale genomic or transcriptomic
data (17), which characterizes
genes or gene products to a biological process, molecular function
and cellular component. Kyoto Encyclopedia of Genes and Genomes
(KEGG; www.genome.ad.jp/kegg/kegg2.html pathway analysis is
another technique to reveal the biological mechanisms of large
numbers of genes derived from high-throughput genomic experiments
(18). Database for annotation,
visualization and integrated discovery (DAVID; david.abcc.ncifcrf.gov) is one of the most commonly
used tools for GO enrichment and pathway analysis (19). As few genes have been sequenced in
the GSE10288 profile, only the DEGs of the GSE51985 dataset were
subjected to DAVID in the present study, to identify the
differences in functions and pathways, with an enrichment
significance false discovery rate (FDR) of <0.05. The
enrichments of the upregulated and downregulated DGEs were
performed separately.
Functional interaction network analysis
of the upregulated DEGs
To gain further insights into the functional
coordination of the DEGs, the human protein reference database
(HPRD; www.hprd.org) was used to examine the
interacting pairs associated with the upregulated DEGs. The
interacting pairs were visualized via Cytoscape (www.cytoscape. org) (20). Additionally, the significant
pathways associated with these pairs were enriched via DAVID, with
the threshold as FDR<0.05.
Results
DEG screening and comparison
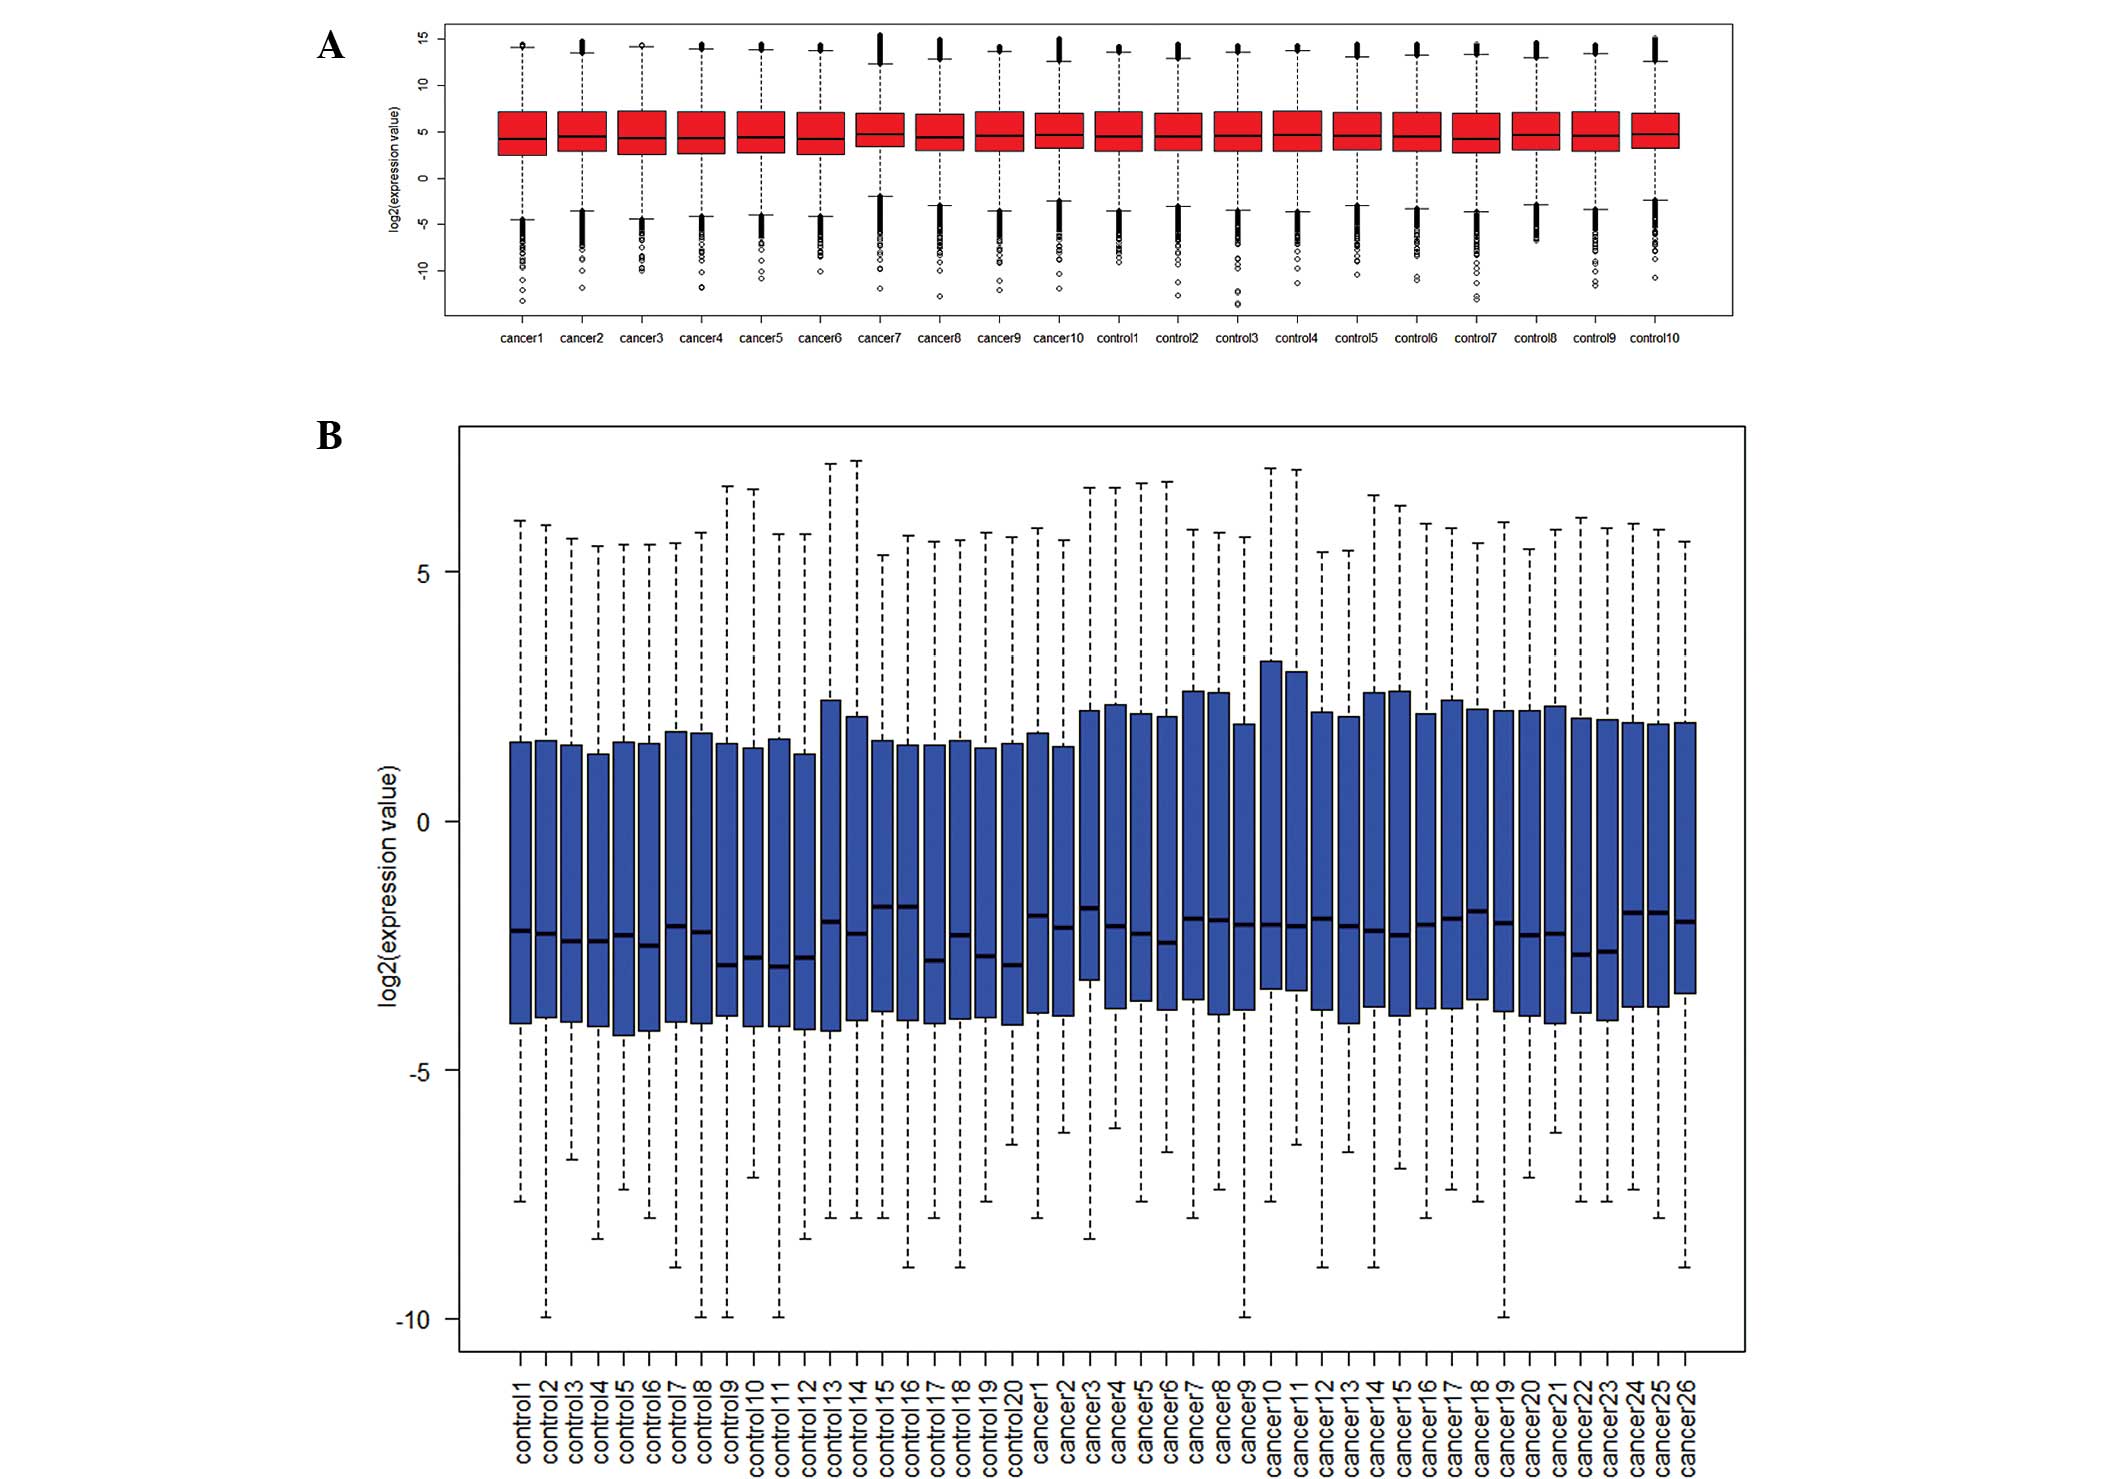
Following normalization of the microarray data
(Fig. 1), a rowtest algorithm was
used to identify the DEGs between the LSCC samples and the
non-neoplastic LSC samples. A total of 1,605 genes were identified
as significantly differentially expressed in the samples from the
GSE51985 dataset, among which 1,288 genes were upregulated and 317
genes were downregulated in the LSCC samples, compared with the
non-neoplastic LSC samples. Similarly, 31 genes were identified as
DEGs in the samples from the GSE10288 dataset, including five
upregulated and 26 downregulated genes (Table I). Following comparisons of the
DEGs in the GSE51985 and GSE10288 datasets, four genes were found
to be differentially expressed in the two datasets. These genes
were dynein, axonemal, heavy Chain 1 (DNAH1), ubiquitin C
(UBC), early endosome antigen 1 (EEA1) and ubiquitin
specific peptidase (EEA1), of which, DNAAH1 was
downregulated in the LSCC sample from the two datasets, and the
other three DEGs exhibited a different trend of expression in the
two datasets, which may have been attributed to the different
sources of the samples for the two datasets.
 | Table IDEGs in the GSE51985 and GSE10288
datasets. |
Table I
DEGs in the GSE51985 and GSE10288
datasets.
| Dataset | Total genes | Upregulated
genes | Downregulated
genes | DEGs |
|---|
| GSE10288 | 134 | 5 | 26 | 31 |
| GSE51985 | 21410 | 1288 | 317 | 1605 |
DEG clustering analysis
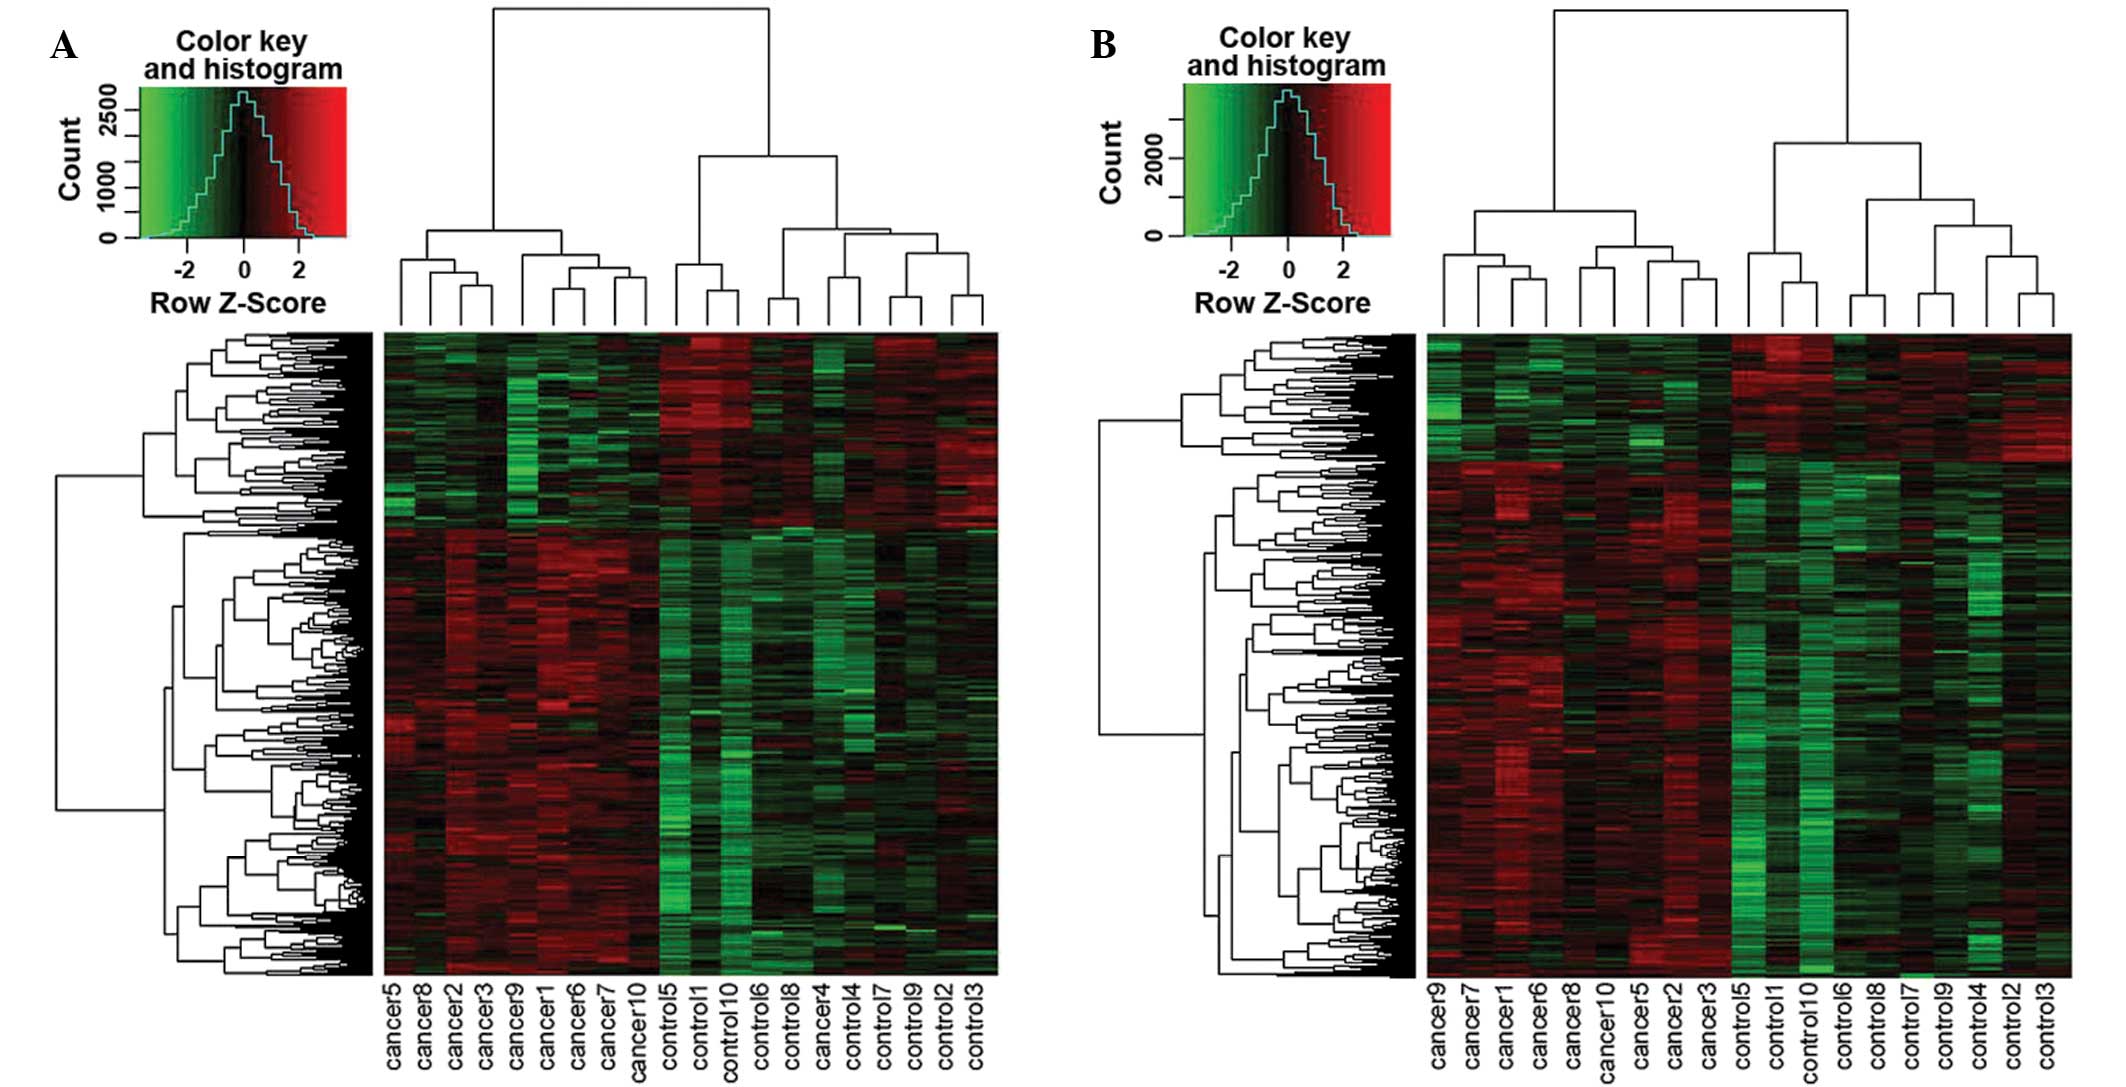
The heatmap of the DEG hierarchical clustering
(Fig. 2A) demonstrated that the
cancer 4 sample in LSCC was clustered into the non-neoplastic LSCC
sample cluster, and no significant difference was observed in the
DEGs between the cancer 4 sample and the corresponding control 4
sample. Therefore, the cancer 4 sample was excluded from the
subsequent hierarchical clustering. As expected, the selected DEGs
were well distinguished between the LSCC sample and the
non-neoplastic LSCC sample (Fig.
2B).
GO enrichment analysis and pathway
analysis
The results of the GO enrichment analysis are shown
in Table II, which demonstrated
that the upregulated genes were predominantly involved in the cell
cycle and cell division processes (34 GO terms). The downregulated
genes included only a few genes, which were involved in the
oxidation reduction process. The pathway enrichment analysis
revealed that no upregulated or downregulated DEGs were enriched in
specific pathways.
| Table IIGO enrichment analysis of
differentially expressed genes. |
Table II
GO enrichment analysis of
differentially expressed genes.
| GO term | Number | Fold enrichment | FDR |
|---|
| Downregulated
gene | | | |
| GO:0055114
oxidation reduction | 25 | 2.846 | 0.011 |
| Upregulated
gene | | | |
| GO:0000278 mitotic
cell cycle | 71 | 2.937 |
6.000−13 |
| GO:0022402 cell
cycle process | 91 | 2.465 |
2.220−12 |
| GO:0007049 cell
cycle | 108 | 2.130 |
9.210−11 |
| GO:0022403 cell
cycle phase | 67 | 2.477 |
1.650−08 |
| GO:0051301 cell
division | 50 | 2.594 |
2.070−06 |
| GO:0000087 M phase
of mitotic cell cycle | 42 | 2.869 |
2.570−06 |
| GO:0000280 nuclear
division | 41 | 2.852 |
4.990−06 |
| GO:0007067
mitosis | 41 | 2.852 |
4.990−06 |
| GO:0000279 M
phase | 52 | 2.419 |
1.100−05 |
| GO:0048285
organelle fission | 41 | 2.740 |
1.650−05 |
| GO:0031396
regulation of protein ubiquitination | 24 | 3.673 |
1.500−04 |
| GO:0006260 DNA
replication | 33 | 2.658 | 0.001 |
| GO:0051726
regulation of cell cycle | 47 | 2.173 | 0.002 |
| GO:0034621
cellular macromolecular complex subunit organization | 49 | 2.100 | 0.002 |
| GO:0031398
positive regulation of protein ubiquitination | 20 | 3.644 | 0.003 |
| GO:0007398
ectoderm development | 33 | 2.538 | 0.003 |
| GO:0010604
positive regulation of macromolecule metabolic process | 92 | 1.643 | 0.004 |
| GO:0008544
epidermis development | 31 | 2.578 | 0.005 |
| GO:0051340
regulation of ligase activity | 19 | 3.590 | 0.006 |
| GO:0051325
interphase | 22 | 3.176 | 0.007 |
| GO:0065004
protein-DNA complex assembly | 20 | 3.363 | 0.009 |
| GO:0033554
cellular response to stress | 66 | 1.784 | 0.010 |
| GO:0031400
negative regulation of protein modification process | 23 | 2.958 | 0.014 |
| GO:0043161
proteasomal ubiquitin-dependent protein catabolic process | 21 | 3.151 | 0.014 |
| GO:0010498
proteasomal protein catabolic process | 21 | 3.151 | 0.014 |
| GO:0051438
regulation of ubiquitin-protein ligase activity | 18 | 3.532 | 0.016 |
| GO:0051329
interphase of mitotic cell cycle | 21 | 3.120 | 0.017 |
| GO:0034622
cellular macromolecular complex assembly | 43 | 2.069 | 0.017 |
| GO:0051439
regulation of ubiquitin-protein ligase activity during mitotic cell
cycle | 17 | 3.664 | 0.018 |
| GO:0031145
anaphase-promoting complex-dependent proteasomal
ubiquitin-dependent protein catabolic process | 16 | 3.767 | 0.026 |
| GO:0051351
positive regulation of ligase activity | 17 | 3.564 | 0.027 |
| GO:0051247
positive regulation of protein metabolic process | 35 | 2.204 | 0.036 |
| GO:0032270
positive regulation of cellular protein metabolic process | 34 | 2.233 | 0.037 |
| GO:0051437
positive regulation of ubiquitin-protein ligase activity during
mitotic cell cycle | 16 | 3.601 | 0.045 |
Functional network analysis of the
upregulated DEGs
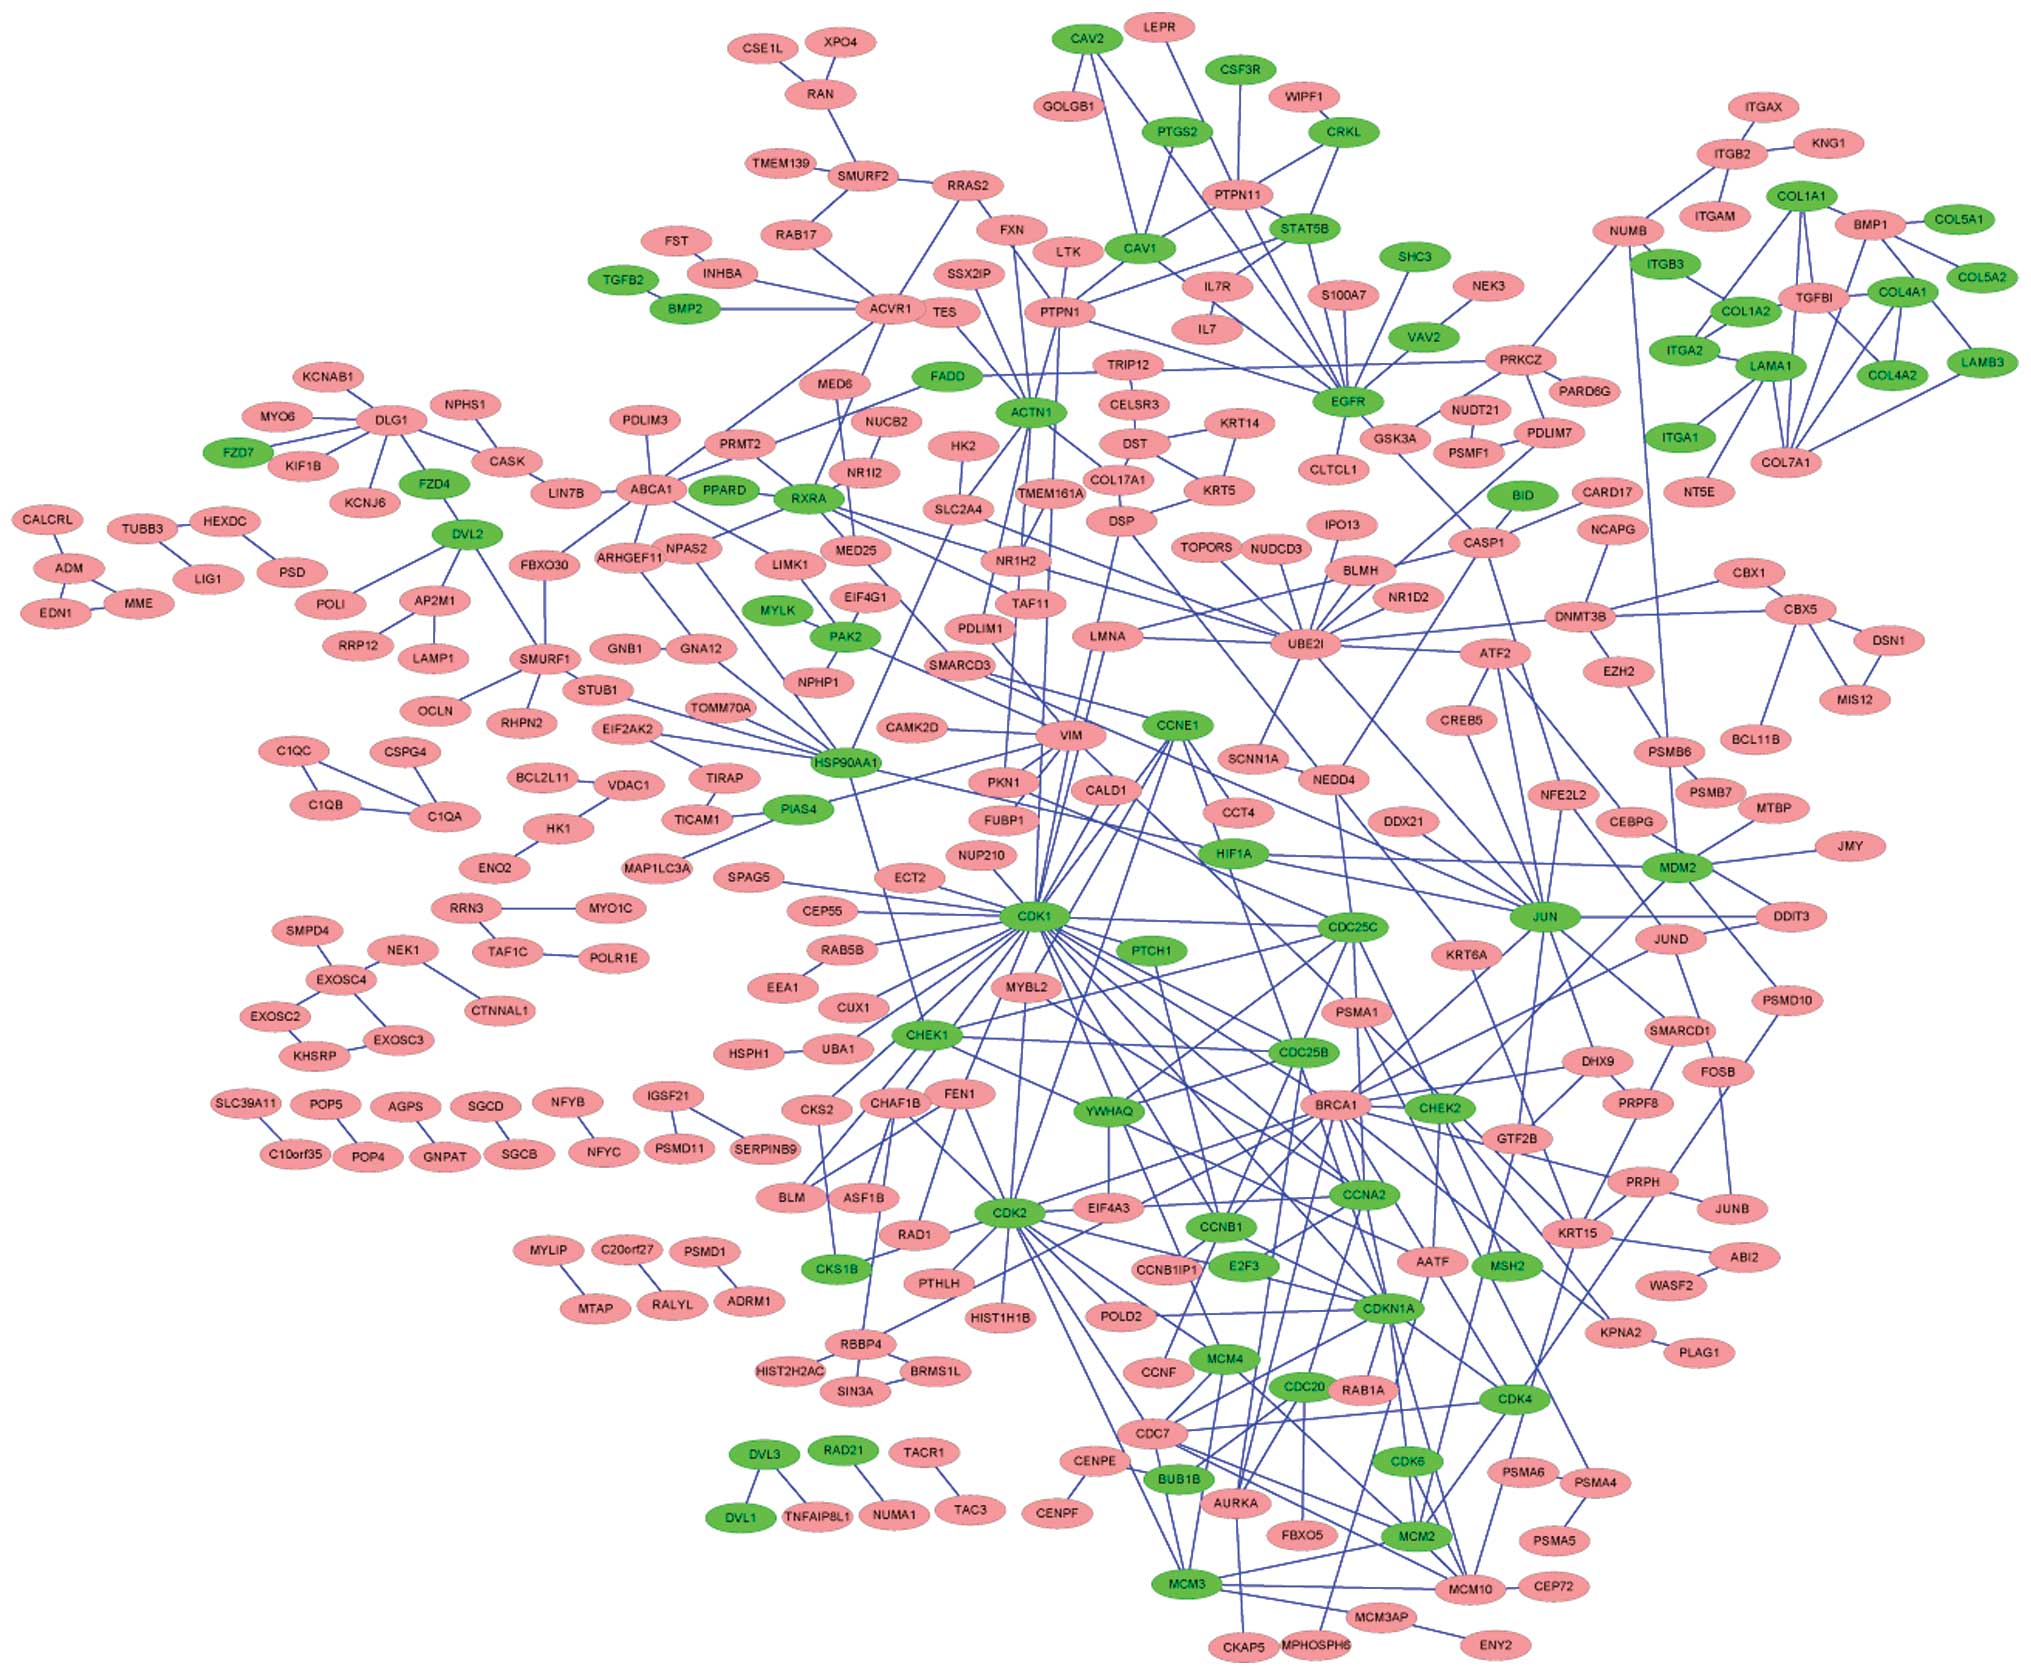
HPRD consists of 39,240 protein pairs and 10,200
proteins. The LSCC upregulated genes were mapped to HPRD, and 374
interacting pairs, including 294 upregulated DEGs, were identified
and used for construction of the interaction network (Fig. 3). Among the 294 genes, 64 were
enriched in several specific pathways (Table III), including the cell cycle
(hsa04110), pathways in cancer (hsa05200), small cell lung cancer
(has05222) and focal adhesion (hsa04510). Overall, there were 21
genes enriched in the focal adhesion pathway, including epidermal
growth receptor (EGFR), caveolin 2 (CAV2), collagen
type V, alpha 1 (COL5A1) and laminin alpha 1
(LAMA1).
| Table IIIKEGG pathway enrichment results for
the differentially expressed genes in the functional interaction
network. |
Table III
KEGG pathway enrichment results for
the differentially expressed genes in the functional interaction
network.
| KEGG pathway | Count | Fold
enrichment | FDR | Genes |
|---|
| hsa04110:Cell
cycle | 23 | 5.536331361 | 6.87E-08 | CDC7, CDK1, E2F3,
CDK6, CHEK1, CDC20, MCM2, CHEK2, CDK4, CDC25C, MCM3, MCM4, CDK2,
TGFB2, CDC25B, CCNB1, CCNE1, CDKN1A, RAD21, YWHAQ, BUB1B, MDM2,
CCNA2 |
| hsa05200:Pathways
in cancer | 35 | 3.210690576 | 1.18E-06 | BID, CKS1B, E2F3,
PPARD, PTGS2, STAT5B, TGFB2, CCNE1, LAMB3, CSF3R, DVL2, EGFR, DVL3,
BMP2, COL4A2, HSP90AA1, COL4A1, MSH2, RXRA, ITGA2, CDK6, FADD,
CDK4, FZD4, CDK2, FZD7, DVL1, LAMA1, CDKN1A, CRKL, HIF1A, PIAS4,
JUN, MDM2, PTCH1 |
| hsa05222:Small cell
lung cancer | 14 | 5.014792899 | 0.003233743 | CKS1B, COL4A2,
E2F3, COL4A1, PTGS2, RXRA, ITGA2, CDK6, CDK4, CDK2, CCNE1, LAMA1,
LAMB3, PIAS4 |
| hsa04510:Focal
adhesion | 21 | 3.143601519 | 0.008951954 | EGFR, CAV2, CAV1,
COL4A2, COL4A1, ITGA1, ITGA2, ACTN1, ITGB3, VAV2, COL5A2, COL5A1,
LAMA1, LAMB3, CRKL, PAK2, JUN, COL1A2, COL1A1, SHC3, MYLK |
Discussion
Gene expression levels in disease reveal the
potential biological mechanism of the disease. The present study
downloaded two datasets of gene expression profiles from GEO. A
total of 1,605 genes were identified as significantly
differentially expressed in samples from the GSE51985 dataset and
31 genes were identified as DEGs in samples from the GSE10288
dataset. Although identified in different samples, certain genes
were revealed to be differentially expressed in the two profiles,
including DNAH1.
DNAH1, which codes the proteins of the
axonemal dynein cluster, is a large subunit of dynactin. The
DNAH1 mutation has been detected in exome-sequenced
colorectal cancer and melanoma specimens (21). DNAH1 is involved in the
significant differences in DNA copy number between adenocarcinoma
and squamous cell carcinoma (22).
Furthermore, DNAH1 is putatively involved in cell motility
and migration (23). Cancer cells
move within tissues during invasion and metastasis through their
own motility (24), and the
migratory mechanisms can respond to different conditions (25). Multiple genes associated with cell
motility are reported to be deregulated in human cancer (26). DNAH1 was also downregulated
in the LSCC samples used in the present study, therefore, it was
suggested that DNAH1 may exert its effect in LSCC through
its involvement in cell motility.
By analyzing two datasets of LSCC samples, the
present study revealed that the DEGs and their function in the LSCC
sample demonstrated similar characteristics with general types of
cancer, particularly the upregulated genes, as they were
significantly involved in cell cycle, likely to increase cell
proliferation rate and lead to tumorigenesis. CDC7 and
CDK1 were among the genes enriched in the cell cycle
pathway. CDKs are threonine/serine protein kinases, the activities
of which depend on the action and binding of cyclin partners
(27). Tumor-associated cell cycle
defects are usually mediated by alteration in the activity of CDK
(28). As a key regulator of the
cell cycle, CDK1 is a powerful therapeutic target for cancer
inhibitors (29). In precursor
lesions and esophageal adenocarcinoma, the expression of
CDC72/CDK1 serves as a diagnostic and cancer
progression marker (30).
In addition, the present study demonstrated that
certain genes were also involved in the LSCC bifocal adhesion
pathway, including EGFR. Focal adhesion kinase (FAK) is
involved in cancer cell tumor formation and progression (31). Lymph node metastasis in esophageal
SCC is associated with the overexpression of FAK (32), which is also observed in head and
neck squamous cell carcinoma (33). The simultaneous inhibition of EGFR
and the FAK pathway increases the apoptotic response of cancer
cells (34). In addition, in colon
and breast cancer cells, FAK survival signaling exerts its roles by
combining with EGFR (35).
EGFR-targeted therapy is used in the treatment of head and neck
cancer via targeting the pathways involved in tumor growth,
angiogenesis, metastasis and invasion (36), for example, the EGFR inhibitor,
gefitinib, has been used in clinical practice in the treatment of
head and neck squamous cell carcinoma (37). High levels of EGFR can indicate
patients with laryngeal cancer with a poor prognosis (38). Therefore, the present study
hypothesized that EGFR is involved in the development of LSCC via
the FAK pathway. Furthermore, genes of the integrin family are also
involved in LSCC via the FAK pathway, including integrin α1
(ITGA1) and integrin β3 (ITGB3). It is reported that
the combination of ITGB3 with SDC4 may result in the
activation of FAK (39).
Integrin/FAK signaling can control tumor initiation, growth and
progression into malignant squamous cell carcinoma (40).
In conclusion, with the assistance of
high-throughput microarray data analysis, based on bioinformatics
methods, the present study identified several DEGs, as well as
their abnormal functions and pathways, in LSCC. The associations
identified between the DEGs and their relative biological processes
offer novel insights into the mechanism underlying LSCC.
References
|
1
|
Jemal A, Bray F, Center MM, Ferlay J, Ward
E and Forman D: Global cancer statistics. CA Cancer J Clin.
61:69–90. 2011. View Article : Google Scholar : PubMed/NCBI
|
|
2
|
Gleeson M, Browning G, Burton Martin J, et
al: Scott-Brown's Otorhinolaryngology. Head and Neck Surgery. 7th
edition. Hodder Arnold, Ltd; London: pp. 2292–2304. 2008
|
|
3
|
Schrijvers M: New prognostic markers to
predict clinical outcome in patients with laryngeal cancer.
Radiother Oncol. 100:22–32. 2011.
|
|
4
|
Hunter KD, Parkinson EK and Harrison PR:
Profiling early head and neck cancer. Nat Rev Cancer. 5:127–135.
2005. View
Article : Google Scholar : PubMed/NCBI
|
|
5
|
Dequanter D and Lothaire P: The role of
salvage surgery in organ preservation strategies in advanced head
and neck cancer. B-ENT. 4:77–80. 2008.PubMed/NCBI
|
|
6
|
León X, López M, García J, Viza I, Orús C
and Quer M: Supracricoid laryngectomy as salvage surgery after
failure of radiation therapy. Eur Arch Otorhinolaryngol.
264:809–814. 2007. View Article : Google Scholar : PubMed/NCBI
|
|
7
|
Liu M, Wu H, Liu T, et al: Regulation of
the cell cycle gene, BTG2, by miR-21 in human laryngeal carcinoma.
Cell Res. 19:828–837. 2009. View Article : Google Scholar : PubMed/NCBI
|
|
8
|
Sasaki CT and Jassin B: Cancer of the
pharynx and larynx. Am J Med. 111:S118–S123. 2001. View Article : Google Scholar
|
|
9
|
Manjarrez ME, Ocadiz R, Valle L, et al:
Detection of human papillomavirus and relevant tumor suppressors
and oncoproteins in laryngeal tumors. Clin Cancer Res.
12:6946–6951. 2006. View Article : Google Scholar : PubMed/NCBI
|
|
10
|
Giefing M, Zemke N, Brauze D, et al: High
resolution ArrayCGH and expression profiling identifies PTPRD and
PCDH17/PCH68 as tumor suppressor gene candidates in laryngeal
squamous cell carcinoma. Genes Chromosomes Cancer. 50:154–166.
2011. View Article : Google Scholar : PubMed/NCBI
|
|
11
|
Liu Y, Li G, Su ZW, et al: Expression of
astrocyte elevated gene-1 protein and its clinical significance in
laryngeal squamous cell carcinoma. Zhonghua Bing Li Xue Za zhi.
42:111–115. 2013.In Chinese. PubMed/NCBI
|
|
12
|
Szaumkessel M, Richter J, Giefing M, et
al: Pyrosequencing-based DNA methylation profiling of Fanconi
anemia/BRCA pathway genes in laryngeal squamous cell carcinoma. Int
J Oncol. 39:505–514. 2011.PubMed/NCBI
|
|
13
|
Lian M, Fang J, Han D, et al: Microarray
gene expression analysis of tumorigenesis and regional lymph node
metastasis in laryngeal squamous cell carcinoma. PLoS One.
8:e848542013. View Article : Google Scholar
|
|
14
|
Colombo J, Fachel AA, De Freitas Calmon M,
Cury PM, Fukuyama EE, Tajara EH, Cordeiro JA, Verjovski-Almeida S,
Reis EM and Rahal P: Gene expression profiling reveals molecular
marker candidates of laryngeal squamous cell carcinoma. Oncol Rep.
21:649–663. 2009.PubMed/NCBI
|
|
15
|
Berger JA, Hautaniemi S, Järvinen AK,
Edgren H, Mitra SK and Astola J: Optimized LOWESS normalization
parameter selection for DNA microarray data. BMC Bioinformatics.
5:1942004. View Article : Google Scholar : PubMed/NCBI
|
|
16
|
Tilford CA and Siemers NO: Gene set
enrichment analysis. Methods Mol Biol. 563:99–121. 2009. View Article : Google Scholar : PubMed/NCBI
|
|
17
|
Hulsegge I, Kommadath A and Smits MA:
Globaltest and GOEAST: two different approaches for gene ontology
analysis. BMC Proc. 3:S102009. View Article : Google Scholar : PubMed/NCBI
|
|
18
|
Kanehisa M and Goto S: KEGG: Kyoto
encyclopedia of genes and genomes. Nucleic Acids Res. 28:27–30.
2000. View Article : Google Scholar
|
|
19
|
Huang da W, Sherman BT and Lempicki RA:
Systematic and integrative analysis of large gene lists using DAVID
bioinformatics resources. Nat Protoc. 4:44–57. 2009. View Article : Google Scholar : PubMed/NCBI
|
|
20
|
Shannon P, Markiel A, Ozier O, et al:
Cytoscape: a software environment for integrated models of
biomolecular interaction networks. Genome Res. 13:2498–2504. 2003.
View Article : Google Scholar : PubMed/NCBI
|
|
21
|
McNerney ME, Brown CD, Peterson AL, et al:
The spectrum of somatic mutations in high-risk acute myeloid
leukaemia with-7/del (7q). Br J Haematol. 166:550–556. 2014.
View Article : Google Scholar : PubMed/NCBI
|
|
22
|
Son JW, Jeong KJ, Jean WS, et al:
Genome-wide combination profiling of DNA copy number and
methylation for deciphering biomarkers in non-small cell lung
cancer patients. Cancer Lett. 311:29–37. 2011. View Article : Google Scholar : PubMed/NCBI
|
|
23
|
Milosevic J, Klinge J, Borg AL, Foukakis
T, Bergh J and Tobin NP: Clinical instability of breast cancer
markers is reflected in long-term in vitro estrogen deprivation
studies. BMC Cancer. 13:4732013. View Article : Google Scholar : PubMed/NCBI
|
|
24
|
Yamazaki D, Kurisu S and Takenawa T:
Regulation of cancer cell motility through actin reorganization.
Cancer Sci. 96:379–386. 2005. View Article : Google Scholar : PubMed/NCBI
|
|
25
|
Friedl P and Wolf K: Tumour-cell invasion
and migration: diversity and escape mechanisms. Nat Rev Cancer.
3:362–374. 2003. View
Article : Google Scholar : PubMed/NCBI
|
|
26
|
Sahai E: Mechanisms of cancer cell
invasion. Curr Opin Genet Dev. 15:87–96. 2005. View Article : Google Scholar : PubMed/NCBI
|
|
27
|
Malumbres M, Pevarello P, Barbacid M and
Bischoff JR: CDK inhibitors in cancer therapy: what is next? Trends
Pharm Sci. 29:16–21. 2008. View Article : Google Scholar
|
|
28
|
Malumbres M and Barbacid M: Cell cycle,
CDKs and cancer: a changing paradigm. Nat Rev Cancer. 9:153–166.
2009. View
Article : Google Scholar : PubMed/NCBI
|
|
29
|
Wang Q, Su L, Liu N, Zhang L, Xu W and
Fang H: Cyclin dependent kinase 1 inhibitors: a review of recent
progress. Curr Med Chem. 18:2025–2043. 2011. View Article : Google Scholar : PubMed/NCBI
|
|
30
|
Hansel DE, Dhara S, Huang RC, et al:
CDC2/CDK1 expression in esophageal adenocarcinoma and precursor
lesions serves as a diagnostic and cancer progression marker and
potential novel drug target. Am J Surg Pathol. 29:390–399. 2005.
View Article : Google Scholar : PubMed/NCBI
|
|
31
|
McLean GW, Carragher NO, Avizienyte E,
Evans J, Brunton VG and Frame MC: The role of focal-adhesion kinase
in cancer–a new therapeutic opportunity. Nat Rev Cancer. 5:505–515.
2005. View
Article : Google Scholar : PubMed/NCBI
|
|
32
|
Miyazaki T, Kato H, Nakajima M, et al: FAK
overexpression is correlated with tumour invasiveness and lymph
node metastasis in oesophageal squamous cell carcinoma. Br J
Cancer. 89:140–145. 2003. View Article : Google Scholar : PubMed/NCBI
|
|
33
|
Canel M, Secades P, Rodrigo JP, et al:
Overexpression of focal adhesion kinase in head and neck squamous
cell carcinoma is independent of fak gene copy number. Clin Cancer
Res. 12:3272–3279. 2006. View Article : Google Scholar : PubMed/NCBI
|
|
34
|
Golubovskaya VM, Gross S, Kaur AS, et al:
Simultaneous inhibition of focal adhesion kinase and SRC enhances
detachment and apoptosis in colon cancer cell lines. Mol Cancer
Res. 1:755–764. 2003.PubMed/NCBI
|
|
35
|
Golubovskaya VM and Cance W: Focal
adhesion kinase and p53 signal transduction pathways in cancer.
Front Biosci (Landmark Ed). 15:901–912. 2010. View Article : Google Scholar
|
|
36
|
Chen LF, Cohen EE and Grandis JR: New
strategies in head and neck cancer: understanding resistance to
epidermal growth factor receptor inhibitors. Clin Cancer Res.
16:2489–2495. 2010. View Article : Google Scholar : PubMed/NCBI
|
|
37
|
Erjala K, Sundvall M, Junttila TT, et al:
Signaling via ErbB2 and ErbB3 associates with resistance and
epidermal growth factor receptor (EGFR) amplification with
sensitivity to EGFR inhibitor gefitinib in head and neck squamous
cell carcinoma cells. Clin Cancer Res. 12:4103–4111. 2006.
View Article : Google Scholar : PubMed/NCBI
|
|
38
|
Maurizi M, Almadori G, Ferrandina G, et
al: Prognostic significance of epidermal growth factor receptor in
laryngeal squamous cell carcinoma. Br J Cancer. 74:1253–1257. 1996.
View Article : Google Scholar : PubMed/NCBI
|
|
39
|
Erdem M, Erdem S, Sanli O, et al:
Up-regulation of TGM2 with ITGB1 and SDC4 is important in the
development and metastasis of renal cell carcinoma. Urol Oncol.
32:25e13–e20. 2014. View Article : Google Scholar
|
|
40
|
Schober M and Fuchs E: Tumor-initiating
stem cells of squamous cell carcinomas and their control by TGF-β
and integrin/focal adhesion kinase (FAK) signaling. Proc Natl Acad
Sci USA. 108:10544–10549. 2011. View Article : Google Scholar
|