Introduction
Osteoarthritis (OA) is the most prevalent joint
disease and is characterized by an abnormal remodeling of joint
tissues, which is predominantly driven by inflammatory mediators
within the affected joint (1,2). The
pathological changes of OA primarily take place in the articular
cartilage, and include cartilage degeneration, matrix degradation
and synovial inflammation (3–5).
Clinically, features of OA include pain, stiffness, limitation of
motion, swelling and deformity (6). Synovial inflammation is hypothesized
to be the primary underlying etiology in OA (3). However, the biological mechanisms
associated with OA remain to be elucidated.
Microarray, a high-throughput genomics technology,
has been developed in order to improve the understanding of complex
interactions and networks in disease development (7). Thousands of genes on a genome-wide
scale have been measured using microarray technology (8). The successful identification of gene
expression signatures that may provide insights into OA
pathogenesis and differentiate the diseased state from a healthy
state, requires an adequate sample size and heterogeneous datasets
(9). Although numerous microarray
studies have generated lists of differentially expressed (DE)
genes, there are inconsistencies among the results of such studies,
due to the limitation of the small sample sizes involved (10).
To overcome these difficulties, meta-analysis has
previously been applied to publicly-available genome-wide
expression datasets from studies on a number of diseases (11–13).
The use of meta-analysis may improve reliability and
generalizability, and permit a more precise estimation of gene
expression (11). Meta-analyses
provide enhanced statistical power, thereby obtaining more robust
and reliable gene signatures (7,14–17).
Recently, integrative meta-analysis of expression data (INMEX), a
new user-friendly microarray meta-analysis tool, has been developed
to support meta-analysis of multiple gene expression datasets
(18).
In order to overcome the limitations of individual
studies, resolve inconsistencies in results, and reduce
false-positive or false-negative associations due to random errors,
a microarray meta-analysis was performed in the present study. The
objective was to identify differentially expressed (DE) genes and
biological processes associated with gene expression signature in
OA.
Materials and methods
Identification of eligible gene
expression datasets of OA
A search of microarray datasets was performed that
examined DE genes between OA and healthy controls. The NCBI Gene
Expression Omnibus (GEO) database (http://www.ncbi.nlm.nih.gov/geo/) (19) was used to identify suitable
microarray datasets. The keyword 'osteoarthritis' was used for this
search. Studies were included in the analysis if they: Were based
on gene expression profiling of blood or synovial membrane samples;
contained sufficient data to perform a meta-analysis; and included
patients diagnosed with OA, based on OA classification criteria
(20). The following information
was extracted from each of the studies that were selected: GEO
accession; sample type; platform; numbers of patients and healthy
controls; and gene expression data.
Meta-analysis of microarray datasets
All available OA microarray datasets that met the
inclusion criteria were downloaded from the NCBI GEO database. Data
tables containing gene expression or relative gene expression
values were constructed, with genes/probes in the rows, and samples
in the columns. The datasets were uploaded to INMEX (http://www.inmex.ca/INMEX) (18), and the data was subsequently
annotated by converting different gene or probe ID to Entrez IDs.
For each probe-set, intensity values were log-transformed and/or
normalized to zero mean and unit variance, which is the
normalization method for high density oligonucleotide array data,
as reported by Bolstad et al (21). When all datasets had been uploaded,
processed and annotated, a data integrity check was performed prior
to the meta-analysis stage.
The random effects model presumes that different
studies present substantial diversity, and evaluates between study
variance as well as within study sampling error (22,23).
The random effects model is used when the between-study
heterogeneity is significant (23). The INMEX program was used to
conduct statistical analysis (18).
Functional analysis
The functional analysis of INMEX generates new
hypotheses by exploiting characteristics of the DE gene lists
identified in meta-analysis. A heat map created by 'Pattern
extractor' produced gene expression profiles across different
datasets/conditions.
In order to examine the functions of the genes in
the gene list, gene ontology (GO) enrichment analysis was
performed, which detected enriched functional attributes based on
gene-associated GO terms, using the hypergeometric test (http://www.geneontology.org/) (24). Functional analysis was performed
using the INMEX program (18).
Results
Studies included in the
meta-analysis
Three GEO data sets, which met the inclusion
criteria, were identified (Table
I) (4,25,26).
These datasets consisted of two synovial membrane datasets and one
blood dataset, and included a total of 137 patients with OA and 52
controls. Selected details of the individual studies are summarized
in Table I.
 | Table ICharacteristics of the individual
studies included in the meta-analysis. |
Table I
Characteristics of the individual
studies included in the meta-analysis.
| Study (ref) | GEO accession | Patient number
| Sample | Platform |
|---|
| OA | Control |
|---|
| 1 (25) | GSE48556 | 106 | 33 | Blood | Illumina HumanHT-12
V3.0 Expression Beadchip |
| 2 (26) | GSE46750 | 12 | 12 | Synovial
membrane | Illumina HumanHT-12
V4.0 Expression Beadchip |
| 3 (4) | GSE32317 | 19 | 7 | Synovial
membrane | Affymetrix Human
Genome U133 Plus 2.0 Array |
Meta-analysis of gene expression in
OA
A random effects model of effect size (ES) measures
was used to integrate gene expression patterns. The present study
incorporated between-study heterogeneities across studies, because
the estimated Q-value was not in an approximately chi-squared
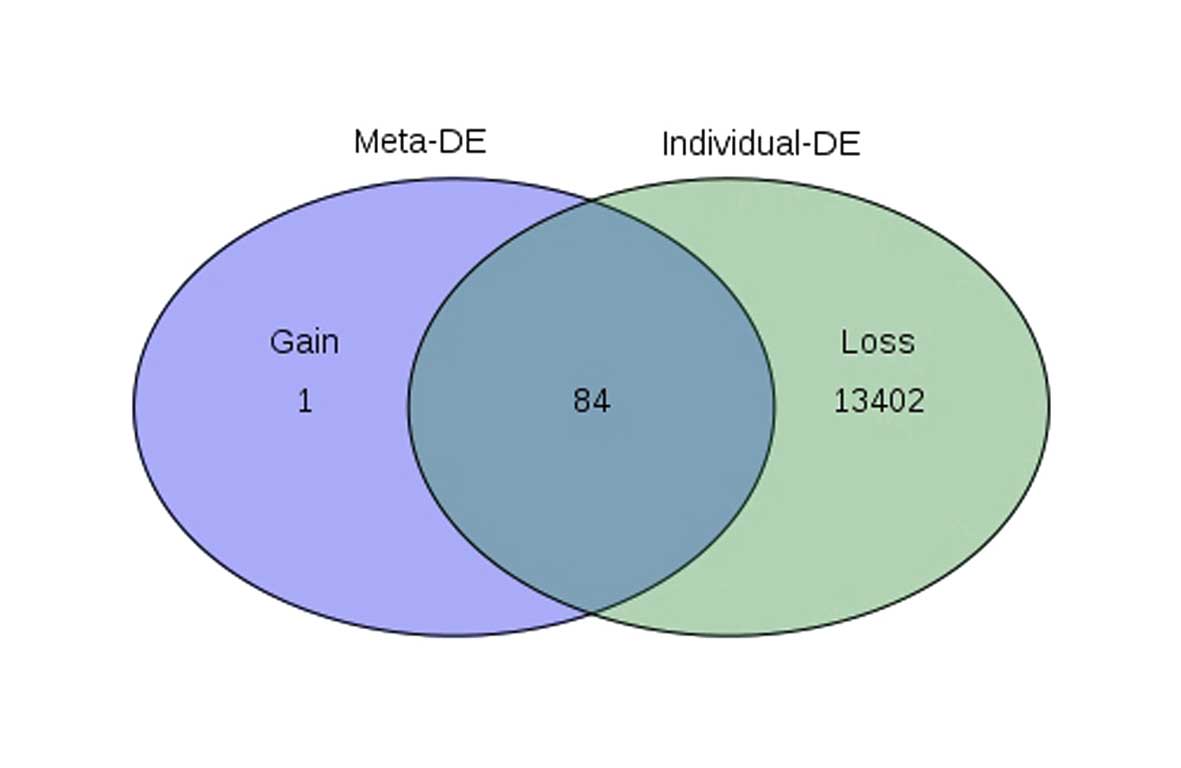
distribution. DE genes with P<0.05 were selected. In the current
analysis, 1 'gained' gene and 13402 'lost' genes were identified
(Fig. 1). Gained genes are DE
genes that were only identified in the meta-analysis (26). The single gained gene exhibited
relatively weak but consistent expression profiles across the three
different datasets. The large sample size obtained by consisting of
the datasets made it possible declare this a DE gene with increased
certainty. Lost genes are genes which were identified as DE genes
in any of the individual analyses, but not in the meta-analysis.
These genes also presented conflicting changes in expression
profiles, or large variations across the different studies.
Identification of differentially
expressed genes in OA
A total of 85 genes were identified, which were
consistently differentially expressed in OA. Among these 85 DE
genes, 30 were upregulated and 55 were downregulated. A list of the
top 20 upregulated and downregulated genes is shown in Table II The upregulated gene with the
lowest P-value (P=5.36E-07) was S-phase kinase-associated protein
2, E3 ubiquitin protein ligase (SKP2). The downregulated gene with
the lowest P-value (P=4.42E-09) was Proline rich 5 like
(PRR5L).
| Table IITop 20 upregulated and downregulated
genes in patients with OA. |
Table II
Top 20 upregulated and downregulated
genes in patients with OA.
A, Top 20 upregulated
genes
|
|---|
| Entrez ID | Gene symbol | Combined ES | P-value | Gene name |
|---|
| 6502 | SKP2 | −1.1447 | 5.36E-07 | S-phase
kinase-associated protein 2, E3 ubiquitin protein ligase |
| 23299 | BICD2 | −1.0632 | 4.24E-06 | Bicaudal D homolog 2
(Drosophila) |
| 8445 | DYRK2 | −0.8747 | 0.000592 | Dual-specificity
tyrosine-(Y)-phosphorylation regulated kinase 2 |
| 10116 | FEM1B | −0.9170 | 0.000842 | Fem-1 homolog b
(C. elegans) |
| 87 | ACTN1 | −0.8544 | 0.000842 | Actinin, α 1 |
| 147906 | DACT3 | −0.8450 | 0.000867 | Dishevelled-binding
antagonist of β-catenin 3 |
| 6627 | SNRPA1 | −0.7981 | 0.002369 | Small nuclear
ribonucleoprotein polypeptide A' |
| 84458 | LCOR | −0.7596 | 0.004996 | Ligand dependent
nuclear receptor corepressor |
| 55670 | PEX26 | −0.7396 | 0.007656 | Peroxisomal
biogenesis factor 26 |
| 284273 | ZADH2 | −0.7241 | 0.009756 | Zinc binding
alcohol dehydrogenase domain containing 2 |
| 2983 | GUCY1B3 | −0.7239 | 0.009756 | Guanylate cyclase
1, soluble, β 3 |
| 90550 | MCU | −0.7115 | 0.012319 | Mitochondrial
calcium uniporter |
| 359845 | FAM101B | −0.7042 | 0.014203 | Family with
sequence similarity 101, member B |
| 158381 | ATP8B5P | −0.7025 | 0.014203 | ATPase, classI,
type 8B, member 5, pseudogene |
| 92014 | MCART1 | −0.7010 | 0.014203 | Mitochondrial
carrier triple repeat 1 |
| 57456 | KIAA1143 | −0.6989 | 0.014452 | KIAA1143 |
| 51002 | TPRKB | −0.6918 | 0.015972 | TP53RK binding
protein |
| 84953 | MICALCL | −0.9119 | 0.015993 | MICAL C-terminal
like |
| 80071 | CCDC15 | −0.7894 | 0.018113 | Coiled-coil domain
containing 15 |
| 160 | DAB2 | −1.0979 | 0.049846 | Dab,
mitogen-responsive phosphoprotein, homolog 2
(Drosophila) |
B, Top 20
downregulated genes
|
|---|
| Entrez ID | Gene symbol | Combined ES | P-value | Gene name |
|---|
| 79899 | PRR5L | 1.3235 | 4.42E-09 | Proline rich 5
like |
| 5583 | PRKCH | 1.2343 | 5.08E-08 | Protein kinase C,
η |
| 3683 | ITGAL | 1.2126 | 6.62E-08 | Integrin, α L |
| 5051 | PAFAH2 | 1.0668 | 4.24E-06 | Platelet-activating
factor acetylhydrolase 2, 40kDa |
| 24144 | TFIP11 | 0.9820 | 4.31E-05 | Tuftelin
interacting protein 11 |
| 9595 | CYTIP | 0.9816 | 4.31E-05 | Cytohesin 1
interacting protein |
| 157567 | ANKRD46 | 1.0119 | 7.59E-05 | Ankyrin repeat
domain 46 |
| 23294 | ANKS1A | 0.9547 | 7.60E-05 | Ankyrin repeat and
sterile α motif domain containing 1A |
| 55272 | IMP3 | 1.2776 | 0.001032 | IMP3, U3 small
nucleolar ribonucleoprotein |
| 80213 | TM2D3 | 1.0182 | 0.001425 | TM2 domain
containing 3 |
| 474344 | GIMAP6 | 1.1551 | 0.004506 | GTPase, IMAP family
member 6 |
| 55303 | GIMAP4 | 1.2787 | 0.008432 | GTPase, IMAP family
member 4 |
| 10866 | HCP5 | 1.1647 | 0.001232 | HLA complex P5
(non-protein coding) |
| 54499 | TMCO1 | 1.0355 | 0.014452 | Transmembrane and
coiled-coil domains 1 |
| 951 | CD37 | 1.0423 | 0.023921 | CD37 molecule |
| 50650 | ARHGEF3 | 1.0568 | 0.025483 | ρ guanine
nucleotide exchange factor (GEF) 3 |
| 56833 | SLAMF8 | 1.0983 | 0.033534 | SLAM family member
8 |
| 65992 | DDRGK1 | 1.4283 | 0.033711 | DDRGK domain
containing 1 |
| 112858 | TP53RK | 1.7509 | 0.036334 | TP53 regulating
kinase |
| 4236 | MFAP1 | 1.2892 | 0.047164 |
Microfibrillar-associated protein 1 |
Identification of differentially
expressed genes in the synovial membrane of patients with OA
An additional meta-analysis was performed on the
results from the 2 synovial membrane samples, following exclusion
of the third study, which used peripheral blood. A list of the top
20 upregulated and downregulated genes is shown in Table III. The upregulated genes with
the lowest P-values (both P=0.004003) were JAZF zinc finger 1
(JAZF1) and Guanine nucleotide binding protein (G-protein), β
polypeptide 4 (GNB4), which are involved in coupling membrane
receptors to effector proteins, such as ion channels and enzymes
(27). The downregulated gene with
the largest ES (ES=2.0472; P=0.004003) was multiple
inositol-polyphosphate phosphatase 1 (MINPP1). A number of the
downregulated genes were related to inflammatory factors (Table III).
| Table IIITop 10 upregulated and downregulated
genes in the synovial membrane of patients with OA. |
Table III
Top 10 upregulated and downregulated
genes in the synovial membrane of patients with OA.
A, Upregulated
genes
|
|---|
| Entrez ID | Gene symbol | Combined ES | P-value | Gene name |
|---|
| 221895 | JAZF1 | −1.6865 | 0.004003 | JAZF zinc finger
1 |
| 59345 | GNB4 | −1.6774 | 0.004003 | Guanine nucleotide
binding protein (G protein), β polypeptide 4 |
| 3070 | HELLS | −1.6193 | 0.005903 | Helicase,
lymphoid-specific |
| 9749 | PHACTR2 | −1.5892 | 0.005903 | Phosphatase and
actin regulator 2 |
| 9645 | MICAL2 | −1.5726 | 0.006072 | Microtubule
associated monooxygenase, calponin and LIM domain containing 2 |
| 10974 | C10orf116 | −1.5715 | 0.006072 | Adipogenesis
regulatory factor |
| 283310 | OTOGL | −1.5624 | 0.006072 | Otogelin-like |
| 26230 | TIAM2 | −1.5531 | 0.006563 | T-cell lymphoma
invasion and metastasis 2 |
| 51194 | IPO11 | −1.5378 | 0.006822 | Importin 11 |
| 1404 | HAPLN1 | −1.5176 | 0.007348 | Hyaluronan and
proteoglycan link protein 1 |
B, Downregulated
genes
|
|---|
| Entrez ID | Gene symbol | Combined ES | P-value | Gene name |
|---|
| 27242 | TNFRF21 | 1.8378 | 0.003981 | Tumor necrosis
factor receptor superfamily, member 21 |
| 84225 | ZMYND15 | 1.8026 | 0.003981 | Zinc finger,
MYND-type containing 15 |
| 9562 | MINPP1 | 2.0472 | 0.004003 | Multiple
inositol-polyphosphate phosphatase 1 |
| 3600 | IL15 | 1.9554 | 0.004003 | Interleukin 15 |
| 3487 | IGFBP4 | 1.7005 | 0.004003 | Insulin-like growth
factor binding protein 4 |
| 54504 | CPVL | 1.6845 | 0.004003 | Carboxypeptidase,
vitellogenic-like |
| 9450 | LY86 | 1.6796 | 0.004003 | Lymphocyte antigen
86 |
| 147798 | TMC4 | 1.6305 | 0.004882 | Transmembrane
channel-like 4 |
| 834 | CASP1 | 1.5939 | 0.005903 | Caspase 1,
apoptosis-related cysteine peptidase |
| 83401 | ELOVL3 | 1.8314 | 0.006822 | ELOVL fatty acid
elongase 3 |
Functional analysis
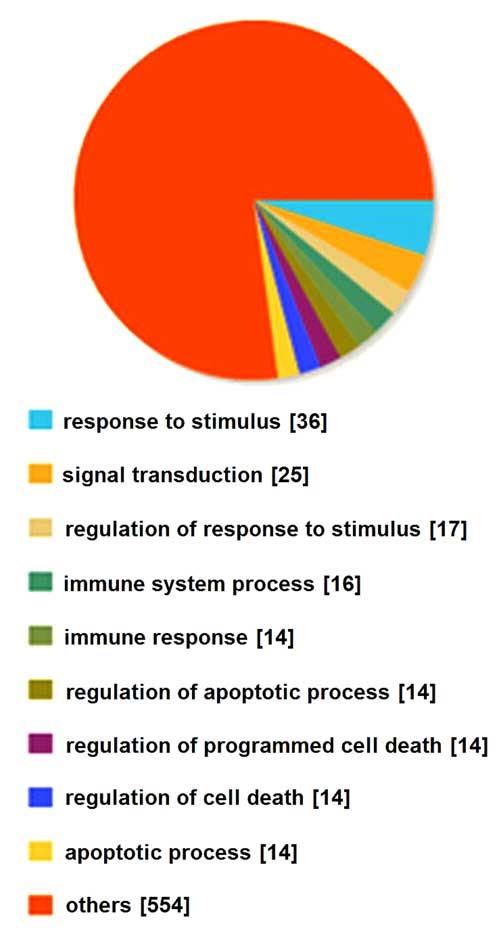
GO analysis of the DE genes was performed in order
to identify the biological processes associated with changes in
gene expression in OA. The analysis identified 210 significant
enrichments of the DE genes, which were categorized to 10 GO terms
(Fig. 2). The two enrichments with
the lowest P-values were in the GO category of 'Immune response',
with a P-value of 0.000129438, and 'Immune effector process', with
a P-value of 0.000288619. Other significant GO categories included
'Regulation of humoral immune response' (P=0.000308832),
'Regulation of immune response' (P=0.00055514) and 'Positive
regulation of immune system process' (P=0.00059351; Table IV).
| Table IVTop 10 enriched GO terms among the DE
genes in patients with OA compared with controls. |
Table IV
Top 10 enriched GO terms among the DE
genes in patients with OA compared with controls.
| GO ID | Term | P-value | Genes |
|---|
| GO:0006955 | Immune
response | 0.000129438 | ITGAL, GIMAP5,
INPP5D, LAX1, GZMA, IRF1, CST7, SKAP1, CD55, TNFRSF4, CD37, CX3CR1,
HLA-C, CXCL3 |
| GO:0002252 | Immune effector
process | 0.000288619 | ITGAL, GIMAP5,
INPP5D, IRF1, CD55, TNFRSF4, CD37, CX3CR1 |
| GO:0002920 | Regulation of
humoral immune response | 0.000308832 | GIMAP5, CD55,
CD37 |
| GO:0042981 | Regulation of
apoptotic process | 0.000510947 | PRKCH, SKP2,
PAFAH2, TMBIM6, GIMAP5; DYRK2, ACTN1, FEM1B, INPP5D, GZMA, IRF1,
TNFRSF4, CX3CR1, ARHGEF3 |
| GO:0051250 | Negative regulation
of lymphocyte activation | 0.000517654 | GIMAP5, INPP5D,
LAX1, IRF1 |
| GO:0045589 | Regulation of
regulatory T cell differentiation | 0.000531439 | GIMAP5, IRF1 |
| GO:0043067 | Regulation of
programmed cell death | 0.000551712 | PRKCH, SKP2,
PAFAH2, TMBIM6, GIMAP5, DYRK2, ACTN1, FEM1B, INPP5D, GZMA, IRF1,
TNFRSF4, CX3CR1, ARHGEF3 |
| GO:0050776 | Regulation of
immune response | 0.000555143 | PRKCH, ITGAL,
GIMAP5, INPP5D, IRF1, SKAP1, CD55, CD37, HLA-C |
| GO:0002684 | Positive regulation
of immune system process | 0.000593511 | PRKCH, ITGAL,
GIMAP5, INPP5D, IRF1, SKAP1, CD55, TNFRSF4, CD37 |
| GO:0010941 | Regulation of cell
death | 0.000708372 | PRKCH, SKP2,
PAFAH2, TMBIM6, GIMAP5, DYRK2, ACTN1, FEM1B, INPP5D, GZMA, IRF1,
TNFRSF4, CX3CR1, ARHGEF3 |
Discussion
A number of genes are differentially expressed genes
between patients with OA and healthy controls, and it is necessary
to identify the genes that may enhance understanding of the
molecular and cellular processes, which are involved in the
pathogenesis of OA. Although a large quantity of data may be
produced using microarray studies, the small sample size of these
studies is a significant obstacle to the identification of DE
genes. A meta-analysis of multiple microarray datasets increases
the sample size, rendering the identification of DE genes more
reliable.
In the present study, a meta-analysis was performed
using three publicly available GEO datasets in order to identify
common biological mechanisms involved in the pathogenesis of OA.
The analysis identified 85 genes that were consistently
differentially expressed in OA (30 upregulated and 55
downregulated). The upregulated gene with the largest ES was SKP2,
which is known to be involved in the inhibition of cell growth and
the promotion of apoptosis. Kitagawa concluded that SKP2 controls
the p300–p53 signaling pathway in cancer cells (28). Furthermore, this gene encodes a
member of the F-box protein family, which is characterized by a ~40
amino acid motif, the F-box (29).
The downregulated gene with the lowest P-value was PRR5L, which
suppresses mTOR complex 2 (mTORC2)-mediated hydrophobic motif
phosphorylation of protein kinase C, but not that of protein kinase
B (30). In addition, the PRR5L
protein may function to modulate the activity of mTORC2 in a
substrate-dependent manner (30).
Actinin α 1 (ACTN1), an upregulated gene, encodes an actin-binding
protein, which exerts multiple effects in a variety of cell types.
ACTN1 may protect osteoclasts from tumor necrosis factor-α (TNF-α);
induce apoptosis through increasing the expression of the
anti-apoptotic protein, Bcl-2; activate survival signals; and
promote Akt phosphorylation and NF-κB activation (31). Although it is currently unclear
exactly how these genes contribute to OA, they may be useful as
potential biomarkers to facilitate early diagnosis or to monitor
the efficacy of treatment in this disease. A number of these genes
provide insights into the molecular mechanisms underlying the
pathophysiology of OA.
Although osteoarthritis (OA) is understood to be a
degradative articular cartilage disease, there is increasing data
demonstrating the involvement of the immune system. In recent
epidemiological studies involving a large number of patients with
OA, an inflammatory synovium has been shown to be involved in
increased damage to the cartilage (32) and pain (33). Immune cells, such as T cells, B
cells and macrophages, have been identified in the synovial tissue
of patients with OA (34–36). Furthermore, immunoglobulins and
immune complexes against cartilage components have been detected in
the plasma, synovium and cartilage of patients with OA (37), and it has been shown that the
synovium is involved in complement activation in OA (38). In the present study, 210
significantly enriched GO terms associated with the DE genes were
identified using a meta-analysis. The three enriched terms with the
lowest P-values were 'Immune response', 'Immune effector process'
and 'Regulation of humoral immune response', which were all
involved in the immune system. The identified GO terms may be
grouped into a smaller number of categories: 'Response to
stimulus', 'Signal transduction', 'Regulation of response to
stimulus', 'Immune system process', 'Immune response', 'Regulation
of apoptotic process', 'Regulation of programmed cell death',
'Regulation of cell death', 'Apoptotic process' and others.
Although it is difficult to identify all the significant functional
categories that are expressed differentially in OA, the GO
categories identified here, merit further investigation in
subsequent studies.
There were certain limitations to the present study,
which ought to be considered. Firstly, heterogeneity and
confounding factors may have distorted the analysis. Clinical
samples may have been heterogeneous with respect to clinical
activity, severity or gender. Secondly, there are differences in
gene expression between tissues, such as blood and synovial
membrane, that were not considered. Although an additional subgroup
analysis of the synovial membrane samples was performed, this only
included two studies. By contrast, the initial meta-analysis
integrated the results obtained from different tissues, which
should have enabled detection of the genes that may have been
missed in an analysis of two studies only.
In conclusion, the meta-analysis of microarray
studies that was performed in the present study, provided an
overview of differential gene expression in OA; identifying 85
differential expressed genes (30 upregulated and 55 downregulated
genes). Future studies to validate these genes as markers for the
diagnosis and response to biological therapy for OA may provide
further insight into their involvement in the development and
progression of OA.
Acknowledgments
This study was supported by the Key Scientific and
Technological Innovation Special Projects of Shaanxi '13115' of
China (grant no. 2009ZDKG-79) and the National Natural Science
Foundation of China (grant no. 81472924).
References
|
1
|
Aigner T, Rose J, Martin J and Buckwalter
J: Aging theories of primary osteoarthritis: From epidemiology to
molecular biology. Rejuvenation Res. 7:134–145. 2004. View Article : Google Scholar : PubMed/NCBI
|
|
2
|
Loeser RF, Goldring SR, Scanzello CR and
Goldring MB: Osteoarthritis: A disease of the joint as an organ.
Arthritis Rheum. 64:1697–1707. 2012. View Article : Google Scholar : PubMed/NCBI
|
|
3
|
Benito MJ, Veale DJ, FitzGerald O, van den
Berg WB and Bresnihan B: Synovial tissue inflammation in early and
late osteoarthritis. Ann Rheum Dis. 64:1263–1267. 2005. View Article : Google Scholar : PubMed/NCBI
|
|
4
|
Ma CH, Lv Q, Cao Y, et al: Genes relevant
with osteoarthritis by comparison gene expression profiles of
synovial membrane of osteoarthritis patients at different stages.
Eur Rev Med Pharmacol Sci. 18:431–439. 2014.PubMed/NCBI
|
|
5
|
Duan C, Guo X, Zhang XD, et al:
Comparative analysis of gene expression profiles between primary
knee osteoarthritis and an osteoarthritis endemic to Northwestern
China, Kashin-Beck disease. Arthritis Rheum. 62:771–780. 2010.
View Article : Google Scholar : PubMed/NCBI
|
|
6
|
Sellam J and Berenbaum F: The role of
synovitis in pathophysiology and clinical symptoms of
osteoarthritis. Nat Rev Rheumatol. 6:625–635. 2010. View Article : Google Scholar : PubMed/NCBI
|
|
7
|
Choi SJ, Rho YH, Ji JD, Song GG and Lee
YH: Genome scan meta-analysis of rheumatoid arthritis. Rheumatology
(Oxford). 45:166–170. 2006. View Article : Google Scholar
|
|
8
|
Golub TR, Slonim DK, Tamayo P, et al:
Molecular classification of cancer: Class discovery and class
prediction by gene expression monitoring. Science. 286:531–537.
1999. View Article : Google Scholar : PubMed/NCBI
|
|
9
|
Ramasamy A, Mondry A, Holmes CC and Altman
DG: Key issues in conducting a meta-analysis of gene expression
microarray datasets. PLoS Med. 5:e1842008. View Article : Google Scholar : PubMed/NCBI
|
|
10
|
Siddiqui AS, Delaney AD, Schnerch A,
Griffith OL, Jones SJ and Marra MA: Sequence biases in large scale
gene expression profiling data. Nucleic Acids Res. 34:e832006.
View Article : Google Scholar : PubMed/NCBI
|
|
11
|
Griffith OL, Melck A, Jones SJ and Wiseman
SM: Meta-analysis and meta-review of thyroid cancer gene expression
profiling studies identifies important diagnostic biomarkers. J
Clin Oncol. 24:5043–5051. 2006. View Article : Google Scholar : PubMed/NCBI
|
|
12
|
Rung J and Brazma A: Reuse of public
genome-wide gene expression data. Nat Rev Genet. 14:89–99. 2013.
View Article : Google Scholar
|
|
13
|
Cahan P, Rovegno F, Mooney D, Newman JC,
St Laurent G III and McCaffrey TA: Meta-analysis of microarray
results: Challenges, opportunities, and recommendations for
standardization. Gene. 401:12–18. 2007. View Article : Google Scholar : PubMed/NCBI
|
|
14
|
Lee YH and Nath SK: Systemic lupus
erythematosus susceptibility loci defined by genome scan
meta-analysis. Hum Genet. 118:434–443. 2005. View Article : Google Scholar : PubMed/NCBI
|
|
15
|
Lee YH, Witte T, Momot T, et al: The
mannose-binding lectin gene polymorphisms and systemic lupus
erythematosus: Two case-control studies and a meta-analysis.
Arthritis Rheum. 52:3966–3974. 2005. View Article : Google Scholar : PubMed/NCBI
|
|
16
|
Lee YH, Rho YH, Choi SJ, Ji JD and Song
GG: Ankylosing spondylitis susceptibility loci defined by
genome-search meta-analysis. J Hum Genet. 50:453–459. 2005.
View Article : Google Scholar : PubMed/NCBI
|
|
17
|
Lee YH, Rho YH, Choi SJ, Ji JD and Song
GG: Meta-analysis of genome-wide linkage studies for bone mineral
density. J Hum Genet. 51:480–486. 2006. View Article : Google Scholar : PubMed/NCBI
|
|
18
|
Xia J, Fjell CD, Mayer ML, Pena OM,
Wishart DS and Hancock RE: INMEX - a web-based tool for integrative
meta-analysis of expression data. Nucleic Acids Res. 41:W63–W70.
2013. View Article : Google Scholar : PubMed/NCBI
|
|
19
|
Barrett T, Troup DB, Wilhite SE, et al:
NCBI GEO: Archive for functional genomics data sets - 10 years on.
Nucleic Acids Res. 39:D1005–D1010. 2011. View Article : Google Scholar
|
|
20
|
Altman R, Asch E, Bloch D, et al:
Development of criteria for the classification and reporting of
osteoarthritis. Classification of osteoarthritis of the knee.
Diagnostic and Therapeutic Criteria Committee of the American
Rheumatism Association. Arthritis Rheum. 29:1039–1049. 1986.
View Article : Google Scholar : PubMed/NCBI
|
|
21
|
Bolstad BM, Irizarry RA, Astrand M and
Speed TP: A comparison of normalization methods for high density
oligonucleotide array data based on variance and bias.
Bioinformatics. 19:185–193. 2003. View Article : Google Scholar : PubMed/NCBI
|
|
22
|
Choi JK, Yu U, Kim S and Yoo OJ: Combining
multiple microarray studies and modeling interstudy variation.
Bioinformatics. 19(Suppl 1): i84–i90. 2003. View Article : Google Scholar : PubMed/NCBI
|
|
23
|
DerSimonian R and Laird N: Meta-analysis
in clinical trials. Control Clin Trials. 7:177–188. 1986.
View Article : Google Scholar : PubMed/NCBI
|
|
24
|
Falcon S and Gentleman R: Using GOstats to
test gene lists for GO term association. Bioinformatics.
23:257–258. 2007. View Article : Google Scholar
|
|
25
|
Ramos YF, Bos SD, Lakenberg N, et al:
Genes expressed in blood link osteoarthritis with apoptotic
pathways. Ann Rheum Dis. 73:1844–1853. 2013. View Article : Google Scholar : PubMed/NCBI
|
|
26
|
Lambert C, Dubuc JE, Montell E, et al:
Gene expression pattern of cells from inflamed and normal areas of
osteoarthritis synovial membrane. Arthritis Rheumatol. 66:960–968.
2014. View Article : Google Scholar : PubMed/NCBI
|
|
27
|
Ruiz-Velasco V, Ikeda SR and Puhl HL:
Cloning, tissue distribution, and functional expression of the
human G protein beta 4-subunit. Physiol Genomics. 8:41–50. 2002.
View Article : Google Scholar : PubMed/NCBI
|
|
28
|
Kitagawa M, Lee SH and McCormick F: Skp2
suppresses p53-dependent apoptosis by inhibiting p300. Mol Cell.
29:217–231. 2008. View Article : Google Scholar : PubMed/NCBI
|
|
29
|
Bai C, Sen P, Hofmann K, et al: SKP1
connects cell cycle regulators to the ubiquitin proteolysis
machinery through a novel motif, the F-box. Cell. 86:263–274. 1996.
View Article : Google Scholar : PubMed/NCBI
|
|
30
|
Gan X, Wang J, Wang C, et al: PRR5L
degradation promotes mTORC2-mediated PKC-δ phosphorylation and cell
migration downstream of Gα12. Nat Cell Biol. 14:686–696. 2012.
View Article : Google Scholar : PubMed/NCBI
|
|
31
|
Triplett JW and Pavalko FM: Disruption of
alpha-actinin-integrin interactions at focal adhesions renders
osteoblasts susceptible to apoptosis. Am J Physiol Cell Physiol.
291:C909–C921. 2006. View Article : Google Scholar : PubMed/NCBI
|
|
32
|
Ayral X, Pickering EH, Woodworth TG,
Mackillop N and Dougados M: Synovitis: A potential predictive
factor of structural progression of medial tibiofemoral knee
osteoarthritis - results of a 1 year longitudinal arthroscopic
study in 422 patients. Osteoarthritis Cartilage. 13:361–367. 2005.
View Article : Google Scholar : PubMed/NCBI
|
|
33
|
Hill CL, Hunter DJ, Niu J, et al:
Synovitis detected on magnetic resonance imaging and its relation
to pain and cartilage loss in knee osteoarthritis. Ann Rheum Dis.
66:1599–1603. 2007. View Article : Google Scholar : PubMed/NCBI
|
|
34
|
Revell PA, Mayston V, Lalor P and Mapp P:
The synovial membrane in osteoarthritis: A histological study
including the characterisation of the cellular infiltrate present
in inflammatory osteoarthritis using monoclonal antibodies. Ann
Rheum Dis. 47:300–307. 1988. View Article : Google Scholar : PubMed/NCBI
|
|
35
|
Sakkas LI, Scanzello C, Johanson N, et al:
T cells and T-cell cytokine transcripts in the synovial membrane in
patients with osteoarthritis. Clin Diagn Lab Immunol. 5:430–437.
1998.PubMed/NCBI
|
|
36
|
Nakamura H, Yoshino S, Kato T, Tsuruha J
and Nishioka K: T-cell mediated inflammatory pathway in
osteoarthritis. Osteoarthritis Cartilage. 7:401–402. 1999.
View Article : Google Scholar : PubMed/NCBI
|
|
37
|
Jasin HE: Immune mediated cartilage
destruction. Scand J Rheumatol Suppl. 76:111–116. 1988. View Article : Google Scholar : PubMed/NCBI
|
|
38
|
Wang Q, Rozelle AL, Lepus CM, et al:
Identification of a central role for complement in osteoarthritis.
Nat Med. 17:1674–1679. 2011. View
Article : Google Scholar : PubMed/NCBI
|