Introduction
Coronary heart disease (CHD) remains the leading
cause of morbidity and mortality amongst males and females in
western society and is of increasing concern in developing
countries, despite significant advances in elucidating its
underlying pathophysiology (1–5). It
was estimated that there were 7.4 million mortalities worldwide
from ischemic heart disease in 2012, which accounted for 13.2% of
total mortality (6). Furthermore,
it has been predicted that CHD will remain the leading cause of
mortality until at least 2020 (7).
There are numerous CHD risk factors, of which metabolic
abnormalities in blood lipids, in particular low-density
lipoprotein cholesterol (LDL-C) elevation and high-density
lipoprotein cholesterol (HDL-C) depression, are mainly involved in
the development and progression of CHD (8) and therefore represent a crucial
target for effective therapeutic intervention (9,10).
In epidemiological studies, genetics interacting with environmental
factors, including diet, nutritional status and physiological
parameters, have been shown to exert a significant effect on the
dysregulation of lipid metabolism (11–14).
Studies to elucidate the genetic contributions
underlying variations in plasma lipid and lipoprotein levels have
continued for several decades (15). Since 2007, genome-wide association
studies (GWAS) have implicated numerous common genetic variants in
multiple loci and genes as influences in the determination of lipid
and lipoprotein levels (16).
Recently, a comprehensive meta-analysis of the GWAS performed a
close linkage analysis between the PABPC4 rs4660293 locus
and plasma HDL-C concentrations (17). A further meta-analysis suggested
that the PABPC4 rs4660293 single nucleotide polymorphism
(SNP) was correlated with C-reactive protein (CRP) levels (18), high levels of which are associated
with increased risk of CHD mortality (19). Furthermore, Middelberg et al
(20) reported that the
PABPC4 influenced plasma HDL between adolescents and adults.
Poly(A) binding protein cytoplasmic 4 (inducible form;
PABPC4) is expressed in numerous cell types and is a homolog
of cytoplasmic poly(A) binding protein (PABPC), which predominantly
mediates the effect of the poly(A) tail on translation (21,22).
In addition to regulating translation initiation, PABPC controls
the rate of mRNA deadenylation and is involved in mRNA decay
(22). Teslovich et al
(17) hypothesized that the SNP of
rs4660293 was associated with HDL amongst populations of European
ancestry. However, how the genetic associations described will
apply to populations of diverse ancestry, particularly amongst
Chinese people remains elusive.
There are 56 ethnic groups in China, of which the
Han nationality is the largest group. The Mulao nationality is one
of the 55 Chinese minorities, with a population of 207,352
according to the fifth national census statistics of China in 2000
(23). Ninety percent of the Mulao
population reside in Luocheng Mulao Autonomous County, Guangxi
Zhuang Autonomous region, China, where their history dates back to
the Jin Dynasty (AD265–420) (24).
A previous study indicated that the genetic association between
individuals in the Mulao population and other minorities in Guangxi
was markedly closer than that between the Mulao and Han or Uighur
nationalities (25). The Mulao
nationality has become a valuable subgroup for use in population
genetic studies. However, to the best of our knowledge, there have
been no previous studies performed to evaluate the association
between the PABPC4 rs4660293 SNP and serum lipid levels in
this population. Therefore, the present study aimed to investigate
the association between the PABPC4 rs4660293 SNP and serum
lipid levels amongst the Guangxi Mulao and Han populations.
Materials and methods
Study subjects
In the present study, 727 unrelated subjects of
Mulao and 729 unrelated participants of Han Chinese heritage
randomly selected from stratified randomized samples from a
previous study by our group (26).
All subjects were rural agricultural workers residing in Luocheng
Mulao Autonomous County, Guangxi Zhuang Autonomous Region, China.
The Mulao subjects comprised 329 (45.25%) males and 398 (54.75%)
females, with a mean age of 52.92±15.24 years. The participants of
Han nationality comprised 324 (44.44%) males and 405 (55.56%)
females, with a mean age of 52.42±15.19 years. The total age range
of subjects was 16–92 years. Subjects with diseases associated with
atherosclerosis, CHD, diabetes or those who were using
lipid-lowering medication (including statins, fibrates,
beta-blockers, diuretics or hormones) were excluded from the study
prior to blood sampling. The study design was approved by the
Ethics Committee of the First Affiliated Hospital, Guangxi Medical
University, Nanning, China. Informed consent was obtained from all
subjects prior to their inclusion in the study.
Epidemiological survey
An epidemiological survey was performed according to
internationally standardized methods, following a common protocol
(27). Information regarding
demographic, socioeconomic status and lifestyle factors was
collected via standardized questionnaires (27). The intake of alcohol was quantified
as the number of liangs (~50 g) of rice wine, corn wine, rum, beer
or liquor consumed during the preceding 12 months. Alcohol
consumption was categorized into groups of ≤25 or >25 g alcohol
per day. Smoking status was categorized into groups of ≤20 or
>20 cigarettes per day. In the physical examination, several
parameters, including height, weight and waist circumference, were
measured. Sitting blood pressure was measured three times with a
mercury sphygmomanometer following 5 min of rest and the average
measurement was recorded. Systolic blood pressure was determined by
the first Korotkoff sound and diastolic blood pressure by the fifth
Korotkoff sound. Body weight, to the nearest 50 g, was measured
using a portable balance scale. Subjects were weighed wearing
minimal clothing with their shoes off. Height was measured, to the
nearest 0.5 cm, using a stadiometer. Body mass index (BMI;
kg/m2) was calculated using height and weight
measurements.
Biochemical measurements
Blood samples were obtained from subjects in a
fasting state. Biochemical parameters, including total cholesterol
(TC), triglyceride (TG), HDL-C and LDL-C, were measured using
enzymatic methods with commercially available kits (Tcho-1 and
TG-LH kits; Randox Laboratories Ltd., Crumlin, UK; Cholestest N HDL
and Cholestest LDL; Daiichi Pure Chemicals Co., Ltd., Tokyo,
Japan). Serum apolipoprotein (Apo) AI and ApoB concentrations were
quantified by the immunoturbidimetric immunoassay using a
commercial kit (APO CAL; cat. no. LP3023; Randox Laboratories, Ltd)
(25). Fasting blood glucose was
determined with a glucose meter (Accu-Chek; F. Hoffman-La Roche AG,
Basel, Switzerland).
DNA amplification and genotyping
Genomic DNA was isolated from peripheral blood
leukocytes using the phenol-chloroform method (26). The extracted DNA was stored at 4°C
prior to analysis. Genotyping of the PABPC4 rs4660293 SNP
was performed by polymerase chain reaction (PCR) and restriction
fragment length polymorphism (RFLP) analyses. PCR amplification was
performed using the following primers: Forward,
5′-CTCTGGGACCCTCTTCTT-3′ and reverse, 5′-CGTTTCACTTCGCTTTCT-3′
(Sangon Biotech Co., Ltd, Shanghai, China). Each amplification
reaction was performed in a total volume of 25 μl,
containing 2 μl genomic DNA, 1 μl of each primer (10
pmol/l), 12.5 μl 2x Taq PCR Mastermix (comprising 20
mM Tris-HCl, pH 8.3, 100 mM KCl, 3 mM MgCl2, 0.1 U
Taq polymerase/μl, 500 μM of each
deoxyribo-nucleotide; Sangon Biotech Co., Ltd) and 8.5 μl
double-distilled H2O (DNase/RNase-free). Processing
began at 95°C for 5 min, followed by 45 sec of denaturing at 94°C,
45 sec of annealing at 52°C and 1 min of extension at 72°C for 30
cycles. The amplification was completed by a final extension at
72°C for 7 min. Subsequently, 10 U TaqI enzyme was added
directly to the PCR products (10 μl) and digested at 65°C
overnight. Following restriction enzyme digestion of the amplified
DNA, genotypes were identified by electrophoresis on 2% ethidium
bromide-stained agarose gels and visualized using ultraviolet
illumination (Universal Hood II; Bio-Rad Laboratories, Inc.,
Hercules, CA, USA). Genotypes were subsequently scored by an
experienced reader blinded to the epidemiological and lipid
results, as follows: Genotype AA=1, genotype AG=2, genotype
GG=3.
DNA sequencing
Three samples analyzed by PCR-RFLP were also
evaluated by direct sequencing with an ABI Prism 3100 (Applied
Biosystems Life Technologies, Foster City, CA, USA) at the Shanghai
Sangon Biological Engineering Technology & Services Co., Ltd,
Shanghai, China.
Diagnostic criteria
The normal values of serum TC, TG, HDL-C, LDL-C,
ApoAI, ApoB levels and the ratio of ApoAI to ApoB as designated by
the Clinical Science Experiment Center (The First Affiliated
Hospital, Guangxi Medical University) were 3.10–5.17, 0.56–1.70,
0.91–1.81 and 2.70–3.20 mmol/l as well as 1.00–1.78, 0.63–1.14 and
1.00–2.50 g/l, respectively (26).
Hypertension was assessed according to the criteria outlined by the
1999 World Health Organization - International Society of
Hypertension Guidelines for the management of hypertension
(28). The categories of normal
weight, overweight and obesity were defined as a BMI of <24,
24–28 and >28 kg/m2, respectively (28).
Statistical analyses
Statistical analyses were performed using SPSS 16.0
(SPSS Inc., Chicago, IL, USA). Qualitative variables are expressed
as raw counts and percentages. Quantitative variables are presented
as the mean ± standard deviation, except serum TG levels, which are
presented as medians and interquartile ranges. General
characteristics between the Mulao and Han populations were compared
by Student's unpaired t-test. Genotypic and allelic frequencies
were calculated by direct counting and the standard goodness-of-fit
test was used to investigate departures from the Hardy-Weinberg
equilibrium. Differences in genotype distribution and gender ratio
between the populations were determined by χ2 analysis.
Analysis of covariance was used to evaluate the association between
specific genotypes and serum lipid parameters. Factors that may
influence serum lipid concentrations, including gender, age, BMI,
blood pressure, alcohol consumption and cigarette smoking, were
adjusted for statistical analysis. The association between serum
lipid levels, genotypes and environmental factors was assessed by
multiple linear regression analysis with stepwise modeling.
Differences among the genotypes were determined using the
Kruskal-Wallis test or the Wilcoxon-Mann-Whitney test. Two-tailed
P<0.05 was considered to indicate a statistically significant
difference between values.
Results
General characteristics and serum lipid
levels
The comparison between general characteristics and
serum lipid levels amongst the Mulao and Han populations are
summarized in Table I. BMI,
diastolic blood pressure and the ratio of ApoAI to ApoB were lower
in the Mulao population than those in the Han population
(P<0.05–0.01), whereas height, LDL-C and ApoB levels were higher
in the Mulao population than those in the Han population
(P<0.05–0.001). There were no significant differences in waist
circumference, systolic blood pressure, pulse pressure, glucose,
serum TC, TG, HDL-C, ApoAI, age distribution, gender ratio, the
percentage of smokers or alcohol consumption between the two ethnic
groups (P>0.05 for all).
 | Table IComparison of demographics, lifestyle
characteristics and serum lipid levels between Mulao and Han
populations. |
Table I
Comparison of demographics, lifestyle
characteristics and serum lipid levels between Mulao and Han
populations.
| Parameter | Han | Mulao | t
(χ2) | P-value |
|---|
| Subjects (n) | 729 | 727 | | |
| Male/Female | 324/405 | 329/398 | 0.097 | 0.756 |
| Age (years) | 52.42±15.19 | 52.92±15.24 | −0.622 | 0.534 |
| Height (cm) | 154.44±8.20 | 155.38±7.93 | −2.221 | 0.026 |
| Weight (kg) | 53.65±9.06 | 52.90±9.41 | 1.543 | 0.123 |
| Body mass index
(kg/m2) | 22.48±3.40 | 21.85±3.13 | 3.648 | <0.000 |
| Waist circumference
(cm) | 75.34±7.95 | 75.21±8.74 | 0.302 | 0.763 |
| Cigarette smoking,
n (%) |
| Nonsmoker | 515 (70.64) | 538 (74.00) | | |
| ≤20
cigarettes/day | 188 (25.79) | 162 (22.28) | 2.450 | 0.294 |
| >20
cigarettes/day | 26 (3.57) | 27 (3.72) | | |
| Alcohol
consumption, n (%) |
| Nondrinker | 559 (76.68) | 544 (74.79) | | |
| ≤25 g/day | 77 (10.56) | 64 (8.82) | 4.589 | 0.101 |
| >25 g/day | 93 (12.76) | 119 (16.39) | | |
| Systolic blood
pressure (mmHg) | 130.27±19.36 | 129.43±22.00 | 0.779 | 0.436 |
| Diastolic blood
pressure (mmHg) | 82.47±11.06 | 81.00±11.38 | 2.496 | 0.013 |
| Pulse pressure
(mmHg) | 47.80±14.56 | 48.43±16.45 | −0.763 | 0.445 |
| Glucose
(mmol/l) | 6.04±1.60 | 6.01±1.64 | 0.294 | 0.769 |
| Total cholesterol
(mmol/l) | 5.01±1.02 | 5.10±1.08 | −1.795 | 0.073 |
| Triglycerides
(mmol/l) | 1.07 (0.85) | 1.07 (0.76) | −0.389 | 0.697 |
| HDL-C (mmol/l) | 1.74±0.54 | 1.78±0.45 | −1.801 | 0.072 |
| LDL-C (mmol/l) | 2.87±0.82 | 3.01±0.86 | −3.233 | 0.001 |
| Apo AI (g/l) | 1.34±0.26 | 1.34±0.40 | 0.138 | 0.890 |
| Apo B (g/l) | 0.85±0.20 | 1.01±0.59 | −6.613 | <0.000 |
| Apo AI/Apo B | 1.65±0.50 | 1.57±0.76 | 2.432 | 0.015 |
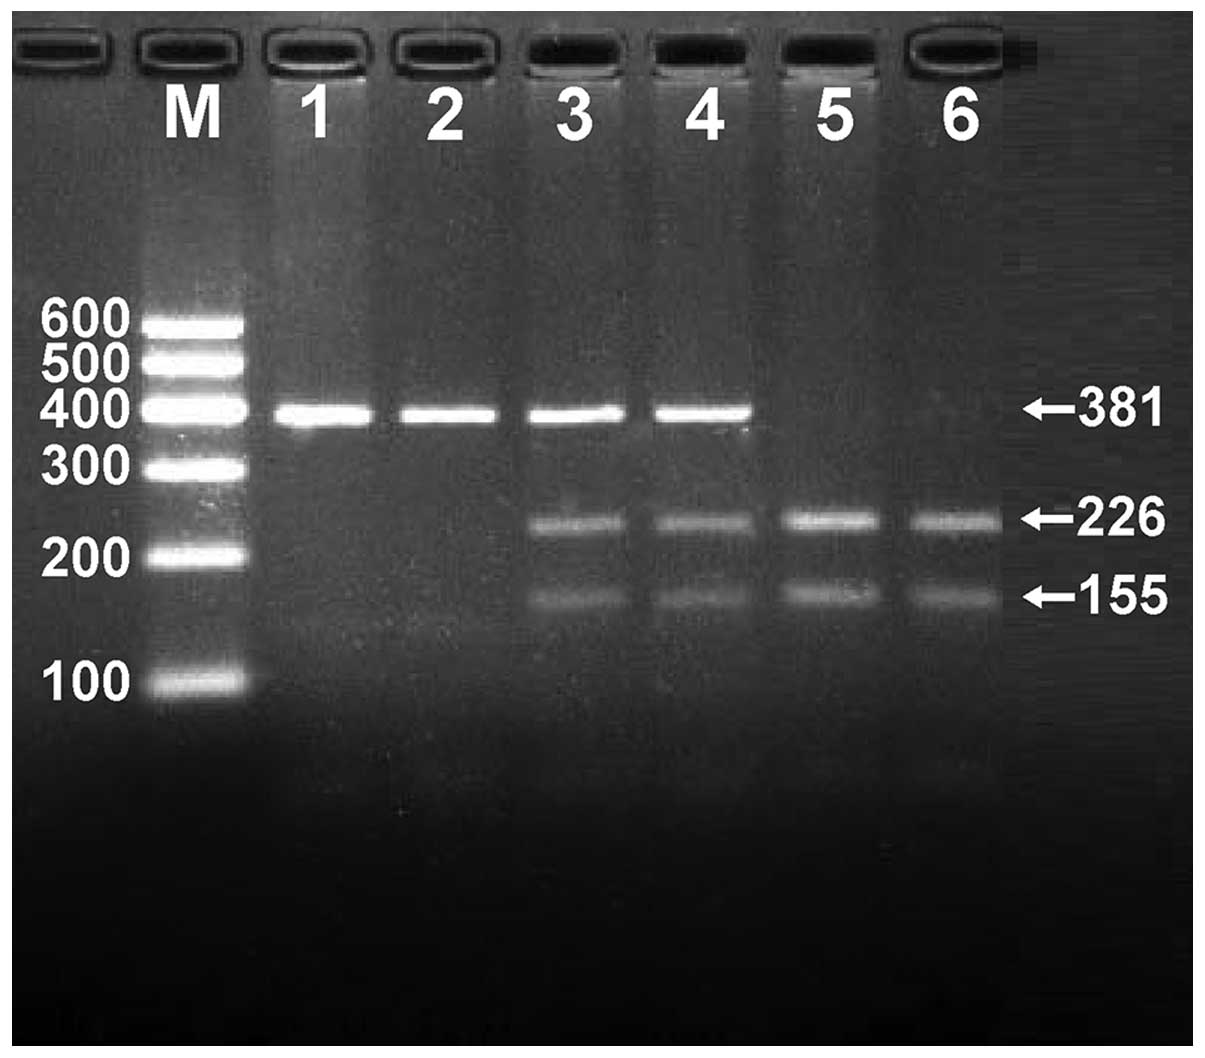
Results of electrophoresis and
genotyping
Genomic DNA collected from the sample populations
was amplified by PCR and imaged by 2.0% agarose gel
electrophoresis. The 381 bp nucleotide sequence gene of interest
was detected in all samples (Fig.
1). The genotypes identified were named according to the
presence or absence of enzyme restriction sites, with an A to G SNP
at rs4660293. The presence of the cutting site indicated the G
allele, while its absence indicated the A allele, which could not
be cut. Therefore, the AA genotype was homozygous for the absence
of the site (band at 381 bp), the AG genotype was heterozygous for
the absence and presence of the site (bands at 381, 226 and 155 bp)
and the GG genotype was homozygous for the presence of the site
(bands at 226 and 155 bp; Fig.
2).
Results of sequencing
The results were separated into AA, AG and GG
genotypes of the rs4660293 SNP by PCR-RFLP and the genotypes were
further confirmed by sequencing (Fig.
3).
Genotypic and allelic frequencies
The genotypic and allelic distributions of the
rs4660293 SNP are outlined in Table
II. There was no significant difference in genotypic or allelic
frequencies between the Mulao and Han populations. Differences in
the genotypic and allelic frequencies were detected between Mulao
males and females (P<0.05), but not between Han males and
females. The frequency of the minor G allele in the Mulao
population was higher in males (22.12%) than in females (13.44%,
P=0.017).
| Table IIComparison of the genotype and allele
frequencies of single nucleotide polymorphism in the Mulao and Han
populations [n (%)]. |
Table II
Comparison of the genotype and allele
frequencies of single nucleotide polymorphism in the Mulao and Han
populations [n (%)].
| Group | N | Genotype
| Allele
|
|---|
| AA | AG | GG | A | | G |
|---|
| Han | 729 | 555 (76.13) | 163 (22.36) | 11 (1.51) | 1273 (87.31) | | 185 (12.69) |
| Mulao | 727 | 566 (77.85) | 153 (21.05) | 8 (1.10) | 1285 (88.38) | | 169 (11.62) |
| χ2 | | | 0.895 | | | 0.774 | |
| P-value | | | 0.639 | | | 0.379 | |
| Han |
| Male | 324 | 250 (77.16) | 66 (20.37) | 8 (2.47) | 566 (87.35) | | 82 (12.65) |
| Female | 405 | 305 (75.31) | 97 (23.95) | 3 (0.74) | 707 (87.28) | | 103 (12.72) |
| χ2 | | | 4.677 | | | 0.001 | |
| P-value | | | 0.096 | | | 0.972 | |
| Mulao |
| Male | 329 | 268 (81.46) | 60 (18.24) | 1 (0.30) | 596 (77.88) | | 62 (22.12) |
| Female | 398 | 298 (74.87) | 93 (23.37) | 7 (1.76) | 689 (86.56) | | 107 (13.44) |
| χ2 | | | 6.719 | | | 5.666 | |
| P-value | | | 0.035 | | | 0.017 | |
Genotypes and serum lipid levels
As depicted in Table
III, the levels of LDL-C in the Han population varied between
the AA and AG/GG genotypes (P<0.05). Following adjustments for
age, gender, BMI, blood pressure, cigarette smoking and alcohol
consumption, the G allele carriers were found to have higher LDL-C
levels than the G allele non-carriers. Serum lipid parameters were
analyzed according to gender and it was revealed that female, but
not male G allele carriers in the Han population had higher TC,
HDL-C and ApoAI levels, than G allele non-carriers (P<0.05 for
each). Female, but not male G allele carriers in the Mulao
population had lower TC and HDL-C levels than the G allele
non-carriers (P<0.05 for each).
| Table IIIComparison of the lipid and
Apolipoprotein levels between genotypes of Mulao and Han population
[n (%)]. |
Table III
Comparison of the lipid and
Apolipoprotein levels between genotypes of Mulao and Han population
[n (%)].
| Ethnic
genotype | N | TC (mmol/l) | TG (mmol/l) | HDL-C (mmol/l) | LDL-C (mmol/l) | Apo AI
(mmol/l) | Apo B (mmol/l) | ApoAI/ApoB |
|---|
| Han |
| AA | 555 | 4.97±1.05 | 1.08 (0.77) | 1.71±0.43 | 2.83±0.82 | 1.34±0.27 | 0.85±0.20 | 1.65±0.51 |
| AG/GG | 174 | 5.11±0.92 | 0.98 (1.14) | 1.81±0.78 | 2.98±0.80 | 1.36±0.25 | 0.87±0.19 | 1.65±0.47 |
| F-value | | −1.587 | −0.888 | −1.688 | −2.073 | −1.083 | −1.152 | 0.135 |
| P-value | | 0.113 | 0.375 | 0.093 | 0.038 | 0.279 | 0.255 | 0.893 |
| Han/male |
| AA | 250 | 5.20±1.14 | 1.22 (0.89) | 1.68±0.43 | 2.89±0.85 | 1.37±0.29 | 0.91±0.21 | 1.58±0.51 |
| AG/GG | 74 | 5.24±0.97 | 1.28 (1.25) | 1.65±0.41 | 3.04±0.74 | 1.33±0.27 | 0.93±0.19 | 1.49±0.37 |
| F-value | | −0.282 | −0.017 | 0.537 | −1.427 | 0.826 | −0.705 | 1.659 |
| P-value | | 0.778 | 0.986 | 0.592 | 0.155 | 0.411 | 0.482 | 0.099 |
| Han/female |
| AA | 305 | 4.79±0.94 | 1.00 (0.62) | 1.74±0.42 | 2.79±0.80 | 1.31±0.25 | 0.80±0.18 | 1.72±0.50 |
| AG/GG | 100 | 5.02±0.88 | 0.87 (0.86) | 1.94±0.96 | 2.94±0.85 | 1.38±0.23 | 0.83±0.18 | 1.76±0.50 |
| F-value | | −2.193 | −0.969 | −2.055 | −1.553 | −2.449 | −1.214 | −0.857 |
| P-value | | 0. 029 | 0.333 | 0.042 | 0.121 | 0.015 | 0.226 | 0.392 |
| Mulao |
| AA | 566 | 5.14±1.04 | 1.07 (0.77) | 1.79±0.45 | 3.03±0.85 | 1.35±0.39 | 1.02±0.60 | 1.56±0.68 |
| AG/GG | 161 | 4.98±1.18 | 1.07 (0.68) | 1.75±0.47 | 2.95±0.90 | 1.31±0.42 | 0.97±0.54 | 1.60±0.97 |
| F-value | | 1.632 | −0.955 | 0.981 | 1.029 | 1.026 | 0.861 | −0.668 |
| P-value | | 0.103 | 0.344 | 0.327 | 0.304 | 0.305 | 0.399 | 0.505 |
| Mulao/male |
| AA | 268 | 5.05±1.09 | 1.11 (0.96) | 1.74±0.51 | 2.93±0.83 | 1.34±0.39 | 1.06±0.69 | 1.54±0.68 |
| AG/GG | 61 | 5.08±1.10 | 1.10 (0.99) | 1.76±0.53 | 2.91±0.86 | 1.30±0.50 | 0.96±0.48 | 1.54±0.82 |
| F-value | | −0.242 | −0.12 | −0.36 | 0.177 | 0.666 | 1.026 | −0.024 |
| P-value | | 0.809 | 0.904 | 0.719 | 0.866 | 0.506 | 0.305 | 0.981 |
| Mulao/female |
| AA | 298 | 5.22±0.99 | 1.04 (0.64) | 1.84±0.37 | 3.12±0.85 | 1.35±0.39 | 0.98±0.49 | 1.58±0.69 |
| AG/GG | 100 | 4.92±1.23 | 1.01 (0.60) | 1.74±0.43 | 2.98±0.92 | 1.31±0.36 | 0.98±0.58 | 1.64±1.05 |
| F-value | | 2.466 | −0.98 | 2.12 | 1.411 | 0.803 | 0.023 | −0.701 |
| P-value | | 0.014 | 0.327 | 0.035 | 0.159 | 0.422 | 0.982 | 0.483 |
Risk factors for serum lipid
parameters
As described in Table
IV, multiple linear regression analyses indicated that the
levels of TC, HDL-C, ApoAI and ApoB in the Han population, but not
the Mulao population, were correlated with the genotype
(P<0.05). When the regression analysis was performed according
to gender, it was revealed that the levels of TC, HDL-C and ApoAI
in the Han population and TC and HDL-C in the Mulao population were
associated with genotypes in females but not in males of the
respective population (P<0.05–0.001).
| Table IVCorrelation between serum lipid
parameters and genotypes in Mulao and Han populations. |
Table IV
Correlation between serum lipid
parameters and genotypes in Mulao and Han populations.
| Lipid
parameter | Genotype | Unstandardized
coefficient | Std. error | Standardized
coefficient | t | P-value |
|---|
| Han |
| TC | Genotype | 0.218 | 0.081 | 0.099 | 2.696 | 0.007 |
| HDL-C | Genotype | 0.129 | 0.048 | 0.103 | 2.667 | 0.008 |
| ApoAI | Genotype | 0.050 | 0.022 | 0.083 | 2.301 | 0.022 |
| ApoB | Genotype | 0.032 | 0.015 | 0.072 | 2.171 | 0.030 |
| Han/female |
| TC | Genotype | 0.229 | 0.101 | 0.107 | 2.271 | 0.024 |
| HDL-C | Genotype | 0.237 | 0.072 | 0.167 | 3.292 | 0.001 |
| ApoAI | Genotype | 0.091 | 0.028 | 0.162 | 3.239 | 0.001 |
| Mulao/female |
| TC | Genotype | −0.300 | 0.119 | −0.122 | −2.528 | 0.012 |
| HDL-C | Genotype | −0.097 | 0.043 | −0.108 | −2.251 | 0.025 |
Serum lipid parameters were also found to correlate
with lifestyle factors, including gender, age, BMI, waist
circumference, glucose, alcohol consumption, cigarette smoking and
blood pressure amongst the two ethnic groups (P<0.05–0.001;
Tables V and VI).
| Table VCorrelation between the lipid
parameters and relative factors in Mulao and Han populations. |
Table V
Correlation between the lipid
parameters and relative factors in Mulao and Han populations.
| Lipid
parameter | Risk factor | Unstandardized
coefficient | Std. error | Standardized
Coefficient | t | P-value |
|---|
| Han and Mulao |
| TC | Waist
circumference | 0.014 | 0.004 | 0.114 | 3.188 | 0.001 |
| Age | 0.012 | 0.002 | 0.175 | 6.709 | <0.001 |
| Body mass
index | 0.036 | 0.011 | 0.116 | 3.229 | 0.001 |
| Ethnic group | 0.155 | 0.054 | 0.076 | 2.879 | 0.004 |
| TG | Waist
circumference | 0.040 | 0.005 | 0.258 | 7.407 | <0.001 |
| Alcohol
consumption | 0.005 | 0.001 | 0.140 | 5.530 | <0.001 |
| Glucose | 0.093 | 0.020 | 0.116 | 4.568 | <0.001 |
| Body mass
index | 0.028 | 0.013 | 0.071 | 2.058 | 0.040 |
| HDL-C | Waist
circumference | −0.008 | 0.002 | −0.136 | −3.674 | <0.001 |
| Alcohol
consumption | 0.001 | 0.000 | 0.119 | 4.011 | <0.001 |
| Gender | 0.112 | 0.030 | 0.113 | 3.715 | <0.001 |
| Age | 0.002 | 0.001 | 0.055 | 2.101 | 0.036 |
| Body mass
index | −0.015 | 0.005 | −0.099 | −2.764 | 0.006 |
| LDL-C | Body mass
index | 0.037 | 0.009 | 0.147 | 4.109 | <0.001 |
| Age | 0.010 | 0.001 | 0.173 | 6.649 | <0.001 |
| Ethnic group | 0.161 | 0.045 | 0.096 | 3.623 | <0.001 |
| Alcohol
consumption | −0.002 | 0.001 | −0.072 | −2.724 | 0.007 |
| Waist
circumference | 0.009 | 0.004 | 0.094 | 2.620 | 0.009 |
| ApoAI | Alcohol
consumption | 0.002 | 0.000 | 0.216 | 7.214 | <0.001 |
| Waist
circumference | −0.004 | 0.001 | −0.098 | −3.560 | <0.001 |
| Gender | 0.048 | 0.021 | 0.071 | 2.331 | 0.020 |
| Apo B | Waist
circumference | 0.011 | 0.001 | 0.208 | 7.975 | <0.001 |
| Ethnic group | 0.158 | 0.023 | 0.176 | 6.826 | <0.001 |
| Glucose | 0.033 | 0.007 | 0.119 | 4.548 | <0.001 |
| Pulse pressure | 0.002 | 0.001 | 0.061 | 2.322 | 0.020 |
| ApoAI/Apo B | Waist
circumference | −0.014 | 0.003 | −0.183 | −5.012 | <0.001 |
| Glucose | −0.041 | 0.010 | −0.103 | −3.969 | <0.001 |
| Alcohol
consumption | 0.002 | 0.000 | 0.131 | 4.520 | <0.001 |
| Body mass
index | −0.021 | 0.007 | −0.112 | −3.152 | 0.002 |
| Gender | 0.118 | 0.038 | 0.092 | 3.105 | 0.002 |
| Han |
| TC | Waist
circumference | 0.021 | 0.006 | 0.178 | 3.662 | <0.001 |
| Age | 0.015 | 0.002 | 0.232 | 6.345 | <0.001 |
| Alcohol
consumption | 0.003 | 0.001 | 0.117 | 3.168 | 0.002 |
| Body mass
index | 0.029 | 0.013 | 0.107 | 2.223 | 0.027 |
| TG | Waist
circumference | 0.057 | 0.006 | 0.331 | 9.441 | <0.001 |
| Alcohol
consumption | 0.007 | 0.001 | 0.174 | 4.620 | <0.001 |
| Glucose | 0.147 | 0.030 | 0.171 | 4.913 | <0.001 |
| Cigarette
smoking | 0.018 | 0.006 | 0.115 | 3.049 | 0.002 |
| HDL-C | Waist
circumference | −0.012 | 0.003 | −0.179 | −4.647 | <0.001 |
| LDL-C | Waist
circumference | 0.015 | 0.005 | 0.143 | 2.909 | 0.004 |
| Age | 0.011 | 0.002 | 0.208 | 5.477 | <0.001 |
| Body mass
index | 0.031 | 0.012 | 0.133 | 2.718 | 0.007 |
| Glucose | 0.050 | 0.020 | 0.097 | 2.524 | 0.012 |
| ApoAI | Alcohol
consumption | 0.003 | 0.000 | 0.356 | 8.793 | <0.001 |
| Body mass
index | −0.010 | 0.003 | −0.133 | −3.624 | <0.001 |
| Gender | 0.092 | 0.024 | 0.178 | 3.863 | <0.001 |
| Cigarette
smoking | 0.005 | 0.001 | 0.167 | 3.723 | <0.001 |
| Age | 0.001 | 0.001 | 0.087 | 2.407 | 0.016 |
| Apo B | Waist
circumference | 0.006 | 0.001 | 0.267 | 5.849 | <0.001 |
| Glucose | 0.021 | 0.004 | 0.177 | 5.226 | <0.001 |
| Body mass
index | 0.011 | 0.002 | 0.196 | 4.412 | <0.001 |
| Gender | −0.050 | 0.014 | −0.129 | −3.649 | <0.001 |
| Pulse pressure | 0.001 | 0.000 | 0.077 | 2.235 | 0.026 |
| ApoAI/Apo B | Waist
circumference | −0.012 | 0.003 | −0.198 | −4.187 | <0.001 |
| Alcohol
consumption | 0.003 | 0.001 | 0.216 | 5.588 | <0.001 |
| Gender | 0.242 | 0.043 | 0.252 | 5.582 | <0.001 |
| Body mass
index | −0.029 | 0.006 | −0.212 | −4.642 | <0.001 |
| Cigarette
smoking | 0.008 | 0.002 | 0.151 | 3.494 | 0.001 |
| Glucose | −0.031 | 0.010 | −0.104 | −2.979 | 0.003 |
| Mulao |
| TC | Age | 0.010 | 0.003 | 0.140 | 3.806 | <0.001 |
| Body mass
index | 0.057 | 0.013 | 0.167 | 4.526 | <0.001 |
| TG | Waist
circumference | 0.040 | 0.005 | 0.287 | 7.896 | <0.001 |
| Alcohol
consumption | 0.002 | 0.001 | 0.082 | 2.259 | 0.024 |
| HDL-C | Body mass
index | −0.027 | 0.007 | −0.186 | −3.568 | <0.001 |
| Waist
circumference | −0.006 | 0.003 | −0.115 | −2.217 | 0.027 |
| LDL-C | Body mass
index | 0.053 | 0.010 | 0.194 | 5.285 | <0.001 |
| Age | 0.007 | 0.002 | 0.124 | 3.370 | 0.001 |
| Gender | 0.169 | 0.064 | 0.097 | 2.646 | 0.008 |
| ApoAI | Alcohol
consumption | 0.001 | 0.000 | 0.111 | 2.943 | 0.003 |
| Waist
circumference | −0.005 | 0.002 | −0.103 | −2.716 | 0.007 |
| Apo B | Waist
circumference | 0.012 | 0.002 | 0.182 | 4.905 | <0.001 |
| Glucose | 0.048 | 0.013 | 0.135 | 3.651 | <0.001 |
| ApoAI/B | Waist
circumference | −0.019 | 0.003 | −0.220 | −5.946 | <0.001 |
| Glucose | −0.048 | 0.017 | −0.103 | −2.798 | 0.005 |
| Table VICorrelation between the lipid
parameters and relative factors in males and females of Mulao and
Han populations. |
Table VI
Correlation between the lipid
parameters and relative factors in males and females of Mulao and
Han populations.
| Lipid
parameter | Risk factor | Unstandardized
coefficient | Std. error | Standardized
coefficient | t | P-value |
|---|
| Han/male |
| TC | Waist
circumference | 0.024 | 0.007 | 0.212 | 3.580 | <0.001 |
| TG | Waist
circumference | 0.074 | 0.011 | 0.351 | 6.501 | <0.001 |
| Alcohol
consumption | 0.008 | 0.002 | 0.208 | 3.800 | <0.001 |
| Glucose | 0.157 | 0.054 | 0.159 | 2.915 | 0.004 |
| Cigarette
smoking | 0.020 | 0.009 | 0.123 | 2.219 | 0.027 |
| HDL-C | Waist
circumference | −0.012 | 0.003 | −0.250 | −4.348 | <0.001 |
| Alcohol
consumption | 0.001 | 0.000 | 0.156 | 2.671 | 0.008 |
| Cigarette
smoking | 0.005 | 0.002 | 0.132 | 2.256 | 0.025 |
| LDL-C | Body mass
index | 0.039 | 0.012 | 0.193 | 3.295 | 0.001 |
| Cigarette
smoking | 0.014 | 0.004 | −0.182 | −3.103 | 0.002 |
| ApoAI | Alcohol
consumption | 0.003 | 0.000 | 0.448 | 8.507 | <0.001 |
| Cigarette
smoking | 0.005 | 0.001 | 0.185 | 3.522 | 0.001 |
| Waist
circumference | −0.004 | 0.002 | −0.126 | −2.432 | 0.016 |
| Apo B | Waist
circumference | 0.006 | 0.002 | 0.251 | 3.811 | <0.001 |
| Body mass
index | 0.013 | 0.003 | 0.269 | 4.095 | <0.001 |
| Glucose | 0.015 | 0.006 | 0.139 | 2.607 | 0.010 |
| ApoAI/ApoB | Body mass
index | −0.029 | 0.007 | −0.245 | −3.899 | <0.001 |
| Alcohol
consumption | 0.003 | 0.001 | 0.281 | 5.425 | <0.001 |
| Cigarette
smoking | 0.009 | 0.002 | 0.208 | 4.012 | <0.001 |
| Waist
circumference | −0.011 | 0.004 | −0.199 | −3.173 | 0.002 |
| Han/female |
| TC | Age | 0.020 | 0.003 | 0.307 | 6.256 | <0.001 |
| Waist
circumference | 0.024 | 0.006 | 0.187 | 3.924 | <0.001 |
| Glucose | 0.062 | 0.031 | 0.097 | 1.996 | 0.047 |
| TG | Waist
circumference | 0.041 | 0.006 | 0.307 | 6.406 | <0.001 |
| Glucose | 0.139 | 0.031 | 0.213 | 4.443 | <0.001 |
| Waist
circumference | −0.009 | 0.004 | −0.104 | −2.041 | 0.042 |
| LDL-C | Age | 0.018 | 0.003 | 0.315 | 6.655 | <0.001 |
| Waist
circumference | 0.028 | 0.005 | 0.246 | 5.190 | <0.001 |
| Alcohol
consumption | 0.003 | 0.001 | 0.135 | 2.649 | 0.008 |
| Body mass
index | −0.012 | 0.004 | −0.140 | −2.779 | 0.006 |
| Age | 0.002 | 0.001 | 0.101 | 1.993 | 0.047 |
| Apo B | Waist
circumference | 0.006 | 0.002 | 0.252 | 3.894 | <0.001 |
| Glucose | 0.023 | 0.006 | 0.191 | 4.056 | <0.001 |
| Pulse pressure | 0.002 | 0.001 | 0.125 | 2.533 | 0.012 |
| Age | 0.001 | 0.001 | 0.112 | 2.237 | 0.026 |
| Body mass
index | 0.008 | 0.004 | 0.127 | 1.978 | 0.049 |
| ApoAI/ApoB | Waist
circumference | −0.021 | 0.003 | −0.319 | −6.585 | <0.001 |
| Pulse pressure | −0.006 | 0.002 | −0.158 | −3.264 | 0.001 |
| Mulao/male |
| TC | Body mass
index | 0.059 | 0.020 | 0.169 | 2.994 | 0.003 |
| TG | Waist
circumference | 0.027 | 0.012 | 0.178 | 2.279 | 0.023 |
| Body mass
index | 0.091 | 0.034 | 0.207 | 2.678 | 0.008 |
| Glucose | 0.109 | 0.041 | 0.144 | 2.644 | 0.009 |
| HDL-C | Body mass
index | −0.044 | 0.009 | −0.270 | −4.908 | <0.001 |
| Alcohol
consumption | 0.001 | 0.000 | 0.159 | 2.891 | 0.004 |
| LDL-C | Body mass
index | 0.039 | 0.015 | 0.147 | 2.583 | 0.010 |
| Apo AI | Alcohol
consumption | 0.001 | 0.000 | 0.180 | 3.192 | 0.002 |
| Apo B | Waist
circumference | 0.010 | 0.004 | 0.135 | 2.369 | 0.018 |
| Pulse pressure | 0.005 | 0.002 | 0.125 | 2.193 | 0.029 |
| ApoAI/Apo B | Waist
circumference | −0.019 | 0.004 | −0.251 | −4.531 | <0.001 |
| Alcohol
consumption | 0.001 | 0.001 | 0.110 | 1.977 | 0.049 |
| Mulao/female |
| TC | Age | 0.013 | 0.003 | 0.188 | 3.885 | <0.001 |
| Body mass
index | 0.058 | 0.017 | 0.169 | 3.478 | 0.001 |
| TG | Waist
circumference | 0.027 | 0.007 | 0.205 | 4.156 | <0.001 |
| HDL-C | Body mass
index | −0.035 | 0.006 | −0.279 | −5.787 | <0.001 |
| LDL-C | Body mass
index | 0.064 | 0.013 | 0.228 | 4.751 | <0.001 |
| Age | 0.012 | 0.003 | 0.206 | 4.290 | <0.001 |
| Apo B | Waist
circumference | 0.014 | 0.003 | 0.214 | 4.449 | <0.001 |
| Glucose | 0.072 | 0.017 | 0.208 | 4.312 | <0.001 |
| ApoAI/Apo B | Waist
circumference | −0.021 | 0.005 | −0.210 | −4.294 | <0.001 |
| Age | −0.007 | 0.003 | −0.139 | −2.844 | 0.005 |
Discussion
Disorders of lipid metabolism are associated with
atherosclerotic cardiovascular disease. It has been demonstrated
that lipid concentration is modulated by gene-lifestyle
interactions (12–14). Numerous studies have indicated that
~40–60% of variation in serum lipid profiles was genetically
determined (11), and that LDL-C,
HDL-C and TG concentrations were influenced by the genetic
constitution of a particular individual (13). The prevalence of dyslipidemia
continues to increase worldwide, causing significant personal
health problems as well as imposing a substantial economic burden
on societies. Therefore, further study is required in order to
increase the understanding of the risk factors underlying
dyslipidemia in certain populations.
At present, the association between the
PABPC4 rs4660293 polymorphism and serum lipid levels remains
to be elucidated. The genotypic and allelic frequencies of
rs4660293 SNP in PABPC4 in diverse racial/ethnic groups are not
well understood. The frequency of the G allele was revealed to be
23% amongst Europeans (17) and
25% amongst Australians (20). In
the present study, it was demonstrated that there was no
significant difference in the G allele frequency of the
PABPC4 rs4660293 SNP between the Mulao and Han populations
examined (11.62 vs. 12.69%). Subgroup analyses revealed that there
were no significant differences in genotypic and allelic
frequencies between Han males or females, but that the minor
allelic frequency was higher in Mulao males than that in Mulao
females, and the genotypic distribution varied between Mulao
females and males (P<0.05). These results suggested that the
prevalence of the PABPC4 rs4660293 SNP G allele may have
racial/ethnic specificity, as well as gender specificity.
Middelberg et al (20)
reported that the PABPC4 rs4660293 SNP was correlated with
HDL-C in adults but not in adolescents. The results of the present
study indicated that in the Han population, G allele carriers were
associated with higher LDL-C levels and higher TC, HDL-C and ApoAI
levels in females but not in males, than those of the G allele
non-carriers. Of note, the Mulao female, but not male, G allele
carriers had lower TC and HDL-C levels than those of the G allele
non-carriers. These findings suggested that the association of
PABPC4 rs4660293 SNP and serum lipid levels varied between
the Mulao and Han nationalities, and that there was a
gender-specific association in the two ethnic groups.
Amongst individuals of the Mulao population, certain
customs must be considered. The majority of the Mulao population
resides in the Guangxi Zhuang Autonomous Region, China, which is
characterized by an agricultural economy. The inhabitants of the
region tend to share similar lifestyles, as well as eating habits,
prefering to eat cold foods accompanied by acidic and spicy dishes,
local bean soy sauce, pickled vegetables and animal offal, which
contains a high proportion of saturated fatty acid (29). There is additionally a strict
intra-ethnic marriage culture in Mulao society, where engagements
are arranged by the family in childhood, with the female frequently
being ~4–5 years older than the male. Furthermore, there is a
tradition for marriage to an individual's mother's brother's
daughter (30). Due to the
conservative and isolated nature of the Mulao minority, the genetic
background and certain lipid-associated genetic variants in this
population were hypothesized to differ from those in the Han
population (25). The above
evidence may partly explain the discrepancies of the PABPC4
polymorphism and serum lipid levels observed between the Han and
Mulao populations. Furthermore, environmental factors were
positively correlated with serum lipid levels (11,31–33).
In the present study, it was demonstrated that serum lipid
parameters were associated with age, gender, alcohol consumption,
cigarette smoking, BMI and blood pressure in the two ethnic groups.
These results suggested that such environmental factors have a key
role in determining the serum lipid levels in these study
populations.
There are several potential limitations to the
results obtained in the present study. The sample size may be not
have been large enough to be representative of the populations as a
whole. Despite the association between PABPC4 rs4660293 SNP
and serum lipid levels identified in the present study, numerous
unmeasured genetic and environmental factors remain. Furthermore,
gene-gene, gene-environment, and environment-environment
interactions were not evaluated in the present study. Further
studies comprising larger sample sizes and paying particular
attention to gene-gene and gene-environment interactions, are
required in order to confirm the results of the present study.
In conclusion, the present study demonstrated that
the PABPC4 rs4660293 SNP was associated with serum TC,
HDL-C, LDL-C and ApoAI levels in the Mulao and Han populations, but
that the genotypic and allelic frequencies of PABPC4
rs4660293 SNP and the association of this SNP and serum lipid
parameters varied between the two populations. A gender-specific
association was also observed in the two ethnic groups. Ideal
biomarkers may provide diagnostic information on patients at risk
for dyslipidemic disease and/or prognostic information on patients
with established dyslipidemic disease, they may also serve as
predictors of efficacy for therapeutic interventions.
Acknowledgments
The present study was supported by the National
Natural Science Foundation of China (no. 30960130).
References
|
1
|
Roberts R and Stewart AF: Genes and
coronary artery disease: where are we? J Am Coll Cardiol.
60:1715–1721. 2012. View Article : Google Scholar : PubMed/NCBI
|
|
2
|
Satoh H, Nishino T, Tomita K and Tsutsui
H: Fasting triglyceride is a significant risk factor for coronary
artery disease in middle-aged Japanese men. Circ J. 70:227–231.
2006. View Article : Google Scholar : PubMed/NCBI
|
|
3
|
Arai H, Yamamoto A, Matsuzawa Y, et al:
Serum lipid survey and its recent trend in the general Japanese
population in 2000. J Atheroscler Thromb. 12:98–106. 2005.
View Article : Google Scholar : PubMed/NCBI
|
|
4
|
Hokanson JE and Austin MA: Plasma
triglyceride level is a risk factor for cardiovascular disease
independent of high-density lipoprotein cholesterol level: a
meta-analysis of population-based prospective studies. J Cardiovasc
Risk. 3:213–219. 1996. View Article : Google Scholar : PubMed/NCBI
|
|
5
|
Austin MA: Plasma triglyceride as a risk
factor for coronary heart disease. The epidemiologic evidence and
beyond. Am J Epidemiol. 129:249–259. 1989.PubMed/NCBI
|
|
6
|
World Health Organization: The top 10
causes of death: Media centre fact sheets. 2014, http://www.who.int/mediacentre/fact-sheets/fs310/en.
Accessed March 14 2015.
|
|
7
|
Murray CJ and Lopez AD: Alternative
projections of mortality and disability by cause 1990–2020: Global
Burden of Disease Study. Lancet. 349:1498–1504. 1997. View Article : Google Scholar : PubMed/NCBI
|
|
8
|
Burnett JR: Lipids, lipoproteins,
atherosclerosis and cardiovascular disease. Clin Biochem Rev.
25:22004.
|
|
9
|
Jackson R, Lawes CM, Bennett DA, Milne RJ
and Rodgers A: Treatment with drugs to lower blood pressure and
blood cholesterol based on an individual's absolute cardiovascular
risk. Lancet. 365:434–441. 2005. View Article : Google Scholar : PubMed/NCBI
|
|
10
|
Sonntag F, Schaefer JR, Gitt AK, et al:
Lipid therapy in daily routine. Dtsch Med Wochenschr.
137:2047–2052. 2012.In German. PubMed/NCBI
|
|
11
|
Heller DA, de Faire U, Pedersen NL, Dahlén
G and McClearn GE: Genetic and environmental influences on serum
lipid levels in twins. N Engl J Med. 328:1150–1156. 1993.
View Article : Google Scholar : PubMed/NCBI
|
|
12
|
Pollin TI, Hsueh WC, Steinle NI, et al: A
genome-wide scan of serum lipid levels in the Old Order Amish.
Atherosclerosis. 173:89–96. 2004. View Article : Google Scholar : PubMed/NCBI
|
|
13
|
Pilia G, Chen WM, Scuteri A, et al:
Heritability of cardiovascular and personality traits in 6,148
Sardinians. PLoS Genet. 2:e1322006. View Article : Google Scholar : PubMed/NCBI
|
|
14
|
Dumitrescu L, Carty CL, Taylor K, et al:
Genetic determinants of lipid traits in diverse populations from
the population architecture using genomics and epidemiology (PAGE)
study. PLoS Genet. 7:e10021382011. View Article : Google Scholar : PubMed/NCBI
|
|
15
|
Hegele RA: Plasma lipoproteins: genetic
influences and clinical implications. Nat Rev Genet. 10:109–121.
2009. View
Article : Google Scholar : PubMed/NCBI
|
|
16
|
Kathiresan S, Manning AK, Demissie S, et
al: A genome-wide association study for blood lipid phenotypes in
the Framingham Heart Study. BMC Med Genet. 8(Suppl 1): S172007.
View Article : Google Scholar : PubMed/NCBI
|
|
17
|
Teslovich TM, Musunuru K, Smith AV, et al:
Biological, clinical and population relevance of 95 loci for blood
lipids. Nature. 466:707–713. 2010. View Article : Google Scholar : PubMed/NCBI
|
|
18
|
Dehghan A, Dupuis J, Barbalic M, et al:
Meta-analysis of genome-wide association studies in >80,000
subjects identifies multiple loci for C-reactive protein levels.
Circulation. 123:731–738. 2011. View Article : Google Scholar : PubMed/NCBI
|
|
19
|
Danesh J, Wheeler JG, Hirschfield GM, et
al: C-reactive protein and other circulating markers of
inflammation in the prediction of coronary heart disease. N Engl J
Med. 350:1387–1397. 2004. View Article : Google Scholar : PubMed/NCBI
|
|
20
|
Middelberg RP, Heath AC, Madden PA, et al:
Evidence of differential allelic effects between adolescents and
adults for plasma high-density lipoprotein. PLoS One. 7:e356052012.
View Article : Google Scholar : PubMed/NCBI
|
|
21
|
Gorgoni B, Richardson WA, Burgess HM, et
al: Poly(A)-binding proteins are functionally distinct and have
essential roles during vertebrate development. Proc Natl Acad Sci
USA. 108:7844–7849. 2011. View Article : Google Scholar : PubMed/NCBI
|
|
22
|
Villalba A, Coll O and Gebauer F:
Cytoplasmic polyadenylation and translational control. Curr Opin
Genet Dev. 21:452–457. 2011. View Article : Google Scholar : PubMed/NCBI
|
|
23
|
http://www.stats.gov.cn/tjsj/pcsj/rkpc/5rp/index.htm
(In Chinese) Accessed August 16, 2013.
|
|
24
|
Yan TT, Yin RX, Li Q, et al: Sex-specific
association of rs16996148 SNP in the NCAN/CILP2/PBX4 and serum
lipid levels in the Mulao and Han populations. Lipids Health Dis.
10:2482011. View Article : Google Scholar
|
|
25
|
Xu L, Deng QY, Li SF, et al: Genetic
analysis of Mulao nationality using 15 short tandem repeats.
Zhonghua Yi Xue Yi Chuan Xue Za Zhi. 25:96–100. 2008.In Chinese.
PubMed/NCBI
|
|
26
|
Li Q, Yin RX, Wei XL, et al: ATP-binding
cassette transporter G5 and G8 polymorphisms and several
environmental factors with serum lipid levels. PLoS One.
7:e379722012. View Article : Google Scholar : PubMed/NCBI
|
|
27
|
An epidemiological study of cardiovascular
and cardiopulmonary disease risk factors in four populations in the
People's Republic of China. Baseline report from the P.R.C.-U.S.A.
Collaborative Study. People's Republic of China - United States
Cardiovascular and Cardiopulmonary Epidemiology Research Group.
Circulation. 85:1083–1096. 1992. View Article : Google Scholar
|
|
28
|
Ruixing Y, Weixiong L, Hanjun Y, et al:
Diet, lifestyle, and blood pressure of the middle-aged and elderly
in the Guangxi Bai Ku Yao and Han populations. Am J Hypertens.
21:382–387. 2008. View Article : Google Scholar : PubMed/NCBI
|
|
29
|
Dian-bao Long: The food custom of Mulao.
Journal of Hechi University. 25:99–101. 2005.In Chinese.
|
|
30
|
Yuan-fu Lan: Ethnography of marriage
customary law of the Mulao ethnic group in Luocheng. Journal of
Guangxi University For Nationalities. 31:99–102. 2009.In
Chinese.
|
|
31
|
Craig WY, Palomaki GE and Haddow JE:
Cigarette smoking and serum lipid and lipoprotein concentrations:
an analysis of published data. BMJ. 298:784–788. 1989. View Article : Google Scholar : PubMed/NCBI
|
|
32
|
Brinton EA: Effects of ethanol intake on
lipoproteins and atherosclerosis. Curr Opin Lipidol. 21:346–351.
2010. View Article : Google Scholar : PubMed/NCBI
|
|
33
|
Onat A, Hergenc G, Dursunoglu D, et al:
Associations of alcohol consumption with blood pressure,
lipoproteins, and subclinical inflammation among Turks. Alcohol.
42:593–601. 2008. View Article : Google Scholar : PubMed/NCBI
|