Introduction
Pancreatic cancer is globally the fourth leading
cause of cancer-associated mortality for men and women, based on
incidence and mortality statistics. There were 337,872 novel
pancreatic cancer cases reported and 330,372 cases of pancreatic
cancer-associated mortality in 2012, accounting for 2.4% of the
annual novel cancer cases in 2012 and ranking as the 12th most
prevalent cancer world wide (Globocan 2012; http://globocan.iarc.fr/Pages/fact_sheets_population.aspx).
The average life expectancy upon diagnosis is between four and
eight months, and individuals undergoing surgery to remove the
carcinoma have an ~30% five-year survival rate (1). However, due to late diagnosis, only
10% of diagnosed patients are eligible for potentially curative
surgery (1). Due to the fact that
the causes of pancreatic cancer remain to be fully elucidated and
no specific symptoms have been identified for early-stage
diagnosis, pancreatic cancer remains difficult to diagnose.
Pancreatic cancer is a polygenic disease, as are the
majority of cancer types (2,
3). The accumulation of multiple
genetic defects has an effect on tumorigenesis (4). The arrival and advancement of DNA
microarray technology make it possible to monitor the expression
levels of a vast number of genes or transcripts in a single
microchip. Thus, microarray technology has become a key tool in the
investigation of key genes associated with the progression of this
malignancy. Gene expression profiling, which is based on DNA
microarray technology, has allowed for the identification of
hundreds of genes with differential expression in pancreatic
carcinoma (5). Genes with the most
up/downregulated expression levels in pancreatic carcinoma are p16,
p53, K-ras and Smad4, as previously reported (6). These genes are suggested to serve as
predictive biomarkers for early diagnosis. Bioinformatics analysis
allows for the mapping of genes with differential expression levels
to metabolic or signalling pathways, which may provide potential
targets for the design of novel anti-cancer drugs (7). The Ras signaling pathway, for
example, has attracted attention as an anti-cancer drug target, due
to its important function in tumorigenesis (8). For pancreatic cancer, Wnt (9), Notch (10) and Hedgehog (11) pathways have been additionally
identified as being of marked significance.
Given the complexity of the genome, it is suggested
that numerous genes associated with pancreatic cancer have remained
to be identified. Thus, the present study aimed to investigate and
enhance the understanding of the underlying molecular mechanisms of
pancreatic cancer by undertaking gene expression profiling on a
pancreatic carcinoma sample in Shanghai, China. Human whole genome
microarray analysis was used to identify the differentially
expressed genes between para-carcinoma, carcinoma and relapse human
pancreatic cancer tissues.
Materials and methods
Tissue samples
The para-carcinoma, carcinoma and relapse pancreatic
carcinoma tissues were obtained from a patient (46 years old,
female, stage II) undergoing cancer resection at Shanghai Tenth
People's Hospital (Shanghai, China). Written informed consent was
obtained from the patient and ethical approval of the present study
was obtained from the ethical committee of Shanghai Tenth People's
Hospital (Shanghai, China).
RNA extraction
RNA samples from matched para-carcinoma, carcinoma
and relapse pancreatic carcinoma tissues were extracted using
TRIzol reagent (Invitrogen Life Technologies, Carlsbad, CA, USA). A
total of 1 ml TRIzol was used for every 100 mg tissue. Total RNA
was isolated using phenol/chloroform (Sinopharm Chemical Reagent
Co., Ltd, Shanghai, China) according to the manufacturer's
instructions. Subsequent to the precipitation of RNA, 75% (v/v)
ethanol was used to wash out the salts. The RNA was then air-dried
and dissolved in RNase-free water. The quality and quantity of
total RNA was determined using a NanoDrop 2000 (Thermo Fisher
Scientific, Waltham, MA, USA).
Microarray assay
The Agilent Microarray Platform (Agilent
Technologies, Inc., Santa Clara, CA, USA) was used to conduct the
microarray analysis. Sample preparation and the follow-up
hybridization were performed according to the manufacturer's
instructions. Total RNA (1 µg) was extracted from each
sample as mentioned above, and the Agilent Quick Amp Labeling kit
(protocol version 5.7; Agilent Technologies, Inc.) was used to
amplify and transcribe the RNA into fluorescent cRNA following the
manufacturer's instructions. Sample labeling was performed using
the Agilent Quick Amp Labeling kit, while subsequent hybridization
was performed in SureHyb Hybridization Chambers (Agilent
Technologies, Inc.). The labelled cRNA was then hybridized onto the
Whole Human Genome Oligo Microarray (4×44 K; Agilent Technologies,
Inc.). Arrays were scanned with the G2505B Scanner (Agilent
Technologies, Inc.) subsequent to washing of the slides.
Data analysis
The acquired array images were analyzed with Agilent
Feature Extraction software, version 10.7.3.1, while GeneSpring GX
software, version 11.5.1 (Agilent Technologies, Inc.) was used for
quantile normalization and data processing.
Among the 45,000 genes or transcripts included in
the microarray, 7,937 genes or transcripts with valid values
detected in all three groups measured (carcinoma, para-carcinoma
and relapse tissues) were used for the subsequent analysis. Genes
with differential expression levels in different tissues were
identified by fold-change filtering. Expression levels of genes
were normalized by log2 transformation for the subsequent analysis.
Pairwise comparisons were completed between the expression levels
of the same gene or transcript in any two tissues. Genes or
transcripts exhibiting fold-changes >1.5- and 3-fold in
expression levels in a minimum of one pairwise comparison were
selected for further analysis, and bioinformatics analysis was
conducted on the genes or transcripts with alterations in
expression levels of >3-fold.
Analysis results from Gene Ontology (GO) and Kyoto
Encyclopedia of Gene and Genomes (KEGG; http://www.genome.jp/kegg/) databases were gathered
and enriched by using the online Database for Annotation,
Visualization and Integrated Discovery server (DAVID; http://david.abcc.ncifcrf.gov/) with the standard
enrichment computation method (12).
Results
Microarray analysis
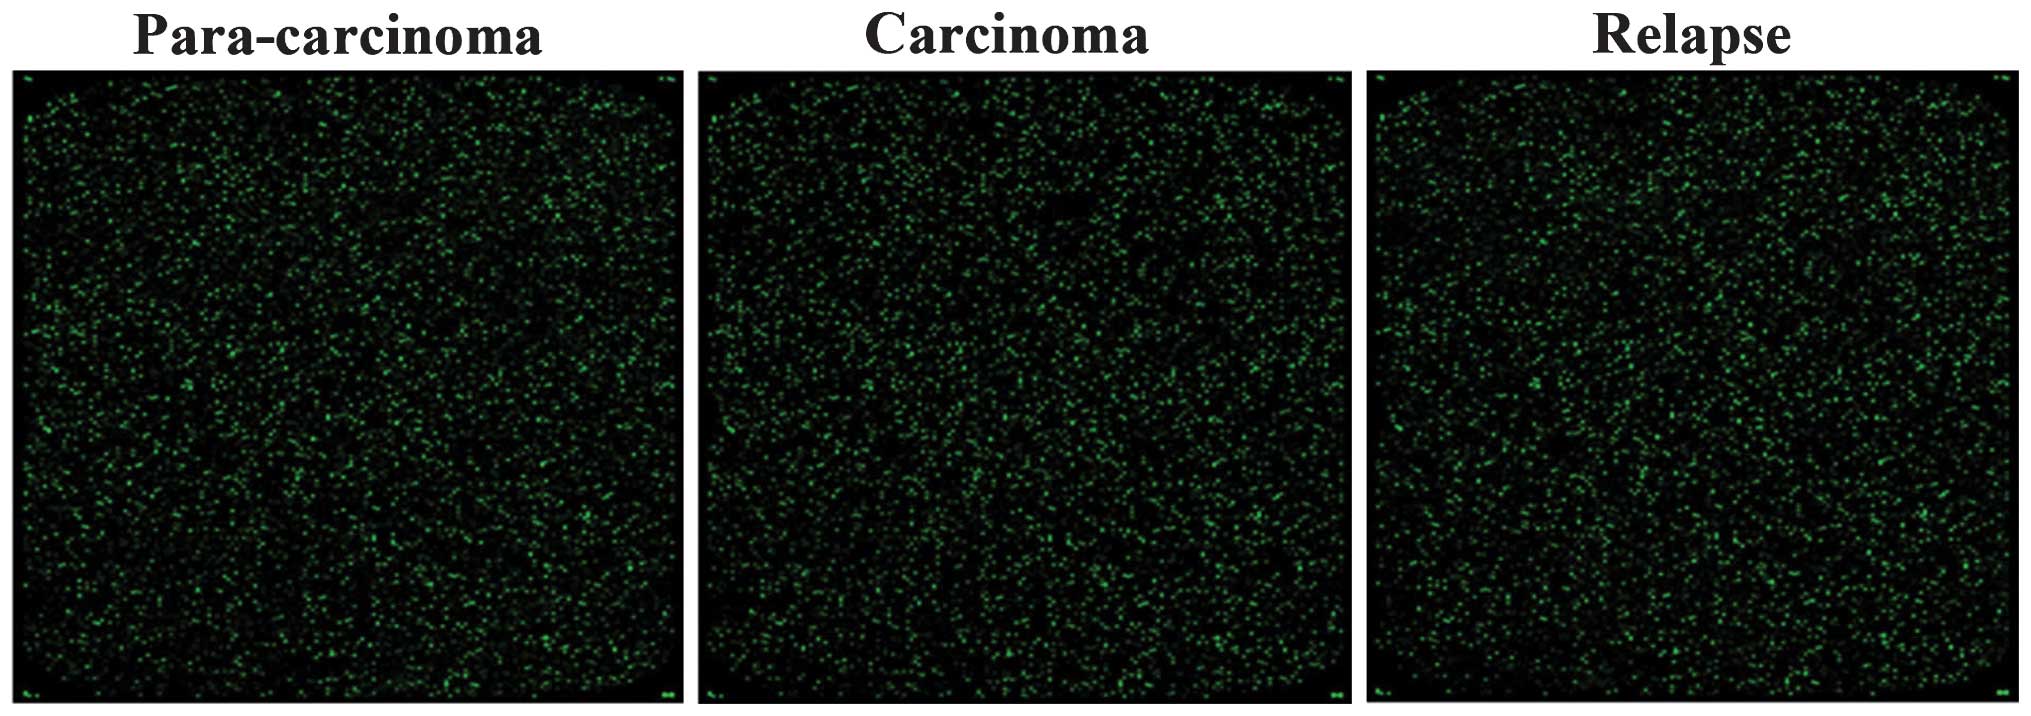
The microarray assay was qualified according to
quality standards, the experimental systems were observed to be
stable and the fluorescent signal intensity was strong and
homogenous (Fig. 1). cRNAs were
hybridized onto the Whole Human Genome Oligo Microarray and 7,937
probes exhibited clear signals in all three chips simultaneously,
representing 17.63% of the 45,000 probes assessed. Subsequent to
differential expression level analysis, genes or transcripts
corresponding to 3,298/7,937 probes were observed to exhibit
alterations in expression levels of >1.5-fold. Among these, 319
genes or transcripts were observed to have a fold change of
≥3-fold.
Gene ontology analysis
A total of 319 genes or transcripts associated with
pancreatic cancer were observed to exhibit a ≥3-fold change in
expression levels in the present study. Subsequently, the GO
database was used to analyze these genes and DAVID was used for the
enrichment terms.
A total of 23 functional description nodes were
identified to be associated with biological processes, with
P<0.01 (Table I). According to
their P-values (low-high), the top five terms were: Translational
elongation, translation, nucleosome assembly, chromatin assembly
and protein-DNA complex assembly. All of these terms were
associated with cell metabolic processes. In addition, terms which
are involved in immune response and metal ion metabolic processes
were observed.
 | Table IGene ontology analysis of
differentially expressed genes associated with biological
processes. |
Table I
Gene ontology analysis of
differentially expressed genes associated with biological
processes.
| Term | Gene count (n) | %a | P-value |
|---|
| Translational
elongation | 16 | 7.2398190 |
9.70×10⁻¹³ |
| Translation | 18 | 8.1447964 |
4.72×10⁻⁷ |
| Nucleosome
assembly | 8 | 3.6199095 |
6.50×10⁻⁵ |
| Chromatin
assembly | 8 | 3.6199095 |
8.14×10⁻⁵ |
| Protein-DNA complex
assembly | 8 | 3.6199095 |
1.08×10⁻⁴ |
| Nucleosome
organization | 8 | 3.6199095 |
1.24×10⁻⁴ |
| Response to metal
ion | 9 | 4.0723982 |
1.60×10⁻⁴ |
| Antigen processing
and presentation of peptide antigen | 5 | 2.2624434 |
3.24×10⁻⁴ |
| Antigen processing
and presentation | 7 | 3.1674208 |
4.75×10⁻⁴ |
| DNA packaging | 8 | 3.6199095 |
5.12×10⁻⁴ |
| Response to
stimulus | 62 | 28.054299 |
6.66×10⁻⁴ |
| Response to
inorganic substance | 10 | 4.5248869 |
8.13×10⁻⁴ |
| Chromatin assembly
or disassembly | 8 | 3.6199095 |
8.35×10⁻⁴ |
| Antigen processing
and presentation of peptide antigen via MHC class I | 4 | 1.8099548 | 0.00101320 |
| Immune
response | 19 | 8.5972851 | 0.00156179 |
| Negative regulation
of apoptosis | 12 | 5.4298643 | 0.00359381 |
| Negative regulation
of programmed cell death | 12 | 5.4298643 | 0.00399353 |
| Negative regulation
of cell death | 12 | 5.4298643 | 0.00407759 |
| Response to calcium
ion | 5 | 2.2624434 | 0.00420590 |
| Iron ion
transport | 4 | 1.8099548 | 0.00490087 |
| Regulation of
calcium ion transport into cytosol | 4 | 1.8099548 | 0.00490087 |
| Response to
chemical stimulus | 27 | 12.217195 | 0.00526131 |
| Ribosomal small
subunit biogenesis | 3 | 1.3574661 | 0.00730011 |
Furthermore, 26 functional description nodes were
identified to be associated with cellular components, with
P<0.01 (Table II). The top
five terms were identified to be: Cytosolic ribosome, ribosomal
subunit, cytosolic small ribosomal subunit, cytosolic part and
small ribosomal subunit.
| Table IIGene ontology analysis of
differentially expressed genes associated with cellular
components. |
Table II
Gene ontology analysis of
differentially expressed genes associated with cellular
components.
| Term | Gene count (n) | %a | P-value |
|---|
| Cytosolic
ribosome | 18 | 0.0814480 |
2.07×10⁻¹⁷ |
| Ribosomal
subunit | 18 | 0.0814480 |
6.53×10⁻¹⁴ |
| Cytosolic small
ribosomal subunit | 12 | 0.0542986 |
4.40×10⁻¹³ |
| Cytosolic part | 18 | 0.0814480 |
1.16×10⁻¹² |
| Small ribosomal
subunit | 13 | 0.0588235 |
4.31×10⁻¹² |
| Ribosome | 19 | 0.0859729 |
3.42×10⁻¹¹ |
| Ribonucleoprotein
complex | 23 | 0.1040724 |
7.30×10⁻⁸ |
| Macromolecular
complex | 63 | 0.2850679 |
1.83×10⁻⁶ |
| Nucleosome | 8 | 0.0361991 |
6.37×10⁻⁶ |
| Cytosol | 34 | 0.1538462 |
1.09×10⁻⁵ |
| Protein-DNA
complex | 8 | 0.0361991 |
4.98×10⁻⁵ |
| Cytoplasmic
part | 79 | 0.3574661 |
1.53×10⁻⁴ |
| Cytoplasm | 107 | 0.4841629 |
1.81×10⁻⁴ |
|
Non-membrane-bounded organelle | 49 | 0.2217195 |
2.04×10⁻⁴ |
| Intracellular
non-membrane-bounded organelle | 49 | 0.2217195 |
2.04×10⁻⁴ |
| MHC class I protein
complex | 5 | 0.0226244 |
2.52×10⁻⁴ |
| Intracellular
part | 141 | 0.6380090 |
3.21×10⁻⁴ |
| MHC protein
complex | 6 | 0.0271493 |
4.34×10⁻⁴ |
| Intracellular | 144 | 0.6515837 |
4.91×10⁻⁴ |
| Cytosolic large
ribosomal subunit | 5 | 0.0226244 |
8.31×10⁻⁴ |
| Organelle part | 68 | 0.3076923 |
8.84×10⁻⁴ |
| Intracellular
organelle | 122 | 0.5520362 | 0.0010071 |
| Organelle | 122 | 0.5520362 | 0.0010775 |
| Intracellular
organelle part | 67 | 0.3031674 | 0.0012716 |
| Chromatin | 9 | 0.0407240 | 0.0018679 |
| Large ribosomal
subunit | 5 | 0.0226244 | 0.0067159 |
Finally, 7 functional description nodes were
identified to be associated with molecular function, with
P<0.01. These nodes were: Structural constituent of ribosome,
structural molecule activity, protein binding, pyridoxal phosphate
binding, vitamin B6 binding, binding and cadmium ion binding
(Table III).
| Table IIIGene ontology analysis of
differentially expressed genes associated with molecular
function. |
Table III
Gene ontology analysis of
differentially expressed genes associated with molecular
function.
| Term | Gene count (n) | %a | P-value |
|---|
| Structural
constituent of ribosome | 17 | 0.0769231 |
8.56×10⁻¹¹ |
| Structural molecule
activity | 21 | 0.0950226 |
3.80×10⁻⁵ |
| Protein
binding | 118 | 0.5339367 |
1.44×10⁻⁴ |
| Pyridoxal phosphate
binding | 5 | 0.0226244 | 0.0033357 |
| Vitamin B6
binding | 5 | 0.0226244 | 0.0033357 |
| Binding | 157 | 0.7104072 | 0.0041273 |
| Cadmium ion
binding | 3 | 0.0135747 | 0.0054982 |
KEGG pathway analysis
KEGG pathway analysis was conducted on genes with an
alteration in expression levels of >3-fold between the
carcinoma, para-carcinoma and relapse human pancreatic cancer
tissues. Of these, the genes associated with systemic lupus
erythematosus (SLE) and type I diabetes mellitus are presented
(Table IV). In systemic lupus
erythematosus, 11 key genes were differentially expressed between
carcinoma, para-carcinoma and relapse tissue, including: HLA-DPB1,
HIST1H4J, HIST1H2BO, H3F3C, H2AFY, H3F3A, HIST2H3D, HIST1H4D,
HIST2H4B, HIST1H2BL and HIST1H4K (Fig.
2, Table V). In type I
diabetes mellitus, HLA-A, HLA-B, HLA-C, HLA-DPB1 and GAD1 (Fig. 3, Table VI) exhibited significantly
different expression levels.
 | Figure 2Schematic of the systemic lupus
erythematosus pathway in which HLA-DPB1, HIST1H4J, HIST1H2BO,
H3F3C, H2AFY, H3F3A, HIST2H3D, HIST1H4D, HIST2H4B, HIST1H2BL and
HIST1H4K are involved. IgG, immunoglobulin G; UV, ultraviolet; TCR,
T-cell receptor; BCR, B-cell receptor; Fcyr, Fc receptor for
IgG. |
| Table IVKEGG pathway analysis results. |
Table IV
KEGG pathway analysis results.
| KEGG pathway
ID | Pathway name | Gene count (n) | Percentage of
counted genes | NCBI gene ID | Fold
enrichment | P-value |
|---|
| hsa05322 | Systemic lupus
erythematosus | 11 | 4.977% | 3115, 8363, 8348,
440093, 9555, 3020, 653604, 8360, 554313, 8340, 8362 | 4.565656 | 0.001602 |
| hsa04940 | Type I diabetes
mellitus | 5 | 2.262% | 2571, 3115, 3107,
3105, 3106 | 5.380952 | 0.036427 |
| Table VGenes with >3-fold change in
expression levels in pancreatic cancer associated with systemic
lupus erythematosus. |
Table V
Genes with >3-fold change in
expression levels in pancreatic cancer associated with systemic
lupus erythematosus.
| Gene ID | Gene symbol | fcCP | fcRP | fcCR | Description |
|---|
| 3115 | HLA-DPB1 | 0.603255 | 1.960175 | 0.307756 | Major
histocompatibility complex, class II, DP beta 1 |
| 8363 | HIST1H4J | 0.308301 | 0.880094 | 0.350304 | Histone cluster 1,
h4j |
| 8348 | HIST1H2BO | 0.368137 | 1.208018 | 0.304744 | Histone cluster 1,
h2bo |
| 440093 | H3F3C | 0.719753 | 3.972665 | 0.181176 | H3 histone, family
3C |
| 9555 | H2AFY | 1.356658 | 0.260470 | 5.208496 | H2A histone family,
member Y |
| 3020 | H3F3A | 0.298552 | 0.615353 | 0.485173 | H3 histone, family
3A |
| 653604 | HIST2H3D | 0.296694 | 0.722873 | 0.410437 | Histone cluster 2,
h3d |
| 8360 | HIST1H4D | 0.421040 | 1.396684 | 0.301457 | Histone cluster 1,
h4d |
| 554313 | HIST2H4B | 0.333331 | 0.730559 | 0.456268 | Histone cluster 2,
h4b |
| 8340 | HIST1H2BL | 0.224496 | 0.710622 | 0.315914 | Histone cluster 1,
h2bl |
| 8362 | HIST1H4K | 0.335573 | 1.021847 | 0.328399 | Histone cluster 1,
h4k |
| Table VIGenes with >3-fold change in
expression levels in pancreatic cancer associated with type I
diabetes mellitus. |
Table VI
Genes with >3-fold change in
expression levels in pancreatic cancer associated with type I
diabetes mellitus.
| Gene ID | Gene symbol | fcCP | fcRP | fcCR | Description |
|---|
| 2571 | GAD1 | 1.062045 | 4.264469 | 0.249045 | Glutamate
decarboxylase 1 |
| 3115 | HLA-DPB1 | 0.603255 | 1.960175 | 0.307756 | Major
histocompatibility complex, class II, DP beta 1 |
| 3105 | HLA-A | 0.312182 | 0.491002 | 0.635806 | Major
histocompatibility complex, class I, A |
| 3106 | HLA-B | 0.299524 | 0.644979 | 0.464393 | Major
histocompatibility complex, class I, B |
| 3107 | HLA-C | 0.330177 | 0.661858 | 0.498863 | Major
histocompatibility complex, class I, C |
Discussion
Pancreatic cancer is a lethal malignancy with few
effective therapies currently available (13). It is the fourth leading cause of
cancer-associated mortality, with an overall five-year survival
rate of <5% (14), which has
remained unaltered for 50 years. With the availability of DNA
microarray and next generation sequencing, it is now possible to
study diseases, including various types of cancer, at the 'omic'
level (15). DNA microarray gene
expression profiling has previously been successfully applied in
large-scale analyses of differentially expressed genes involved in
tumorigenesis (16). Gene
expression profiling has previously been used in numerous studies
focusing on pancreatic cancer. Chang et al (17) demonstrated that 3,853 genes
displayed differential expression by >1.5-fold in pancreatic
carcinoma tissue. Of these genes, the expression levels of 2,512
genes were upregulated and 1,341 genes were downregulated. Nakamura
et al (18) identified 260
upregulated and 346 downregulated genes involved in pancreatic
cancer.
In the present study, the gene expression levels
between carcinoma, relapse carcinoma and para-carcinoma of human
pancreatic cancer tissues were compared. Differentially expressed
genes were observed and analyzed using GO term and KEGG pathway
enrichment analysis.
Using GO term analysis, differentially expressed
genes were observed in the present study, which were identified to
be involved in biological processes and associated with
translation, the nucleus and chromatin assembly. This is consistent
with the knowledge that the nuclei in carcinoma cells are misshapen
and enlarged (19). In the
cellular component domain, the majority of the enriched terms were
associated with the ribosomes. In the GO analysis domain of
molecular function, terms regarding the structural constitution of
ribosomes and protein binding were highlighted. Of note,
differentially expressed genes identified to be associated with
molecular function included terms of pyridoxal phosphate (PLP) and
vitamin B6 binding, and PLP is the active form of vitamin B6
(20). Johansson et al
(21) reported that the serum
vitamin B6 levels were inversely associated with the risk of lung
cancer and Wu et al (22)
demonstrated that serum PLP levels were inversely associated with
the risk of breast cancer. Overall, this suggested that the genes
associated with vitamin B6 binding are involved in
tumorigenesis.
Using KEGG analysis, the pathways of SLE and type I
diabetes mellitus were identified to be significantly associated
with pancreatic cancer. SLE is a systemic autoimmune disease, which
can affect any part of the body (23). At present, it is accepted that SLE
is associated with an increased risk of certain types of cancer.
Previous studies have demonstrated the association between SLE and
non-Hodgkin lymphoma (NHL) (24–29)
as well as Hodgkin lymphoma (30,31).
The risk of NHL was found to be increased by several fold in a SLE
population, compared with that of a healthy population (32). Increased risks of breast (29), lung (25,33–37),
cervical (26,29) and endometrial cancer (38) in patients with SLE have been
observed by cohort studies. Type I diabetes mellitus results from
the autoimmune destruction of the insulin-producing cells in the
pancreas (39). By meta-analysis,
Stevens et al (4 0) identified an increased risk of
pancreatic cancer in a population with type I diabetes mellitus. A
population-based cohort study in Sweden conducted by Zendehdel
et al (41) demonstrated
that patients with type I diabetes mellitus additionally exhibited
increased incidences of stomach, cervical and endometrial cancer
(41).
In conclusion, the present study suggested that the
abnormal expression levels of multiple genes contribute to the
incidence of pancreatic cancer. Additional diseases, including type
I diabetes and SLE, are closely associated with the tumorigenesis
of pancreatic carcinoma. Although the specific functions of these
genes with differential expression levels and their mechanisms
require further investigation, the results of the present study may
aid clinicians in the early diagnosis of pancreatic cancer and in
the production of novel targeted therapies.
References
|
1
|
Ghaneh P, Smith R, Tudor-Smith C, Raraty M
and Neoptolemos JP: Neoadjuvant and adjuvant strategies for
pancreatic cancer. Eur J Surg Oncol. 34:297–305. 2008. View Article : Google Scholar
|
|
2
|
Sugimura T, Terada M, Yokota J, Hirohashi
S and Wakabayashi K: Multiple genetic alterations in human
carcinogenesis. Environ Health Perspect. 98:5–12. 1992. View Article : Google Scholar : PubMed/NCBI
|
|
3
|
Neoptolemos JP, Urrutia R, Abbruzzese JL
and Büchler MW: Pancreatic Cancer. Chapter. 21:498–505. 2010.
|
|
4
|
Rafael S, Veganzones S, Vidaurreta M, de
la Orden V and Maestro ML: Effect of β-catenin alterations in the
prognosis of patients with sporadic colorectal cancer. J Cancer Res
Ther. 10:591–596. 2014.PubMed/NCBI
|
|
5
|
López-Casas PP and López-Fernández LA:
Gene-expression profiling in pancreatic cancer. Expert Rev Mol
Diagn. 10:591–601. 2010. View Article : Google Scholar : PubMed/NCBI
|
|
6
|
Maitra A, Kern SE and Hruban RH: Molecular
pathogenesis of pancreatic cancer. Best Pract Res Clin
Gastroenterol. 20:211–226. 2006. View Article : Google Scholar : PubMed/NCBI
|
|
7
|
Li Q and Xu W: Novel anticancer targets
and drug discovery in post genomic age. Curr Med Chem Anticancer
Agents. 5:53–63. 2005. View Article : Google Scholar : PubMed/NCBI
|
|
8
|
Downward J: Targeting RAS signalling
pathways in cancer therapy. Nat Rev Cancer. 3:11–22. 2003.
View Article : Google Scholar : PubMed/NCBI
|
|
9
|
Morris JP IV, Wang SC and Hebrok M: KRAS,
Hedgehog, Wnt and the twisted developmental biology of pancreatic
ductal adenocarcinoma. Nat Rev Cancer. 10:683–695. 2010. View Article : Google Scholar : PubMed/NCBI
|
|
10
|
Wang Z, Banerjee S, Ahmad A, Li Y, Azmi
AS, Gunn JR, Kong D, Bao B, Ali S, Gao J, et al: Activated K-ras
and INK4a/Arf deficiency cooperate during the development of
pancreatic cancer by activation of Notch and NF-κB signaling
pathways. PLoS One. 6:e205372011. View Article : Google Scholar
|
|
11
|
Lauth M and Toftgård R: Hedgehog signaling
and pancreatic tumor development. Adv Cancer Res. 110:1–17. 2011.
View Article : Google Scholar : PubMed/NCBI
|
|
12
|
Huang da W, Sherman BT and Lempicki RA:
Bioinformatics enrichment tools: paths toward the comprehensive
functional analysis of large gene lists. Nucleic Acids Res.
37:1–13. 2009. View Article : Google Scholar :
|
|
13
|
Biankin AV, Waddell N, Kassahn KS, Gingras
MC, Muthuswamy LB, Johns AL, Miller DK, Wilson PJ, Patch AM, Wu J,
et al: Pancreatic cancer genomes reveal aberrations in axon
guidance pathway genes. Nature. 491:399–405. 2012. View Article : Google Scholar : PubMed/NCBI
|
|
14
|
Hidalgo M: Pancreatic cancer. N Engl J
Med. 362:1605–1617. 2010. View Article : Google Scholar : PubMed/NCBI
|
|
15
|
Shain AH, Salari K, Giacomini CP and
Pollack JR: Integrative genomic and functional profiling of the
pancreatic cancer genome. BMC Genomics. 14:6242013. View Article : Google Scholar : PubMed/NCBI
|
|
16
|
Mohr S, Leikauf GD, Keith G and Rihn BH:
Microarrays as cancer keys: An array of possibilities. J Clin
Oncol. 20:3165–3175. 2002. View Article : Google Scholar : PubMed/NCBI
|
|
17
|
Chang ZY, Sun R, Ma YS, Fu D, Lai XL, Li
YS, Wang XH, Zhang XP, Lv ZW, Cong XL, et al: Differential gene
expression of the key signalling pathway in para-carcinoma,
carcinoma and relapse human pancreatic cancer. Cell Biochem Funct.
32:258–267. 2014. View
Article : Google Scholar
|
|
18
|
Nakamura T, Furukawa Y, Nakagawa H,
Tsunoda T, Ohigashi H, Murata K, Ishikawa O, Ohgaki K, Kashimura N,
Miyamoto M, et al: Genome-wide cDNA microarray analysis of gene
expression profiles in pancreatic cancers using populations of
tumor cells and normal ductal epithelial cells selected for purity
by laser microdissection. Oncogene. 23:2385–2400. 2004. View Article : Google Scholar : PubMed/NCBI
|
|
19
|
Backman V, Wallace MB, Perelman LT, Arendt
JT, Gurjar R, Müller MG, Zhang Q, Zonios G, Kline E, McGilligan JA,
et al: Detection of preinvasive cancer cells. Nature. 406:35–36.
2000. View
Article : Google Scholar : PubMed/NCBI
|
|
20
|
Schernhammer E, Wolpin B, Rifai N,
Cochrane B, Manson JA, Ma J, Giovannucci E, Thomson C, Stampfer MJ
and Fuchs C: Plasma folate, vitamin B6, vitamin B12, and
homocysteine and pancreatic cancer risk in four large cohorts.
Cancer Res. 67:5553–5560. 2007. View Article : Google Scholar : PubMed/NCBI
|
|
21
|
Johansson M, Relton C, Ueland PM, Vollset
SE, Midttun Ø, Nygård O, Slimani N, Boffetta P, Jenab M,
Clavel-Chapelon F, et al: Serum B vitamin levels and risk of lung
cancer. JAMA. 303:2377–2385. 2010. View Article : Google Scholar : PubMed/NCBI
|
|
22
|
Wu W, Kang S and Zhang D: Association of
vitamin B6, vitamin B12 and methionine with risk of breast cancer:
A dose-response meta-analysis. Br J Cancer. 109:1926–1944. 2013.
View Article : Google Scholar : PubMed/NCBI
|
|
23
|
Dubois EL: The effect of the L. E. cell
test on the clinical picture of systemic lupus erythematosus. Ann
Intern Med. 38:1265–1294. 1953. View Article : Google Scholar : PubMed/NCBI
|
|
24
|
Smedby KE, Hjalgrim H, Askling J, Chang
ET, Gregersen H, Porwit-MacDonald A, Sundström C, Akerman M, Melbye
M, Glimelius B, et al: Autoimmune and chronic inflammatory
disorders and risk of non-Hodgkin lymphoma by subtype. J Natl
Cancer Inst. 98:51–60. 2006. View Article : Google Scholar : PubMed/NCBI
|
|
25
|
Björnådal L, Löfström B, Yin L, Lundberg
IE and Ekbom A: Increased cancer incidence in a Swedish cohort of
patients with systemic lupus erythematosus. Scand J Rheumatol.
31:66–71. 2002. View Article : Google Scholar : PubMed/NCBI
|
|
26
|
Cibere J, Sibley J and Haga M: Systemic
lupus erythematosus and the risk of malignancy. Lupus. 10:394–400.
2001. View Article : Google Scholar : PubMed/NCBI
|
|
27
|
Pettersson T, Pukkala E, Teppo L and
Friman C: Increased risk of cancer in patients with systemic lupus
erythematosus. Ann Rheum Dis. 51:437–439. 1992. View Article : Google Scholar : PubMed/NCBI
|
|
28
|
Bernatsky S, Ramsey-Goldman R, Rajan R,
Boivin JF, Joseph L, Lachance S, Cournoyer D, Zoma A, Manzi S,
Ginzler E, et al: Non-Hodgkin's lymphoma in systemic lupus
erythematosus. Ann Rheum Dis. 64:1507–1509. 2005. View Article : Google Scholar : PubMed/NCBI
|
|
29
|
Ramsey-Goldman R, Mattai SA, Schilling E,
Chiu YL, Alo CJ, Howe HL and Manzi S: Increased risk of malignancy
in patients with systemic lupus erythematosus. J Investig Med.
46:217–222. 1998.PubMed/NCBI
|
|
30
|
Bernatsky S, Ramsey-Goldman R, Isenberg D,
Isenberg D, Rahman A, Dooley MA, Sibley J, Boivin JF, Joseph L,
Armitage J, et al: Hodgkin's lymphoma in systemic lupus
erythematosus. Rheumatology (Oxford). 46:830–832. 2007. View Article : Google Scholar
|
|
31
|
Landgren O, Engels EA, Pfeiffer RM,
Gridley G, Mellemkjaer L, Olsen JH, Kerstann KF, Wheeler W,
Hemminki K, Linet MS, et al: Autoimmunity and susceptibility to
Hodgkin lymphoma: A population-based case-control study in
Scandinavia. J Natl Cancer Inst. 98:1321–1330. 2006. View Article : Google Scholar : PubMed/NCBI
|
|
32
|
Gayed M, Bernatsky S, Ramsey-Goldman R,
Clarke A and Gordon C: Lupus and cancer. Lupus. 18:479–485. 2009.
View Article : Google Scholar : PubMed/NCBI
|
|
33
|
Bernatsky S, Boivin JF, Joseph L, Manzi S,
Ginzler E, Gladman DD, Urowitz M, Fortin PR, Petri M, Barr S, et
al: Mortality in systemic lupus erythematosus. Arthritis Rheum.
54:2550–2557. 2006. View Article : Google Scholar : PubMed/NCBI
|
|
34
|
Thomas E, Brewster DH, Black RJ and
Macfarlane GJ: Risk of malignancy among patients with rheumatic
conditions. Int J Cancer. 88:497–502. 2000. View Article : Google Scholar : PubMed/NCBI
|
|
35
|
Mellemkjér L, Andersen V, Linet MS, et al:
Non-Hodgkin's lymphoma and other cancers among a cohort of patients
with systemic lupus erythematosus. Arthritis Rheum. 40:761–768.
1997. View Article : Google Scholar
|
|
36
|
Bernatsky S, Ramsey-Goldman R and Clarke
AE: Revisiting the issue of malignancy risk in systemic lupus
erythematosus. Curr Rheumatol Rep. 7:476–481. 2005. View Article : Google Scholar : PubMed/NCBI
|
|
37
|
Ruiz-Irastorza G, Ugarte A, Egurbide MV,
Garmendia M, Pijoan JI, Martinez-Berriotxoa A and Aguirre C:
Antimalarials may influence the risk of malignancy in systemic
lupus erythematosus. Ann Rheum Dis. 66:815–817. 2007. View Article : Google Scholar : PubMed/NCBI
|
|
38
|
Bernatsky S, Boivin JF, Joseph L, Rajan R,
Zoma A, Manzi S, Ginzler E, Urowitz M, Gladman D, Fortin PR, et al:
An international cohort study of cancer in systemic lupus
erythematosus. Arthritis Rheum. 52:1481–1490. 2005. View Article : Google Scholar : PubMed/NCBI
|
|
39
|
Akerblom HK and Knip M: Putative
environmental factors in Type 1 diabetes. Diabetes Metab Rev.
14:31–67. 1998. View Article : Google Scholar : PubMed/NCBI
|
|
40
|
Stevens RJ, Roddam AW and Beral V:
Pancreatic cancer in type 1 and young-onset diabetes: Systematic
review and meta-analysis. Br J Cancer. 96:507–509. 2007. View Article : Google Scholar : PubMed/NCBI
|
|
41
|
Zendehdel K, Nyrén O, Ostenson CG, Adami
HO, Ekbom A and Ye W: Cancer incidence in patients with type 1
diabetes mellitus: A population-based cohort study in Sweden. J
Natl Cancer Inst. 95:1797–1800. 2003. View Article : Google Scholar : PubMed/NCBI
|