Introduction
Osteosarcoma (OS) is the most common type of primary
bone malignancy derived from primitive mesenchymal cells (1). OS originates predominantly from bone
and rarely from soft tissue (2).
With a high degree of malignancy, rapid progression and poor
prognosis, OS occurs predominantly in teenagers, and, in
adolescents between the ages of 15 and 19 years, OS comprises 15%
of all types of solid extra cranial cancer (3,4).
Several studies have been performed to investigate
the molecular mechanisms underlying OS. For example, increased
expression levels of vascular endothelial growth factor A (VEGFA)
have been reported to induce metastasis and OS development
(5–7), the major angiogenic factors, VEGF165
and VEGF189, may be critical for neovascularisation in OS (8), and pigment epithelium-derived factor
(PEDF) not only induces apoptotic cell death in OS cells, but also
suppress the expression of VEGF, resulting in the inhibition of
tumor angiogenesis (9).
Alterations in p53 have also been found in uncultured OS samples,
with a frequency ranging between 18 and 42%, indicating that p53
may be involved in the pathogenesis of OS (10,11).
In the context of bone morphogenetic protein (BMP)/small mothers of
decapentaplegic (SMAD) signaling, runt-related transcription factor
2 (Runx2) can act as an inducer of apoptosis and suppressor of
growth in OS and normal osteoblasts (12). There exists an important role for
human epidermal growth factor receptor 2 (HER2) in the promotion of
metastatic potential in OS and in aggressive tumor growth (13).
In 2012, Namløs et al (14) used an integrative microarray
approach to analyze genome-wide mRNA expression patterns between a
panel of 19 EuroBoNeT OS cell lines and four normal bone cell
lines, according to the cut-off point of false discovery rate (FDR)
<0.05, and obtained 8,982 mRNA probes, which were significantly
differently expressed between the two groups. Using the same data
used by Namløs et al (14),
the present study aimed to further screen for differentially
expressed genes (DEGs) using a more strict threshold of FDR<0.01
and |log2fold-change (FC)|>1, and to analyze the potential
functions of the DEGs using Gene Ontology (GO) functional analysis
and Kyoto Encyclopedia of Genes and Genomes (KEGG) pathway
enrichment analysis. In addition, the present study aimed to
construct a protein-protein interaction (PPI) network of these DEGs
and screen the modules of the PPI network to identify the
interactions/association between the DEGs.
Materials and methods
Microarray data
The expression profile of GSE28424, deposited by
Namløs et al (14) was
downloaded from the Gene Expression Omnibus (GEO; http://www.ncbi.nlm.nih.gov/geo/), which was
based on the platform of the GPL13376 Illumina HumanWG-6 v2.0
expression beadchip (Illumina, San Diego, CA, USA). The GSE28424
dataset included a collective of 19 OS cell lines and four normal
bone cell lines, of which the latter were used as controls.
DEGs screening
Following downloading of the GSE28424 data, the
microarray data was normalized to a linear model of box plots of
log2[(perfect match probe value)-MM (mismatch probe value)] using
quantile normalization (15).
Subsequently, the DEGs between the OS patients and normal control
cell lines were analyzed using the linear models for microarray
data (Limma) package in Bioconductor (http://www.bioconductor.org/packages/release/bioc/html/limma.html)
(16). The adjusted P-value
(FDR)<0.01 and |log2FC|>1 were used as the cut-off
criteria.
Functional analysis and pathway
enrichment analysis
As an integrated and high-throughput data-mining
environment, the Database for Annotation, Visualization and
Integrated Discovery (DAVID; http://david.abcc.ncifcrf.gov/) analyzes gene lists
from high-throughput genomic experiments (17). The aim of Gene Ontology (GO;
http://www.geneontology.org/) is to
provide access to extensive documentation and perform functional
analyses (18) KEGG (http://www.genome.ad.jp/kegg/) is a comprehensive
database resource, which consists of chemical information, genomic
information and systems information (19). Using the DAVID online tool, GO
functional analysis and KEGG pathway enrichment analysis were
performed for the DEGs. In addition, the GO functional enrichment
analyses was focussed predominantly on biological process (BP).
P<0.05 was used as the cut-off criterion.
PPI network and module construction
The Search Tool for the Retrieval of Interacting
Genes (STRING) online software (http://string-db.org/) (20) was used to identify
interactions/associations between the proteins encoded by the DEGs,
and a combined score >0.7 was used as the cut-off criterion.
Subsequently, Cytoscape software (http://cytoscape.org/download_old_versions.html)
(21) was used to visualize the
PPI network and the Clique Percolation Method (CPM) was used in
CFinder software (http://cfinder.org/) (22) to screen the modules of the PPI
network. The clique value (k) was set to six.
Results
DEG analysis
A total of 1,170 DEGs were screened, which included
530 upregulated genes and 640 downregulated genes. There were a
higher number of downregulated genes, compared with upregulated
genes.
Functional analysis and pathway
enrichment analysis
The top 10 most enriched GO functions for the DEGs
are listed in Table I. For the
upregulated genes, the enriched functions in the BP category
included organelle fission (P=1.19E-09), cell cycle process
(P=3.90E-09) and nuclear division (P=8.03E-09). For the
downregulated genes, the enriched functions in the BP category
included immune response (P=5.15E-32), defense response
(P=2.69E-28) and response to wounding (P=1.40E-15).
 | Table IThe top 10 most enriched GO functions
for the differentially expressed genes. |
Table I
The top 10 most enriched GO functions
for the differentially expressed genes.
| Gene | Category | ID | Term | Number of genes | Examples of
genes | P-value |
|---|
| Upregulated | BP | GO:0048285 | Organelle
fission | 56 | KIF23, CEP72 | 1.19E-09 |
| GO:0022402 | Cell cycle
process | 45 | BCAT1, KIF23 | 3.90E-09 |
| GO:0000280 | Nuclear division | 26 | KIF23, CEP72 | 8.03E-09 |
| GO:0000278 | Mitotic cell
cycle | 35 | KIF23, BCAT1 | 4.44E-09 |
| GO:0007067 | Mitosis | 26 | MAD2L1, CCNB2 | 8.03E-09 |
| Downregulated | BP | GO:0006955 | Immune
response | 100 | AQP9, TLR2 | 5.15E-32 |
| GO:0006952 | Defense
response | 89 | KIR2DL3,
CD300LB | 2.69E-28 |
| GO:0006954 | Inflammatory
response | 53 | MBP, CD96 | 4.47E-19 |
| GO:0002684 | Positive regulation
of immune system process | 43 | CCL23, HRH2 | 3.47E-17 |
| GO:0009611 | Response to
wounding | 63 | FGF7, ACVRL1 | 1.40E-15 |
The top 10 enriched KEGG pathways for the DEGs are
listed in Table II. For the
upregulated genes, the enriched pathways included steroid
biosynthesis (P=0.0023), ribosome (P=0.0294) and aminoacyl-tRNA
biosynthesis (P=0.0125). For the downregulated genes, the enriched
pathways included cell adhesion molecules (CAMs, P=3.74E-05),
hematopoietic cell lineage (P=1.05E-04) and natural killer
cell-mediated cytotoxicity (P=1.36E-04).
| Table IIThe top 10 most enriched Kyoto
Encyclopedia of Genes and Genomes pathways for the differentially
expressed genes. |
Table II
The top 10 most enriched Kyoto
Encyclopedia of Genes and Genomes pathways for the differentially
expressed genes.
| Gene | Name | Number of
genes | Examples of
genes | P-value |
|---|
| Upregulated | hsa00100:Steroid
biosynthesis | 5 | SQLE, DHCR7 | 0.0023 |
| hsa00270:Cysteine
and methionine metabolism | 6 | AHCY, DNMT1 | 0.0056 |
|
hsa03040:Spliceosome | 11 | SNRPA1, MAGOH | 0.0110 |
|
hsa00970:Aminoacyl-tRNA biosynthesis | 6 | YARS, NARS2 | 0.0125 |
|
hsa03010:Ribosome | 8 | RPL6, RPL8 | 0.0294 |
| Downregulated | hsa04514:Cell
adhesion molecules | 20 | HLA-DQB1, F11R | 3.74E-05 |
|
hsa05310:Asthma | 9 | CD2, SELE | 7.43E-05 |
|
hsa04640:Hematopoietic cell lineage | 15 | IL1R2, CR1 | 1.05E-04 |
|
hsa05332:Graft-versus-host disease | 10 | PRF1, KIR2DL3 | 1.21E-04 |
| hsa04650:Natural
killer cell mediated cytotoxicity | 19 | PRF1, PTPN6 | 1.36E-04 |
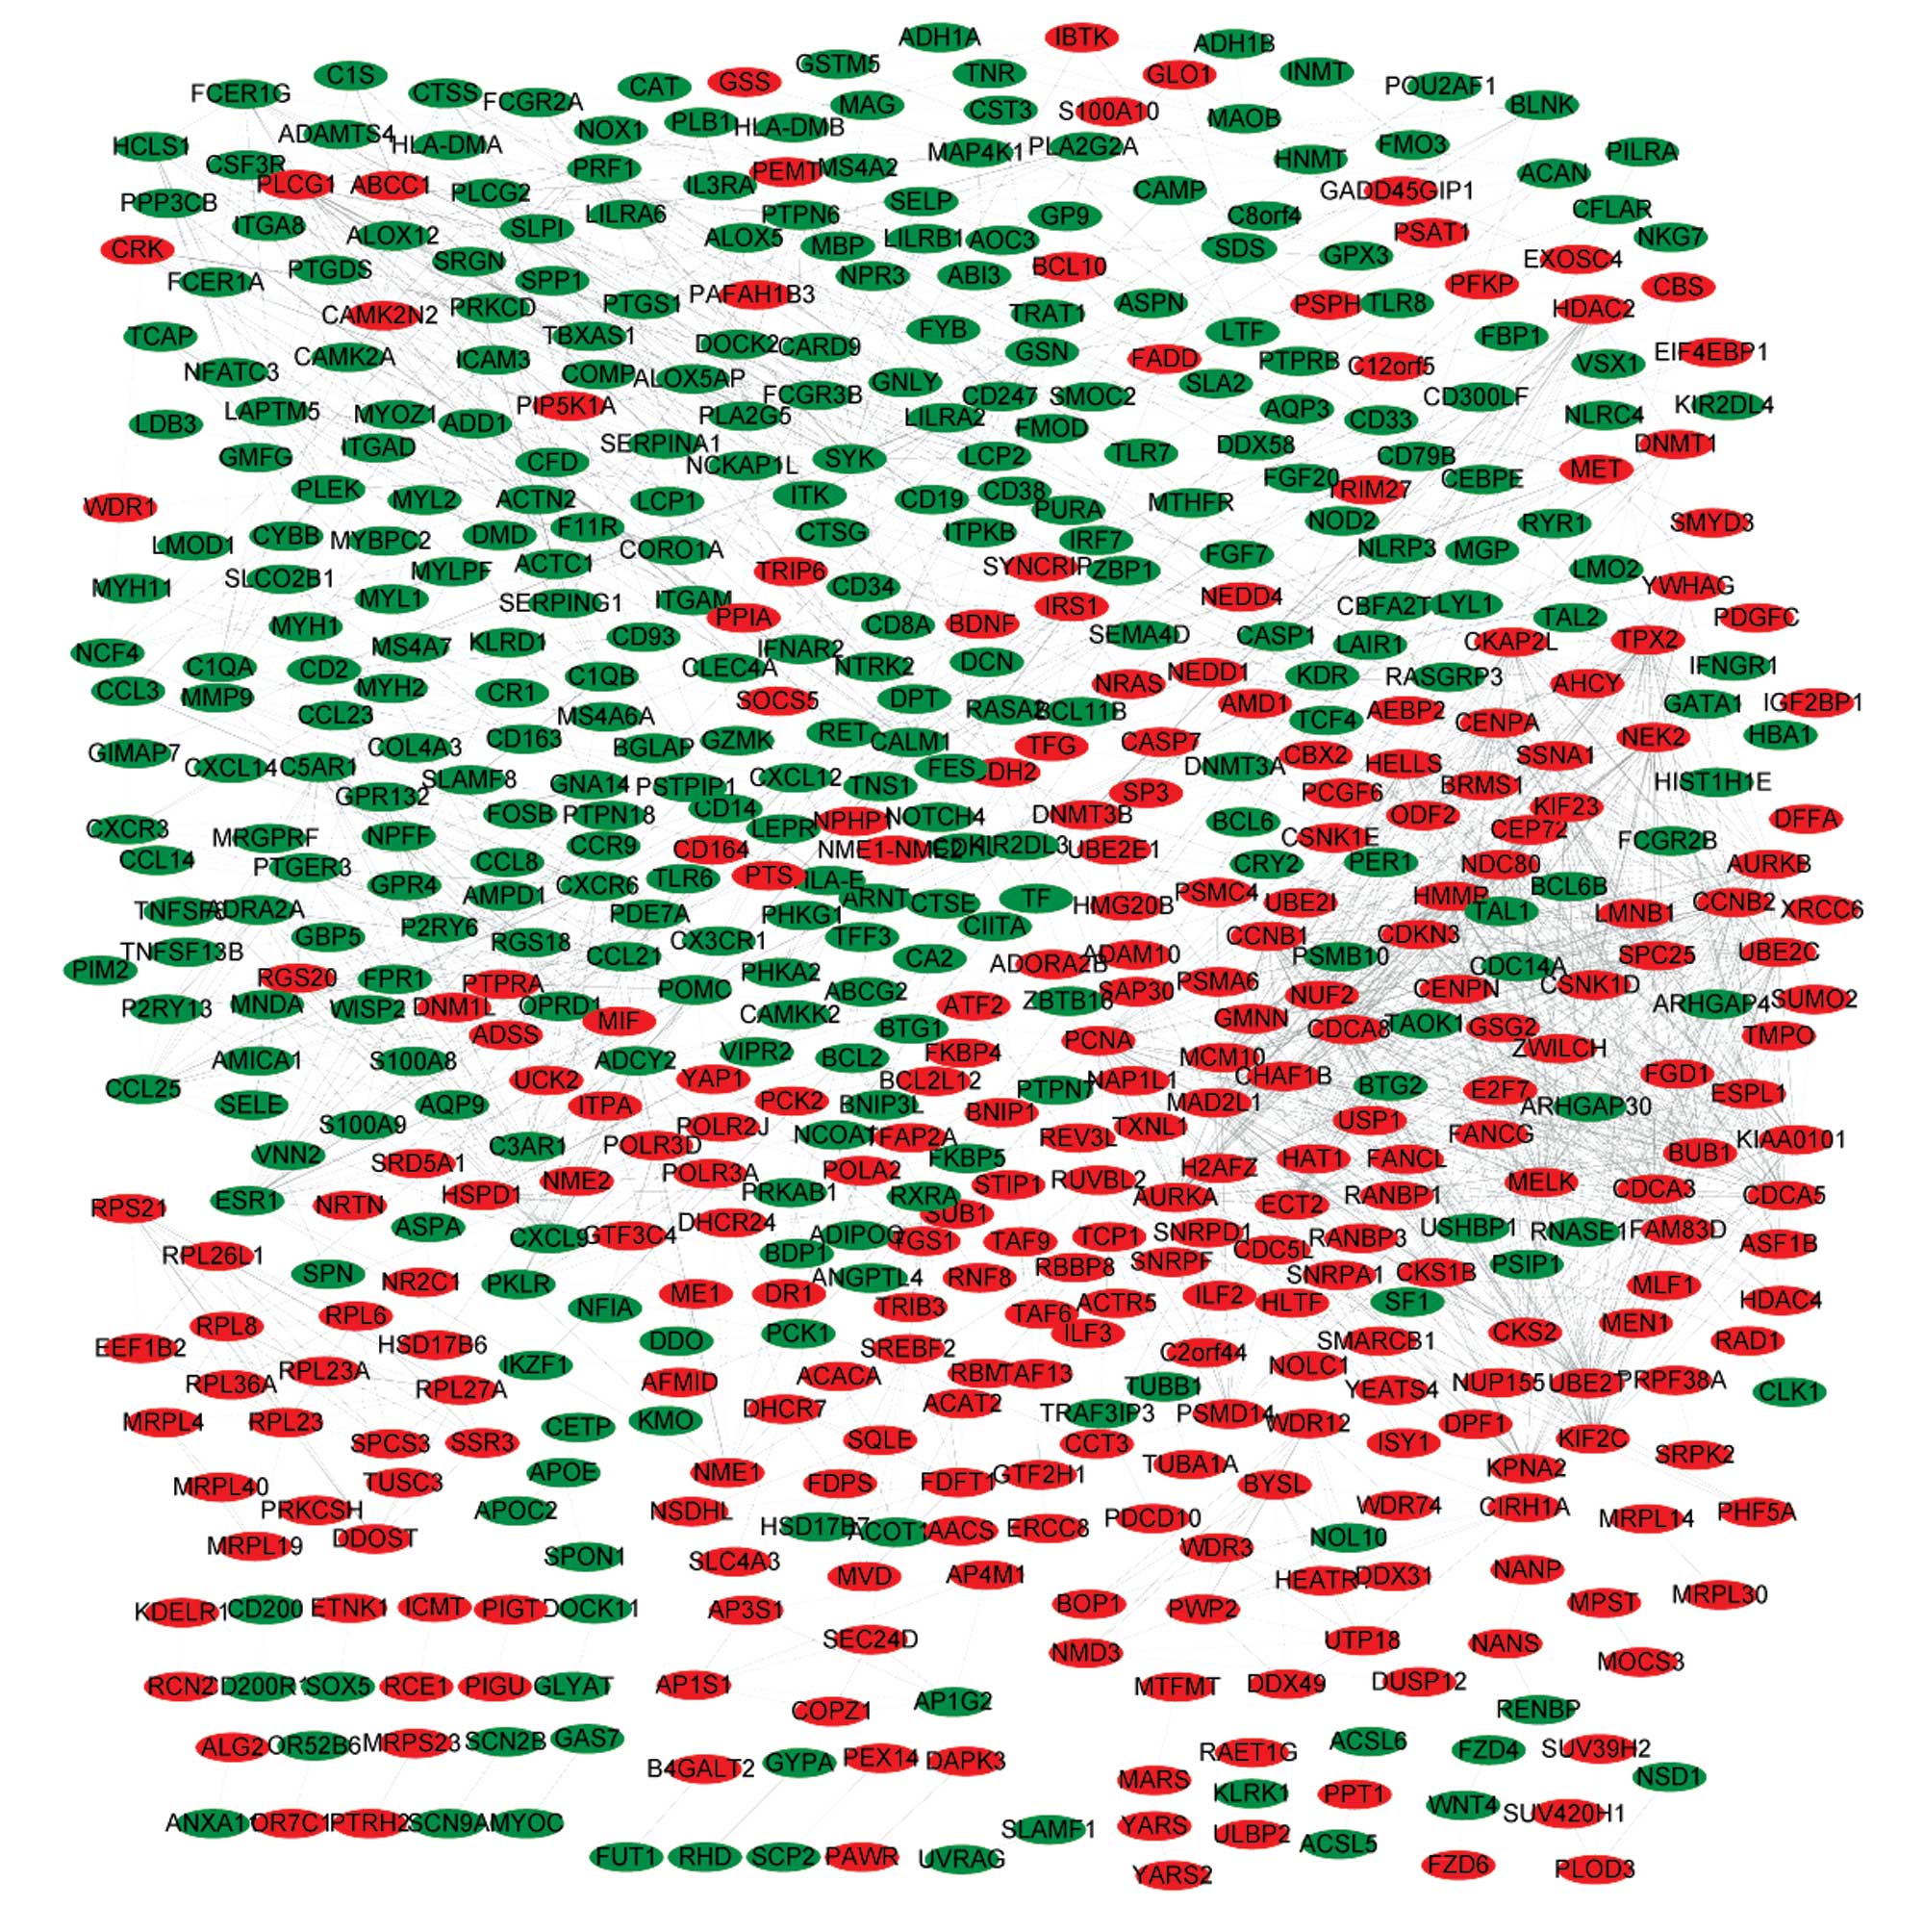
PPI network and module construction
The PPI network of the DEGs was revealed to have 590
nodes and 1,888 interactions (Fig.
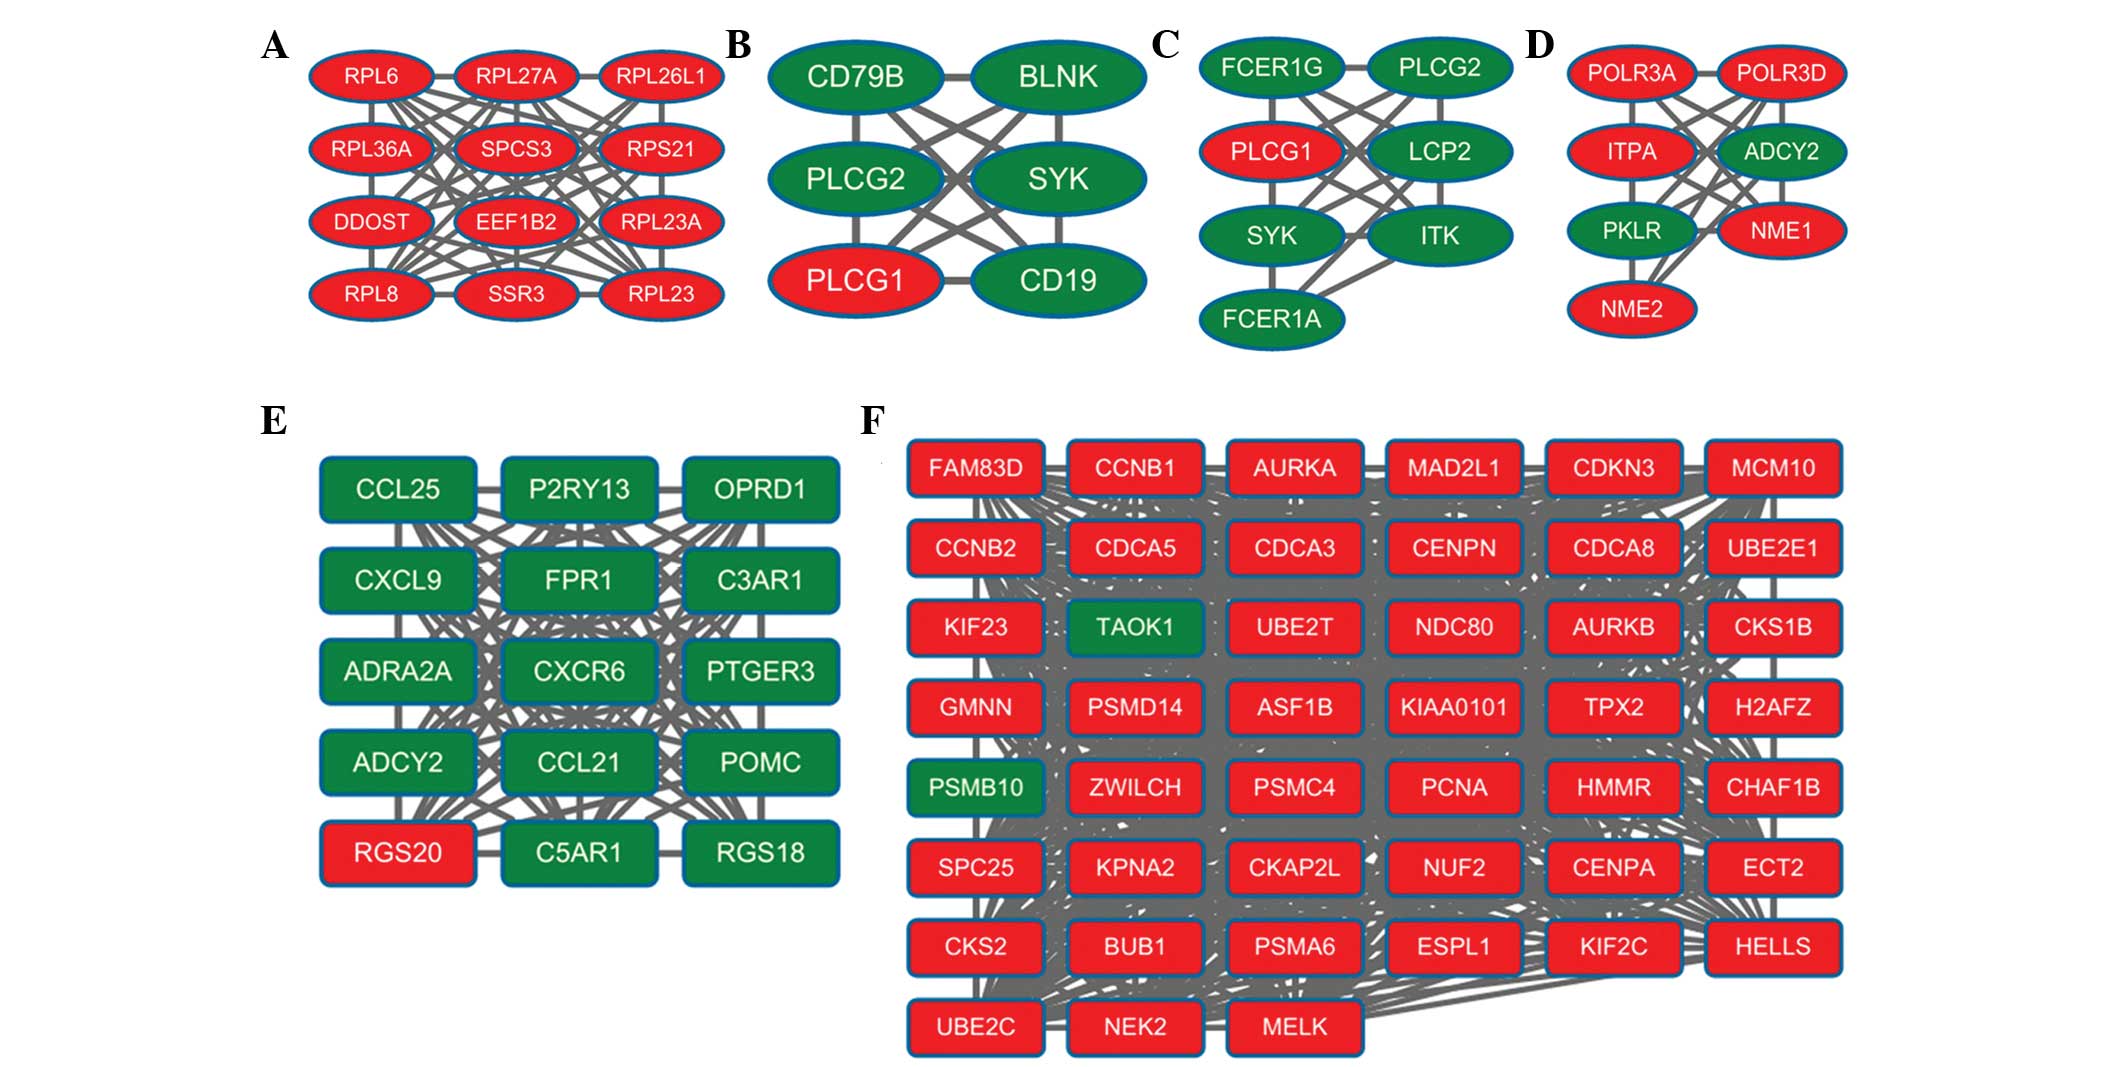
1). A total of 10 modules were obtained from the PPI network,
of which the top six modules (modules A-F) are shown in Fig. 2. The enriched pathways for the DEGs
in the six modules are listed in Table III. Module A had 12 nodes and 50
interactions. In this module, all the DEGs were upregulated genes.
The enriched KEGG pathways for DEGs in module A included ribosome
(P=2.65E-12), which involved ribosomal protein L8 (RPL8).
| Table IIIEnriched Kyoto Encyclopedia of Genes
and Genomes pathways for differentially expressed genes in modules
A-F. |
Table III
Enriched Kyoto Encyclopedia of Genes
and Genomes pathways for differentially expressed genes in modules
A-F.
| Module | Name | Number of
genes | Examples of
genes | P-value |
|---|
| A |
hsa03010:Ribosome | 8 | RPL6, RPL8 | 2.65E-12 |
| B | hsa04662:B cell
receptor signaling pathway | 5 | PLCγ2, SYK | 2.16E-07 |
| hsa04664:Fc epsilon
RI signaling pathway | 3 | PLCγ1, PLCγ2,
SYK | 0.0023 |
| hsa04666:Fc gamma
R-mediated phagocytosis | 3 | PLCγ1, PLCγ2,
SYK | 0.0033 |
| hsa04650:Natural
killer cell mediated cytotoxicity | 3 | PLCγ1, PLCγ2,
SYK | 0.0064 |
| hsa05340:Primary
immunodeficiency | 2 | CD19, BLNK | 0.0340 |
| hsa04664:Fc epsilon
RI signaling pathway | 6 | PLCγ1, PLCγ2,
SYK | 4.43E-09 |
| hsa04650:Natural
killer cell mediated cytotoxicity | 5 | PLCγ1, PLCγ2,
SYK | 6.45E-06 |
| C | hsa04666:Fc gamma
R-mediated phagocytosis | 3 | PLCγ1, PLCγ2,
SYK | 0.0049 |
| hsa04660:T cell
receptor signaling pathway | 3 | ITK, PLCγ1,
LCP2 | 0.0063 |
| hsa04670:Leukocyte
transendothelial migration | 3 | ITK, PLCγ1,
PLCγ2 | 0.0075 |
|
hsa05310:Asthma | 2 | FCER1A, FCER1G | 0.0338 |
| D | hsa00230:Purine
metabolism | 6 | ADCY2, NME1,
PKLR | 2.31E-08 |
| hsa00240:Pyrimidine
metabolism | 5 | NME2, NME1 | 6.15E-05 |
| hsa03020:RNA
polymerase | 2 | POLR3A, POLR3D | 0.0272 |
| hsa04623:Cytosolic
DNA-sensing pathway | 2 | POLR3A, POLR3D | 0.0529 |
| E |
hsa04080:Neuroactive ligand-receptor
interaction | 7 | C5AR1, PTGER3,
FPR1 | 1.10E-05 |
| hsa04062:Chemokine
signaling pathway | 5 | CCL25, ADCY2,
CCL21, CXCR6, CXCL9 | 6.95E-04 |
| F |
hsa04060:Cytokine-cytokine receptor
interaction | 4 | CCL25, CCL21,
CXCR6, CXCL9 | 0.0210 |
| hsa04114:Oocyte
meiosis | 6 | | |
| hsa04110:Cell
cycle | 6 | CCNB1, CCNB2,
MAD2L1, BUB1, ESPL1, AURKA CCNB1, CCNB2, MAD2L1, BUB1, PCNA,
ESPL1 | 1.56E-05
2.91E-05 |
|
hsa03050:Proteasome | 4 | PSMB10, PSMD14,
PSMA6, PSMC4 | 3.81E-04 |
|
hsa04914:Progesterone-mediated oocyte
maturation | 4 | CCNB1, CCNB2,
MAD2L1, BUB1 | 0.0022 |
Module B had six nodes and 15 interactions. In this
module, the number of upregulated genes was considerably lower than
the number of downregulated genes. For the DEGs in module B, the
enriched KEGG pathways included the B-cell receptor signaling
pathway (P=2.16E-07), Fc epsilon RI signaling pathway (P=0.0023)
and natural killer cell-mediated cytotoxicity (P=0.0064). In module
B, the B -cell receptor signaling pathway involved phospholipase
Cγ1 (PLCγ1), spleen tyrosine kinase (SYK) and phospholipase Cγ2
(PLCγ2).
Module C had seven nodes and 20 interactions. In
this module, the number of upregulated genes was markedly lower
than the number of downregulated genes. The enriched KEGG pathways
for the DEGs in module C included the Fc epsilon RI signaling
pathway (P=4.43E-09), FcγR-mediated phagocytosis (P=0.0049) and
leukocyte transendothelial migration (P=0.0075). In module C, the
Fc-epsilon RI signaling pathway also involved PLCγ1, SYK and
PLCγ2.
Module D had seven nodes and 20 interactions. In
this module, the number of upregulated genes was higher than the
number of downregulated genes. For the DEGs in module D, the
enriched KEGG pathways included purine metabolism (P=2.31E-08),
pyrimidine metabolism (P=6.15E-05) and the cytosolic DNA-sensing
pathway (P=0.0529). The purine metabolism pathway involved
adenylate cyclase 2 (ADCY2), NME/NM23 nucleoside diphosphate kinase
1 (NME1) and pyruvate kinase, liver and red blood cell (PKLR).
Module E had 15 nodes and 102 interactions. In this
module, the number of upregulated genes was significantly lower
than the number of downregulated genes. The enriched KEGG pathways
for DEGs in module E included neuroactive ligand-receptor
interaction (P=1.10E-05), chemokine signaling pathway (P=6.95E-04)
and cytokine-cytokine receptor interaction (P=0.0210). The
neuroactive ligand-receptor interaction pathway involved complement
component 5a receptor 1 (C5AR1), prostaglandin E receptor 3
(PTGER3) and formyl peptide receptor 1 (FPR1).
Module F had 45 nodes and 609 interactions. In this
module, the number of upregulated genes was significantly more than
the number of downregulated genes. For the DEGs in module F, the
enriched KEGG pathways included oocyte meiosis (P=1.56E-05), cell
cycle (P=2.91E-05) and progesterone-mediated oocyte maturation
(P=0.0022). Notably, cyclin B1 (CCNB1; degree=40), aurora kinase A
(AURKA; degree=39), MAD2 mitotic arrest defective-like 1 (MAD2L1;
degree=38), cell division cycle associated 8 (CDCA8; degree=38),
budding uninhibited by benzimidazoles 1 (BUB1; degree=37) and
maternal embryonic leucine zipper kinase (MELK; degree=37)
exhibited higher degrees of connectivity. In addition, several
interactive associations were identified, including MAD2L1-AURKA,
MAD2L1-CDCA8, MAD2L1-BUB1 and MAD2L1-MELK.
Discussion
In the present study, a total of 1,170 DEGs were
screened, including 530 upregulated genes and 640 downregulated
genes. The enriched pathways for the DEGs included steroid
biosynthesis and ribosome. In particular, AURKA (degree=39), MAD2L1
(degree=38), CDCA8 (degree=38), BUB1 (degree=37) and MELK
(degree=37) exhibited higher degrees of connectivity in module F of
the PPI network of the DEGs.
As a member of the L2P family of ribosomal proteins,
RPL8 is a component of the 60S ribosomal subunit in eucaryotic
cells (23). Amplification of RPL8
may be associated with the pathogenesis of OS (24). RPL8 can respond to the chemotherapy
in conventional OS, and it may be beneficial in the assessment at
diagnosis and for stratifying participants of randomized trials
(25). A daily-repeated ribosome
biogenesis inhibition can result in progressive reduction of
ribosome content and extinction of protein- and p53-deficient human
OS cell lines (26). In module A,
the enriched ribosome pathway involved RPL8, indicating that RPL8
may be involved in OS.
PLC is important in mediating intracellular signal
transduction (27). As a member of
the PLC family, PLCγ1 is upregulated in several cancer cell lines
and cancer tissues (28). It is
also reported that PLCγ1 promotes the invasion of several types of
tumor (29-31). PLCγ2 translocation is essential in
transmitting TPA signal to PKCα and PKCα can directly promote the
apoptosis of human cancer cell lines, thus, PLCγ2 is critical in
the process of inducting apoptosis (32). The SYK gene can be reactivated by
inhibition of DNA promoter methylation in human cancer and may act
as a tumor suppressor (33). The
B-cell receptor signaling pathway has been correlated with OS
(34). In module B in the present
study, the B-cell receptor signaling pathway involved PLCγ1, SYK
and PLCγ2. The Fc-epsilon RI signaling pathway involves multiple
component genes that are altered at the chromosome level, and may
be associated with the pathogenesis of OS (5). In module C, the Fc-epsilon RI
signaling pathway also involved PLCγ1, SYK and PLCγ2. Thus, it was
hypothesized that PLCγ1, SYK and PLCγ2 may be closely correlated
with OS. In addition, in modules B and C, the upregulated PLCγ1 was
observed to have an interactive association with down-regulated SYK
and PLCγ2, indicating that PLCγ1 may also be involved in OS by
mediating SYK and PLCγ2.
The overexpression of MAD2 can be caused by
retinoblastoma pathway inactivation and is associated with
carcinogenesis (35). The
expression of MAD2 is upregulated in human OS, and its
overexpression is involved in earlier metastasis and poorer
survival rates in patients with human OS (36). Knockdown of MAD2 can induce OS cell
apoptosis, involving the cleavage of Rad21 (37). This suggests that MAD2L1 may be
closely correlated with OS. The mitotic checkpoint gene, BUB1, may
also drive tumor metastasis and progression (38). CDCA8 and aurora kinase B (AURKB)
are overexpressed in tumor cells (39,40)
and selective suppression of the CDCA8-AURKB pathway may be a
promising therapeutic strategy in the treatment of cancer (41). MELK is a protein kinase and
candidate oncoprotein, which is dysregulated in several types of
cancer (42–44), as well as being involved in
resistance to apoptosis (43). In
module F in the present study, MAD2L1 had interactive associations
seperately with AURKA, CDCA8, BUB1 and MELK, suggesting that MAD2L1
may also be involved in OS by mediating AURKA, CDCA8, BUB1 and
MELK.
In conclusion, the present study performed a
comprehensive bioinformatics analysis of genes, which may be
involved in OS. A total of 1,170 DEGs were screened, which
including 530 upregulated genes and 640 downregulated genes. The
results of the subsequent analyses suggested that RPL8, PLCγ1,
PLCγ2, SYK, MAD2L1, AURKA, CDCA8, BUB1 and MELK may be correleted
with OS. However, further investigations are required to elucidate
their mechanisms of action in OS.
References
|
1
|
Ottaviani G and Jaffe N: The epidemiology
of osteosarcoma. Cancer Treat Res. 152:3–13. 2009. View Article : Google Scholar
|
|
2
|
Ritter J and Bielack SS: Osteosarcoma. Ann
Oncol. 21(Suppl 7): vii320–vii325. 2010. View Article : Google Scholar : PubMed/NCBI
|
|
3
|
Stiller CA, Bielack SS, Jundt G and
Steliarova-Foucher E: Bone tumours in European children and
adolescents, 1978–1997. Report from the automated childhood cancer
information system project. Eur J Cancer. 42:2124–2135. 2006.
View Article : Google Scholar : PubMed/NCBI
|
|
4
|
Stiller CA, Craft AW and Corazziari I:
EUROCARE Working Group: Survival of children with bone sarcoma in
Europe since 1978: results from the EUROCARE study. Eur J Cancer.
37:760–766. 2001. View Article : Google Scholar : PubMed/NCBI
|
|
5
|
Yang J, Yang D, Sun Y, et al: Genetic
amplification of the vascular endothelial growth factor (VEGF)
pathway genes, including VEGFA, in human osteosarcoma. Cancer.
117:4925–4938. 2011. View Article : Google Scholar : PubMed/NCBI
|
|
6
|
Quan GM and Choong PF: Anti-angiogenic
therapy for osteosarcoma. Cancer Metast Rev. 25:707–713. 2006.
View Article : Google Scholar
|
|
7
|
Dvorak HF: Vascular permeability
factor/vascular endothelial growth factor: A critical cytokine in
tumor angiogenesis and a potential target for diagnosis and
therapy. J Clin Oncol. 20:4368–4380. 2002. View Article : Google Scholar : PubMed/NCBI
|
|
8
|
Lee Y, Tokunaga T, Oshika Y, et al:
Cell-retained isoforms of vascular endothelial growth factor (VEGF)
are correlated with poor prognosis in osteosarcoma. Eur J Cancer.
35:1089–1093. 1999. View Article : Google Scholar : PubMed/NCBI
|
|
9
|
Takenaka K, Yamagishi SI, Jinnouchi Y,
Nakamura K, Matsui T and Imaizumi T: Pigment epithelium-derived
factor (PEDF)-induced apoptosis and inhibition of vascular
endothelial growth factor (VEGF) expression in MG63 human
osteosarcoma cells. Life Sci. 77:3231–3241. 2005. View Article : Google Scholar : PubMed/NCBI
|
|
10
|
Miller CW, Aslo A, Tsay C, et al:
Frequency and structure of p53 rearrangements in human
osteosarcoma. Cancer Res. 50:7950–7954. 1990.PubMed/NCBI
|
|
11
|
Mousses S, Mcauley L, Bell RS, Kandel R
and Andrulis IL: Molecular and immunohistochemical identification
of p53 alterations in bone and soft tissue sarcomas. Mod Pathol.
9:1–6. 1996.PubMed/NCBI
|
|
12
|
Eliseev R, Dong Y, Sampson E, et al:
Runx2-mediated activation of the Bax gene increases osteosarcoma
cell sensitivity to apoptosis. Oncogene. 27:3605–3614. 2008.
View Article : Google Scholar : PubMed/NCBI
|
|
13
|
Onda M, Matsuda S, Higaki S, et al: ErbB-2
expression is correlated with poor prognosis for patients with
osteosarcoma. Cancer. 77:71–78. 1996. View Article : Google Scholar : PubMed/NCBI
|
|
14
|
Namløs HM, Meza-Zepeda LA, et al:
Modulation of the osteosarcoma expression phenotype by microRNAs.
PloS One. 7:e480862012. View Article : Google Scholar : PubMed/NCBI
|
|
15
|
Irizarry RA, Hobbs B, Collin F, et al:
Exploration, normalization and summaries of high density
oligonucleotide array probe level data. Biostatistics. 4:249–264.
2003. View Article : Google Scholar : PubMed/NCBI
|
|
16
|
Gentleman R, Carey VJ, Huber W, Irizarry
RA and Dudoit S: Bioinformatics and computational biology solutions
using R and Bioconductor. 746718470. Springer; New York NY: 2005,
View Article : Google Scholar
|
|
17
|
Huang da W, Sherman BT and Lempicki RA:
Systematic and integrative analysis of large gene lists using DAVID
bioinformatics resources. Nat Protoc. 4:44–57. 2008. View Article : Google Scholar
|
|
18
|
Harris MA, Clark J, Ireland A, et al: The
Gene Ontology (GO) database and informatics resource. Nucleic Acids
Res. 32:D258–D261. 2004. View Article : Google Scholar
|
|
19
|
Lu M, Zhang Q, Deng M, et al: An analysis
of human microRNA and disease associations. PloS One. 3:e34202008.
View Article : Google Scholar : PubMed/NCBI
|
|
20
|
Franceschini A, Szklarczyk D, Frankild S,
et al: STRING v9.1: Protein-protein interaction networks, with
increased coverage and integration. Nucleic Acids Res.
41:D808–D815. 2013. View Article : Google Scholar :
|
|
21
|
Saito R, Smoot ME, Ono K, et al: A travel
guide to Cytoscape plugins. Nat Med. 9:1069–1076. 2012.
|
|
22
|
Palla G, Derényi I, Farkas I and Vicsek T:
Uncovering the overlapping community structure of complex networks
in nature and society. Nature. 435:814–818. 2005. View Article : Google Scholar : PubMed/NCBI
|
|
23
|
Cui XR, Hou WR, Yang J, Hou Y and Peng ZS:
Cloning and sequence analysis of ribosomal protein L8 gene (RPL8)
from the (Ailuropoda melanoleuca). 2011 4th International
Conference on Biomedical Engineering and Informatics; Shanghai,
China. pp. 1407–1411. 2011
|
|
24
|
Yang J and Zhang W: New molecular insights
into osteosarcoma targeted therapy. Curr Opin Oncol. 25:398–406.
2013. View Article : Google Scholar : PubMed/NCBI
|
|
25
|
Salas S, Jézéquel P, Campion L, Deville
JL, Chibon F, Bartoli C, Gentet JC, Charbonnel C, Gouraud W,
Voutsinos-Porche B, et al: Molecular characterization of the
response to chemotherapy in conventional osteosarcomas: Predictive
value of HSD17B10 and IFITM2. Int J Cancer. 125:851–860. 2009.
View Article : Google Scholar : PubMed/NCBI
|
|
26
|
Montanaro L, Mazzini G, Barbieri S, et al:
Different effects of ribosome biogenesis inhibition on cell
proliferation in retinoblastoma protein-and p53-deficient and
proficient human osteosarcoma cell lines. Cell Prolif. 40:532–549.
2007. View Article : Google Scholar : PubMed/NCBI
|
|
27
|
Fukami K: Structure, regulation and
function of phospholipase C isozymes. J Biochem. 131:293–299. 2002.
View Article : Google Scholar : PubMed/NCBI
|
|
28
|
Noh DY, Kang H, Kim YC, et al: Expression
of phospholipase C-gamma 1 and its transcriptional regulators in
breast cancer tissues. Anticancer Res. 18:2643–2648. 1997.
|
|
29
|
Mamoune A, Kassis J, Kharait S, Kloeker S,
Manos E, Jones DA and Wells A: DU145 human prostate carcinoma
invasiveness is modulated by urokinase receptor (uPAR) downstream
of epidermal growth factor receptor (EGFR) signaling. Exp Cell Res.
299:91–100. 2004. View Article : Google Scholar : PubMed/NCBI
|
|
30
|
Kochhar KS and Iyer AP: Hepatocyte growth
factor induces activation of Nck and phospholipase C-γ in lung
carcinoma cells. Cancer Lett. 104:163–169. 1996. View Article : Google Scholar : PubMed/NCBI
|
|
31
|
Kassis J, Radinsky R and Wells A: Motility
is rate-limiting for invasion of bladder carcinoma cell lines. Int
J Biochem Cell Biol. 34:762–775. 2002. View Article : Google Scholar : PubMed/NCBI
|
|
32
|
Zhang B, Wu Q, Ye XF, Liu S, Lin XF and
Chen MC: Roles of PLC-gamma2 and PKCalpha in TPA-induced apoptosis
of gastric cancer cells. World J Gastroenterol. 9:2413–2418.
2003.PubMed/NCBI
|
|
33
|
Dong S, Ma L, Xu N, et al: Research on the
reactivation of Syk expression caused by the inhibition of DNA
promoter methylation in the lung cancer. Neoplasma. 58:89–95. 2010.
View Article : Google Scholar : PubMed/NCBI
|
|
34
|
Luo P, Yang X, Ying M, et al:
Retinoid-suppressed phosphorylation of RARα mediates the
differentiation pathway of osteosarcoma cells. Oncogene.
29:2772–2783. 2010. View Article : Google Scholar : PubMed/NCBI
|
|
35
|
Agoston AT, Argani P, De Marzo AM, Hicks
JL and Nelson WG: Retinoblastoma pathway dysregulation causes DNA
methyltrans-ferase 1 overexpression in cancer via MAD2-mediated
inhibition of the anaphase-promoting complex. Am J Pathol.
170:1585–1593. 2007. View Article : Google Scholar : PubMed/NCBI
|
|
36
|
Yu L, Guo WC, Zhao SH, Tang J and Chen JL:
Mitotic arrest defective protein 2 expression abnormality and its
clinicopathologic significance in human osteosarcoma. Apmis.
118:222–229. 2010. View Article : Google Scholar : PubMed/NCBI
|
|
37
|
Yu L, Guo W, Zhao S, Tang J and Liu J:
Knockdown of Mad2 induces osteosarcoma cell apoptosis-involved
Rad21 cleavage. J Orthop Sci. 16:814–820. 2011. View Article : Google Scholar : PubMed/NCBI
|
|
38
|
Shichiri M, Yoshinaga K, Hisatomi H,
Sugihara K and Hirata Y: Genetic and epigenetic inactivation of
mitotic checkpoint genes hBUB1 and hBUBR1 and their relationship to
survival. Cancer Res. 62:13–17. 2002.PubMed/NCBI
|
|
39
|
Bischoff JR, Anderson L, Zhu Y, et al: A
homologue of Drosophila aurora kinase is oncogenic and amplified in
human colorectal cancers. EMBO J. 17:3052–3065. 1998. View Article : Google Scholar : PubMed/NCBI
|
|
40
|
Branca M, Giorgi C, Santini D, et al:
Survivin as a marker of cervical intraepithelial neoplasia and
high-risk human papillomavirus and a predictor of virus clearance
and prognosis in cervical cancer. Am J Clin Pathol. 124:113–121.
2005. View Article : Google Scholar : PubMed/NCBI
|
|
41
|
Hayama S, Daigo Y, Yamabuki T, et al:
Phosphorylation and activation of cell division cycle associated 8
by aurora kinase B plays a significant role in human lung
carcinogenesis. Cancer Res. 67:4113–4122. 2007. View Article : Google Scholar : PubMed/NCBI
|
|
42
|
Pickard MR, Green AR, Ellis IO, et al:
Dysregulated expression of Fau and MELK is associated with poor
prognosis in breast cancer. Breast Cancer Res. 11:R602009.
View Article : Google Scholar : PubMed/NCBI
|
|
43
|
Lin ML, Park JH, Nishidate T, Nakamura Y
and Katagiri T: Involvement of maternal embryonic leucine zipper
kinase (MELK) in mammary carcinogenesis through interaction with
Bcl-G, a pro-apoptotic member of the Bcl-2 family. Breast Cancer
Res. 9:R172007. View
Article : Google Scholar : PubMed/NCBI
|
|
44
|
Gray D, Jubb AM, Hogue D, et al: Maternal
embryonic leucine zipper kinase/murine protein serine-threonine
kinase 38 is a promising therapeutic target for multiple cancers.
Cancer Res. 65:9751–9761. 2005. View Article : Google Scholar : PubMed/NCBI
|