Introduction
Gene transcription is regulated by dynamic
interactions between cis-regulatory elements and regulatory
proteins, including transcription factors (TFs). Tumor protein p53
is an important TF involved in various cellular processes,
including growth arrest, senescence and apoptosis (1–3).
Following cellular stress, stabilized p53 translocates into the
nucleus and subsequently binds to the consensus sequence motif to
regulate the expression of hundreds of genes.
p53 is critical in tumor suppression and loss of p53
function is required for cancer progression. Mutational
inactivation of p53 is detected in >50% of human cancer types
(4). A number of downstream
proteins of p53 have been identified (5–7).
Nevertheless, several of the factors expected to affect p53-induced
changes in gene expression are poorly understood, including the
impact of different stresses that can induce p53. Genome-wide
studies may provide an improved understanding of its
transcriptional regulatory functions in certain types of cancer
(8–10), including osteosarcoma.
Osteosarcoma is the eighth most common type of
childhood cancer and is also the most common histological form of
primary bone cancer (11). The
mortality rates for osteosarcoma have been declining by ~1.3%
annually (12). The overall 5-year
survival rate for osteosarcoma is ~68% (12). Future studies are required to fully
disclose the molecular mechanisms and advance therapeutic
development.
In the present study, human U2OS osteosarcoma cells,
expressing wild-type p53, were used to investigate the effect of
treatment with Nutlin-3 (a non-genotoxic activator of p53) on p53
binding genes. Different from a previous study by Menendez et
al (13), a stricter threshold
[|log2fold change (FC)|>1 and false discovery rate
(FDR) <0.05 vs. FC>2 and FDR ≤0.1] was used to select the
differentially expressed genes (DEGs) and to construct the
regulatory association between p53 and its target genes.
Materials and methods
Raw data
The raw data (accession number, GSE46642) were
downloaded from Gene Expression Omnibus (http://www.ncbi.nlm.nih.gov/geo/), including chromatin
immunoprecipitation-sequencing (ChIP-seq) data (accession number,
GSE46641; three Nutlin-3 treated U2OS cell samples) and microarray
data (accession number, GSE46493; three Nutlin-3 treated U2OS cell
samples and three control samples). Gene expression levels were
measured using Affymetrix Human Genome U133 Plus 2.0 Array
(Affymetrix Inc., Santa Clara, CA, USA).
Pre-treatment and differential
analysis
The microarray data were read using the package,
affy (14), on the software
R (http://www.r-project.org/). Following
background correction and normalization with a Robust Multi-array
Analysis (RMA) method in R affy, the gene expression levels
were determined. Differential analysis was performed using the
package, linear models for microarray data (limma) (15), on the software R.
Multiple-testing correction was performed using the Bayes method
(implemented in the 'limma' R package). The following
threshold was set for the screening of the DEGs: |log2
FC|>1 and FDR<0.05.
Integrative analysis of microarray data
and ChIP-seq data
ChIP-Array (http://jjwanglab.org/chip-array) is an online tool
developed for integrative analysis of microarray data and ChIP-seq
data (16). It identifies the
indirect target, Z, by identifying an intermediate transcription
factor (TF), Y, which is a putative regulator of Z and a target of
X. The putative regulator of Z is identified by scanning all
promoters in the genome with position weight matrix (PWMs) of all
Ys from three publicly accessible databases [JASPAR (http://jaspar.genereg.net), UniPROBE (http://uniprobe.org) and TRANSFAC (http://www.gene-regulation.com/pub/databases.html)
derived transcription factor binding site database from University
of California, Santa Cruz genome browser] (16).
In the present study, the parameters were set as
follows: Promoter range, −500~+100; TF database, UniPROBE; PWM scan
P-value, 10−5; and conservation filtering P-value,
0.001. Finally, a gene regulatory network was obtained for p53,
including its direct and indirect target genes.
Functional enrichment analysis
Gene Ontology (GO) and Kyoto Encyclopedia of Genes
and Genomes (KEGG) pathway enrichment analyses were performed for
the DEGs using the Database for Annotation, Visualization and
Integration Discovery (http://david.abcc.ncifcrf.gov/) online tools (17). P<0.05 was considered to indicate
a statistically significant difference and was set as the
cut-off.
Results
Differentially expressed genes
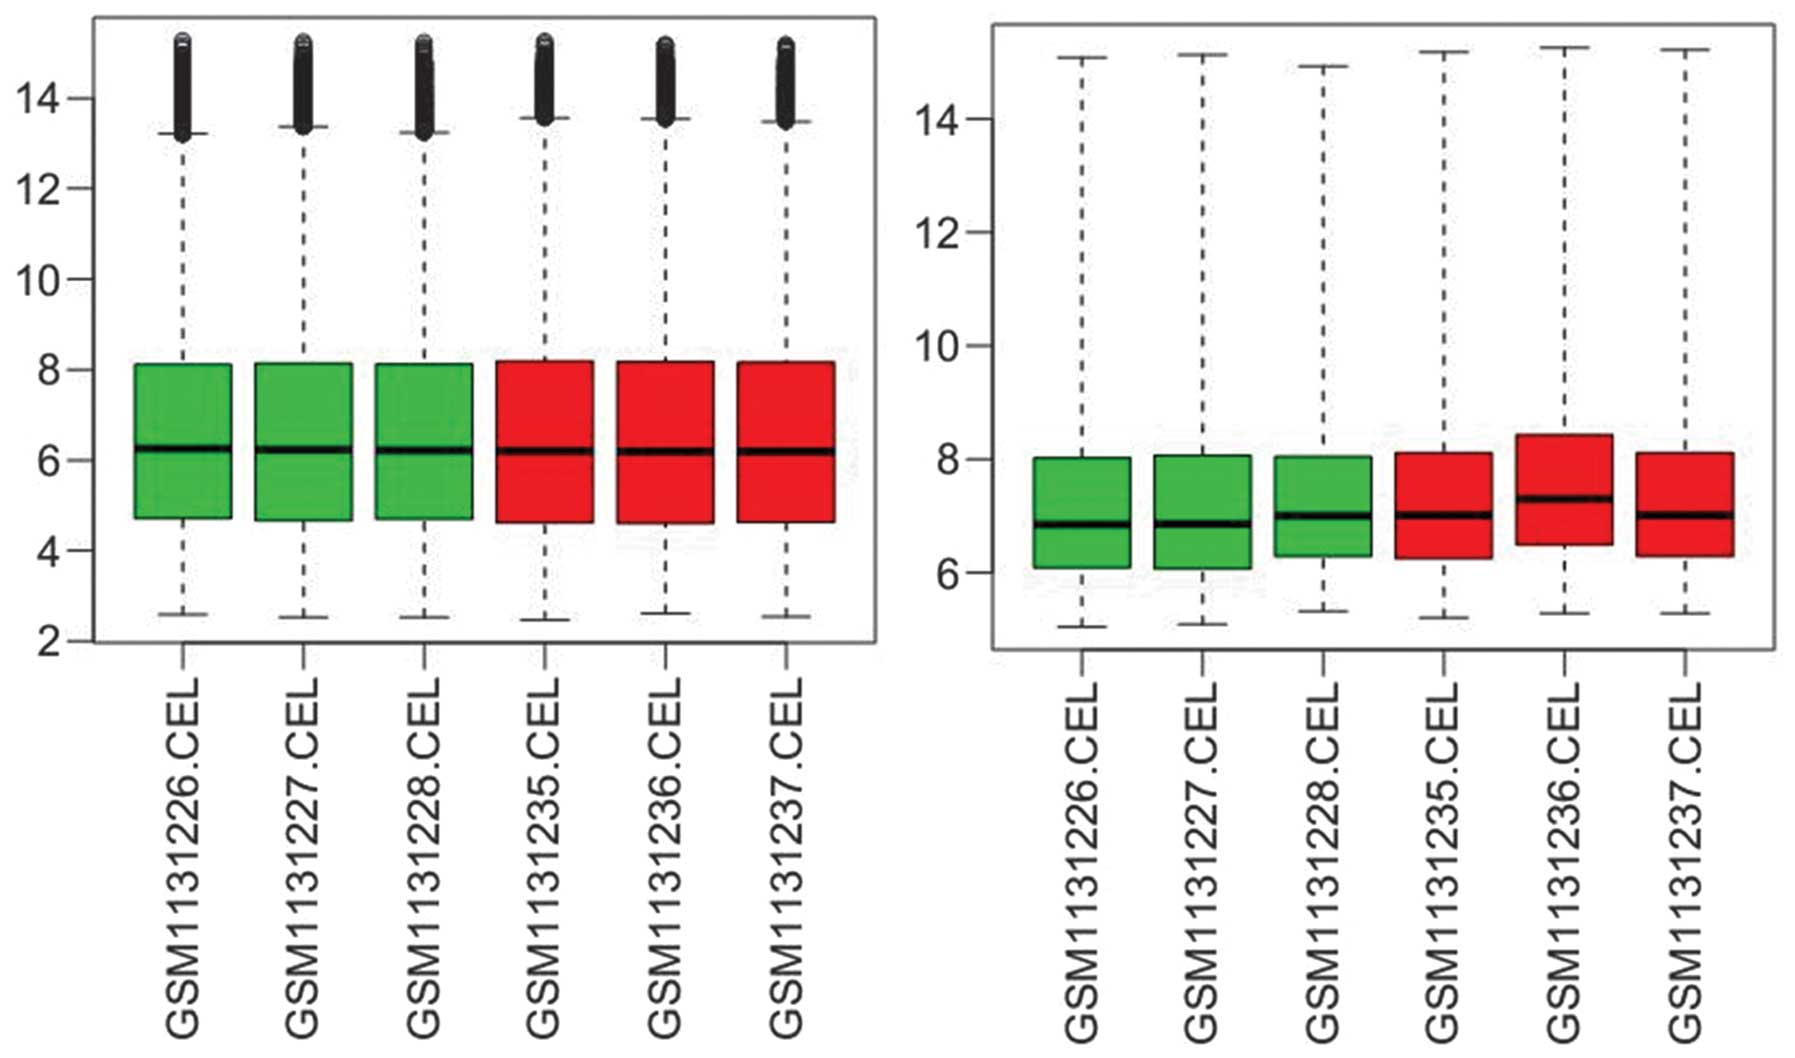
Gene expression data prior to and following
normalization with the RMA method are demonstrated in Fig. 1. A good performance of
normalization was achieved.
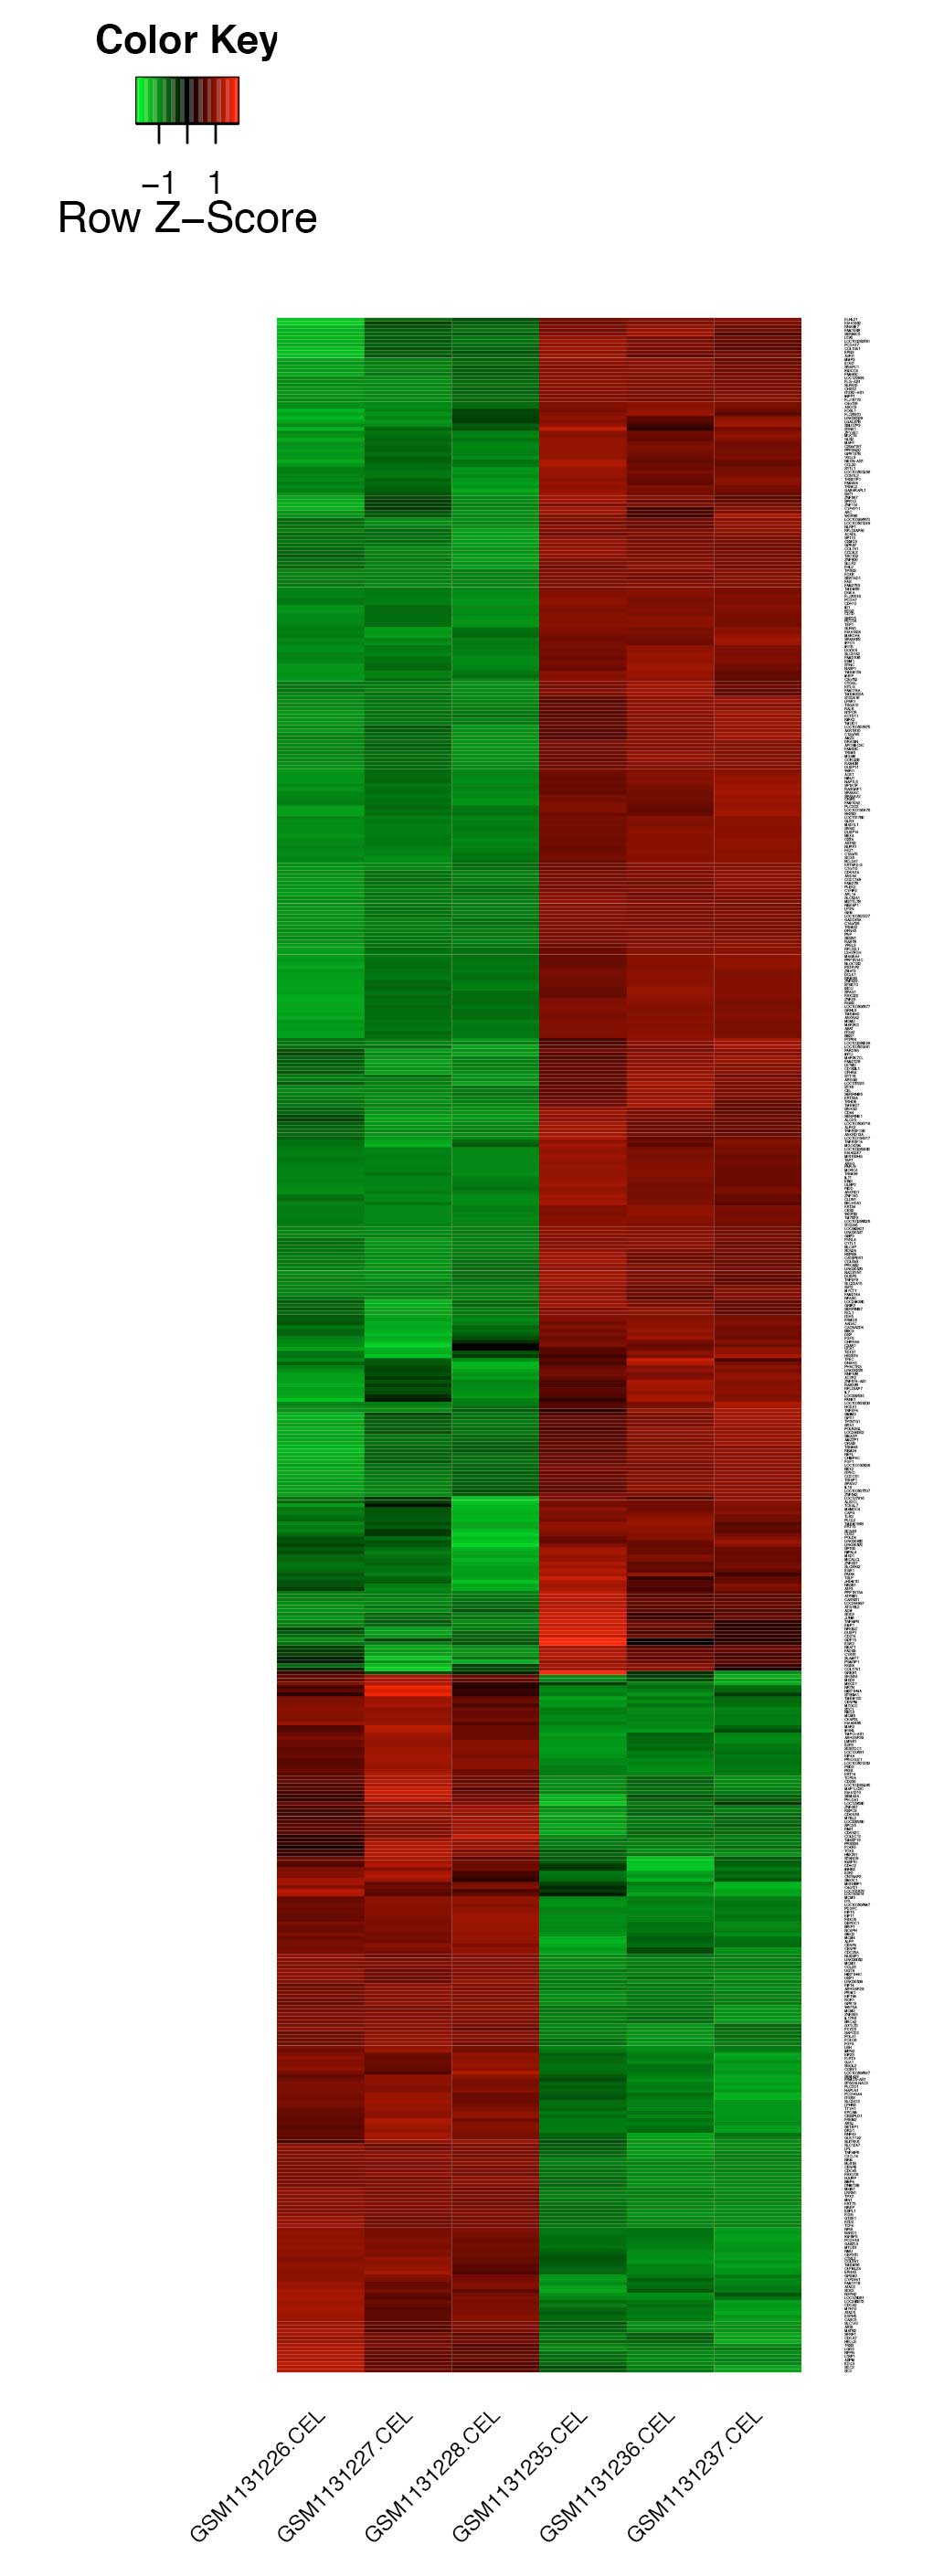
A total of 565 DEGs were identified, including 373
upregulated genes and 192 downregulated genes. Clustering and a
heat-map of the expression values for DEGs are shown in Fig. 2. The Nutlin-3 treated U2OS samples
were well distinguished from the control samples, suggesting the
reliability of the DEGs.
Functional enrichment analysis
result
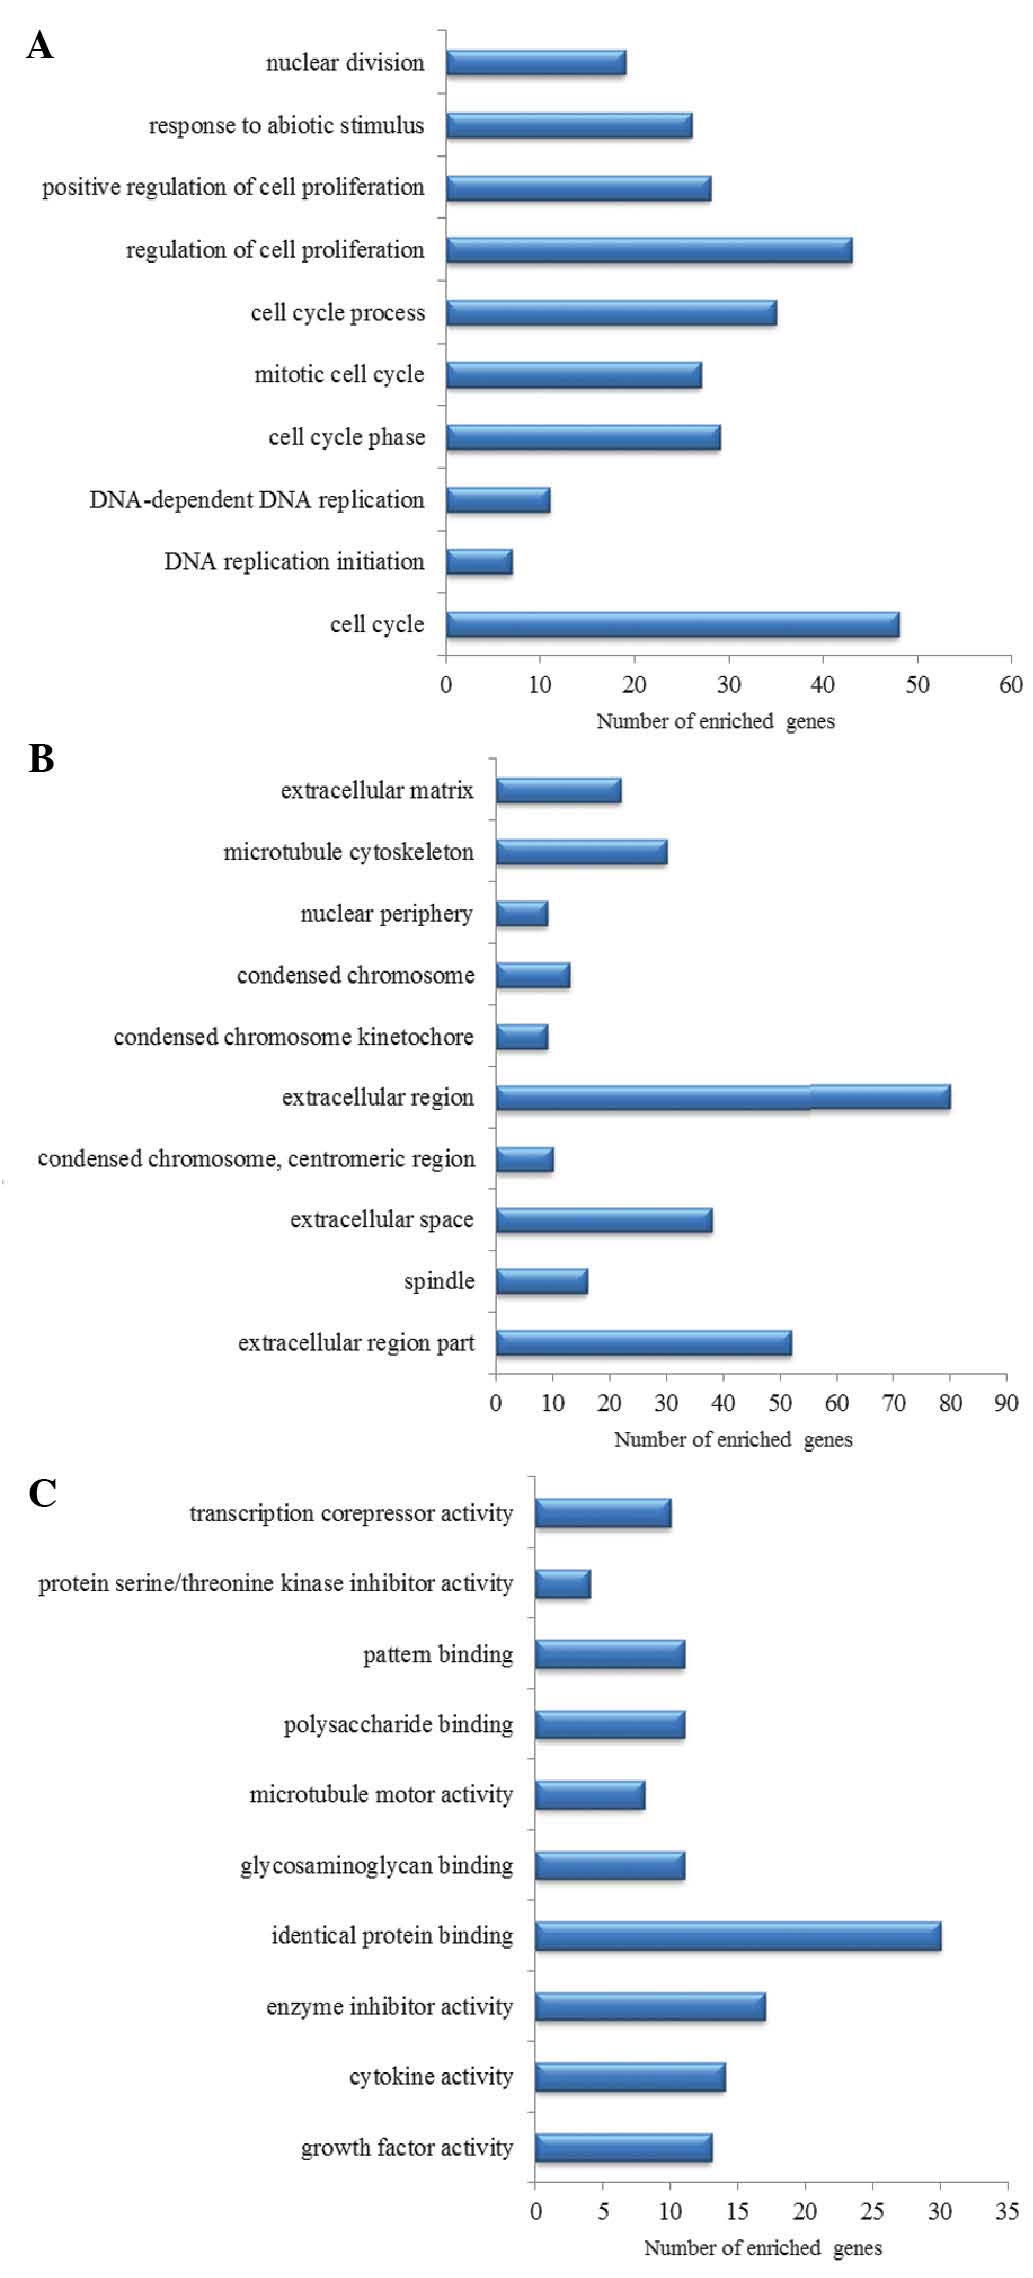
The top 10 GO terms are listed in Fig. 3. Nuclear division, the response to
abiotic stimulus, positive regulation of cell proliferation and
cell cycle were significantly enriched in the DEGs.
The KEGG pathways with P<0.05 are listed in
Table I. The p53 signaling
pathway, cell cycle, DNA replication, cytokine-cytokine receptor
interaction and melanoma were significantly over-represented in the
DEGs.
 | Table IKyoto Encyclopedia of Genes and
Genomes pathways enriched in the differentially expressed
genes. |
Table I
Kyoto Encyclopedia of Genes and
Genomes pathways enriched in the differentially expressed
genes.
| Pathway | Count | P-value | Genes |
|---|
| p53 signaling
pathway | 13 | 2.49E-07 | ZMAT3, RRM2B, SESN1,
GTSE1, TP53I3, CDKN1A, TNFRSF10B, BBC3, SERPINB5, SERPINE1, MDM2,
FAS, GADD45A |
| Cell cycle | 16 | 1.39E-06 | E2F2, MAD1L1, ESPL1,
MCM2, MCM3, MCM4, CDC25A, MCM5, MCM6, CDKN1A, CDC45, CDKN1B,
CDKN2C, BUB1B, MDM2, GADD45A |
| DNA replication | 8 | 4.62E-05 | PRIM1, POLD4, POLA1,
MCM2, MCM3, MCM4, MCM5, MCM6 |
| Cytokine-cytokine
Receptor interaction | 17 | 2.23E-03 | TNFSF4, IL7, IL18,
KITLG, TNFRSF14, TNFSF9, IL11, IL17RB, CCL26, TSLP, TNFRSF10B,
CCL20, CXCL14, INHBE, CCL3L3, PDGFC, FAS |
| Melanoma | 7 | 1.33E-02 | E2F2, FGF5, CDKN1A,
FGF9, MDM2, PDGFC, FGF1 |
Transcriptional regulatory network of
p53
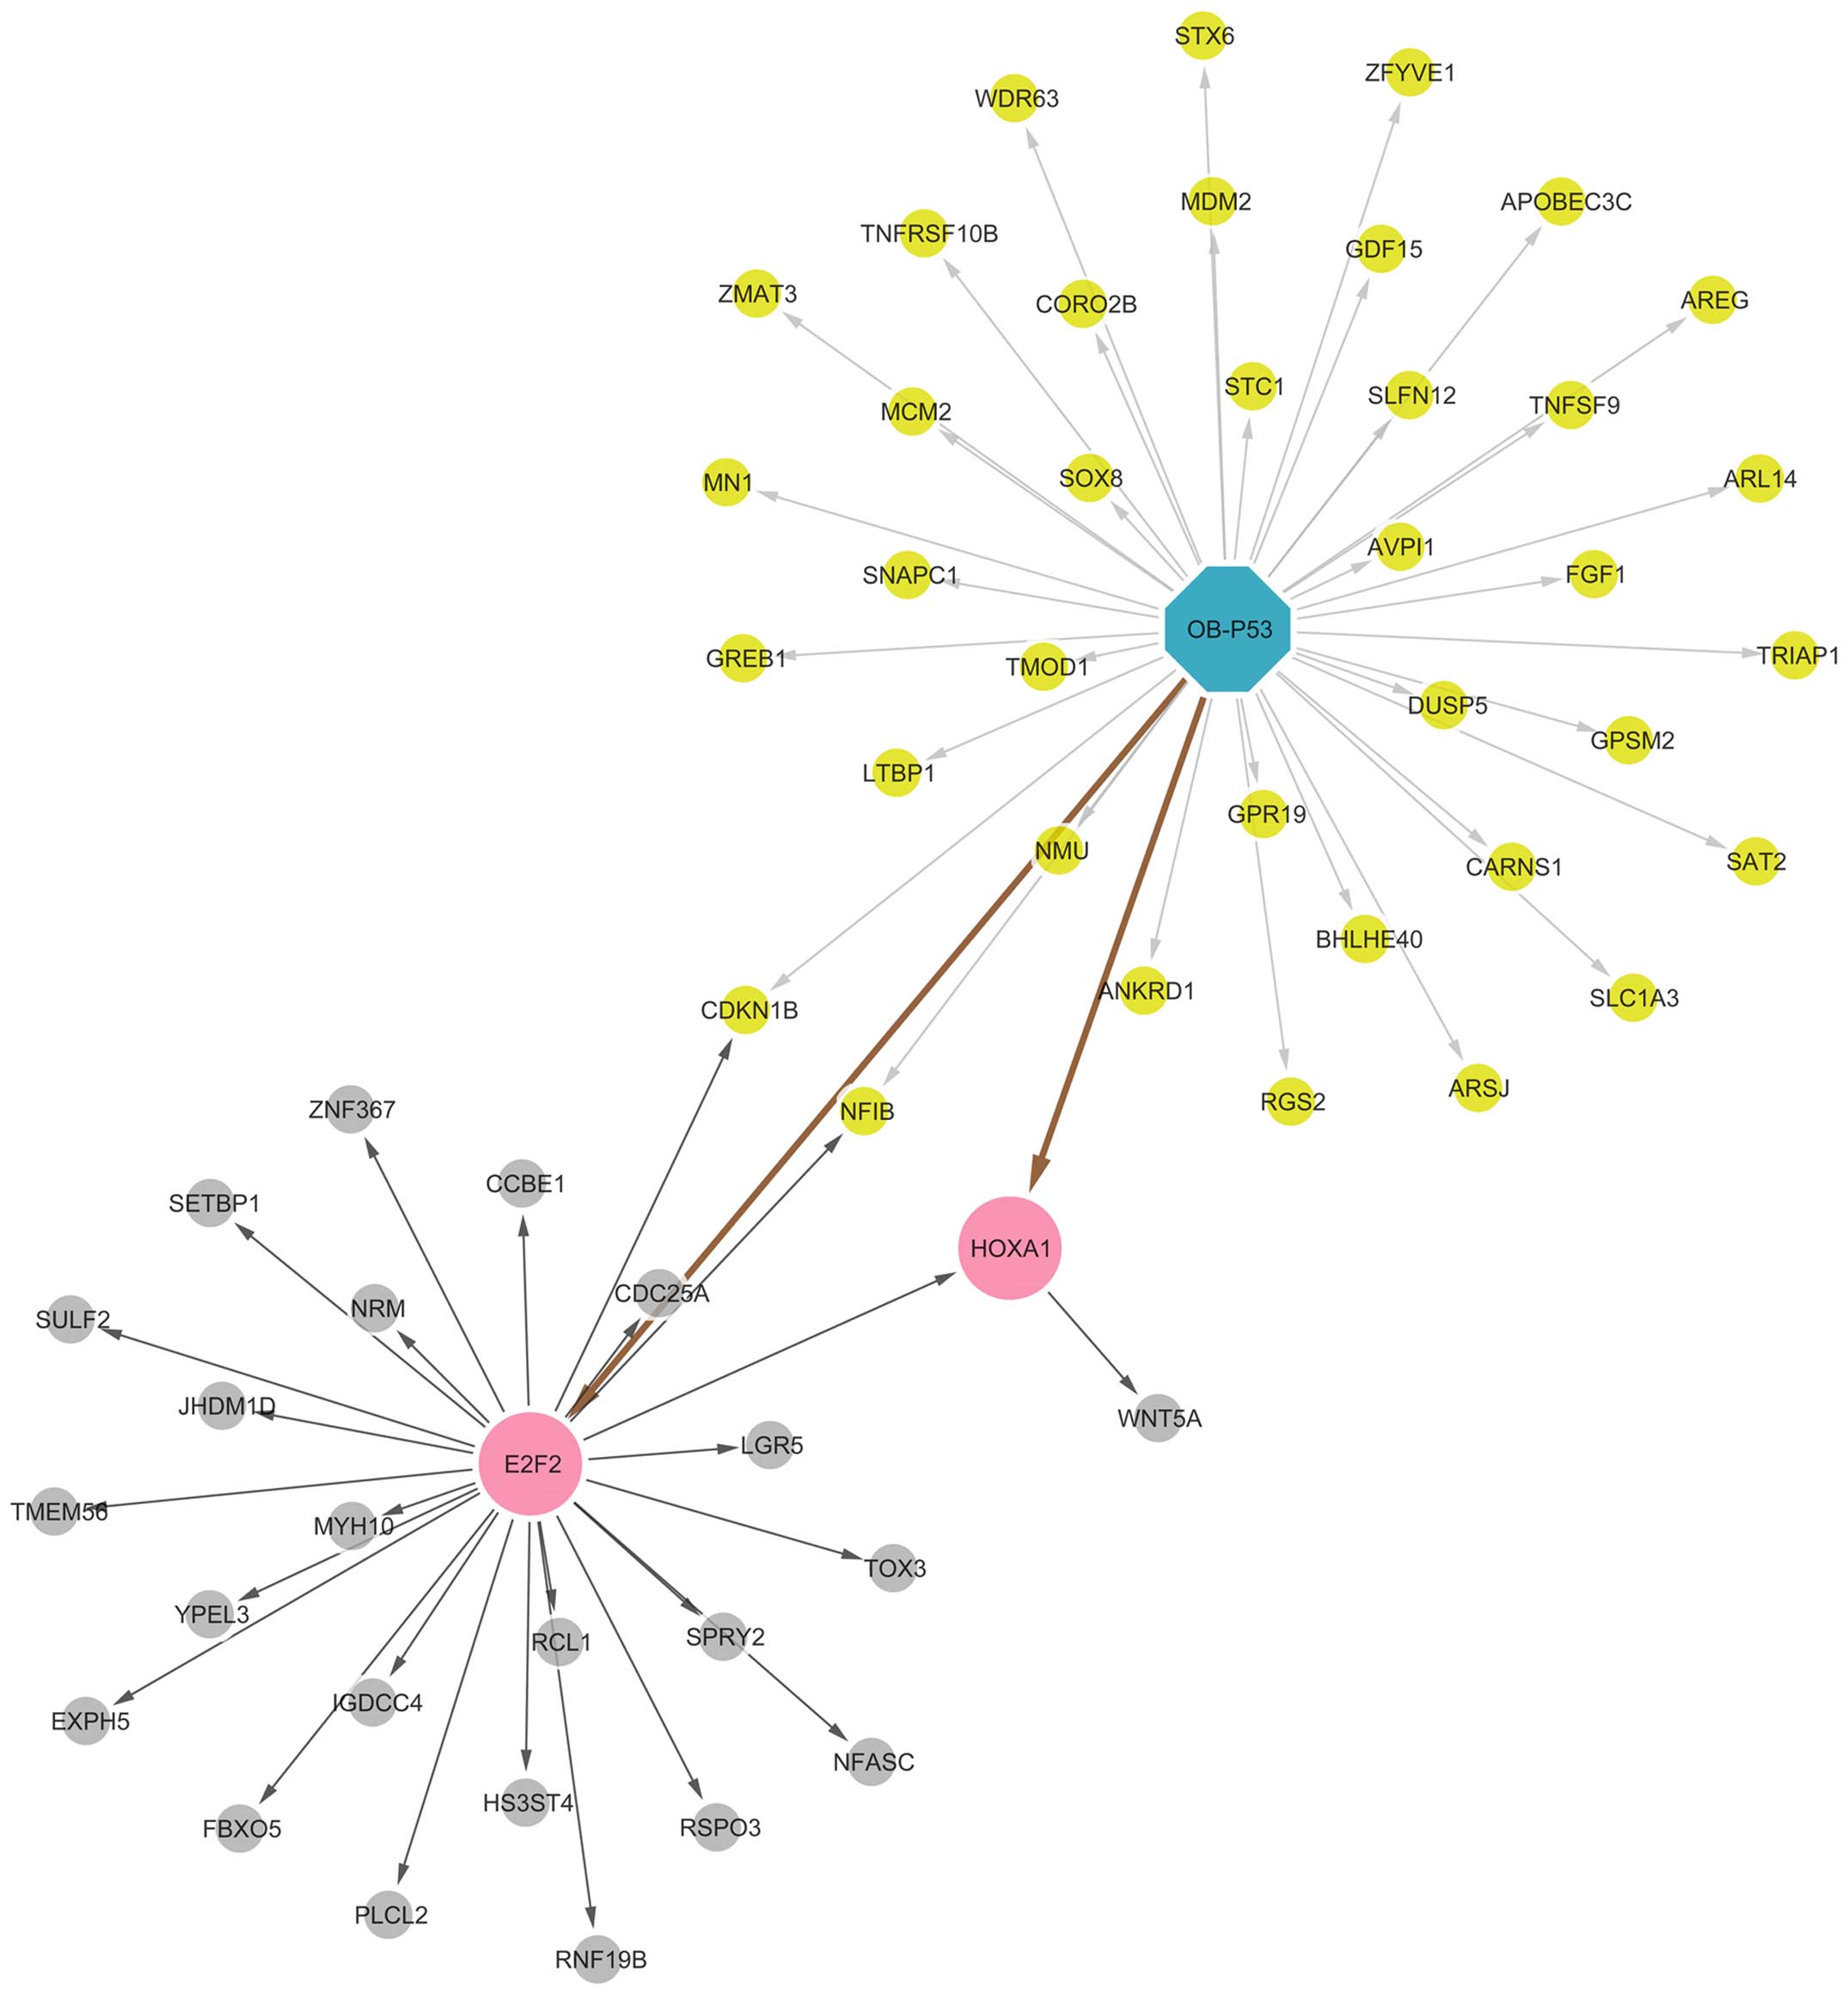
Integrative analysis of ChIP-seq data and microarray
data was performed using the ChIP-Array online tool. A total of 39
DEGs were directly regulated by p53, and two of them were TFs: E2F
transcription factor 2 (E2F2) and homeobox A1 (HOXA1). E2F2
regulated 25 DEGs and HOXA1 regulated one DEG (Fig. 4).
Functional enrichment analysis result of
the target genes
GO enrichment analysis was performed for the direct
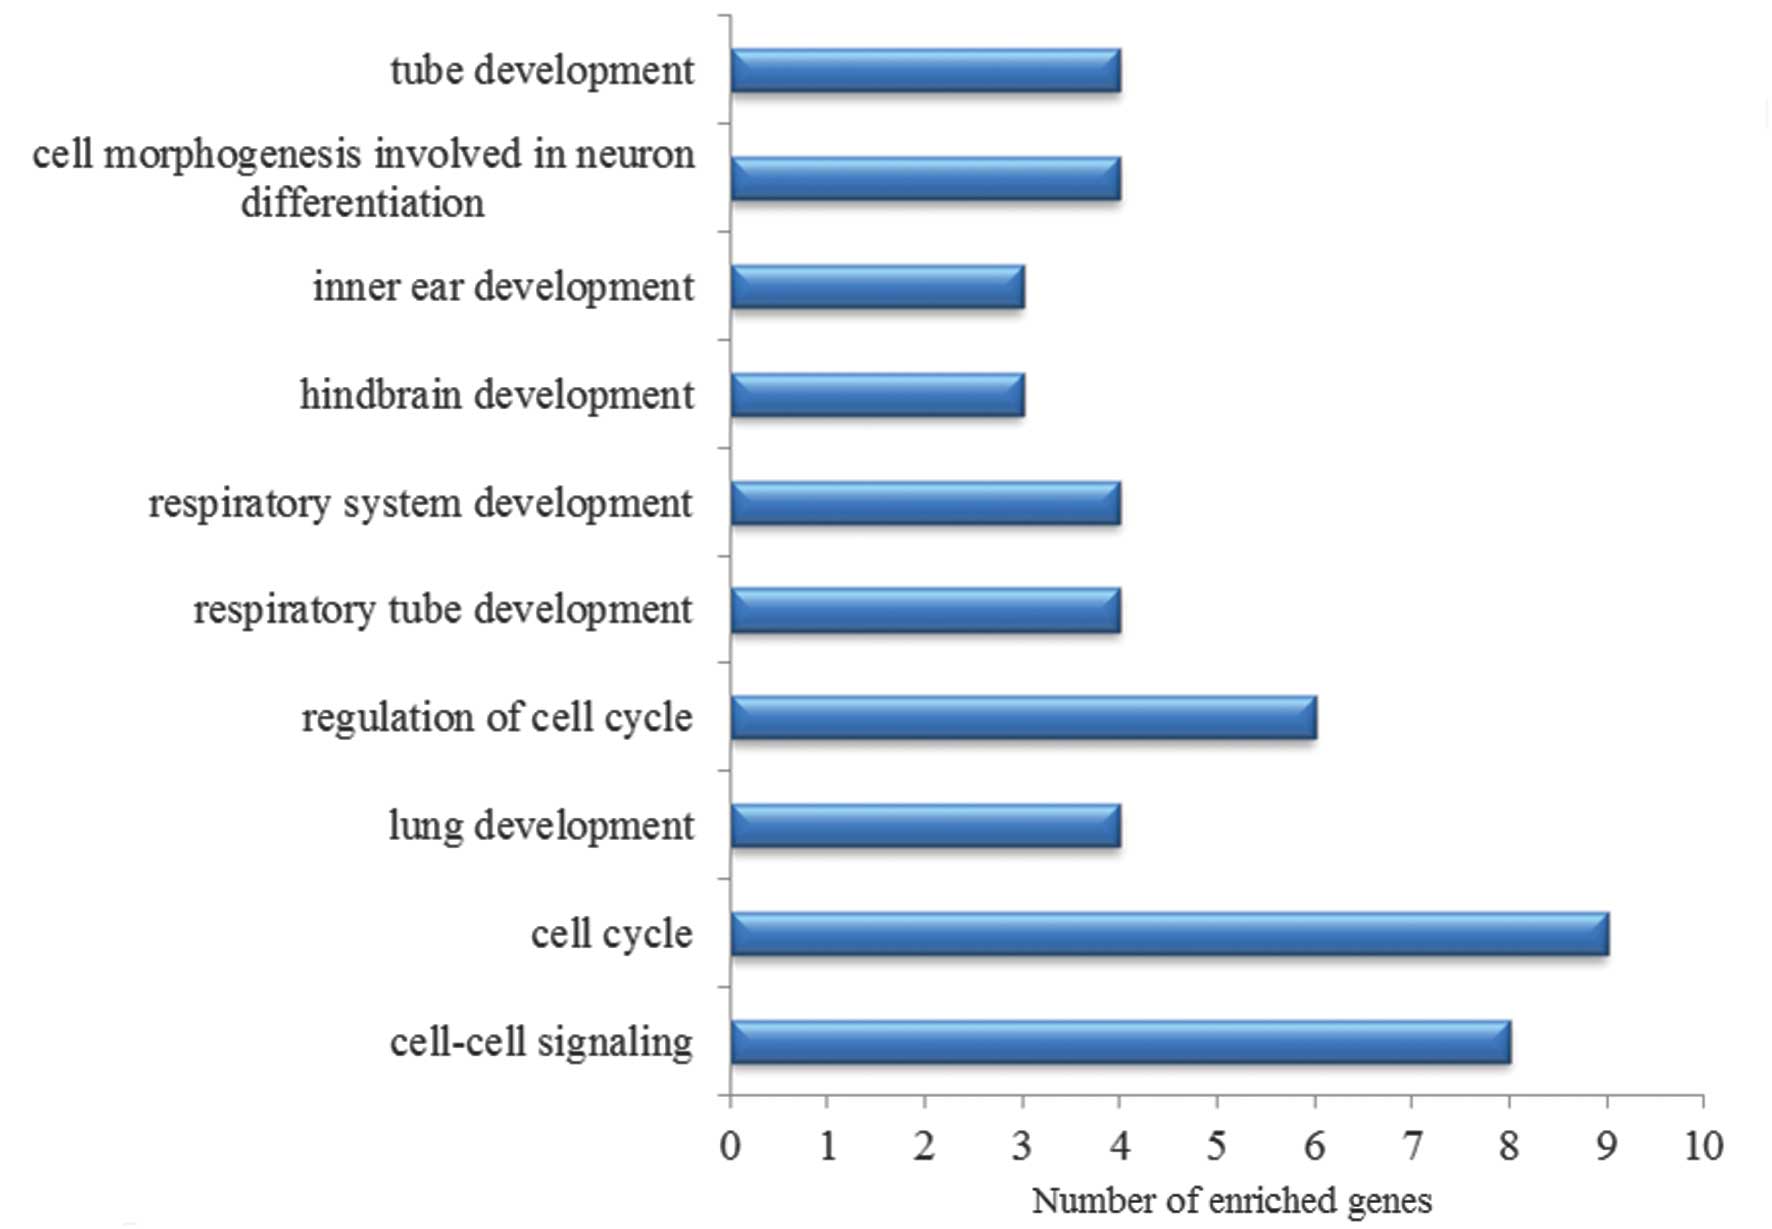
and indirect target genes of p53 (Fig.
5). Cell cycle and cell-cell signaling were included in the
list.
The KEGG pathway enriched in all the target genes of
p53 were also disclosed (Table
II), including cell cycle, p53 signaling pathway, melanoma and
pathways in cancer.
| Table IIKyoto Encyclopedia of Genes and
Genomes pathways enriched in the direct and indirect target genes
of p53. |
Table II
Kyoto Encyclopedia of Genes and
Genomes pathways enriched in the direct and indirect target genes
of p53.
| Pathway | Count | P-value | Genes |
|---|
| Cell cycle | 5 | 1.01E-03 | E2F2, CDKN1B, MDM2,
MCM2, CDC25A |
| p53 signaling
pathway | 3 | 2.60E-02 | TNFRSF10B, ZMAT3,
MDM2 |
| Melanoma | 3 | 2.82E-02 | E2F2, MDM2,
FGF1 |
| Pathways in
cancer | 5 | 3.04E-02 | WNT5A, E2F2,
CDKN1B, MDM2, FGF1 |
| Chronic myeloid
leukemia | 3 | 3.12E-02 | E2F2, CDKN1B,
MDM2 |
Discussion
In the present study, a total of 565 DEGs were
identified in Nutlin-3-treated U2OS cells compared with the control
samples. Of these DEGs, 373 were upregulated genes and 192 were
downregulated genes. Functional enrichment analysis revealed that
the p53 signaling pathway, cell cycle and DNA replication were
significantly over-represented in the DEGs. This result suggested
the importance of p53 in osteosarcoma. p53 functions as a cell
cycle control protein in osteosarcoma (18) and the presence of p53 mutations in
human osteosarcoma is correlated with high levels of genomic
instability (19), confirming the
critical importance of p53 in response to stresses, including DNA
damage. Berman et al (20)
reported that metastatic osteosarcoma is induced by the
inactivation of Rb and p53 (20).
The comparative analysis of gene expression profiles between
Nutlin-3-treated U2OS cells and controls further described the
critical importance of p53 in osteosarcoma. Notably, p53 gene
therapy of human osteosarcoma is also suggested and has been
previously investigated (21).
To further illustrate the changes in the p53-binding
pattern in response to treatment with Nutlin-3, integrative
analysis of microarray data and ChIP-seq data was performed and the
transcriptional regulatory network of p53 was obtained. A total of
39 DEGs were directly regulated by p53 and two of which were the
TFs, E2F2 and HOXA1. E2F2 regulated 25 DEGs and HOXA1 regulated
only one DEG. Functional enrichment analysis demonstrated that the
cell cycle, p53 signaling pathway, melanoma and pathways in cancer
were enriched in the direct and indirect target genes, further
confirming the critical importance of p53 in osteosarcoma. It may
be beneficial to further investigate these target genes to reveal
the complete molecular mechanisms and provide potential therapeutic
targets.
Several direct target genes of p53 have been
confirmed to be involved in tumorigenesis. The MDM2 proto-oncogene
is a nuclear-localized E3 ubiquitin ligase. MDM2 promotes tumor
formation by targeting p53 for proteasomal degradation (22). The gene is itself transcriptionally
regulated by p53. Therefore, targeting the p53-MDM2 interaction is
hypothesized as a cancer therapeutic agent (23,24).
Syntaxin 6 (STX6) is a regulator of the protein trafficking
machinery. Zhang et al (25) indicated that STX6 is an effector
and a modulator of the p53 family in the regulation of cell
adhesion and survival. Fibroblast growth factor 1 (FGF1) is a
member of the FGF family. Bouleau et al (26) indicated that FGF1 inhibits
p53-dependent apoptosis and cell cycle arrest via an intracrine
pathway. Meningioma 1 stimulates vitamin D receptor-mediated
transcription and inhibits osteoblast cell proliferation (27). It is required for appropriate
osteoblast proliferation, motility, differentiation and function
(28). The present study
hypothesized that this protein may be a novel target to modulate
osteosarcoma cell growth.
E2F2 and HOXA1 are directly targeted by p53 and they
are also TFs. It has been confirmed that E2F2 inhibits
tumorigenesis (29,30). E2F activity is critical for the
control of the G1 to S phase transition. Laresgoiti et al
(31) demonstrated that E2F2 and
CREB cooperatively regulate the transcriptional activity of cell
cycle genes. Cyclin-dependent kinase inhibitor 1B (CDKN1B) is one
of the effectors of E2F2, which is important in the cellular
transition from quiescence to the proliferative state.
HOXA1-stimulated oncogenicity is mediated by selective upregulation
of components of the p44/42 MAP kinase pathway in human mammary
carcinoma cells (32). The
expression level of HOXA1 is correlated with poor prognosis of oral
squamous cell carcinoma (33). The
only TF of HOXA1 is wingless-type MMTV integration site family
member 5A (Wnt5a). It is reported that Wnt5a signaling is involved
in the regulation of osteosarcoma cell invasiveness (34).
In conclusion, differential expression of several
direct and indirect target genes of p53 was observed following
treatment with Nutlin-3. These findings not only advanced the
understanding regarding the importance of p53 in osteosarcoma, but
also provided clues for future development of therapeutic
strategies.
References
|
1
|
Espinosa JM: Mechanisms of regulatory
diversity within the p53 transcriptional network. Oncogene.
27:4013–4023. 2008. View Article : Google Scholar : PubMed/NCBI
|
|
2
|
Menendez D, Inga A and Resnick MA: The
expanding universe of p53 targets. Nat Rev Cancer. 9:724–737. 2009.
View Article : Google Scholar : PubMed/NCBI
|
|
3
|
Riley T, Sontag E, Chen P and Levine A:
Transcriptional control of human p53-regulated genes. Nat Rev Mol
Cell Biol. 9:402–412. 2008. View
Article : Google Scholar : PubMed/NCBI
|
|
4
|
Miller LD, Smeds J, George J, Vega VB,
Vergara L, Ploner A, Pawitan Y, Hall P, Klaar S, Liu ET and Bergh
J: An expression signature for p53 status in human breast cancer
predicts mutation status, transcriptional effects and patient
survival. Proc Natl Acad Sci USA. 102:13550–13555. 2005. View Article : Google Scholar
|
|
5
|
Wei CL, Wu Q, Vega VB, Chiu KP, Ng P,
Zhang T, Shahab A, Yong HC, Fu Y, Weng Z, et al: A global map of
p53 transcription-factor binding sites in the human genome. Cell.
124:207–219. 2006. View Article : Google Scholar : PubMed/NCBI
|
|
6
|
Bruna A, Darken RS, Rojo F, Ocaña A,
Peñuelas S, Arias A, Paris R, Tortosa A, Mora J, Baselga J and
Seoane J: High TGFβ-Smad activity confers poor prognosis in glioma
patients and promotes cell proliferation depending on the
methylation of the PDGF-B gene. Cancer Cell. 11:147–160. 2007.
View Article : Google Scholar : PubMed/NCBI
|
|
7
|
Rozan L and El-Deiry W: p53 downstream
target genes and tumor suppression: A classical view in evolution.
Cell Death Differ. 14:3–9. 2006. View Article : Google Scholar : PubMed/NCBI
|
|
8
|
Botcheva K, McCorkle SR, McCombie W, Dunn
JJ and Anderson CW: Distinct p53 genomic binding patterns in normal
and cancer-derived human cells. Cell Cycle. 10:4237–4249. 2011.
View Article : Google Scholar : PubMed/NCBI
|
|
9
|
Smeenk L, Van Heeringen SJ, Köppel M,
Gilbert B, Janssen-Megens E, Stunnenberg HG and Lohrum M: Role of
p53 serine 46 in p53 target gene regulation. PloS One.
6:e175742011. View Article : Google Scholar : PubMed/NCBI
|
|
10
|
Smeenk L, van Heeringen SJ, Koeppel M, van
Driel MA, Bartels SJ, Akkers RC, Denissov S, Stunnenberg HG and
Lohrum M: Characterization of genome-wide p53-binding sites upon
stress response. Nucleic Acids Res. 36:3639–3654. 2008. View Article : Google Scholar : PubMed/NCBI
|
|
11
|
Jaffe N, Bruland OS and Bielack S:
Pediatric and adolescent osteosarcoma. Springer; New York, NY: pp.
275–287. 2010
|
|
12
|
Ottaviani G and Jaffe N: The epidemiology
of osteosarcoma. Cancer Treat Res. 3–13. 2010.PubMed/NCBI
|
|
13
|
Menendez D, Nguyen TA, Freudenberg JM,
Mathew VJ, Anderson CW, Jothi R and Resnick MA: Diverse stresses
dramatically alter genome-wide p53 binding and transactivation
landscape in human cancer cells. Nucleic Acids Res. 41:7286–7301.
2013. View Article : Google Scholar : PubMed/NCBI
|
|
14
|
Gautier L, Cope L, Bolstad BM and Irizarry
RA: Affy-analysis of Affymetrix GeneChip data at the probe level.
Bioinformatics. 20:307–315. 2004. View Article : Google Scholar : PubMed/NCBI
|
|
15
|
Diboun I, Wernisch L, Orengo CA and
Koltzenburg M: Microarray analysis after RNA amplification can
detect pronounced differences in gene expression using limma. BMC
Genomics. 7:2522006. View Article : Google Scholar : PubMed/NCBI
|
|
16
|
Qin J, Li MJ, Wang P, Zhang MQ and Wang J:
ChIP-Array: combinatory analysis of ChIP-seq/chip and microarray
gene expression data to discover direct/indirect targets of a
transcription factor. Nucleic Acids Res. 39:W430–W436. 2011.
View Article : Google Scholar : PubMed/NCBI
|
|
17
|
Huang DW, Sherman BT, Tan Q, Collins JR,
Alvord WG, Roayaei J, Stephens R, Baseler MW, Lane HC and Lempicki
RA: The DAVID Gene Functional Classification Tool: A novel
biological module-centric algorithm to functionally analyze large
gene lists. Genome Biol. 8:R1832007. View Article : Google Scholar : PubMed/NCBI
|
|
18
|
Diller L, Kassel J, Nelson CE, Gryka MA,
Litwak G, Gebhardt M, Bressac B, Ozturk M, Baker SJ and Vogelstein
B: p53 functions as a cell cycle control protein in osteosarcomas.
Mol Cell Biol. 10:5772–5781. 1990.PubMed/NCBI
|
|
19
|
Overholtzer M, Rao PH, Favis R, Lu XY,
Elowitz MB, Barany F, Ladanyi M, Gorlick R and Levine AJ: The
presence of p53 mutations in human osteosarcomas correlates with
high levels of genomic instability. Proc Natl Acad Sci USA.
100:11547–11552. 2003. View Article : Google Scholar : PubMed/NCBI
|
|
20
|
Berman SD, Calo E, Landman AS, Danielian
PS, Miller ES, West JC, Fonhoue BD, Caron A, Bronson R, Bouxsein
ML, et al: Metastatic osteosarcoma induced by inactivation of Rb
and p53 in the osteoblast lineage. Proc Natl Acad Sci USA.
105:11851–11856. 2008. View Article : Google Scholar : PubMed/NCBI
|
|
21
|
Nakase M, Inui M, Okumura K, Kamei T,
Nakamura S and Tagawa T: p53 gene therapy of human osteosarcoma
using a transferrin-modified cationic liposome. Mol Cancer Ther.
4:625–631. 2005. View Article : Google Scholar : PubMed/NCBI
|
|
22
|
Momand J, Wu H-H and Dasgupta G:
MDM2-master regulator of the p53 tumor suppressor protein. Gene.
242:15–29. 2000. View Article : Google Scholar : PubMed/NCBI
|
|
23
|
Chène P: Inhibiting the p53-MDM2
interaction: An important target for cancer therapy. Nat Rev
Cancer. 3:102–109. 2003. View
Article : Google Scholar : PubMed/NCBI
|
|
24
|
Klein C and Vassilev LT: Targeting the
p53-MDM2 interaction to treat cancer. Br J Cancer. 91:1415–1419.
2004.PubMed/NCBI
|
|
25
|
Zhang Y, Shu L and Chen X: Syntaxin 6, a
regulator of the protein trafficking machinery and a target of the
p53 family, is required for cell adhesion and survival. J Biol
Chem. 283:30689–30698. 2008. View Article : Google Scholar : PubMed/NCBI
|
|
26
|
Bouleau S, Grimal H, Rincheval V, Godefroy
N, Mignotte B, Vayssière JL and Renaud F: FGF1 inhibits
p53-dependent apoptosis and cell cycle arrest via an intracrine
pathway. Oncogene. 24:7839–7849. 2005. View Article : Google Scholar : PubMed/NCBI
|
|
27
|
Sutton AL, Zhang X, Ellison TI and
MacDonald PN: The 1, 25 (OH) 2D3-regulated transcription factor MN1
stimulates vitamin D receptor-mediated transcription and inhibits
osteoblastic cell proliferation. Mol Endocrinol. 19:2234–2244.
2005. View Article : Google Scholar : PubMed/NCBI
|
|
28
|
Zhang X, Dowd DR, Moore MC, Kranenburg TA,
Meester-Smoor MA, Zwarthoff EC and MacDonald PN: Meningioma 1 is
required for appropriate osteoblast proliferation, motility,
differentiation and function. J Biol Chem. 284:18174–18183. 2009.
View Article : Google Scholar : PubMed/NCBI
|
|
29
|
Zhu JW, Field SJ, Gore L, Thompson M, Yang
H, Fujiwara Y, Cardiff RD, Greenberg M, Orkin SH and DeGregori J:
E2F1 and E2F2 determine thresholds for antigen-induced T-cell
proliferation and suppress tumorigenesis. Mol Cell Biol.
21:8547–8564. 2001. View Article : Google Scholar : PubMed/NCBI
|
|
30
|
Pusapati RV, Weaks RL, Rounbehler RJ,
McArthur MJ and Johnson DG: E2F2 suppresses Myc-induced
proliferation and tumorigenesis. Mol Carcinog. 49:152–156.
2010.
|
|
31
|
Laresgoiti U, Apraiz A, Olea M, Mitxelena
J, Osinalde N, Rodriguez JA, Fullaondo A and Zubiaga AM: E2F2 and
CREB cooperatively regulate transcriptional activity of cell cycle
genes. Nucleic Acids Res. 41:10185–10198. 2013. View Article : Google Scholar : PubMed/NCBI
|
|
32
|
Mohankumar KM, Xu X, Zhu T, Kannan N,
Miller LD, Liu ET, Gluckman PD, Sukumar S, Emerald BS and Lobie PE:
HOXA1-stimulated oncogenicity is mediated by selective upregulation
of components of the p44/42 MAP kinase pathway in human mammary
carcinoma cells. Oncogene. 26:3998–4008. 2007. View Article : Google Scholar : PubMed/NCBI
|
|
33
|
Bitu CC, Destro MF, Carrera M, da Silva
SD, Graner E, Kowalski LP, Soares FA and Coletta RD: HOXA1 is
overexpressed in oral squamous cell carcinomas and its expression
is correlated with poor prognosis. BMC cancer. 12:1462012.
View Article : Google Scholar : PubMed/NCBI
|
|
34
|
Enomoto M, Hayakawa S, Itsukushima S, Ren
DY, Matsuo M, Tamada K, Oneyama C, Okada M, Takumi T, Nishita M, et
al: Autonomous regulation of osteosarcoma cell invasiveness by
Wnt5a/Ror2 signaling. Oncogene. 28:3197–3208. 2009. View Article : Google Scholar : PubMed/NCBI
|