Introduction
MicroRNAs (miRNAs/miRs) provide robustness to
biological processes by attenuating the fluctuations in, and
overproduction of, mRNA (1).
miRNAs have been widely investigated as potential biomarkers for
various types of cancer. These small, 19–22 nucleotide-long
ribonucleic acids are produced by normal and neoplastic cells. In
general, miRNA levels are lower in cancer cells. However, miRNAs
that promote tumorigenesis and metastasis, termed oncomirs, are
increased in tumour cells (2).
Oncomirs, such as miR-17, downregulate the protein synthesis of
tumour suppressor genes (3). The
majority of genetic mutations that affect miRNAs in cancer,
regulate transcription factors or elements of transduction pathway
genes (4). Numerous genes encoding
miRNAs are methylated in breast cancer cells, which lowers their
expression relative to that in healthy cells (5).
The miR, let-7a contains three copies of genes in
three genomic loci: 9q22.32 (located 909,430 bp from miR-27b),
11q24.1 (located 46,765 bp from miR-125b 2 in the miR100HG gene)
and 22q13.31, a region that is frequently deleted in various types
of cancer, including breast cancer (6). The expression of let-7a is lower in
invasive ductal carcinomas with lymph node metastasis than in those
without lymph node metastasis (7).
Let-7a represses the expression of C-C chemokine receptor type 7,
by directly targeting its 3′ untranslated region (UTR) (8). Lin28 inhibits the cleavage of
pri-let-7 miRNAs, and it has been shown that the ectopic expression
of Lin28 completely prevents the processing of pri-let-7a and
pri-let-7g (9).
miR-17 was shown to be increased in breast cancer
samples compared with samples from healthy individuals (10). Located in 13q31.3, miR-17 is
encoded in a cluster (miR17/20 cluster), which contains miR-17,
miR-18a, miR-19a/b, miR-20a and miR92a, and is situated in the
intron of the C13orf25 gene (2,3,11).
miR-17/20 transcription is stimulated by the cMyc and E2F proteins
(12). The expression of all
mature miRNA from the genomic location of the miR-17/20 cluster,
correlates with the copy number of the gene in breast cancer
(2). The miR-17/20 cluster
functions as a tumour suppressor in human breast cancer by
decreasing amplified in breast cancer I and cyclin D1
expression (13,14). miR-17 has been demonstrated to be
increased in breast cancer, and to exert tumour-suppressive and
anti-invasive functions in breast cancer cells (2,13,15).
miR-27b is located in 9q22.32 in the intron of
C9orf3. It is located between miR-23b and miR-24-1, and is
close to the PHD finger protein 2 and Fanconi anemia,
complementation group C genes, which are associated with an
increased risk of breast cancer (16). miR-27b-3p is homologous to
miR-27a-3p and interacts with the 3′UTR of cytochrome P450 1B1
(CYP1B1) mRNA, with which it shares 19 bases. The product of
this gene is increased in a number of types of cancer, and is
involved in the metabolism of pro-carcinogens (17). The gene product of erb-b2 receptor
tyrosine kinase 2 (ERBB2), also termed HER2, as well as
those of epidermal growth factor and tumour necrosis factor-α,
promotes miR-27b expression through the protein kinase B/nuclear
factor-κB signalling cascade (18).
In humans, three copies of miRNA-125 sequence,
miR-125a, miR-125b1 and miR-125b2, are located in chromosomes 19,
11 and 21, respectively. The genes encoding miR-125b, which is
downregulated in breast cancer, are located at two sites: One in
chromosome 11q24.1 (the region frequently deleted in breast cancer)
and one in chromosome 21q21.1 (19,20).
Numerous genes that regulate proliferation and apoptosis in mammary
cells are targeted by miR-125a and miR-125b (21,22).
miR-125b suppresses tumour growth by diminishing the expression of
oncoproteins, such as ERBB2 and ERBB3 (23). Cancer cells overexpressing miR-125b
exhibit growth inhibition and a reduced migratory and invasive
capacity (23). Hypermethylation
of the miR-125b promoter has been observed to partially account for
the reduction of miR-125b expression in human breast cancer cells
(24). miR-125a expression is also
decreased in breast cancer. It is located in 19q13.41, in close
proximity to a region that is associated with breast cancer
(19q13.3) (19,25).
miR-206 and miR-133b form a cluster in an intergenic
region of chromosome 6p12.2 (26).
miR-206 regulates Estrogen receptor 1 (ESR1) gene
expression (27). Exogenous
miR-206 inhibits the proliferation of various cell types, through
the induction of cell cycle arrest and apoptosis via its target
genes NOTCH3 (28),
MET (29) and cyclin
D2 (30).
There are a number of variables in reverse
transcription-quantitative polymerase chain reaction (RT-qPCR)
quantification of miRNAs, which may cause variability within the
same sample and among different samples within a group. The method
used to overcome these variations is termed normalisation, which
aims to diminish artefacts introduced during the experimental
procedure. The gold standard in RT-qPCR is to use internal
reference RNA (31). The most
popular normalisation method for miRNA analysis, is the application
of RNU6B RNA as an internal reference, which is recommended by
Applied Biosystems (31). The
method relies on calculating the difference in cycle threshold
(ΔCt) between a target miRNA Ct and reference Ct (RNU6B). It is
recommended that ΔCt (indicated also by the target : reference
ratio, if Ct were converted into relative quantities) should be
characterised by the lowest variation for an investigated group of
samples and could be compared with the ΔCt (ratio) of the control
group (31). A disadvantage of
this method is the occurrence of high variance of the mean ΔCt.
This situation is particularly problematic for samples, in which
the expression of the target gene is inversely correlated with the
expression of the selected reference gene. The approach used by
this group to improve the model is to obtain a more constant ΔCt
(target: reference ratio). This hypothesis is similar to 'repeated
pairwise correlation and regression analysis', as developed by
Matthaei et al (32)
following proposal by Pfaffl et al (33).
In the present study, six miRNAs were selected
(hsa-let-7a-5p, hsa-miR-17-3p*,
hsa-miR-27b-5p*, hsa-miR-125a-3p*,
hsa-miR-125b-1-3p* and hsa-miR-206), which are known
regulators of oncogenesis, particularly in breast cancer. Each of
the selected miRNAs had previously been investigated in terms of
their expression in breast cancer cells. The aim of the present
study was to confirm their potential as biomarkers for
differentiating breast cancer types. This approach may help to
identify biomarkers with an increased specificity for the molecular
classification of breast cancer, as miRNAs are more stable in
archival samples and miRNA profiling is more reliable than mRNA
profiling to determine biomarkers for poor-quality samples.
It was hypothesised that through the calculation of
all possible ratios ('diffpairs') between six miRNAs and RNU6B RNA,
the optimal RNA marker pairs for breast cancer classification,
corresponding to immunohistochemical criteria, would be determined.
In order to achieve this, the correction method was applied to
diminish the variability in the ratios of two selected miRNAs. In
the present study, a small group of breast tumour samples were used
to assess an improved 'diffpairs' model of RT-qPCR data analysis,
thereby increasing the diagnostic value of miRNA assays conducted
using RT-qPCR.
Patients and methods
Patients and samples
Tissue samples were obtained from 27 patients who
had not undergone preoperative radiotherapy or chemotherapy, and
had received breast cancer surgery at the Department of Surgery,
Chair and Clinic of Oncology of Poznań University of Medical
Sciences (Poznań, Poland). The classification of these patients is
shown in Table I. The study design
was approved by the University Bioethical Board of Poznań
University of Medical Sciences. The tumour tissue samples and blood
samples for comprehensive experiments were collected after written
informed consent had been obtained from all participants. Following
surgery, the breast tumour samples were divided into two groups:
One group (21 samples) was stored in liquid nitrogen and the second
group (6 samples) was formalin-fixed and paraffin-embedded (FFPE).
The patient samples were classified according to the TNM
classification of tumours (34).
Prior to RNA extraction, corresponding haematoxylin and
eosin-stained tumour tissue sections were created, and the
percentage of cancer cells in these sections was evaluated. In the
present study, the average percentage of tumour cells per section
was 76%.
 | Table IClassification of patient groups
using the TNM system and expression of the ER, PR and HER2
receptors. |
Table I
Classification of patient groups
using the TNM system and expression of the ER, PR and HER2
receptors.
| Type | Number of
patients | Percentage |
|---|
| G1 | 5 | 19.2 |
| G2 | 12 | 46.2 |
| G3 | 9 | 34.6 |
| pT1 | 13 | 50.0 |
| pT2 | 12 | 46.2 |
| pT3 | 0 | 0.0 |
| pT4 | 1 | 3.8 |
| pN0 | 14 | 53.8 |
| pN1 | 11 | 42.3 |
| pN2 | 1 | 3.8 |
| ER (−) | 8 | 30.8 |
| ER (+) | 18 | 69.2 |
| PR (−) | 9 | 34.6 |
| PR (+) | 17 | 65.4 |
| HER2 (−) | 20 | 76.9 |
| HER2 (+) | 6 | 23.1 |
RNA extraction
miRNA and mRNA were extracted from frozen tissue
using the mirVana™ miRNA isolation kit (Life Technologies,
Carlsbad, CA, USA). Total RNA from paraffin-embedded tissues was
extracted using a RecoverAll™ total nucleic acid isolation kit
(Life Technologies). The quantity of nucleic acid obtained, was
assessed using the micro-spectrophotometer Nano-100 (Hangzhou
Allsheng Instruments CO., Ltd., Hangzhou, China).
RT-qPCR
In order to evaluate RNA expression levels, TaqMan
microRNA assays (Life Technologies) for RT-qPCR were conducted for
hsa-let-7a-5p (000377), hsa-miR-17-3p* (002421),
hsa-miR-27b-5p* (002174), hsa-miR-125a-3p*
(002199), hsa-miR-125b-1-3p* (002378), hsa-miR-206
(000510) and RNU6B (001093). All samples were reverse transcribed
using the TaqMan microRNA reverse transcription kit and specific
primers from the TaqMan microRNA assay (Life Technologies).
Briefly, the following reaction conditions of RT were used
according to the manufacturer' instructions: 10 mM dNTP, 5
U/µl MultiScribe reverse transcriptase, 2 U/µl RNase
inhibitor, 5 µl total RNA, 3 µl specific reverse
transcription primer; 30 min at 16°C, 30 min at 42°C then 5 min at
85°C. TaqMan Universal PCR master mix and specific primers from the
TaqMan microRNA assays were used to quantify samples, using a Roche
LC 480 cycler (Roche Diagnostics, Basel, Switzerland). Briefly, the
following reaction conditions of PCR were applied according to the
manufacturer's instructions: 0.5 µl TaqMan microRNA assay
primers, 1 µl RT reaction product, 5 µl TaqMan 2X
Universal PCR master mix, No AmpErase UNG; 10 min at 95°C, 45
cycles of 15 sec at 95°C and 1 min at 60°C. The relative quantities
of all miRNAs were calculated using a standard curve for miR-206.
All samples were calculated according to the miR-206 efficiency as
the supplier (Life Technologies) has standardised their miRNA
assays to obtain a similar amplification efficiency.
The ERBB2 (Hs01001580_m1), ESR1 (Hs00174860_m1) and
PGR (Hs01556702_m1) mRNA levels were analysed by RT and TaqMan qPCR
(Life Technologies). Hydroxymethylbilane synthase (HMBS;
Hs00609293_g1) and POLR2A (Hs00172187_m1) were used as reference
mRNA levels.
Statistical analysis
Statistical analysis was performed using the
Microsoft Excel 2003 (Microsoft Corporation, Redmond, WA, USA),
Instat (GraphPad InStat version 3.05 for Windows 95, GraphPad
Software, San Diego, CA, USA), Statistica 10 version 10 (StatSoft,
Inc., Tulsa, OK, USA) and GeNorme software programs (Ghent
University Hospital Center for Medical Genetics, Ghent, Belgium).
P<0.05 was considered to indicate a statistically significant
difference. The Mann-Whitney (MW) and Kruskal-Wallis tests were
used to compare the differences in the mean values of relative
expression levels between groups of samples, obtained from the
RT-qPCR experiments. The means of the log10 ratios
between the target gene expression levels and the 'reference' gene
expression levels were also calculated.
The correlation between each of the 21 pairs of 7
RNAs for 16 groups of histologically-defined samples was estimated.
A total of 336 correlation coefficients (R) were obtained, which
were positive or negative. The results were calculated using the
following algorithm: i) All crossing point (Ct) values obtained
from the RT-qPCR analysis of 7 miRNAs were transformed to the
relative concentrations based on a standard curve of miR-206 using
the LC 480 software 1.5.0.39 (Roche Diagnostics). ii) In each
histological group, the correlation coefficients and linear
regressions were calculated for the relative concentrations of a
pair of miRNAs or RNU6B RNA (for all 21 combinations of 7 RNAs,
including RNU6B). When R was positive, the mean ratios of the
target and 'reference' miRNAs were calculated (Xn
tar/Ym ref). iii) A negative correlation of the
target (X) and 'reference' (Y) RNAs implied a requirement for
recalculating the target and 'reference' ratios. The regression
line and its formula were calculated, and the Xtar0
crossing point was established (Yref=0). The difference
Xtar0-Xn tarn for each target value was calculated.
Subsequently, the ratios (Xtar0-Xn
tarn)/Ym ref for each sample and their means were
calculated. iv) Mean values of two groups of samples were
subsequently compared using a non-parametric method (Mann-Whitney).
Using this approach, lower P-values were obtained by comparing the
target-reference ratios without correcting for negative
correlations in the groups.
A similar approach was used for miRNA and mRNA,
which were transformed to the relative concentrations based on
standard curves (s.c.; miR-206 s.c. for all miRNAs and specific
s.c. for 5 mRNAs). The correlation coefficients and linear
regressions were subsequently calculated for each histological
group. When the correlation was positive, the mean miRNA and mRNA
ratios were calculated (Xn miRNA/Ym mRNA). A
negative correlation between the miRNA and mRNA required
recalculation of the ratio. The regression line and its formula
were calculated and the X0 miRNA crossing point was
established (YmRNA=0). The difference (X0
miRNA-Xn miRNA) in each miRNA value was
calculated. The ratio (X0 miRNA-Xn miRNA)/Ym
mRNA for each sample and its mean was subsequently calculated. The
mean values of the two groups of samples were then compared.
Receiver operating characteristic (ROC) analyses
were performed for all pairs of miRNA/miRNA, miRNA/RNU6B and
miRNA/mRNA. The lowest P-values and the highest area under the
curve (AUC) values were used to select the best ratios for
potential biomarkers with the highest specificity and
sensitivity.
Results
miRNA ratios
In the present study, an attempt was made to
establish a modified approach for identifying molecular markers of
breast cancer. Breast cancer samples were classified according to
tumour grade (G1–G3 according to Elston-Ellis classification, also
termed the Nottingham classification) (35); the TNM classification (Tumour size,
pT1 or pT2; lymph node metastasis, pN0 or pN1); receptors status
[Estrogen receptor (ER) status (ER−, ER+), progesterone receptor
(PR) status (PR−, PR+) and human epidermal growth factor receptor 2
(HER2) status] (Table I).
The miRNAs, let-7a, miR-17, miR-27b, miR-125a,
miR-125b and miR-206 were evaluated in breast cancer samples. In
breast cancer cells, these miRNAs have been classified as tumour
suppressive (36). RNU6B (001093)
was selected as the reference for miRNA quantification.
The GeNorme software was used to rank the potential
reference miRNAs, and miR-125a, miR-125b and RNU6B were the most
stable of the samples. The average expression stability for each
miRNA was: miR-125a, 0.115; miR-125b-1, 0.119; RNU6B, 0.125;
let-7a, 0.206; miR-17, 2.544; miR-27b, 3.959; and miR-206, 29.536.
The uncertainty over reference miRNA expression prompted the
investigation for an alternative calculation model enabling a
reliable miRNA expression analysis.
All combinations of ratios for let-7a, miR-17,
miR-27b, miR-125a, miR-125b-1, miR-206 and RNU6B were calculated
for each group of samples (G, pT, pN, ER, PR, HER2 and molecular
group). The results are presented in Table II. Calculations were performed
using an algorithm that was executed by macros in Microsoft Excel.
Any outliers were eliminated.
| Table IIStatistical analysis of 21 ratios of
microRNA and RNU6B RNA in groups of breast cancer samples. |
Table II
Statistical analysis of 21 ratios of
microRNA and RNU6B RNA in groups of breast cancer samples.
| Ratio | Grade
| pT
| pN
| ER
| PR
| M. gr.
|
|---|
| pKW | 1 | 2 | 3 | pMW | 1 | 2 | pMW | 0 | 1 | pMW | (−) | (+) | pMW | (−) | (+) | pKW | L | H | B |
|---|
| let7/17 | 0.5313 | 3.79 | 3.88 | 3.91 |
0.001065 | 3.75 | 6.17 | 0.25688 | 4.34 | 3.99 | 0.201003 | 5.27 | 3.90 |
0.000274 | 4.44 | 6.81 | 0.008 | 3.90 | 4.83 | 1.63 |
| let7/27 | 0.6464 | 3.93 | 3.69 | 3.63 | 0.235870 | 3.95 | 3.43 | 0.73044 | 3.66 | 3.77 | 0.676471 | 3.92 | 3.82 | 0.573856 | 3.59 | 3.75 | 0.082 | 3.82 | 3.45 | −0.23 |
| let7/125a | 0.9633 | 3.13 | 3.35 | 3.02 | 0.496507 | 3.34 | 3.07 | 0.73806 | 3.08 | 3.31 | 0.947915 | 3.08 | 3.29 | 0.445810 | 3.20 | 3.19 | 0.785 | 3.29 | 3.19 | 2.97 |
| let7/125b | 0.0005 | 4.59 | 5.86 | 3.32 |
0.000037 | 5.61 | 3.85 | 0.00115 | 4.56 | 5.63 |
0.000004 | 2.80 | 5.34 |
0.000059 | 4.05 | 5.36 | 0.043 | 5.34 | 5.90 | 6.27 |
| let7/206 | 0.1012 | 6.10 | 7.36 | 6.79 | 0.080400 | 6.67 | 5.56 | 0.00055 | 7.07 | 6.02 | 0.001306 | 4.71 | 6.58 |
0.000043 | 7.36 | 6.14 | 0.005 | 6.58 | 5.04 | 3.65 |
| let7/U6 | 0.0108 | 4.25 | 2.06 | 1.16 |
0.000243 | 1.95 | 4.43 | 0.00001 | 5.13 | 2.18 |
0.008748 | 1.08 | 2.13 | 0.055163 | 1.62 | 2.10 | 0.035 | 2.13 | 1.12 | 1.02 |
| 17/27 | 0.0099 | 1.24 | 2.02 | 5.28 | 0.235870 | 0.44 | 0.83 | 0.29733 | 0.44 | 0.45 |
0.025000 | −1.93 | 0.42 | 0.573856 | 0.23 | 0.29 | 0.942 | 2.47 | 2.38 | 2.71 |
| 17/125a | 0.0005 | 0.63 | 0.76 | 3.58 |
0.000981 | 1.09 | 2.87 | 0.42443 | 1.88 | 0.75 |
0.002048 | 2.18 | −0.27 |
0.026016 | 2.01 | −0.44 | 0.211 | −0.27 | 1.31 | 2.28 |
| 17/125b | 0.0010 | 1.06 | 1.14 | 3.22 |
0.000737 | 2.52 | 1.85 | 0.11912 | 1.89 | 0.49 |
0.000649 | 1.84 | 2.93 |
0.000001 | 3.36 | 0.98 | 0.099 | 2.93 | 3.42 | 3.78 |
| 17/206 | 0.0532 | 2.28 | 3.79 | 2.70 | 0.653903 | 3.85 | 3.77 | 0.17335 | 3.65 | 3.26 |
0.005620 | 3.65 | 4.56 |
0.003652 | 3.94 | 3.42 | 0.042 | 3.46 | 3.95 | 3.81 |
| 17/U6 | 0.3498 | −1.46 | −1.24 | −0.02 | 0.776211 | −0.86 | −0.23 | 0.37303 | −0.22 | −1.18 |
0.013000 | 0.61 | −1.45 |
0.003501 | −0.01 | −1.62 | 0.047 | −1.45 | −0.85 | 0.31 |
| 27/125a | 0.2889 | −0.26 | 0.14 | −0.57 | 0.798446 | −0.16 | 0.05 | 0.74299 | −0.16 | 0.07 | 0.300000 | 0.39 | −0.21 | 0.350420 | 0.29 | −0.20 | 0.124 | −0.21 | −0.63 | 0.55 |
| 27/125b | 0.0053 | 1.11 | 2.77 | −1.00 | 0.210490 | 2.30 | 2.87 | 0.00699 | 2.69 | −1.26 | 0.800000 | 0.82 | 1.35 |
0.041758 | 0.85 | 2.42 | 0.577 | 2.38 | 1.14 | 2.66 |
| 27/206 | 0.2331 | 2.70 | 3.06 | 1.94 |
0.049550 | 3.69 | 2.89 | 0.03596 | 3.62 | 2.87 | 0.945055 | 3.14 | 2.71 |
0.002930 | 2.62 | 4.73 | 0.926 | 2.71 | 2.15 | 3.30 |
| 27/U6 | 0.0104 | 0.76 | 1.14 | −1.93 | 0.386508 | 0.71 | 1.12 | 0.09272 | 1.37 | 0.69 | 0.720588 | −0.21 | −0.50 | 0.244118 | −0.38 | 0.63 | 0.252 | 0.60 | −1.02 | 1.90 |
| 125a/125b | 0.0079 | 1.59 | 1.48 | 0.45 |
0.000018 | 2.89 | 0.88 | 0.69470 | 1.51 | 1.05 |
0.000470 | 0.41 | 1.54 |
0.005180 | 0.65 | 1.55 | 0.004 | 1.54 | 0.06 | 0.56 |
| 125a/206 | 0.0098 | 2.92 | 3.09 | 2.25 | 0.277512 | 3.09 | 2.41 | 0.57874 | 2.98 | 2.70 |
0.001155 | 2.15 | 3.08 |
0.000011 | 4.40 | 2.81 | 0.009 | 3.08 | 2.19 | 2.13 |
| 125a/U6 | 0.0016 | 3.57 | −0.53 | −1.52 | 1.000000 | −1.07 | −0.62 | 0.58241 | −0.71 | −0.43 |
0.000555 | −0.68 | 1.21 |
0.000390 | −0.72 | 1.23 | 0.019 | 1.20 | 1.57 | 2.06 |
| 125b/206 | 0.8903 | 1.56 | 2.11 | 2.08 |
0.000006 | 4.08 | 1.95 | 0.00002 | 3.64 | 2.21 |
0.000027 | 2.01 | 3.67 |
0.001519 | 2.09 | 3.40 | 0.175 | 3.75 | 4.07 | 3.96 |
| 125b/U6 | 0.5364 | −0.62 | −1.72 | −1.32 |
0.000099 | 0.43 | −1.70 | 0.20804 | −1.63 | −1.28 |
0.024017 | −1.34 | −1.48 |
0.045585 | −1.39 | −1.49 | 0.070 | −1.48 | −1.55 | −1.20 |
| 206/U6 | 0.0996 | −3.10 | −1.15 | −2.91 |
0.000325 | −3.15 | −0.74 | 0.00276 | −0.66 | −2.99 |
0.030232 | −2.01 | −3.02 | 0.110181 | −2.06 | −3.02 | 0.049 | −3.02 | −2.88 | −1.74 |
For the tumour grade (G classification), which
contains three classes of samples, the following combinations of
miRNAs were selected: miR-17/miR-27b to discriminate grades 2 and 3
and miR-125a/RNU6B to discriminate grades 1 and 3 or 1 and 2. These
miRNAs were selected based on P-values and the consequent increase
or decrease in their ratios from G1 to G3 (Fig. 1A and B).
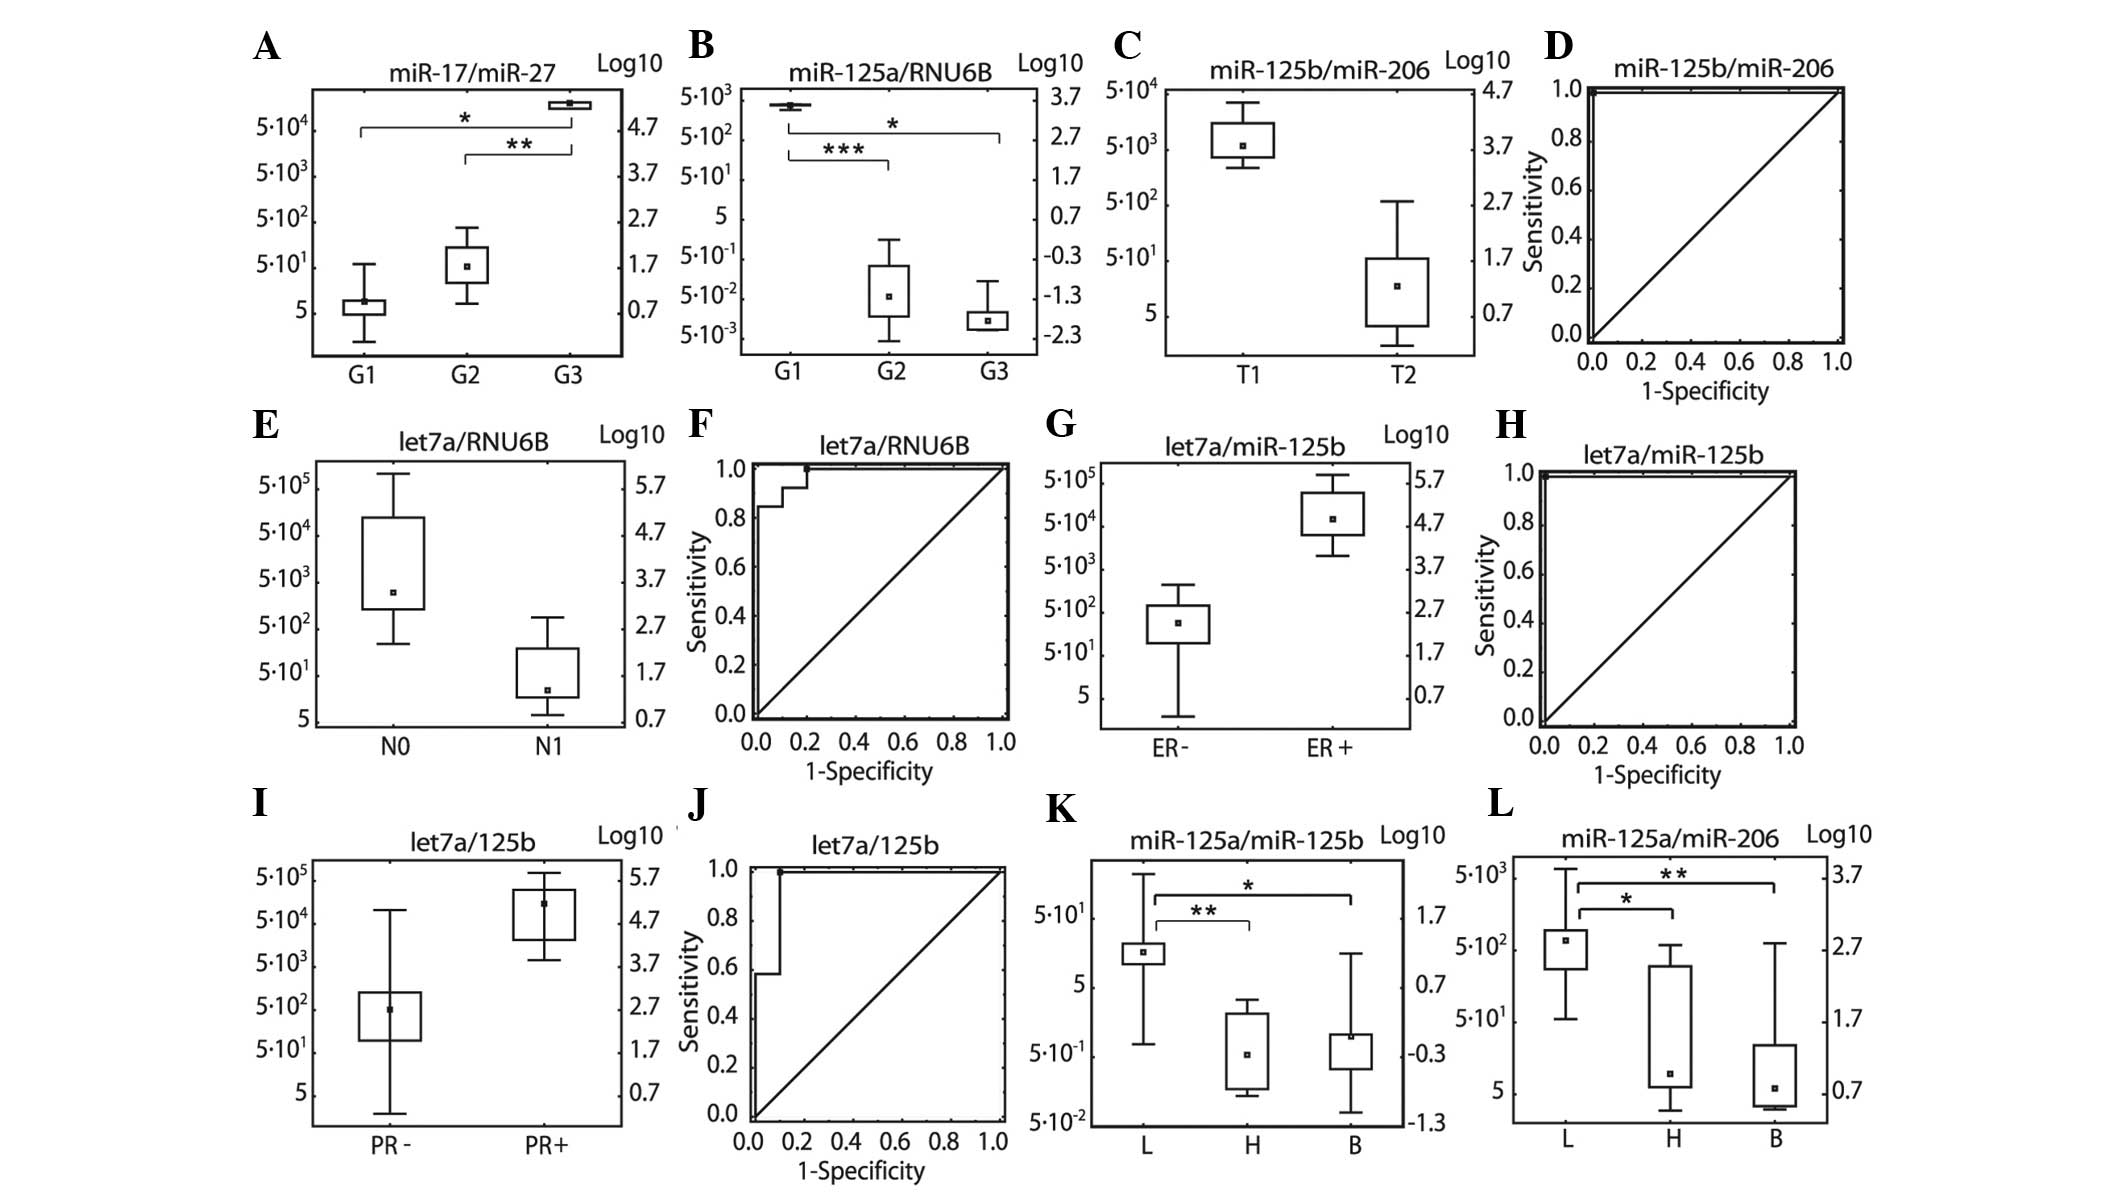 | Figure 1Relative expression levels expressed
as miRNA/miRNA ratios. (A) miR-17/miR-27b in three grading groups
(G1–G3), (B) miR-125a/RNU6B in three grading groups (G1–G3), (C)
miR-125b/miR-206 in tumour size groups (pT1 and pT2), (D)
miR-125b/miR-206 ROC in tumour size groups (pT1 and pT2), (E)
let7a/RNU6B in lymph node metastasis status groups (pN0 and pN1),
(F) let7a/RNU6B ROC analysis in lymph node status groups (pN0 and
pN1), (G) let7a/miR-125b ER status (ER− and ER+), (H)
let7a/miR-125b ROC analysis in ER status groups (ER− and ER+), (I)
let7a/miR-125b PR status (PR− and PR+), (J) let7a/miR-125b ROC
analysis in PR status groups (PR− and PR+), (K) miR-125a/miR-125b
in three molecular classification groups (L, luminal; B, basal; H,
HER2 positive) (L) miR-125a/miR-206 in three molecular
classification groups. *P<0.05,
**P<0.01 and ***P<0.001. miR/miRNA,
microRNA; ROC, receiver operating characteristic; ER, estrogen
receptor; PR, progesterone receptor. |
For pT, pN, ER, PR and HER2, the P-values were
calculated and ROC analyses were performed. The lowest P-values and
the highest AUC values were used to select the best ratios
(Fig. 1C–J; Table II and III). The following ratios were
selected: miR-125b/miR-206 for pT, let-7a/RNU6B for pN,
let-7a/miR-125b for ER and let-7a/miR-125b for PR. No suitable pair
of miRNA/miRNA was found for HER2.
| Table IIIReceiver operating characteristic
analysis of 21 ratios of microRNA and RNU6B RNA 21 ratios and
groups of breast cancer samples. |
Table III
Receiver operating characteristic
analysis of 21 ratios of microRNA and RNU6B RNA 21 ratios and
groups of breast cancer samples.
A, Tumour size
grouping
|
|---|
| Pairing | AUC | SE | Fidelity | P-value |
|---|
| let7/17 | 0.879 | 0.077 | 0.728 | 0.001065 |
| let7/125b | 0.967 | 0.033 | 0.902 | 0.000037 |
| let7/U6 | 0.923 | 0.054 | 0.817 | 0.000243 |
| 17/125a | 0.886 | 0.075 | 0.739 | 0.000981 |
| 17/125b | 0.894 | 0.082 | 0.733 | 0.000737 |
| 27/206 | 0.910 | 0.070 | 0.772 | 0.049550 |
| 125a/125b | 0.939 | 0.055 | 0.832 | 0.000018 |
| 125b/206 | 1.000 | 0.000 | 1.000 | 0.000006 |
| 125b/U6 | 0.970 | 0.033 | 0.904 | 0.000099 |
| 206/U6 | 0.815 | 0.129 | 0.562 | 0.000325 |
B, Lymph node
status
|
|---|
| Pairing | AUC | SE | Fidelity | P-value |
|---|
| let7/125b | 0.885 | 0.071 | 0.746 | 0.001145 |
| let7/206 | 1.000 | | 1.000 | 0.000550 |
| let7/U6 | 0.977 | 0.025 | 0.928 | 0.000012 |
| 27/125b | 0.883 | 0.111 | 0.666 | 0.006993 |
| 27/206 | 0.833 | 0.108 | 0.621 | 0.035964 |
| 125b/206 | 0.982 | 0.024 | 0.936 | 0.000023 |
| 206/U6 | 0.882 | 0.076 | 0.732 | 0.002761 |
C, Oestrogen
receptor status
|
|---|
| Pairing | AUC | SE | Fidelity | P-value |
|---|
| let7/125b | 1.000 | | 1.000 | 0.000004 |
| let7/206 | 0.864 | 0.093 | 0.682 | 0.001306 |
| let7/U6 | 0.828 | 0.084 | 0.663 | 0.008748 |
| 17/27 | 0.923 | 0.074 | 0.778 | 0.025000 |
| 17/125a | 0.873 | 0.105 | 0.667 | 0.002048 |
| 17/125b | 0.905 | 0.063 | 0.781 | 0.000649 |
| 17/206 | 0.852 | 0.083 | 0.689 | 0.005620 |
| 17/U6 | 0.817 | 0.124 | 0.574 | 0.013000 |
| 125a/125b | 0.913 | 0.061 | 0.793 | 0.000470 |
| 125a/206 | 0.909 | 0.068 | 0.775 | 0.001155 |
| 125a/U6 | 0.917 | 0.081 | 0.759 | 0.000555 |
| 125b/206 | 0.981 | 0.024 | 0.934 | 0.000027 |
| 125b/U6 | 0.795 | 0.100 | 0.598 | 0.024017 |
| 206/U6 | 0.755 | 0.115 | 0.529 | 0.030232 |
D, Progesterone
receptor status
|
|---|
| Pairing | AUC | SE | Fidelity | P-value |
|---|
| let7/17 | 0.908 | 0.088 | 0.735 | 0.000274 |
| let7/125b | 0.958 | 0.044 | 0.872 | 0.000059 |
| let7/206 | 1.000 | | 1.000 | 0.000043 |
| 17/125a | 0.771 | 0.117 | 0.541 | 0.026016 |
| 17/125b | 1.000 | | 1.000 | 0.000001 |
| 17/206 | 0.864 | 0.084 | 0.698 | 0.003652 |
| 17/U6 | 0.840 | 0.108 | 0.629 | 0.003501 |
| 27/125b | 0.854 | 0.097 | 0.665 | 0.041758 |
| 27/206 | 0.977 | 0.035 | 0.909 | 0.002930 |
| 125a/125b | 0.838 | 0.090 | 0.662 | 0.005180 |
| 125a/206 | 1.000 | | 1.000 | 0.000011 |
| 125a/U6 | 0.923 | 0.075 | 0.776 | 0.000390 |
| 125b/206 | 0.883 | 0.084 | 0.719 | 0.001519 |
| 125b/U6 | 0.883 | 0.084 | 0.719 | 0.045585 |
The breast cancer samples investigated in the
present study were grouped into three molecular classes by
immunohistological methods: Luminal, HER2 positive and basal (L, H,
B; Fig. 1K and L). In order to
discern L from H, and L from B, the two miRNA ratios selected based
on the lowest P-values were miR-125a/miR-125b and miR-125a/miR-206,
respectively.
In conclusion, a total of 5 miRNAs (let-7, 125a,
125b, 206 and RNU6B) were selected, which were able to discriminate
tumour grade, pT, pN, ER, PR and three molecular groups in breast
cancer samples.
miRNA/mRNA ratios
As PR, ER and HER2 are the primary markers used in
the immunohistochemical classification of breast cancer samples,
the mRNA levels of PGR, ESR1 and ERBB2, and of
two reference genes, HMBS and POLR2A, were determined
in the breast cancer samples. A ratio for each receptor mRNA (PGR,
ESR1 and ERBB2) was calculated using POLR2A. Receptor mRNA levels
were correlated with their protein levels in the histological
groups, PR, ER and HER2, respectively. P-values for ESR1 and
PGR were calculated using a non-parametric Mann-Whitney test
(samples were not considered to have a normal distribution).
P-values for ERBB2 were calculated using a t-test (sample
was considered to have a normal distribution).
The ratios of each miRNA to PGR, ESR1,
ERBB2, HMBS and POLR2A mRNA were calculated
for each group (Table II). In
accordance with the results observed for the ratio of miRNA/miRNA,
the correlation in a single group may be positive or negative. The
results were therefore calculated using the same algorithm as that,
which was used for miRNA/miRNA.
For the tumour grade (G classification), which
contained three classes of samples, the following combinations of
miRNA/mRNA were selected: RNU6B/ESR1 to discriminate grades
1 and 2, and grades 1 and 3, and miR-125b/POLR2A to
discriminate grades 2 and 3. These miRNAs were selected based on
the P-values that were calculated using the Kruskal-Wallis test and
subsequently, for each pair (1 with 2, 2 with 3 and 1 with 3),
using the Mann-Whitney test (Fig. 2A
and B).
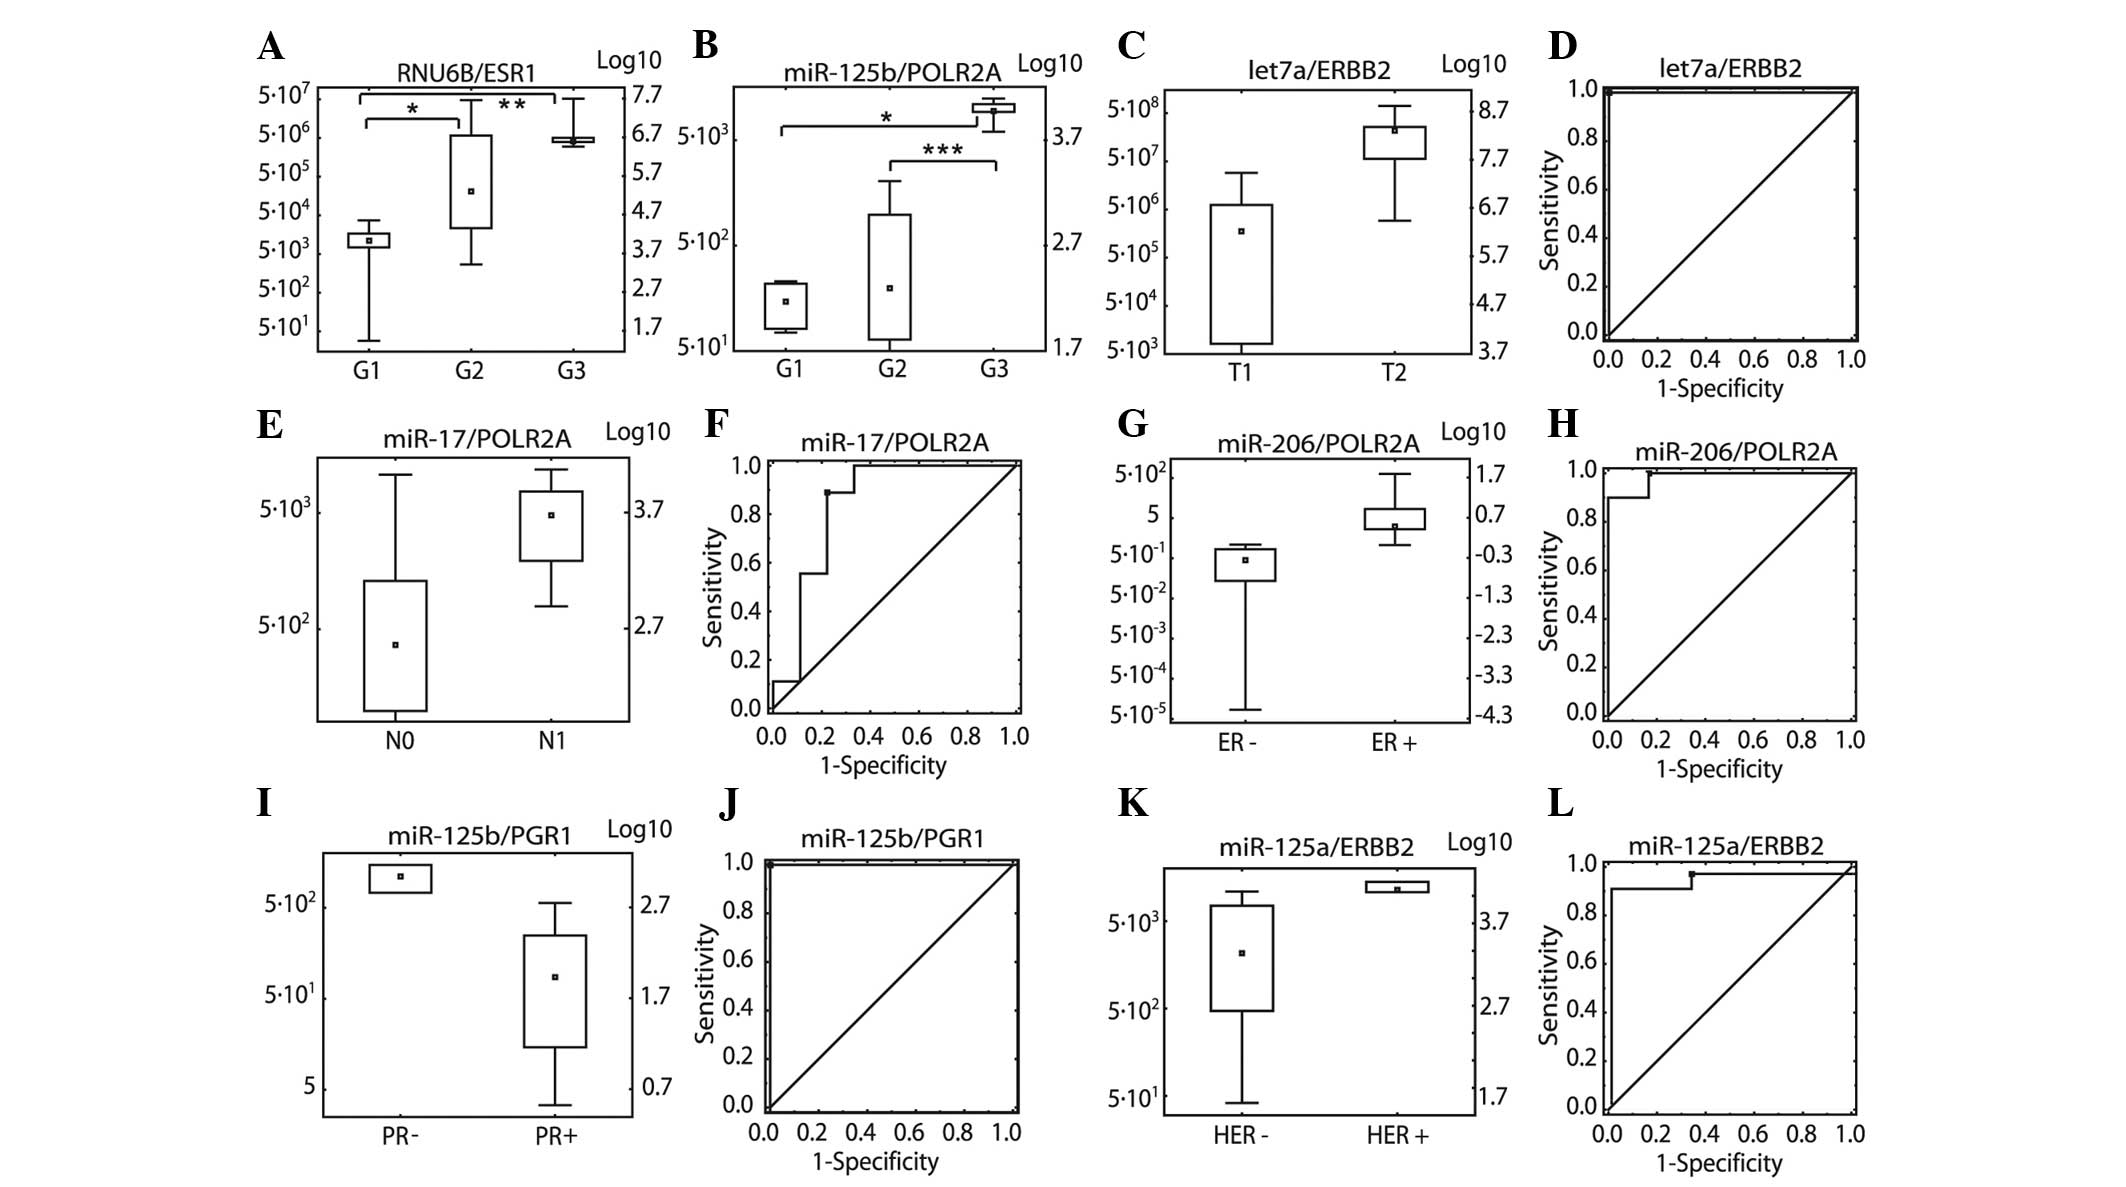 | Figure 2Relative expression levels expressed
as miRNA/mRNA ratios. (A) RNU6B/ESR1 in three grading groups
(G1–G3), (B) miR-125b/POLR2A in three grading groups (G1–G3), (C)
let7a/ERBB2 in tumour size groups (pT1 and pT2), (D) let7a/ERBB2
ROC in tumour size groups (pT1 and pT2), (E) miR-17/POLR2A in lymph
node status groups (pN0 and pN1), (F) miR-17/POLR2A ROC analysis in
lymph node metastasis status groups (pN0 and pN1), (G)
miR-206/POLR2A ER status (ER− and ER+), (H) miR-206/POLR2A ROC
analysis in ER status groups (ER− and ER+), (I) miR-125b/PGR PR
status (PR− and PR+), (J) miR-125b/PGR ROC analysis in PR status
groups (PR− and PR+), (K) miR-125a/ERBB2 in three HER2 receptor
status groups (HER− and HER+), (L) miR-125a/ERBB2 in three
molecular classification groups. *P<0.05,
**P<0.01 and ***P<0.001. miR/miRNA,
microRNA; ROC, Receiver operating characteristic; ER, estrogen
receptor; PR, progesterone receptor; HER2, human epidermal growth
factor receptor 2. |
For pT, pN, ER, PR and HER2, P-values were
calculated and ROC analyses were performed. The lowest P-values and
the highest AUC values were used to select the best ratios
(Fig. 2C–L; Table IV and V). The following ratios were selected:
let-7a/ERBB2 for pT, miR-17/POLR2A for pN,
miR-206/POLR2A for ER, miR-125b/PGR for PR and
miR-125a/ERBB2 for HER2.
| Table IVStatistical analysis of microRNA and
messenger RNA ratios in groups of breast cancer samples. |
Table IV
Statistical analysis of microRNA and
messenger RNA ratios in groups of breast cancer samples.
| Ratio | Grade
| pT
| pN
| ER
| PR
| HER2
|
|---|
| pKW | 1 | 2 | 3 | pMW | 1 | 2 | pMW | 0 | 1 | pMW | (−) | (+) | pMW | (−) | (+) | pMW | (−) | (+) |
|---|
| let7/ERBB2 | 0.1089 | 7.32 | 6.68 | 6.79 | 0.0001 | 6.82 | 8.34 | 0.3401 | 8.73 | 8.82 | 0.2908 | 6.80 | 6.81 | 0.7503 | 6.87 | 6.77 | 0,1299 | 6.90 | 6.60 |
| U6/ERBB2 | 0.0488 | 5.00 | 5.10 | 5.54 | 1.0000 | 5.21 | 5.37 | 0.6048 | 6.88 | 6.90 | 0.2460 | 5.02 | 5.36 | 0.7750 | 5.23 | 5.31 | 0,1299 | 6.97 | 7.01 |
| 17/ERBB2 | 0.0733 | 3.17 | 4.50 | 3.26 | 0.0244 | 4.34 | 3.25 | 0.7962 | 3.40 | 3.31 | 0.1246 | 3.41 | 3.33 | 0.6820 | 3.50 | 3.27 | 0,7377 | 4.66 | 4.74 |
| 27/ERBB2 | 0.0316 | 3.24 | 4.72 | 4.14 | 0.0021 | 3.22 | 4.45 | 0.0831 | 3.09 | 3.55 | 0.9298 | 3.49 | 3.34 | 0.0460 | 3.71 | 3.18 | 0,2034 | 5.24 | 5.23 |
| 125a/ERBB2 | 0.0863 | 4.22 | 4.94 | 3.77 | 0.7618 | 4.98 | 4.81 | 0.1615 | 3.56 | 3.85 | 0.2463 | 3.52 | 3.83 | 0.3873 | 3.81 | 3.70 | 0,0049 | 5.31 | 5.30 |
| 125b/ERBB2 | 0.0509 | 2.22 | 3.78 | 3.56 | 0.0021 | 3.92 | 4.79 | 0.7304 | 3.95 | 3.80 | 0.4789 | 2.89 | 3.34 | 0.1505 | 3.01 | 3.29 | 0,9118 | 2.28 | 3.59 |
| 206/ERBB2 | 0.1992 | 0.77 | 1.98 | 1.75 | 0.1308 | 2.50 | 1.55 | 0.8371 | 2.33 | 2.33 | 0.1806 | 1.62 | 1.43 | 0.9578 | 1.42 | 1.57 | | 2.63 | |
| let7/ESR1 | 0.2305 | 6.24 | 6.26 | 6.83 | 0.2512 | 6.26 | 6.68 | 0.3562 | 6.40 | 6.64 | 0.1061 | 6.56 | 6.52 | 0.9671 | 6.56 | 6.51 | 0,0227 | 6.38 | 6.71 |
| U6/ESR1 | 0.0127 | 4.16 | 6.86 | 7.13 | 0.0006 | 5.02 | 7.39 | 0.4967 | 6.97 | 5.61 | 0.1560 | 5.39 | 5.36 | 0.3229 | 7.32 | 5.76 | 0,3034 | 6.99 | 6.38 |
| 17/ESR1 | 0.0048 | 2.63 | 3.10 | 5.49 | 0.1971 | 2.36 | 3.42 | 0.5457 | 3.02 | 3.26 | 0.1505 | 2.22 | 3.32 | 0.9636 | 3.19 | 3.14 | 0,8235 | 3.00 | 3.33 |
| 27/ESR1 | 0.1348 | 2.93 | 3.50 | 3.96 | 0.0430 | 2.73 | 3.90 | 0.2428 | 3.61 | 3.61 | 1.0000 | 3.89 | 3.28 | 0.0285 | 4.05 | 2.86 | 0,1713 | 3.45 | 3.79 |
| 125a/ESR1 | 0.3109 | 3.55 | 3.63 | 3.08 | 0.0986 | 2.98 | 4.03 | 0.1903 | 3.78 | 3.66 | 0.4789 | 3.91 | 3.54 | 0.1172 | 4.07 | 3.45 | 0,0270 | 3.45 | 3.97 |
| 125b/ESR1 | 0.1758 | 1.78 | 4.31 | 3.39 | 0.0003 | 2.75 | 4.94 | 1.0000 | 3.96 | 2.93 | 0.4252 | 3.34 | 3.16 | 0.6820 | 4.19 | 2.47 | 0,6544 | 2.32 | 3.61 |
| 206/ESR1 | 0.4515 | 0.70 | 2.84 | 1.65 | 0.1564 | 1.72 | 2.13 | 0.8371 | 2.76 | 1.93 | 0.2635 | 1.86 | 0.61 | 0.1806 | 2.96 | 1.01 | | 3.20 | |
| let7/PGR | 0.5232 | 6.36 | 7.38 | 6.65 | 0.2468 | 6.58 | 7.31 | 0.4286 | 5.85 | 7.23 | | | | 0.9091 | 6.76 | 7.01 | | 7.17 | |
| U6/PGR | 0.5588 | 4.51 | | 4.72 | 0.0177 | 5.26 | 6.43 | 1.0000 | 5.80 | 5.81 | | | | 0.2727 | 7.02 | 6.70 | | 5.52 | |
| 17/PGR | 0.7823 | 2.76 | | 3.82 | 0.0519 | 2.42 | 3.65 | 0.6623 | 3.64 | 2.85 | | | | 0.3273 | 5.08 | 4.76 | | 4.38 | |
| 27/PGR | 0.038 | 2.94 | 3.53 | 7.32 | 0.3524 | 3.55 | 3.96 | 0.5167 | 2.65 | 3.40 | | | | | | | | 3.57 | |
| 125a/PGR | 0.0235 | 3.59 | 4.26 | 1.30 | 0.2571 | 3.55 | 4.09 | 1.0000 | 2.33 | 2.59 | | | | | | | | 3.62 | |
| 125b/PGR | 0.3162 | 1.95 | | 2.70 | 0.6623 | 2.45 | 2.83 | 0.7619 | 2.67 | 2.43 | | | | 0.0444 | 3.05 | 2.20 | | 2.47 | |
| 206/PGR | 0.2987 | 0.60 | 1.66 | 2.23 | 0.1775 | 2.18 | 1.70 | 0.1833 | 1.92 | 1.69 | | | | 0.4000 | 1.61 | 1.58 | | 2.30 | |
| let7/HMBS | 0.0174 | 6.44 | 5.71 | 6.97 | 0.4920 | 6.08 | 5.69 | 0.6730 | 5.51 | 6.13 | 0.0818 | 5.37 | 6.05 | 0.1600 | 5.46 | 6.04 | | 6.08 | |
| U6/HMBS | 0.0093 | 4.26 | 3.63 | 5.96 | 0.0545 | 5.07 | 4.09 | 0.6730 | 5.52 | 5.36 | | | | 0.7849 | 5.86 | 5.62 | | 5.91 | |
| 17/HMBS | 0.0063 | 2.40 | 2.05 | 4.02 | 0.7168 | 2.54 | 2.31 | 0.3704 | 2.48 | 2.42 | 0.1037 | 2.09 | 2.54 | 0.8788 | 2.47 | 2.44 | | 2.42 | |
| 27/HMBS | 0.8925 | 2.61 | 2.55 | 2.70 | 0.9039 | 2.50 | 2.62 | 0.2698 | 2.22 | 2.75 | 0.8836 | 2.67 | 2.56 | 0.3504 | 2.83 | 2.50 | | 4.13 | |
| 125a/HMBS | 0.0327 | 3.40 | 2.64 | | 0.7780 | 2.93 | 2.75 | 0.3704 | 2.75 | 2.97 | 0.1490 | 2.30 | 3.03 | 0.6235 | 2.56 | 2.95 | | 2.76 | |
| 125b/HMBS | 0.1658 | 2.20 | 1.76 | 2.12 | 0.0676 | 2.64 | 1.95 | 0.2766 | 2.54 | 2.00 | 0.1215 | 1.76 | 2.65 | 0.6461 | 1.92 | 2.61 | | 1.45 | |
| 206/HMBS | 0.1001 | 0.71 | 1.68 | 1.73 | 0.0152 | 1.79 | 1.02 | 0.9546 | 1.31 | 1.29 | 0.3710 | 0.62 | 0.59 | 0.7679 | 0.65 | 1.07 | | 1.92 | |
| let7/POLR2A | 0.0271 | 6.73 | 6.98 | 7.47 | 0.0015 | 7.27 | 6.48 | 0.4967 | 6.76 | 6.84 | 0.8314 | 6.07 | 5.89 | 0.8369 | 6.77 | 6.75 | 0,7926 | 6.67 | 7.12 |
| U6/POLR2A | 0.0053 | 4.50 | 4.83 | 5.64 | 0.1333 | 5.47 | 5.22 | 0.3154 | 5.06 | 5.18 | 0.9644 | 3.91 | 4.75 | 0.1791 | 4.74 | 5.22 | 0,5593 | 5.16 | 5.15 |
| 17/POLR2A | 0.1912 | 2.73 | 3.53 | 3.63 | 0.2610 | 2.76 | 3.40 | 0.0142 | 3.34 | 3.69 | 0.0415 | 0.78 | | 0.1797 | 3.41 | 3.65 | 0,9118 | 3.43 | 3.69 |
| 27/POLR2A | 0.8313 | 3.48 | 3.51 | 3.16 | 0.2610 | 2.87 | 3.49 | 0.5490 | 3.40 | 3.48 | 0.1422 | 2.66 | 2.99 | 0.2818 | 3.07 | 3.37 | 0,8751 | 3.05 | 3.29 |
| 125a/POLR2A | 0.2014 | 3.64 | 3.57 | | 0.5448 | 3.17 | 3.59 | 0.5457 | 3.18 | 3.48 | 0.5360 | 3.17 | 2.39 | 0.4430 | 3.41 | 3.46 | 0,5735 | 3.12 | 3.27 |
| 125b/POLR2A | 0.0048 | 2.17 | 2.69 | 3.98 | 0.0003 | 4.03 | 2.73 | 0.9314 | 2.29 | 2.42 | 0.7914 | 2.33 | 2.53 | 0.1025 | 1.80 | 2.40 | 0,0564 | 2.02 | 2.22 |
| 206/POLR2A | 0.0072 | 0.85 | 1.45 | 2.35 | 0.0002 | 2.63 | 1.49 | 0.4698 | 1.48 | 1.77 | 0.0005 | −0.31 | 1.16 | 0.3676 | 1.54 | 1.61 | | 1.98 | |
| Table VROC analysis of microRNA:mRNA
ratios. |
Table V
ROC analysis of microRNA:mRNA
ratios.
A, Tumour size
grouping
|
|---|
| miR/mRNA | AUC | SE | Fidelity | P-value |
|---|
| let7/ERBB2 | 1.000 | | 1.000 | 0.0001 |
| 17/ERBB2 | 0.815 | 0.103 | 0.614 | 0.0244 |
| 27/ERBB2 | 0.869 | 0.088 | 0.696 | 0.0021 |
| 125b/ERBB2 | 0.913 | 0.069 | 0.777 | 0.0021 |
| RNU6B/ESR1 | 0.88 | 0.093 | 0.697 | 0.0006 |
| 27/ESR1 | 0.759 | 0.114 | 0.536 | 0.0430 |
| 125b/ESR1 | 0.963 | 0.043 | 0.878 | 0.0003 |
| RNU6B/PGR | 0.571 | 0.187 | 0.205 | 0.0177 |
| 206/HMBS | 0.847 | 0.1 | 0.652 | 0.0152 |
| let7/POLR2A | 1.000 | | 1.000 | 0.0015 |
| 125b/POLR2A | 0.963 | 0.043 | 0.879 | 0.0003 |
| 206/POLR2A | 1.000 | | 1.000 | 0.0002 |
B, Lymph node
status
|
|---|
| miR/mRNA | AUC | SE | Fidelity | P-value |
|---|
| 17/POLR2A | 0.84 | 0.105 | 0.635 | 0.0142 |
C, Oestrogen
receptor status
|
|---|
| miR/mRNA | AUC | SE | Fidelity | P-value |
|---|
| 17/POLR2A | 0.806 | 0.133 | 0.544 | 0.0415 |
| 206/POLR2A | 0.983 | 0.026 | 0.932 | 0.0005 |
D, Progesterone
receptor status
|
|---|
| miR/mRNA | AUC | SE | Fidelity | P-value |
|---|
| 27/ERBB2 | 0.815 | 0.104 | 0.611 | 0.0460 |
| 27/ESR1 | 0.821 | 0.141 | 0.545 | 0.0285 |
| 125b/PGR | 1.000 | | 1.000 | 0.0444 |
E, Human epithelial
growth factor receptor 2 status
|
|---|
| miR/mRNA | AUC | SE | Fidelity | P-value |
|---|
| 125a/ERBB2 | 0.978 | 0.033 | 0.913 | 1.0000 |
| let7/ESR1 | 1.000 | | 1.000 | 1.0000 |
| 125a/ESR1 | 0.911 | 0.088 | 0.739 | 1.0000 |
Due to the poor amplification of cDNA from six of
the FFPE samples, the results were insufficient to discern the
three molecular classes of breast cancer using the miRNA/mRNA
ratios. However, the miRNA/mRNA ratio did allow the discrimination
of HER2-negative groups (0,1,2) and positive groups (3) using miR-125a/ERBB2.
In conclusion, the strategy of using the miRNA/mRNA
ratio requires the analysis of 5 miRNAs (let-7a, miR-17, miR-125b,
miR-206, RNU6B) and 4 mRNAs (ESR1, PGR, ERBB2,
POLR2A). An advantage of the miRNA/mRNA ratio is that it
allowed the discrimination of HER2-negative groups (0,1,2) and
positive groups (3) using the
miR-125a/ERBB2 ratio.
Discussion
In the present study, a total of 8 pairs of
miRNA:miRNA and miRNA:RNU6B, and one miRNA:mRNA pair were
identified, which may be used as markers in order to improve the
classification of breast cancer samples. These markers may aid in
the classification of the cancer grade, tumour size (pT), lymph
node metastasis (pN), ER status, PR status, and three molecular
breast cancer types (luminal, HER2 positive and basal). In
addition, pairs of miRNA:mRNA were identified, which were able to
distinguish HER2 receptor groups. To achieve this, the 'diffpair'
method was utilised, and the correction method to diminish the
variability in the ratios of two selected miRNAs was applied.
Statistical criteria enabled the selection of 8 of
the 21 possible pairings of 7 types of RNA. In the set of 21 pairs,
each miRNA and RNU6B pair was presented only once; inverted pairs
were not assessed. In order to achieve greater accuracy and lower
P-values, the correction method was applied when calculating the
means of all the RNA pairs in the groups. This improved the
significance in the discrimination of groups of samples. The
samples were grouped according to six criteria (grade, Tp, Np, ER
status, PR status, HER2 status and molecular type). These six
criteria were used to divide the samples into 16 groups. Based on
the present results, it was hypothesised that measuring
miR-17/miR-27b to discriminate grades G2 and G3, miR-125a/RNU6B to
discriminate grades G1 and G3 and grades G1 and G2,
miR-125b/miR-206 to assess tumour size (pT), let-7a/RNU6B to assess
lymph node metastasis, and let-7a/miR-125b to determine the ER and
PR status may be effective. Furthermore, it was hypothesised that
HER2 negative (0,1,2) and positive (3) groups may be differentiated using the
miR-125a/ERBB2 ratio.
The RT-PCR kit supplier recommended using RNU6B as a
reference and fold-change relative to a calibrator sample
(2ΔΔCT) for relative expression analysis (31). The present study was verified by
analysing each of the 6 miRNAs and using RNU6B as reference,
according to the manufacturer's instructions, thereby enabling the
comparison of the present results with the previously published
results regarding miRNA levels in breast cancer cells (2,7,17–19,30,37–42).
This analysis, using RNU6B as a reference, revealed a significantly
higher expression of miR-17 in basal compared with luminal samples
(MW; P=0.0366). A higher level of miR-17 expression was observed in
ER− and PR-negative tissues, compared with ER− and PR-positive
samples. Dvigne et al (2)
demonstrated that 17-5p and 17-3p* exhibit highly
similar expression patterns. The present results were similar to
those of previous studies, in which miR-17-3p was increased in
basal compared with luminal breast cancer tissue (2,37).
The authors also demonstrated that miR-17-5p and 3p were increased
in ER-negative and high-grade breast cancer tissues (2). There are contradictory data
concerning miR-17-3p, which indicates that it is decreased in
primary breast cancer (ductal carcinoma in situ) compared
with normal epithelial tissues (38). However, these data are not directly
contradictory to the present results, as the current study did not
compare normal tissues with cancerous tissues; rather it compared
different types of cancer.
Let-7a expression measured relative to RNU6B was
lower in higher-grade samples than that in lower-grade samples. It
was also lower in ER-negative samples, lymph node-positive samples
and basal samples, compared with luminal samples. This finding was
similar to that obtained in earlier studies. In those studies, the
expression of let-7a was lower in breast cancer compared with
normal tissue, and was lower in invasive ductal carcinoma with
lymph node metastasis compared with those without lymph node
metastasis (7,19).
In the present study, a lower expression of miR-27b
was observed in higher-grade cancer samples. Depending on the
method used, the data concerning the expression of pre-miR-27b in
breast cancer have been inconsistent in previous studies, and have
been reported as being either lower in cancerous tissues compared
with noncancerous tissues (17) or
higher (18,39).
Decreased expression of miR-125a was observed in
higher-grade cancer and in ER-negative and luminal cancer compared
with basal types of cancer. miR-125a expression has been observed
to be reduced in breast cancer compared with normal tissue
(19). A decreased expression of
miR-125b was observed in ER− and PR-positive cancer, and in samples
from larger tumours (pT1). miR-125b has been observed to be
decreased in pre-invasive breast cancer compared with normal
epithelium, in breast cancer that has metastasised to the lymph
nodes compared with primary breast cancer, and in luminal compared
with basal breast cancer (19,38,40,41).
Decreased levels of miR-206 were observed in lymph
node-positive cancer, in ER-positive cancer, smaller tumours, and
in luminal compared with basal samples. In previous studies,
miR-206 has been demonstrated to be decreased in normal breast
tissues compared with primary breast tumours and in ER-positive
compared with ER-negative tumours (19). In recent studies, miR-206
expression was found to be reduced in breast tumours and was
inversely correlated with tumour aggressiveness (30,42).
Various miRNA biomarkers have been proposed, with
which to classify breast cancer cells and to predict their
invasiveness and metastatic potential (43,44).
However, these markers are not comparable with those used in the
present study, due to differences in the classification criteria
used. It was confirmed that the selected miRNAs exhibited
concomitant expression, as performed in array studies (2,19).
The aim of the present study was to improve the classification
power of miRNA biomarkers, particularly in a small group of
samples. Therefore, paired miRNA biomarker selection was applied as
an alternative analysis method for the present data.
In order to determine potential reference miRNAs,
and the most stably expressed miRNAs, samples were analysed using
the GeNorme software. miR-125a, miR-125b and RNU6B were the most
stable in the present group of samples. Their average expression
stability was: miR-125a, 0.115; miR-125b, 0.119; RNU6B, 0.125; and
let-7a, 0.206. The present analysis includes let-7a, which has been
proposed for normalisation in breast cancer studies (45). Due to contradictory data regarding
which miRNAs are the best reference miRNAs in breast cancer
analyses, a method was proposed for selecting pairs of miRNA
markers without defining the target or reference genes. In the 8
pairs of selected markers used in the present study, the most
stably expressed miRNAs selected by GeNorme were miR-125b and
miR-125a, which were applied to six pairs as either divisor or
dividend.
Normalisation is important for the measurement of
gene expression. Several normalisation approaches are used in miRNA
investigations, depending on the type of platform, including single
RT-qPCR assays, RT-qPCR arrays, microarrays or sequencing (46,47).
The most common method for normalisation in RT-qPCR assays is the
application of the least variable miRNA or other small RNA, such as
RNU6B RNA, as a reference (45). A
relative analysis method was selected for the miRNA levels, based
on the selection of one of all possible miRNA pairs. This approach
is termed 'self-normalising biomarker' or 'DiffPairs', which
indicates the most effective means by which to differentiate two
groups of samples (32,48). The method has been applied in miRNA
investigations in the brain, pancreatic cyst and lung cancer
analysis, but has not, to the best of our knowledge, been assessed
in breast cancer cells (32,48,49).
In the present study, a modified method of (diffpairs), also termed
'self-normalising biomarker', was applied to evaluate the best pair
of miRNAs (32). The method was
modified with regard to the anti-correlation of two miRNAs by
introducing a mathematical formula that achieves lower P-values,
which may aid differentiation of the groups in which at least one
pair of miRNAs was inversely correlated (32).
A limitation of the present study was the small
number of samples. However, the aim of the study was to provide an
example of how to identify pairs of self-normalising biomarkers.
Further investigation is required in order to assess the use of
these markers on a greater number of patients.
The present study aimed to demonstrate a calculation
method with improved diagnostic power that allows the use of a
small number of miRNAs as molecular markers. In addition to the
modified mathematical model, potential new pairs of markers were
determined for tumour grades (G classification). miR-17/miR-27b
discriminated grades G2 and G3, and miR-125a/RNU6B discriminated
grades G1 and G3, and grades G1 and G2. For other classification
parameters, the following ratios were selected: miR-125b/miR-206
for pT, let-7a/RNU6B for pN, let-7a/miR-125b for ER and PR. HER2
negative and positive groups may be differentiated using the
miR-125a/ERBB2 ratio.
In conclusion, the originality of the present study
was the demonstration of an approach for improving the calculation
of gene expression using a method that is able to detect and
recalculate the anti-correlating expression results of two genes.
The method termed 'DiffPairs' was modified and adapted to this
approach for the first time, to the best of our knowledge, in order
to analyse miRNA expression in breast cancer cells (32). Defining a single reference gene was
abandoned, and instead the optimum specificity and sensitivity
marker pairs of miRNA:miRNA, miRNA:RNU6B or miRNA:mRNA were
selected. The present approach may be complimentary to a subjective
classification based on the results of immunohisto-chemical
analysis.
Future studies may help to elucidate the number of
miRNA paired markers, which is required to diagnose a single sample
with a similar or higher accuracy than immunohistochemistry.
Acknowledgments
The present study was supported by the National
Science Centre (grant no. N N 403598538). The authors would like to
thank Ms. Beata Raczak and Ms. Bogumila Ratajczak for their
assistance during the preparation of this manuscript.
References
|
1
|
Ebert MS and Sharp PA: Roles for microRNAs
in conferring robustness to biological processes. Cell.
149:515–524. 2012. View Article : Google Scholar : PubMed/NCBI
|
|
2
|
Dvinge H, Git A, Graf S, et al: The
shaping and functional consequences of the microRNA landscape in
breast cancer. Nature. 497:378–382. 2013. View Article : Google Scholar : PubMed/NCBI
|
|
3
|
Mogilyansky E and Rigoutsos I: The
miR-17/92 cluster: a comprehensive update on its genomics,
genetics, functions and increasingly important and numerous roles
in health and disease. Cell Death Differ. 20:1603–1614. 2013.
View Article : Google Scholar : PubMed/NCBI
|
|
4
|
Croft L, Szklarczyk D, Jensen LJ, et al:
Multiple independent analyses reveal only transcription factors as
an enriched functional class associated with microRNAs. BMC Syst
Biol. 6:902012. View Article : Google Scholar : PubMed/NCBI
|
|
5
|
Lehmann U: Aberrant DNA methylation of
microRNA genes in human breast cancer-a critical appraisal. Cell
Tissue Res. 356:657–664. 2014. View Article : Google Scholar : PubMed/NCBI
|
|
6
|
Castells A, Gusella JF, Ramesh V, et al: A
region of deletion on chromosome 22q13 is common to human breast
and colorectal cancers. Cancer Res. 60:2836–2839. 2000.PubMed/NCBI
|
|
7
|
Hu X, Guo J, Zheng L, et al: The
heterochronic microRNA let-7 inhibits cell motility by regulating
the genes in the actin cytoskeleton pathway in breast cancer. Mol
Cancer Res. 11:240–250. 2013. View Article : Google Scholar : PubMed/NCBI
|
|
8
|
Kim SJ, Shin JY, Lee KD, et al: MicroRNA
let-7a suppresses breast cancer cell migration and invasion through
downregulation of C-C chemokine receptor type 7. Breast Cancer Res.
14:R142012. View
Article : Google Scholar : PubMed/NCBI
|
|
9
|
Wang X, Cao L, Wang Y, et al: Regulation
of let-7 and its target oncogenes (Review). Oncol Lett. 3:955–960.
2012.PubMed/NCBI
|
|
10
|
Volinia S, Calin GA, Liu CG, et al: A
microRNA expression signature of human solid tumors defines cancer
gene targets. Proc Natl Acad Sci USA. 103:2257–2261. 2006.
View Article : Google Scholar : PubMed/NCBI
|
|
11
|
Santos-Jr GC, Goes AC, Vitto H, et al:
Genomic instability at the 13q31 locus and somatic mtDNA mutation
in the D-loop site correlate with tumor aggressiveness in sporadic
Brazilian breast cancer cases. Clinics (Sao Paulo). 67:1181–1190.
2012. View Article : Google Scholar
|
|
12
|
Olive V, Li Q and He L: mir-17-92: a
polycistronic oncomir with pleiotropic functions. Immunol Rev.
253:158–166. 2013. View Article : Google Scholar : PubMed/NCBI
|
|
13
|
Hossain A, Kuo MT and Saunders GF:
Mir-17-5p regulates breast cancer cell proliferation by inhibiting
translation of AIB1 mRNA. Mol Cell Biol. 26:8191–8201. 2006.
View Article : Google Scholar : PubMed/NCBI
|
|
14
|
Yu Z, Wang C, Wang M, et al: A cyclin
D1/microRNA 17/20 regulatory feedback loop in control of breast
cancer cell proliferation. J Cell Biol. 182:509–517. 2008.
View Article : Google Scholar : PubMed/NCBI
|
|
15
|
Yu Z, Willmarth NE, Zhou J, et al:
microRNA 17/20 inhibits cellular invasion and tumor metastasis in
breast cancer by heterotypic signaling. Proc Natl Acad Sci USA.
107:8231–8236. 2010. View Article : Google Scholar : PubMed/NCBI
|
|
16
|
Sinha S, Singh RK, Alam N, et al:
Alterations in candidate genes PHF2, FANCC, PTCH1 and XPA at
chromosomal 9q22.3 region: pathological significance in early- and
late-onset breast carcinoma. Mol Cancer. 7:842008. View Article : Google Scholar : PubMed/NCBI
|
|
17
|
Tsuchiya Y, Nakajima M, Takagi S, et al:
MicroRNA regulates the expression of human cytochrome P450 1B1.
Cancer Res. 66:9090–9098. 2006. View Article : Google Scholar : PubMed/NCBI
|
|
18
|
Jin L, Wessely O, Marcusson EG, et al:
Prooncogenic factors miR-23b and miR-27b are regulated by Her2/Neu,
EGF and TNF-alpha in breast cancer. Cancer Res. 73:2884–2896. 2013.
View Article : Google Scholar : PubMed/NCBI
|
|
19
|
Iorio MV, Ferracin M, Liu CG, et al:
MicroRNA gene expression deregulation in human breast cancer.
Cancer Res. 65:7065–7070. 2005. View Article : Google Scholar : PubMed/NCBI
|
|
20
|
Gentile M, Olsen K, Dufmats M, et al:
Frequent allelic losses at 11q24.1-q25 in young women with breast
cancer: association with poor survival. Br J Cancer. 80:843–849.
1999. View Article : Google Scholar : PubMed/NCBI
|
|
21
|
Feliciano A, Castellvi J, Artero-Castro A,
et al: miR-125b acts as a tumor suppressor in breast tumorigenesis
via its novel direct targets ENPEP, CK2-alpha, CCNJ and MEGF9. PLoS
One. 8:e762472013. View Article : Google Scholar
|
|
22
|
Serpico D, Molino L and Di Cosimo S:
microRNAs in breast cancer development and treatment. Cancer Treat
Rev. 40:595–604. 2014. View Article : Google Scholar
|
|
23
|
Scott GK, Goga A, Bhaumik D, et al:
Coordinate suppression of ERBB2 and ERBB3 by enforced expression of
micro-RNA miR-125a or miR-125b. J Biol Chem. 282:1479–1486. 2007.
View Article : Google Scholar
|
|
24
|
Zhang Y, Yan LX, Wu QN, et al: miR-125b is
methylated and functions as a tumor suppressor by regulating the
ETS1 proto-oncogene in human invasive breast cancer. Cancer Res.
71:3552–3562. 2011. View Article : Google Scholar : PubMed/NCBI
|
|
25
|
Nexo BA, Vogel U, Olsen A, et al: Linkage
disequilibrium mapping of a breast cancer susceptibility locus near
RAI/PPP1R13 L/iASPP. BMC Med Genet. 9:562008. View Article : Google Scholar
|
|
26
|
Nohata N, Hanazawa T, Enokida H, et al:
microRNA-1/133a and microRNA-206/133b clusters: dysregulation and
functional roles in human cancers. Oncotarget. 3:9–21.
2012.PubMed/NCBI
|
|
27
|
Adams BD, Furneaux H and White BA: The
micro-ribonucleic acid (miRNA) miR-206 targets the human estrogen
receptor-alpha (ERalpha) and represses ERalpha messenger RNA and
protein expression in breast cancer cell lines. Mol Endocrinol.
21:1132–1147. 2007. View Article : Google Scholar : PubMed/NCBI
|
|
28
|
Song G, Zhang Y and Wang L: MicroRNA-206
targets notch3, activates apoptosis and inhibits tumor cell
migration and focus formation. J Biol Chem. 284:31921–31927. 2009.
View Article : Google Scholar : PubMed/NCBI
|
|
29
|
Yan D, Dong Xda E, Chen X, et al:
MicroRNA-1/206 targets c-Met and inhibits rhabdomyosarcoma
development. J Biol Chem. 284:29596–29604. 2009. View Article : Google Scholar : PubMed/NCBI
|
|
30
|
Zhou J, Tian Y, Li J, et al: miR-206 is
down-regulated in breast cancer and inhibits cell proliferation
through the up-regulation of cyclinD2. Biochem Biophys Res Commun.
433:207–212. 2013. View Article : Google Scholar : PubMed/NCBI
|
|
31
|
Applied Biosystems: Endogenous Controls
for Real-Time Quantitation of miRNA Using TaqMan MicroRNA Assays.
2010.
|
|
32
|
Matthaei H, Wylie D, Lloyd MB, et al:
miRNA biomarkers in cyst fluid augment the diagnosis and management
of pancreatic cysts. Clin Cancer Res. 18:4713–4724. 2012.
View Article : Google Scholar : PubMed/NCBI
|
|
33
|
Pfaffl MW, Tichopad A, Prgomet C, et al:
Determination of stable housekeeping genes, differentially
regulated target genes and sample integrity: BestKeeper-Excel-based
tool using pair-wise correlations. Biotechnol Lett. 26:509–515.
2004. View Article : Google Scholar : PubMed/NCBI
|
|
34
|
Escobar PF, Patrick RJ, Rybicki LA, et al:
The 2003 revised TNM staging system for breast cancer: Results of
stage re-classification on survival and future comparisons among
stage groups. Ann Surg Oncol. 14:143–147. 2007. View Article : Google Scholar
|
|
35
|
Elston CW and Ellis IO: Pathological
prognostic factors in breast cancer. I. The value of histological
grade in breast cancer: Experience from a large study with
long-term follow-up. Histopathology. 19:403–410. 1991. View Article : Google Scholar : PubMed/NCBI
|
|
36
|
Corcoran C, Friel AM, Duffy MJ, et al:
Intracellular and extracellular microRNAs in breast cancer. Clin
Chem. 57:18–32. 2011. View Article : Google Scholar
|
|
37
|
Calvano Filho CM, Calvano-Mendes DC,
Carvalho KC, et al: Triple-negative and luminal A breast tumors:
differential expression of miR-18a-5p, miR-17-5p and miR-20a-5p.
Tumour Biol. 35:7733–7741. 2014. View Article : Google Scholar : PubMed/NCBI
|
|
38
|
Hannafon BN, Sebastiani P, de las Morenas
A, et al: Expression of microRNA and their gene targets are
dysregulated in preinvasive breast cancer. Breast Cancer Res.
13:R242011. View Article : Google Scholar : PubMed/NCBI
|
|
39
|
Wang Y, Rathinam R, Walch A, et al: ST14
(suppression of tumorigenicity 14) gene is a target for miR-27b and
the inhibitory effect of ST14 on cell growth is independent of
miR-27b regulation. J Biol Chem. 284:23094–23106. 2009. View Article : Google Scholar : PubMed/NCBI
|
|
40
|
Baffa R, Fassan M, Volinia S, et al:
MicroRNA expression profiling of human metastatic cancers
identifies cancer gene targets. J Pathol. 219:214–221. 2009.
View Article : Google Scholar : PubMed/NCBI
|
|
41
|
Bockmeyer CL, Christgen M, Muller M, et
al: MicroRNA profiles of healthy basal and luminal mammary
epithelial cells are distinct and reflected in different breast
cancer subtypes. Breast Cancer Res Treat. 130:735–745. 2011.
View Article : Google Scholar : PubMed/NCBI
|
|
42
|
Li Y, Hong F and Yu Z: Decreased
expression of microRNA-206 in breast cancer and its association
with disease characteristics and patient survival. J Int Med Res.
41:596–602. 2013. View Article : Google Scholar : PubMed/NCBI
|
|
43
|
Falkenberg N, Anastasov N, Rappl K, et al:
MiR-221/-222 differentiate prognostic groups in advanced breast
cancers and influence cell invasion. Br J Cancer. 109:2714–2723.
2013. View Article : Google Scholar : PubMed/NCBI
|
|
44
|
Lerebours F, Cizeron-Clairac G, Susini A,
et al: miRNA expression profiling of inflammatory breast cancer
identifies a 5-miRNA signature predictive of breast tumor
aggressiveness. Int J Cancer. 133:1614–1623. 2013. View Article : Google Scholar : PubMed/NCBI
|
|
45
|
Davoren PA, McNeill RE, Lowery AJ, et al:
Identification of suitable endogenous control genes for microRNA
gene expression analysis in human breast cancer. BMC Mol Biol.
9:762008. View Article : Google Scholar : PubMed/NCBI
|
|
46
|
Meyer SU, Pfaffl MW and Ulbrich SE:
Normalization strategies for microRNA profiling experiments: a
'normal' way to a hidden layer of complexity? Biotechnol Lett.
32:1777–1788. 2010. View Article : Google Scholar : PubMed/NCBI
|
|
47
|
Qureshi R and Sacan A: A novel method for
the normalization of microRNA RT-PCR data. BMC Med Genomics.
6(Suppl 1): 142013. View Article : Google Scholar
|
|
48
|
Sheinerman KS, Tsivinsky VG, Crawford F,
et al: Plasma microRNA biomarkers for detection of mild cognitive
impairment. Aging (Albany NY). 4:590–605. 2012.
|
|
49
|
Hennessey PT, Sanford T, Choudhary A, et
al: Serum microRNA biomarkers for detection of non-small cell lung
cancer. PLoS One. 7:e323072012. View Article : Google Scholar : PubMed/NCBI
|


