Introduction
Glaucoma is an ocular disorder, characterized by
intraocular pressure-associated optic neuropathy, with open angle
and closed angle glaucoma being the two predominant types. At
present, glaucoma is the second leading cause of vision loss
worldwide (1). The number of
individuals with open angle glaucoma worldwide in 2000 was
44,700,000, and the number is projected to increase to 79,600,000
worldwide (1). In 2013, the
population of patients aged between 40 and 80 years with glaucoma
worldwide was estimated to be 64,300,000 (2).
The chronic increase in intraocular pressure, which
results in eye pain, is considered a key risk factor for glaucoma
(3). Dysfunction of the corneal
endothelium results in bullous keratopathy, characterized by
progressive optic nerve fiber loss and retinal ganglion cell death
(4). In glaucoma, optic nerve
fiber degeneration initially occurs at the lamina cribrosa
(5), which is formed by
extracellular matrix (ECM) and quiescent astrocytes (6,7), and
functions as a fibroelastic structure, providing mechanical and
biological support for optic nerve axons. Chronic elevated
intraocular pressure results in ECM remodeling and activation of
quiescent astrocytes (8). In turn,
the reactive astrocytes express new ECM proteins, a number of which
are considered to alter its composition or be neurotoxic to the
retinal ganglion cells.
There is a genetic basis underlying a substantial
fraction of glaucoma. It has been reported that ~5% of primary open
angle glaucoma cases are currently attributed to single-gene or
Mendelian forms of glaucoma (9).
The vascular endothelial growth factor (VEGF) family and
collagen gene family have been associated with glaucoma risk
(10). It has been reported that
the VEGF family consists of positive regulators of
angiogenesis in the retina (11,12).
In addition, VEGF has been demonstrated to be a key inducer of
corneal neovascularization (13–15),
which may contribute to the further understanding and treatment of
glaucoma. Previous studies have implicated the involvement of
collagen genes in the regulation of central corneal thickness,
which is a risk factor of glaucoma and, thus, possibly associated
with the pathogenesis of glaucoma (16). Variations in collagen genes, which
lead to inter-individual differences in scleral and lamina cribrosa
properties, have been previously reported to result in different
susceptibilities of individuals to elevated intraocular pressure
(17). Therefore, it has been
suggested that collagen mutations may cause glaucoma (18). Each of these investigations
concerning glaucoma genetics have provided novel insights into gene
therapy, which appears to be a promising approach in the treatment
of glaucoma (19).
Genome-wide analyses of glaucoma have been
performed. Bettahi et al (20) selected the differentially expressed
genes (DEGs) in healing corneal epithelial cells of normal, vs.
diabetic corneas. Pieragostino et al (21) examined differential protein
expression in the tears of patients with pseudoexfoliative and
primary open angle glaucoma. Microarray data in leukocytes of
patients with primary open angle glaucoma has also been analyzed to
examine variations at a genetic level (22). The GSE2378 gene expression profile
in the Gene Expression Omnibus (GEO) database is comprised of seven
and eight astrocyte samples from donors with and without glaucoma,
respectively, and has been previously downloaded to screen DEGs and
cluster-associated functions (23–25).
However, the interaction among DEGs, particularly the functional
modules in the interaction network, remain to be elucidated.
In the present study, the GSE2378 gene expression
array was used and, to eliminate the effects of mismatching between
large quantities of probe IDs and gene symbols, the data were
divided into two groups: Prior to and following the summation of
probe values. The DEGs were screened, followed by Gene Ontology
(GO) and pathway enrichment analysis and, to examine the potential
mechanism of glaucoma, interactions between the DEGs were
investigated and visualized and significant functional modules in
the network were assessed.
Materials and methods
Derivation of genetic data
The GSE2378 gene expression profiles of optic nerve
astrocytes (26,27) were downloaded from the public
functional genomics data repository GEO database (http://www.ncbi.nlm.nih.gov/geo/) (28). In total, 15 specimens, including
seven normal samples and eight glaucoma specimens, were available,
based on the Human Genome U95 version 2 array from Affymetrix, Inc.
(Santa Clara, CA, USA).
Normalization of data
The original GSE2378 data in the CEL files were
converted into expression measures using the affy package in R
language (29) (http://www.bioconductor.org/packages/3.0/bioc/), and
background correction and quartile data normalization were
performed using the robust multiarray average algorithm with
default parameters in the R affy package (30,31).
Selection of DEGs
The Limma package in R (32) (http://www.bioconductor.org/packages/release/bioc/html/limma.html)
was used to identify the DEGs at the probe level between the
glaucoma samples and normal samples. P<0.01 and |log fold change
(FC)|>0.5 were used as the cut-off criteria. The DEGs were
determined pre- and post-summation of the probe value. In the
treatment of post-summation of probe value, when multiple probe
sets corresponded to the same gene, the expression values of the
probes were added as the final value of gene expression for the
differential expression screening.
Function and pathway enrichment of the
DEGs
Functional enrichment analysis was conducted for
DEGs, to identify changes in biological function or characteristics
by calculating the whole significance of the gene expression
(33). Gene-annotation enrichment
analysis is a high-throughput strategy, which reduces the dimension
of the data analysis and increases the likelihood of identifying
the most relevant biological processes, making it a common approach
in functional investigations of large-scale genomic or microarray
data (34). Although a number of
high-throughput enrichment tools can provide gene function
enrichment analysis, the most widely used is Database for
Annotation, Visualization and Integration Discovery (DAVID)
(35) (http://david.abcc.Ncifcrf.gov/). In the present study,
DAVID was applied to the enriched GO categories, based on a
hypergeometric distribution with a count (gene number enriched in a
specific GO term) >5 and the false discovery rate (FDR)<0.01.
In addition, the over-represented Kyoto Encyclopedia of Genes and
Genomes (KEGG) categories in the pathways (36) were identified.
Protein-protein interaction network and
functional module analysis
The Biomolecular Interaction Network Database (BIND;
http://bind.ca) (37)
archives biomolecular interaction, complex and pathway information.
Continued input from users has further improved the BIND data
specification, which includes the ability to store detailed
information about genetic interactions. Based on the available gene
information of the DEGs in the above dataset, the interaction
networks were analyzed using Cytoscape (http://www.cytoscape.org/) with a confidence threshold
of 0.7. In addition, cluster analysis of genes in protein-protein
interaction networks was performed to identify modules with the
highest confidence levels using ClusterONE (http://www.paccanarolab.org.sci-hub.org/clusterone/)
in the Cytoscape software. Subsequently, GO enrichment analysis of
the clustered genes in the selected module was performed, using
DAVID with parameters of count >5 and the FDR<0.01.
Results
Identification of DEGs
Based on the Limma package in R language, using
P<0.01 and |logFC|>0.5 cut-offs, a total of 234 probes were
identified to be differentially expressed in the glaucoma samples
compared with the normal control samples, which included 79
downregulated probes, corresponding to 67 genes; and 155
upregulated probes, corresponding to 142 genes. A total of four
probes matching the MYH11 gene were significantly
downregulated. Subsequent to statistical analysis, 2,000 genes were
identified to match multiple probes. Accordingly, the expression
profiles of the probes were added for the same gene to perform the
differential analysis between the normal and glaucoma groups at the
gene expression level, rather than at the probe level only. In
total, 223 DEGs were identified post-summation of the probe value,
including 74 downregulated and 149 upregulated genes. Compared with
the results pre-summation, there were 189 DEGs in common, with the
most significant gene listed in Table
I.
 | Table IDifferentially expressed genes pre-
and post-summation. |
Table I
Differentially expressed genes pre-
and post-summation.
| Probe ID | Pre-summation
| Post-summation
|
|---|
| Gene symbol | logFC | P-value | Gene symbol | logFC | P-value |
|---|
| 32582_at | MYH11 | −3.00 | 6.37E-04 | MYH11 | −8.96 | 1.44E-03 |
| 34235_at | GPR116 | −2.36 | 0.007138566 | ITGA6 | −3.06 | 5.35E-04 |
| 37407_s_at | MYH11 | −2.29 | 0.002362727 | STAT1 | −2.54 | 2.13E-03 |
| 767_at | MYH11 | −1.97 | 0.003229233 | GPR116 | −2.36 | 7.83E-03 |
| 40488_at | DMD | −1.49 | 9.75E-04 | RBPMS | −2.14 | 4.54E-03 |
| 39710_at | NREP | −1.48 | 0.003015513 | CSPG4 | −1.90 | 1.30E-03 |
| 37279_at | GEM | −1.40 | 1.35E-03 | SLC1A1 | −1.85 | 8.53E-03 |
| 38004_at | CSPG4 | −1.38 | 0.000514187 | TEK | −1.82 | 2.11E-03 |
| 40899_at | KRT19 | −1.27 | 0.007598562 | ITGA3 | −1.63 | 2.60E-03 |
| 774_g_at | MYH11 | −1.23 | 0.005252688 | PDLIM5 | −1.57 | 7.72E-03 |
| 41215_s_at | 41215_s_at | 2.05 | 0.007785332 | SEPP1 | 2.43 | 9.40E-05 |
| 36686_at | ALDH1A3 | 2.09 | 5.06E-03 | ADH1B | 2.48 | 1.51E-06 |
| 38379_at | GPNMB | 2.18 | 0.002595973 | CLU | 2.49 | 1.24E-03 |
| 1380_at | FGF7 | 2.25 | 4.40E-03 | PDE1A | 2.77 | 2.28E-03 |
| 34363_at | SEPP1 | 2.43 | 7.77E-05 | AKR1C3 | 2.88 | 8.90E-05 |
| 35730_at | ADH1B | 2.49 | 1.14E-06 | 32805_at | 3.25 | 5.81E-04 |
| 36780_at | CLU | 2.49 | 0.00108886 | ID1 | 3.45 | 1.26E-03 |
| 36311_at | PDE1A | 2.78 | 0.00202481 | CTSK | 3.56 | 6.69E-05 |
| 37399_at | AKR1C3 | 2.89 | 7.35E-05 | PTGDS | 4.63 | 1.37E-04 |
| 32805_at | 32805_at | 3.25 | 5.00E-04 | FGF7 | 6.20 | 2.18E-03 |
The MYH1, CSPG41 and GPR116
genes were identified to be the most significantly downregulated
DEGs prior and subsequent to probe value summation. Similarly,
among the upregulated genes, FGF7, ADH1B, CLU,
ARR1C3, SEPP1 and PDE1A were in the top 10
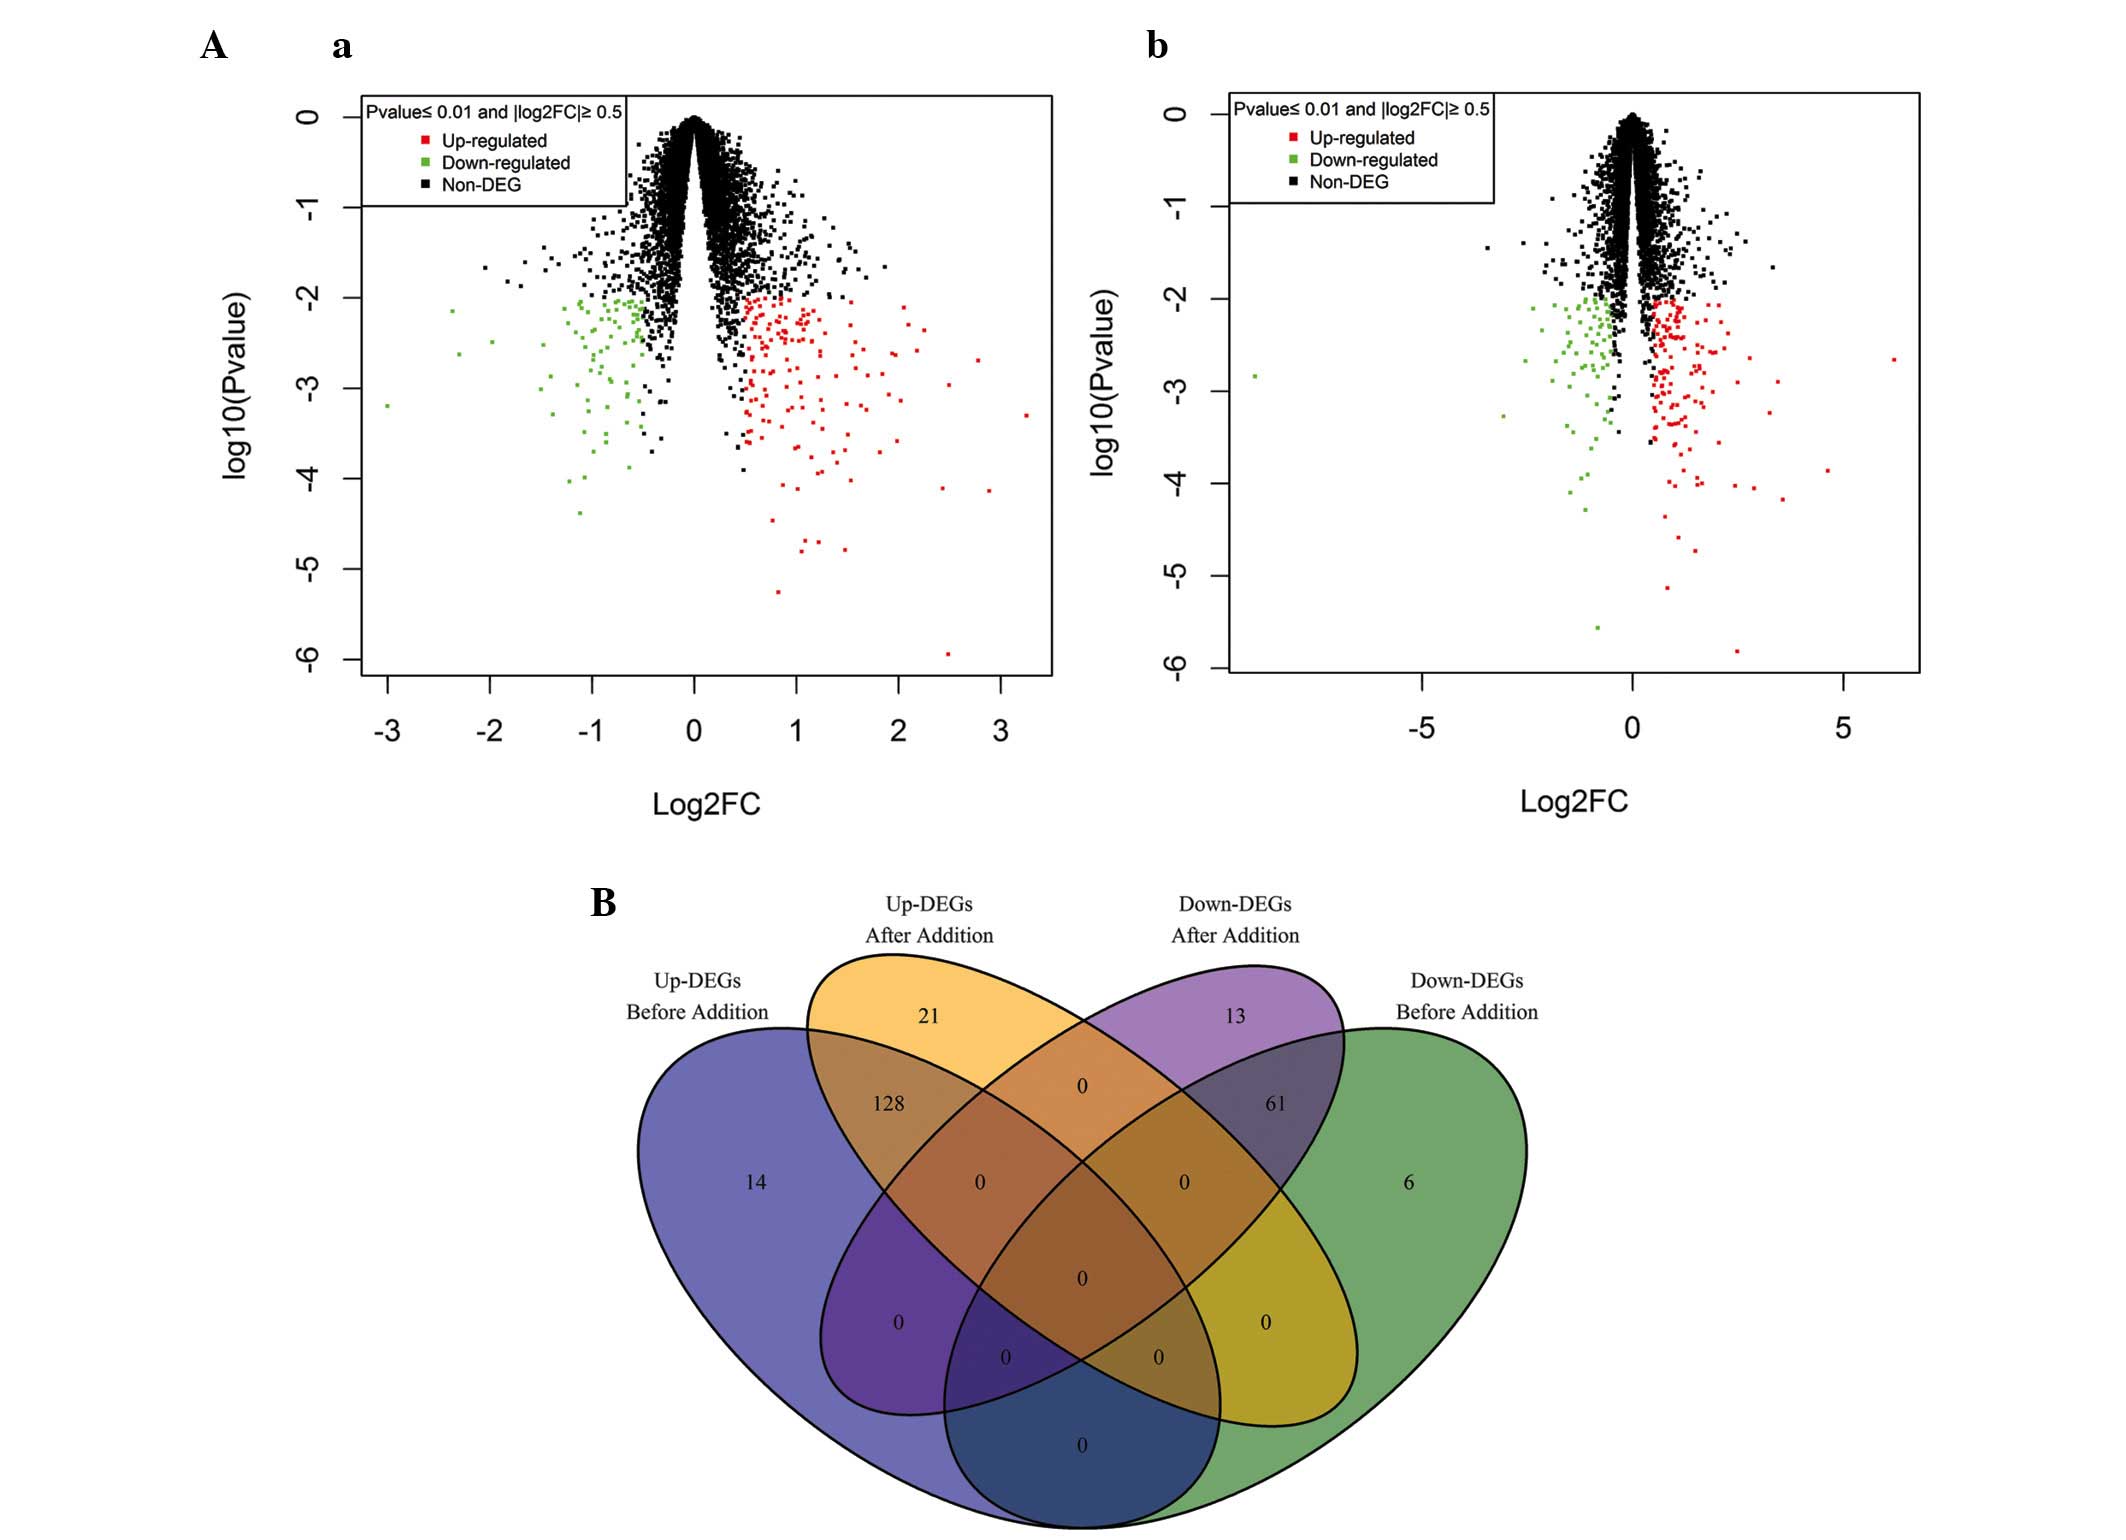
significant DEGs. Scatter diagrams of pre- and post-summation data
demonstrated that no significant difference existed in the number
of DEGs (Fig. 1A). Excluding the
repeated genes, the common DEGs pre- and post-summation of probe
value were revealed using Venn analysis (Fig. 1B). A total of 128 common
upregulated genes and 61 downregulated genes were identified. No
genes contradicted each other in the four categories.
Enrichment analysis of the DEGs
To determine the functions of DEGs in glaucoma, the
189 common DEGs were mapped to the GO database. GO terms in
biological process (BP), including response to wounding, regulation
of cell proliferation and vasculature development; terms in
cellular component (CC), including extracellular region part,
extracellular region and cytoplasmic membrane-bounded vesicle
lumen; and terms in molecular function (MF), including calcium ion
binding, carbohydrate binding and calmodulin binding, were enriched
(Table II).
| Table IITop five significantly enriched GO
terms of the differentially expressed genes. |
Table II
Top five significantly enriched GO
terms of the differentially expressed genes.
| Category | Term | Count | P-value | Fold
enrichment | FDR |
|---|
| BP | GO:0009611~response
to wounding | 27 | 5.08E-09 | 3.893572 | 8.59E-06 |
| BP |
GO:0042127~regulation of cell
proliferation | 33 | 7.11E-09 | 3.20479 | 1.20E-05 |
| BP |
GO:0001944~vasculature development | 16 | 9.78E-07 | 4.871992 | 1.65E-03 |
| BP |
GO:0006954~inflammatory response | 18 | 1.16E-06 | 4.233012 | 1.96E-03 |
| BP | GO:0007167~enzyme
linked receptor protein signaling pathway | 17 | 1.01E-05 | 3.799121 | 1.70E-02 |
| CC |
GO:0044421~extracellular region part | 31 | 2.19E-06 | 2.579701 | 2.84E-03 |
| CC |
GO:0005576~extracellular region | 44 | 1.71E-04 | 1.748781 | 2.22E-01 |
| CC |
GO:0060205~cytoplasmic membrane-bounded
vesicle lumen | 6 | 2.05E-04 | 10.89375 | 2.66E-01 |
| CC | GO:0031983~vesicle
lumen | 6 | 2.54E-04 | 10.42011 | 3.29E-01 |
| CC |
GO:0005615~extracellular space | 21 | 3.24E-04 | 2.449106 | 4.20E-01 |
| MF | GO:0005509~calcium
ion binding | 24 | 1.58E-03 | 2.018187 | 2.207535 |
| MF |
GO:0030246~carbohydrate binding | 13 | 2.09E-03 | 2.837957 | 2.902738 |
| MF |
GO:0005516~calmodulin binding | 8 | 2.21E-03 | 4.415986 | 3.064494 |
| MF |
GO:0005539~glycosaminoglycan binding | 8 | 2.21E-03 | 4.415986 | 3.064494 |
| MF | GO:0003779~actin
binding | 12 | 3.29E-03 | 2.844654 | 4.545023 |
In order to further investigate changes to the
biological pathways in glaucoma cells, the significant pathways
associated with the DEGs were identified. The five pathways
identified with significant P-values are listed in Table III. The most significant
enrichment pathways were complement and coagulation cascades,
arrhythmogenic right ventricular cardiomyopathy and ECM-receptor
interaction.
| Table IIITop five significantly enriched KEGG
pathways of differentially expressed genes. |
Table III
Top five significantly enriched KEGG
pathways of differentially expressed genes.
| KEGG term | Count | P-value | Fold
enrichment | FDR |
|---|
| hsa04610:Complement
and coagulation cascades | 10 | 2.96E-06 | 8.010397 | 3.38E-03 |
|
hsa05412:Arrhythmogenic right ventricular
cardiomyopathy | 8 | 3.73E-04 | 5.818078 | 4.26E-01 |
|
hsa04512:Extracellular matrix-receptor
interaction | 8 | 6.89E-04 | 5.263975 | 7.83E-01 |
| hsa05200:Pathways
in cancer | 15 | 1.86E-03 | 2.527671 | 2.101618 |
| hsa04510:Focal
adhesion | 11 | 2.92E-03 | 3.024822 | 3.283705 |
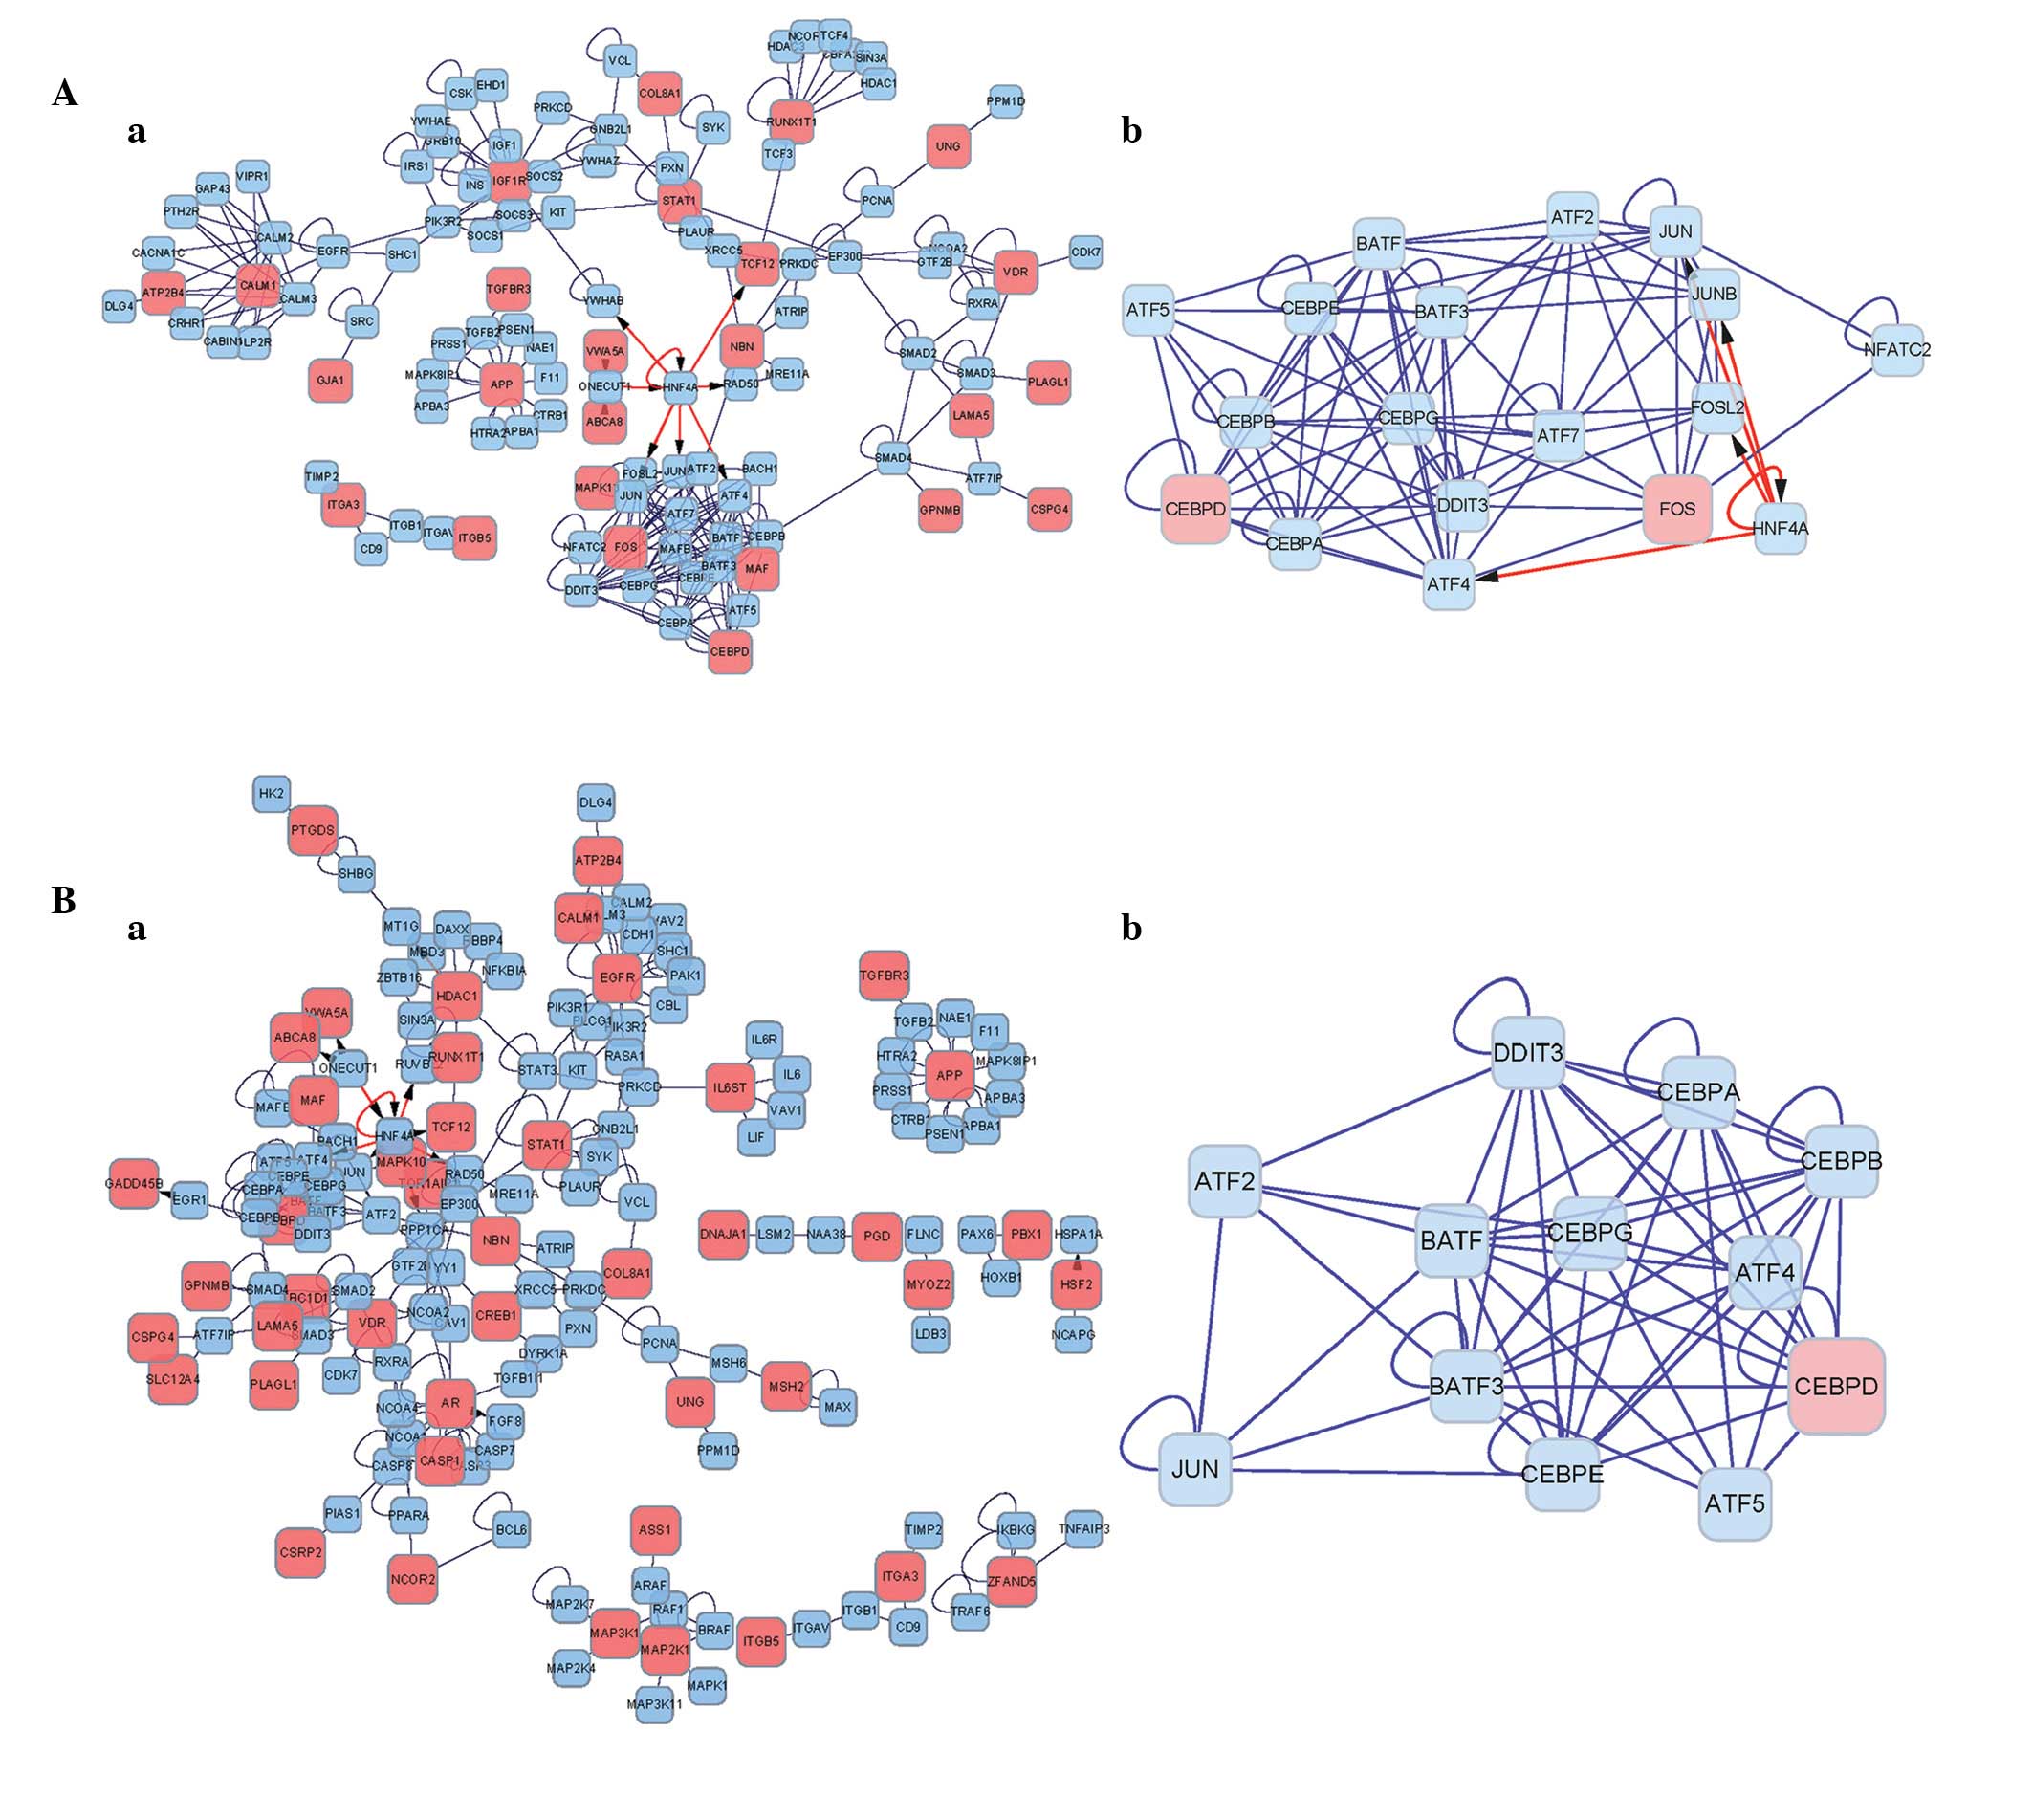
Interactive network analysis
The DEGs were mapped to the BIND database and
significant interactions were screened with a confidence
coefficient >0.7. By integrating these associations, interaction
networks of the DEGs were constructed. In the networks of DEGs
prior to summation (Fig. 2Aa),
HNF4A was connected with multiple modules. The protein in
the network serves as a node, and the degree of a node denotes the
number of proteins interacting with the specific node, which is
indicated by the lines between them. The 'hub nodes' were defined
as the nodes which had high degrees within the network. The
IGF1R, RUNX1T1 and STAT1 DEGs were identified
as hub nodes. Following cluster analysis using ClusterONE, a module
containing FOS and CEBPD DEGs, and non-DEGs belonging
to the HNF4A and CEBP families, were obtained
(Fig. 2Ab). The module contained a
total of 18 nodes, with a module density of 0.542, quality of 0.874
and P-value of 2.222E-7.
The networks of the post-summation DEGs are shown in
Fig. 2Ba and b. HNF4A was
connected with multiple modules, and the HDAC1 and
EGFR DEGs were identified as the hub nodes. Following
cluster analysis, a module of 12 nodes, with a density of 0.758,
quality of 0.847 and P-value of 1.765E-5 was obtained, including
one DEG (CEBPD) (Fig.
2Bb).
Functional annotation analysis of
modules
Functional annotation analysis of the modules
available in ClusterONE was performed. A total of 37 and 31 GO
terms were enriched in the two modules of the pre- and
post-summation networks, respectively. The top three BP, CC and MF
enriched functions are listed in Table IV. The enriched genes were
predominantly involved in the progress of gene transcription and
expression.
| Table IVTop three function enrichment terms
of genes in the interaction network of differentially expressed
genes. |
Table IV
Top three function enrichment terms
of genes in the interaction network of differentially expressed
genes.
| Category | Term | Count | P-value |
Fold-enrichment | FDR |
|---|
| Pre-summation | | | | | |
| BP |
GO:0006355~regulation of transcription,
DNA-dependent | 18 | 9.29E-16 | 7.630006 | 1.24E-12 |
| BP |
GO:0051252~regulation of RNA metabolic
process | 18 | 1.36E-15 | 7.461666 | 1.87E-12 |
| BP |
GO:0045449~regulation of
transcription | 18 | 6.43E-13 | 5.201077 | 8.98E-10 |
| CC | GO:0031981~nuclear
lumen | 11 | 1.83E-08 | 7.458992 | 1.46E-05 |
| CC |
GO:0070013~intracellular organelle
lumen | 11 | 1.35E-07 | 6.079561 | 1.08E-04 |
| CC |
GO:0043233~organelle lumen | 11 | 1.68E-07 | 5.942604 | 1.35E-04 |
| MF |
GO:0043565~sequence-specific DNA
binding | 18 | 1.96E-23 | 21.3888 | 1.89E-20 |
| MF | GO:0046983~protein
dimerization activity | 17 | 1.12E-21 | 22.6231 | 1.08E-18 |
| MF |
GO:0003700~transcription factor
activity | 18 | 6.75E-20 | 13.3159 | 6.50E-17 |
| Post-summation | | | | | |
| BP |
GO:0006355~regulation of transcription,
DNA-dependent | 12 | 1.91E-10 | 7.630006 | 2.53E-07 |
| BP |
GO:0051252~regulation of RNA metabolic
process | 12 | 2.44E-10 | 7.461666 | 3.23E-07 |
| BP |
GO:0006350~transcription | 12 | 1.24E-09 | 6.438839 | 1.64E-06 |
| CC | GO:0031981~nuclear
lumen | 7 | 1.33E-05 | 7.713276 | 1.06E-02 |
| CC |
GO:0070013~intracellular organelle
lumen | 7 | 4.45E-05 | 6.286818 | 3.53E-02 |
| CC |
GO:0043233~organelle lumen | 7 | 5.09E-05 | 6.145192 | 4.03E-02 |
| MF | GO:0046983~protein
dimerization activity | 12 | 6.09E-16 | 23.95387 | 5.00E-13 |
| MF |
GO:0043565~sequence-specific DNA
binding | 12 | 2.14E-15 | 21.3888 | 1.88E-12 |
| MF |
GO:0003700~transcription factor
activity | 12 | 4.07E-13 | 13.3159 | 3.63E-10 |
Discussion
Among the selected DEGs, MYH11 was
significantly downregulated pre- and post-summation. Notably, the
four probes of MYH11 were all among the 10 most
significantly downregulated genes. Accordingly, the different
transcripts of MHY11 may be involved in the development of
glaucoma. In addition, FGF7, ADH1B, CLU,
ARR1C3, SEPP1 and PDE1A were all significantly
upregulated DEGs pre- and post-summation. Although a number of
these have been reported to be involved in Alzheimer's disease or
different types of cancer (38–43),
there is little information regarding the systematic mechanism
underlying the effect of these genes in glaucoma (44). Therefore, the functions of these
genes require further investigation. The minimal difference between
the pre- and post-summation DEGs, and the absence of contradiction
between the upregulated and downregulated genes indicated the
analysis used in the present study was reliable.
In the present study, GO functional annotation of
the DEGs assisted in identifying associated genes involved in
different biological progresses. In the BP term, functions
associated with cell division and structure were enriched; in the
CC term, functions associated with plasma lumen and vesicles were
enriched; and in the MF term, the functions were predominantly
involved in calcium signal transduction. These results reflected
that the structures of the cell vesicles and microtubules were
markedly altered in glaucoma, which was in accordance with the
results of a previous study (4).
DEGs were found to be enriched in the hsa04512: ECM-receptor
interaction KEGG pathway, the genes of which have been reported to
be closely associated with glaucoma (45).
In the interaction network analysis of the DEGs,
HNF4A was associated with multiple modules, indicating that
this gene was important in regulating the expression of numerous
genes and connecting various pathways. HNF4A has been
reported to be associated with the pancreas and liver (46). A mutation in the HNF-4A gene
has been reported to result in monogenic diabetes, of which
glaucoma is a common complication (47). Therefore, further analysis of the
association between HNF4A and glaucoma is required. In
addition, the roles of CEBPD, a member of CEBP
family, in the network confirmed the reliability of GO enrichment
analysis, as GO:0042127: regulation of cell proliferation was
significantly altered. It has been reported that the binding of the
CCAAT enhancer to the CEBPD transcription factor
regulates the cell cycle (48) and
its expression may inhibit the proliferation of tumor cells
(49). In addition, cell
proliferation, rather than astrocyte hypertrophy, characterizes
early pressure-induced optic nerve head injury, leading to glaucoma
(50). These findings suggested
the possibility of identifying how the CEBPD transcription
factor assists in the inhibition of cell proliferation in
glaucoma.
In conclusion, the present study identified DEGs
using bioinformatics analysis and observed that CEBP family genes,
in particular, CEBPD, may be important in the progression of
glaucoma. Genes associated with the ECM were also suggested to be
important. However, further experiments are required to confirm the
results of the present study. Due to the increasing public
availability of genomic data, similar approaches are likely to
become more popular as a basis for future investigations.
References
|
1
|
Quigley HA and Broman AT: The number of
people with glaucoma worldwide in 2010 and 2020. Br J Ophthalmol.
90:262–267. 2006. View Article : Google Scholar : PubMed/NCBI
|
|
2
|
Tham YC, Li X, Wong TY, Quigley HA, Aung T
and Cheng CY: Global prevalence of glaucoma and projections of
glaucoma burden through 2040: A systematic review and
meta-analysis. Ophthalmology. 121:2081–2090. 2014. View Article : Google Scholar : PubMed/NCBI
|
|
3
|
Caprioli J and Coleman AL: Intraocular
pressure fluctuation a risk factor for visual field progression at
low intraocular pressures in the advanced glaucoma intervention
study. Opthalmology. 115:1123–1129. 2008. View Article : Google Scholar
|
|
4
|
Rudzinski MN, Chen L and Hernandez MR:
Antiangiogenic characteristics of astrocytes from optic nerve heads
with primary open-angle glaucoma. Arch Ophthalmol. 126:679–685.
2008. View Article : Google Scholar : PubMed/NCBI
|
|
5
|
Quigley HA: Neuronal death in glaucoma.
Prog Retin Eye Res. 18:39–57. 1999. View Article : Google Scholar : PubMed/NCBI
|
|
6
|
Hernandez MR: The optic nerve head in
glaucoma: Role of astrocytes in tissue remodeling. Prog Retin Eye
Res. 19:297–321. 2000. View Article : Google Scholar : PubMed/NCBI
|
|
7
|
Varela HJ and Hernandez MR: Astrocyte
responses in human optic nerve head with primary open-angle
glaucoma. J Glaucoma. 6:303–313. 1997. View Article : Google Scholar : PubMed/NCBI
|
|
8
|
Liu B, Chen H, Johns TG and Neufeld AH:
Epidermal growth factor receptor activation: An upstream signal for
transition of quiescent astrocytes into reactive astrocytes after
neural injury. J Neurosci. 26:7532–7540. 2006. View Article : Google Scholar : PubMed/NCBI
|
|
9
|
Fingert JH: Primary open-angle glaucoma
genes. Eye (Lond). 25:587–595. 2011. View Article : Google Scholar
|
|
10
|
Horsley MB and Kahook MY: Anti-VEGF
therapy for glaucoma. Curr Opin Ophthalmol. 21:112–117. 2010.
View Article : Google Scholar
|
|
11
|
Miller JW: Vascular endothelial growth
factor and ocular neovascularization. Am J Pathol. 151:13–23.
1997.PubMed/NCBI
|
|
12
|
Shima DT, Adamis AP, Ferrara N, et al:
Hypoxic induction of endothelial cell growth factors in retinal
cells: Identification and characterization of vascular endothelial
growth factor (VEGF) as the mitogen. Mol Med. 1:182–193.
1995.PubMed/NCBI
|
|
13
|
Ramazanoglu M, Lutz R, Ergun C, von
Wilmowsky C, Nkenke E and Schlegel KA: The effect of combined
delivery of recombinant human bone morphogenetic protein-2 and
recombinant human vascular endothelial growth factor 165 from
biomimetic calcium-phosphate-coated implants on osseointegration.
Clin Oral Implants Res. 22:1433–1439. 2011. View Article : Google Scholar : PubMed/NCBI
|
|
14
|
Binder DR, Herring IP, Zimmerman KL,
Pickett JP and Huckle WR: Expression of vascular endothelial growth
factor receptor-1 and-2 in normal and diseased canine eyes. Vet
Ophthalmol. 15:223–230. 2012. View Article : Google Scholar
|
|
15
|
Chatterjee S, Wang Y, Duncan MK and Naik
UP: Junctional adhesion molecule-A regulates vascular endothelial
growth factor receptor-2 signaling-dependent mouse corneal wound
healing. PloS One. 8:e636742013. View Article : Google Scholar : PubMed/NCBI
|
|
16
|
Vithana EN, Aung T, Khor CC, et al:
Collagen-related genes influence the glaucoma risk factor, central
corneal thickness. Hum Mol Genet. 20:649–658. 2011. View Article : Google Scholar
|
|
17
|
Desronvil T, Logan-Wyatt D, Abradou W, et
al: Distribution of COL8A2 and COL8A1 gene variants in Caucasian
primary open angle glaucoma patients with thin central corneal
thickness. Mol Vis. 16:2185–2191. 2010.PubMed/NCBI
|
|
18
|
Huang W, Fan Q, Wang W, Zhou M, Laties AM
and Zhang X: Collagen: A potential factor involved in the
pathogenesis of glaucoma. Med Sci Monit Basic Res. 19:237–240.
2013. View Article : Google Scholar : PubMed/NCBI
|
|
19
|
Liu X, Brandt CR, Rasmussen CA and Kaufman
PL: Glaucoma gene therapy. Expert Rev Ophthalmol. 2:227–236. 2007.
View Article : Google Scholar
|
|
20
|
Bettahi I, Sun H, Gao N, et al:
Genome-wide transcriptional analysis of differentially expressed
genes in diabetic, healing corneal epithelial cells:
Hyperglycemia-suppressed TGFβ3 expression contributes to the delay
of epithelial wound healing in diabetic corneas. Diabetes.
63:715–727. 2014. View Article : Google Scholar :
|
|
21
|
Pieragostino D, Bucci S, Agnifili L, et
al: Differential protein expression in tears of patients with
primary open angle and pseudoexfoliative glaucoma. Mol Biosyst.
8:1017–1028. 2012. View Article : Google Scholar
|
|
22
|
Colak D, Morales J, Bosley TM, et al:
Genome-wide expression profiling of patients with primary open
angle glaucoma. Invest Ophthalmol Vis Sci. 53:5899–5904. 2012.
View Article : Google Scholar : PubMed/NCBI
|
|
23
|
Liao Q, Sun X, Guo H and Li C: Exploring
the potential mechanism and screening small molecule drugs for
glaucoma by using bioinformatics approach. Eur Rev Med Pharmacol
Sci. 18:132–140. 2014.PubMed/NCBI
|
|
24
|
Shi WY, Liu KD, Xu SG, et al: Gene
expression analysis of lung cancer. Eur Rev Med Pharmacol Sci.
18:217–228. 2014.PubMed/NCBI
|
|
25
|
Liu T, Xie L, Ye J and He X: Family-based
analysis identified CD2 as a susceptibility gene for primary open
angle glaucoma in Chinese Han population. J Cell Mol Med.
18:600–609. 2014. View Article : Google Scholar : PubMed/NCBI
|
|
26
|
Hernandez MR, Agapova OA, Yang P,
Salvador-Silva M, Ricard CS and Aoi S: Differential gene expression
in astrocytes from human normal and glaucomatous optic nerve head
analyzed by cDNA microarray. Glia. 38:45–64. 2002. View Article : Google Scholar : PubMed/NCBI
|
|
27
|
Kompass KS, Agapova OA, Li W, Kaufman PL,
Rasmussen CA and Hernandez MR: Bioinformatic and statistical
analysis of the optic nerve head in a primate model of ocular
hypertension. BMC Neurosci. 9:932008. View Article : Google Scholar : PubMed/NCBI
|
|
28
|
Edgar R, Domrachev M and Lash AE: Gene
Expression Omnibus: NCBI gene expression and hybridization array
data repository. Nucleic Acids Res. 30:207–210. 2002. View Article : Google Scholar :
|
|
29
|
Chang-Zheng L, Xue-Hai M, Jin Z, et al:
Posterior indirect-decompression technique versus posterior direct
vision decompression for thoracolumbar burst fractures. Journal of
Clinical Rehabilitative Tissue Engineering Research. 15:2011.
|
|
30
|
Troyanskaya O, Cantor M, Sherlock G, et
al: Missing value estimation methods for DNA microarrays.
Bioinformatics. 17:520–525. 2001. View Article : Google Scholar : PubMed/NCBI
|
|
31
|
Fujita A, Sato JR, Rodrigues Lde O,
Ferreira CE and Sogayar MC: Evaluating different methods of
microarray data normalization. BMC Bioinformatics. 7:4692006.
View Article : Google Scholar : PubMed/NCBI
|
|
32
|
Smyth GK: Limma: Linear models for
microarray data. Bioinformatics and Computational Biology Solutions
Using R and Bioconductor. Gentleman R, Carey V, Huber W, Irizarry R
and Dudoit S: Springer; New York: pp. 397–420. 2005, View Article : Google Scholar
|
|
33
|
Zheng Q and Wang XJ: GOEAST: A web-based
software toolkit for Gene Ontology enrichment analysis. Nucleic
Acids Res. 36(Web Server Issue): W358–W363. 2008. View Article : Google Scholar : PubMed/NCBI
|
|
34
|
Huang da W, Sherman BT and Lempicki RA:
Bioinformatics enrichment tools: Paths toward the comprehensive
functional analysis of large gene lists. Nucleic Acids Res.
37:1–13. 2009. View Article : Google Scholar :
|
|
35
|
Huang da W, Sherman BT and Lempicki RA:
Systematic and integrative analysis of large gene lists using DAVID
bioinformatics resources. Nat Protoc. 4:44–57. 2008. View Article : Google Scholar
|
|
36
|
Kanehisa M and Goto S: KEGG: Kyoto
encyclopedia of genes and genomes. Nucleic Acids Res. 28:27–30.
2000. View Article : Google Scholar
|
|
37
|
Bader GD, Betel D and Hogue CW: BIND: The
biomolecular interaction network database. Nucleic Acids Res.
31:248–250. 2003. View Article : Google Scholar : PubMed/NCBI
|
|
38
|
Lee CH, Lee JM, Wu DC, et al:
Carcinogenetic impact of ADH1B and ALDH2 genes on squamous cell
carcinoma risk of the esophagus with regard to the consumption of
alcohol, tobacco and betel quid. Int J Cancer. 122:1347–1356. 2008.
View Article : Google Scholar
|
|
39
|
Yasuhara T, Okamoto A, Kitagawa T, et al:
FGF7-like gene is associated with pericentric inversion of
chromosome 9 and FGF7 is involved in the development of ovarian
cancer. Int J Oncol. 26:1209–1216. 2005.PubMed/NCBI
|
|
40
|
Yu JT, Li L, Zhu QX, et al: Implication of
CLU gene polymorphisms in Chinese patients with Alzheimer's
disease. Clin Chim Acta. 411:1516–1519. 2010. View Article : Google Scholar : PubMed/NCBI
|
|
41
|
Schlott T, Eiffert H, Bohne W, et al:
Chlamydia trachomatis modulates expression of tumor suppressor gene
caveolin-1 and oncogene C-myc in the transformation zone of
non-neoplastic cervical tissue. Gynecol Oncol. 98:409–419. 2005.
View Article : Google Scholar : PubMed/NCBI
|
|
42
|
Méplan C, Hughes DJ, Pardini B, et al:
Genetic variants in selenoprotein genes increase risk of colorectal
cancer. Carcinogenesis. 31:1074–1079. 2010. View Article : Google Scholar : PubMed/NCBI
|
|
43
|
Abusnina A, Keravis T, Yougbaré I, Bronner
C and Lugnier C: Anti-proliferative effect of curcumin on melanoma
cells is mediated by PDE1A inhibition that regulates the epigenetic
integrator UHRF1. Mol Nutr Food Res. 55:1677–1689. 2011. View Article : Google Scholar : PubMed/NCBI
|
|
44
|
Mansberger SL, MacKenzie PJ and Falardeau
J: Optic disc cupping associated with neurosyphilis. J Glaucoma.
22:80–83. 2013. View Article : Google Scholar
|
|
45
|
Kirwan RP, Wordinger RJ, Clark AF and
O'Brien CJ: Differential global and extra-cellular matrix focused
gene expression patterns between normal and glaucomatous human
lamina cribrosa cells. Mol Vis. 15:76–88. 2009.PubMed/NCBI
|
|
46
|
Odom DT, Zizlsperger N, Gordon DB, et al:
Control of pancreas and liver gene expression by HNF transcription
factors. Science. 303:1378–1381. 2004. View Article : Google Scholar : PubMed/NCBI
|
|
47
|
Edghill EL and Hattersley AT: Genetic
disorders of the pancreatic beta cell and diabetes (permanent
neonatal diabetes and maturity-onset diabetes of the young).
Pancreatic Beta Cell in Health and Disease. Seino S and Bell GI:
Springer; Japan, Tokyo, Japan: pp. 399–430. 2008, View Article : Google Scholar
|
|
48
|
Ramji DP and Foka P:
CCAAT/enhancer-binding proteins: Structure, function and
regulation. Biochem J. 365:561–575. 2002. View Article : Google Scholar : PubMed/NCBI
|
|
49
|
Johnson PF: Molecular stop signs:
Regulation of cell-cycle arrest by C/EBP transcription factors. J
Cell Sci. 118:2545–2555. 2005. View Article : Google Scholar : PubMed/NCBI
|
|
50
|
Johnson EC, Doser TA, Cepurna WO, et al:
Cell proliferation and interleukin-6-type cytokine signaling are
implicated by gene expression responses in early optic nerve head
injury in rat glaucoma. Invest Ophthalmol Vis Sci. 52:504–518.
2011. View Article : Google Scholar :
|