Introduction
Chronic hepatitis B virus (HBV) infection is one of
the most life threatening diseases affecting humans, which may lead
to hepatic cirrhosis, hepatocellular carcinoma (HCC) or even
mortality. It is estimated that of the 6,000,000,000 individuals
worldwide, 2,000,000,000 are infected with HBV and 350,000,000
individuals suffer from chronic HBV infection. The mortality rate
of HBV resulting from hepatic failure, cirrhosis or primary HCC is
1,000,000/year (1). The mortality
rate of hepatic cirrhosis in China is estimated to be 9.5/100,000.
Therefore, earlier diagnosis and sustained follow up of the
progression of hepatic fibrosis is key for the effective
improvement of the prognosis of those with chronic HBV
infection.
MicroRNA (miRNA) is endogenous small single-stranded
non-coding RNA of between 18 and 24 nucleotides in length. miRNA
controls the expression levels of target genes at the
post-transcriptional level by degrading target mRNA or suppressing
mRNA translation following its specific binding to target mRNA
(2). It has been demonstrated that
miRNA is also involved in the development of fibrosis of the lung
and kidney (3,4). It has been reported that variable
expression levels of miRNA are observed in patients with chronic
hepatic injury, with changes in the relevant expression levels of
miRNA accelerating the development and progression of fibrosis
(4,5). The present study aimed to examine the
plasma miRNA biomarkers associated with fibrosis in patients with
chronic HBV infection using Agilent miRNA microarray scanning.
Patients and methods
Clinical cohort establishment
A total of 50 patients were recruited in the
clinical cohort between October 2012 and October 2013 through
multi-center cooperation (Shanghai First People's Hospital and
Shanghai Ruijin Hospital). The cohort comprised male and female
(17:8) patients with a mean age of 41 years. The patient inclusion
criteria was a diagnosis of chronic HBV infection or a sustained
positive result in hepatitis Be antigen (HBsAg) and/or HBV DNA
tests subsequent to a six month medical history of positive HBsAg.
Diagnosis was made according to the Guideline of Prevention and
Treatment of Chronic HBV Infection (6). The exclusion criteria included: HIV
or hepatitis C infection, alcohol assumption of >30 g/day,
hepatic injury due to metabolism or other causes, history of
treatment for hepatic diseases or a liver biopsy not suitable for
analysis. Fasting venous blood was collected from each patient in
the morning 1 week prior to liver biopsy. Whole blood and
biochemical assessment, HBV quantification and HBV DNA
quantification were also performed, and the plasma samples were
stored at −80°C. All patients with chronic HBV infection underwent
a liver biopsy followed by pathological analysis, and the degree of
hepatic fibrosis was determined according to Scheuer's Criteria
(S0, no liver fibrosis; S1, expansion of portal fibrotic area; S2,
fibrosis observed in and around portal area, may have formed
fibrous septum; S3, clear fibrosis and hepatic lobule structure
disorder but no cirrhosis; S4, early cirrhosis) (7). The present study was approved by the
ethics committee of The First People's Hospital Affiliated to
Shanghai Jiao-Tong University (Shanghai, China). Written informed
consent was provided by the patients prior to the collection of
samples.
Collection and storage of plasma
samples
A total of 2 ml peripheral blood was collected from
each patient and was transferred into EDTA anticoagulation tubes.
Following collection, the following procedure was performed either
within 1 h at room temperature or 2 h in a 4°C environment: The
samples were centrifuged at 820 × g for 10 min, following which 1
ml supernatant was collected and transferred into 1.5 ml centrifuge
tubes. The samples were centrifuged again at 16,000 × g for 10 min
and the supernatant was carefully collected and transferred into
centrifuge tubes, which were then stored at −80°C.
RNA extraction of plasma
RNA extraction was performed using an mirVana PARIS
kit (Agilent Technologies, Inc., Santa Clara, CA, USA), according
to the manufacturer's instructions. The quality of the extracted
RNA was subsequently confirmed using electrophoresis and was deemed
suitable for use if 2100 RNA integrity number 6.0 and 28S/18S≥0.7.
An Agilent miRNA microarray kit (Agilent Technologies, Inc.) was
then used for fluorescent labeling of the miRNA from the suitable
RNA samples.
Microarray hybridization and
scanning
The miRNA conjugated with the fluorescent label were
applied to the microarray following probe denaturation with
dimethyl sulfoxide. The microarray was incubated in a hybridization
oven at 55°C with 20 rpm agitation for 20 h. Following
hybridization, the microarray was washed and scanned using an
Agilent Microarray Scanner (Agilent Technologies, Inc.).
Analysis of miRNA microarray data
Screening of the different miRNAs was performed by
applying the digital gene expression differential method, described
by Audic et al (8) to the
analysis. The genes defined as differentially expressed were those
with a false discovery rate (FDR) ≤0.05 and fold change ≥2. Based
on the expression status in the different groups, those miRNAs with
expression levels exhibiting linear correlation with grouping were
screened.
Cluster analysis
MeV software, version 4.7.4 (http://www.tm4.org/mev.html) was applied to the
cluster analysis of the different miRNAs. Strata cluster, a method
of non-monitoring cluster analysis, was used to achieve the
clustering of the different miRNAs and groups of samples, enabling
the detection of the differential effects of miRNA in the different
groups.
Trend analysis
Log standardization of different miRNAs was
performed to facilitate trend analysis. The mean value of miRNA
expression was calculated in the S0–S4 groups. The base 1 logarithm
of the mean value from S1–S4 - the logarithm of the mean value of
S0 was applied to a plot graph, which demonstrated the trend of
miRNA change in the different groups.
Gene ontology (GO) analysis
In order to detect the target genes of those miRNAs
with different expression levels and to evaluate their function, GO
annotation was applied to the target gene, according to the GO
database (http://www.geneontology.org/). The GO values involved
with these genes were determined and the Fisher exact test and
χ2 test were used to determine the significance level
and error rate of each GO value to enable screening of the
significant GO terms reflected by the target gene. P<0.01 was
considered to indicate a statistically significant difference.
Pathway analysis
In order to determine the cell pathways affected by
the target gene with differential miRNA expression, a Fisher exact
test and χ2 square test were used to determine the
significance of the pathways, which the target gene is involved in,
based on the Kyoto Encyclopedia of Genes and Genomes (KEGG)
database. P<0.05 was considered to indicate a statistically
significant difference.
Statistical analysis
Feature Extraction software 10.7 (Agilent
Technologies, Inc.) was used to determine the expression data from
the microarray, based on the plasma sample. Data normalization was
performed using Quantile (9). The
data are expressed as the mean ± standard deviation. Statistical
analysis was performed using SPSS 18.0 (IBM SPSS, Chicago, IL,
USA). Group comparison was performed using an independent samples
t-test. P<0.05 was considered to indicate a statistically
significant difference.
Results
Establishment of the clinical cohort
The clinical cohort of miRNA was established using
male and female (17:8) patients with the mean age of 41 years. All
subjects received a percutaneous liver biopsy followed by
pathological diagnosis to determine the staging of fibrosis,
according to Scheuer's criteria. The subjects were then divided
into five groups, depending on the staging of fibrosis (S0–S4).
Detailed clinical data of the patients are presented in Table I.
 | Table IClinical data of 50 patients with HBV
infection and hepatic fibrosis. |
Table I
Clinical data of 50 patients with HBV
infection and hepatic fibrosis.
| Index | S0 (n=10) | S1 (n=10) | S2 (n=10) | S3 (n=10) | S4 (n=10) |
|---|
| Male (%) | 80 | 70 | 80 | 70 | 60 |
| Age (years) | 38.6±9.1 | 40.9±12.3 | 40.1±9.6 | 37.7±5.7 | 49.2±8.6 |
| ALT (U/l) | 35.7±17.4 | 38.5±16.3 | 60.8±19.5 | 52.4±21.8 | 48.2±24.1 |
| AST (U/l) | 30.9±10.6 | 31±7.3 | 60.3±62.3 | 37±9.2 | 50.1±32.7 |
| GGT (U/l) | 35.3±36.1 | 18.7±7.0 | 52.3±47.1 | 38.7±19.4 | 29.4±24.1 |
| AKP (U/l) | 74.6±32.7 | 63.3±19.3 | 70±29.9 | 67.9±15.1 | 74±22.5 |
| TBil
(µmol/l) | 14.8±3.2 | 19.89±8.2 | 21.44±9.9 | 14.02±3.0 | 17.42±9.2 |
| DBil
(µmol/l) | 2.5±0.5 | 3.3±1.3 | 6.6±9.2 | 1.9±1.0 | 2.92±2.9 |
| TP (g/l) | 71±4.9 | 69±6.1 | 74±4.1 | 72±4.4 | 71±5.7 |
| Alb (g/l) | 43.4±1.9 | 43.7±3.0 | 42.5±3.7 | 42±2.3 | 42.7±4.5 |
| HBV-DNA
(IU/ml) |
1.71×10⁷±3.19×10⁷ |
1.22×10⁸±2.37×10⁸ |
3.99×10⁶±5.74×10⁶ |
7.51×10⁶±1.57×10⁶ |
4.05×10⁶±8.42×10⁶ |
| HBeAg + (%) | 40 | 70 | 90 | 70 | 50 |
miRNA microarray analysis
Agilent miRNA bio-microarray scanner and extraction
software were used for analysis of the miRNA microarray. An
inter-group t-test was performed to screen the different miRNAs.
The results revealed that there werere 140 miRNAs with >2-fold
change in the S1–S4 groups, compared with the S0 group. Compared
with the SO group, the number of miRNAs differentially expressed in
the the S1 group was 48 (28 upregulated; 20 downregulated); In the
S2 group, the number of miRNAs differentially expressed, compared
with the S0 group was 97 (49 upregulated; 48 downregulated), with
five upregulated >5 fold and four downregulated to ≤20%. In the
S3 group, the number of miRNAs differentially expressed, compared
with the S0 group, was 84 (57 upregulated and 27 downregulated),
with six upregulated >10 fold. In the S4 group, the number of
miRNAs differentially expressed, compared with the S0 group, was 56
(40 upregulated and 16 downregulated). In total, 12 miRNAs were
differentially expressed in all stages (10 upregulated; 2
downregulated), as shown in Table
II. The miRNAs, which were upregulated >5 fold, compared
with the S0 group, were hsa-miR-4651 and
hsa-miR-4695-5p, and those downregulated >5 fold,
compared with the S0 group, were hsa-miR-486-3p and
hsa-miR-497-5p, (P<0.05).
| Table IIMicroRNAs exhibiting differential
expression levels in the S1–S4 groups compared with the S0 group
(fold change and expression trend). |
Table II
MicroRNAs exhibiting differential
expression levels in the S1–S4 groups compared with the S0 group
(fold change and expression trend).
| MicroRNA | Fold change
| P-value | Trend of
expression |
|---|
| S1/S0 | S2/S0 | S3/S0 | S4/S0 |
|---|
|
hsa-miR-2861 | 2.37 | 2.60 | 2.48 | 3.12 | 0.0004 | Upregulation |
|
hsa-miR-345-3p | 2.62 | 2.62 | 2.47 | 2.19 | 0.0053 | Upregulation |
|
hsa-miR-3620-3p | 4.60 | 8.09 | 8.09 | 3.76 | 0.0013 | Upregulation |
|
hsa-miR-3656 | 2.22 | 2.19 | 2.23 | 2.22 | 0.0018 | Upregulation |
|
hsa-miR-371a-5p | 3.55 | 4.10 | 4.02 | 2.41 | 0.0057 | Upregulation |
|
hsa-miR-4646-5p | 3.15 | 2.96 | 4.47 | 2.21 | 0.0052 | Upregulation |
|
hsa-miR-4651 | 5.13 | 7.78 | 7.26 | 4.39 | 0.0025 | Upregulation |
|
hsa-miR-4695-5p | 5.20 | 9.01 | 9.81 | 6.77 | 0.0016 | Upregulation |
|
hsa-miR-4800-5p | 2.63 | 2.58 | 3.69 | 2.34 | 0.0044 | Upregulation |
|
hsa-miR-638 | 2.42 | 2.59 | 2.65 | 2.88 | 0.0016 | Upregulation |
|
hsa-miR-497-5p | 0.23 | 0.23 | 0.21 | 0.35 | 0.0058 | Upregulation |
|
hsa-miR-486-3p | 0.23 | 0.14 | 0.37 | 0.45 | 0.0043 | Upregulation |
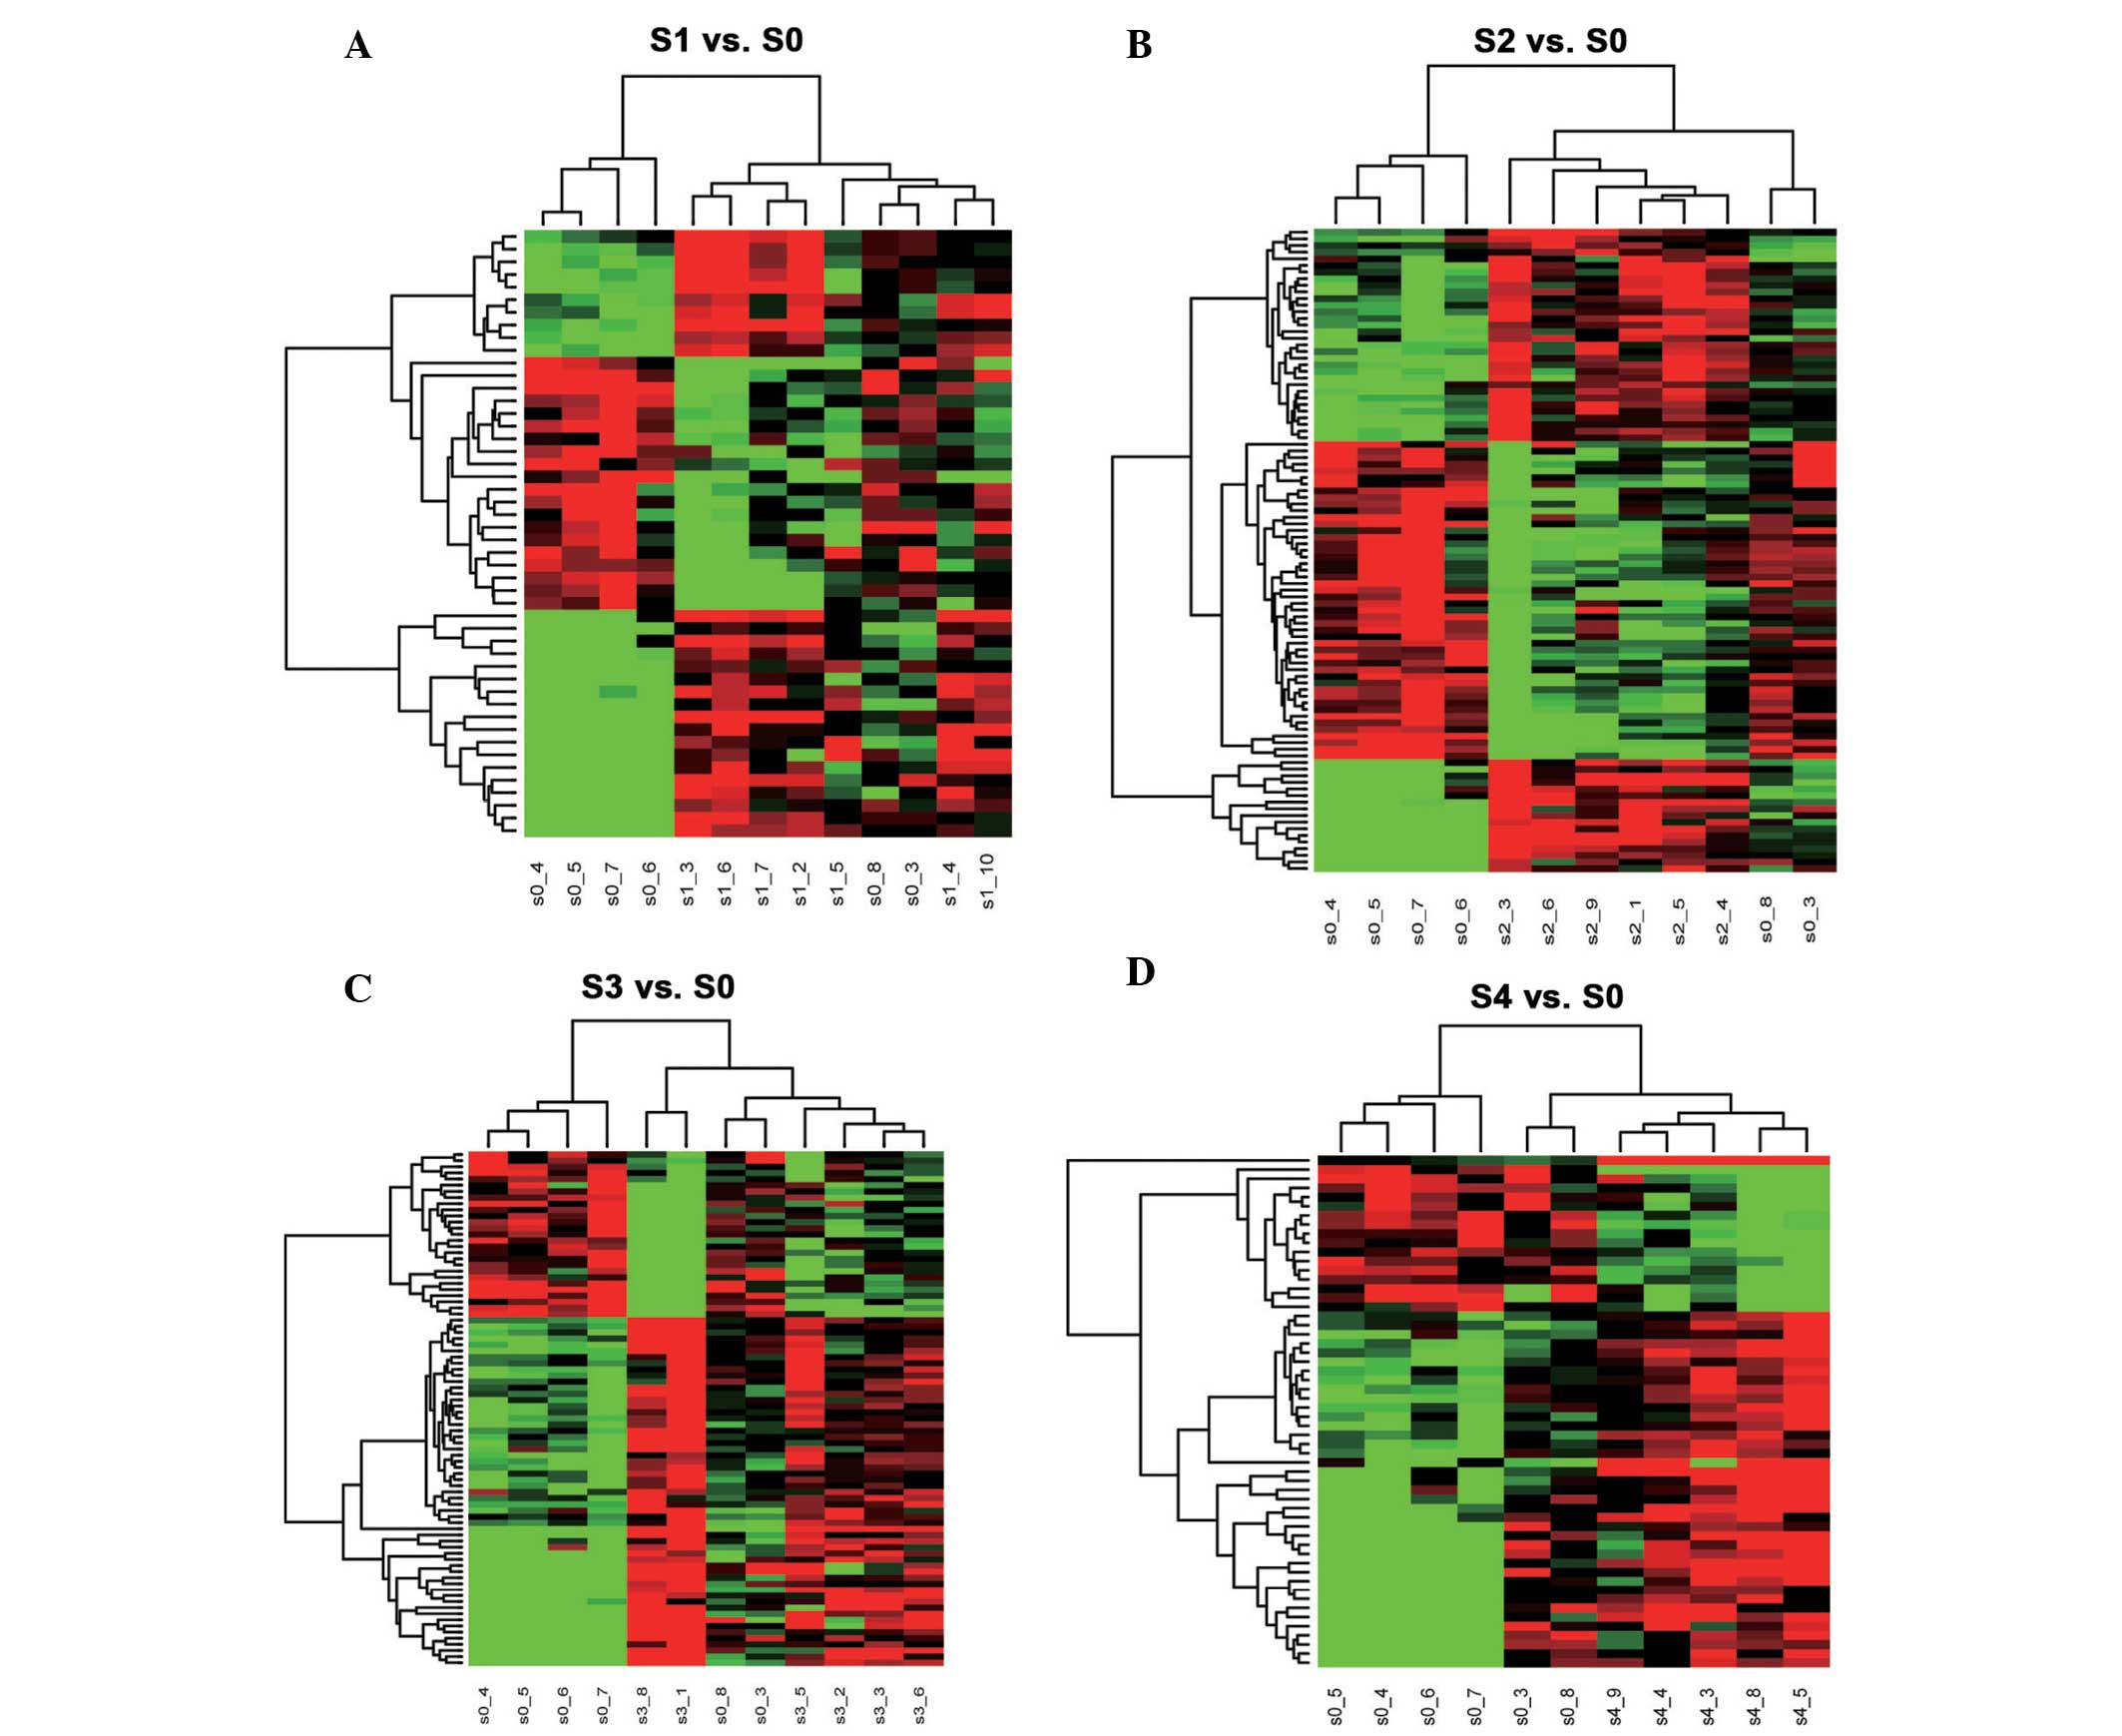
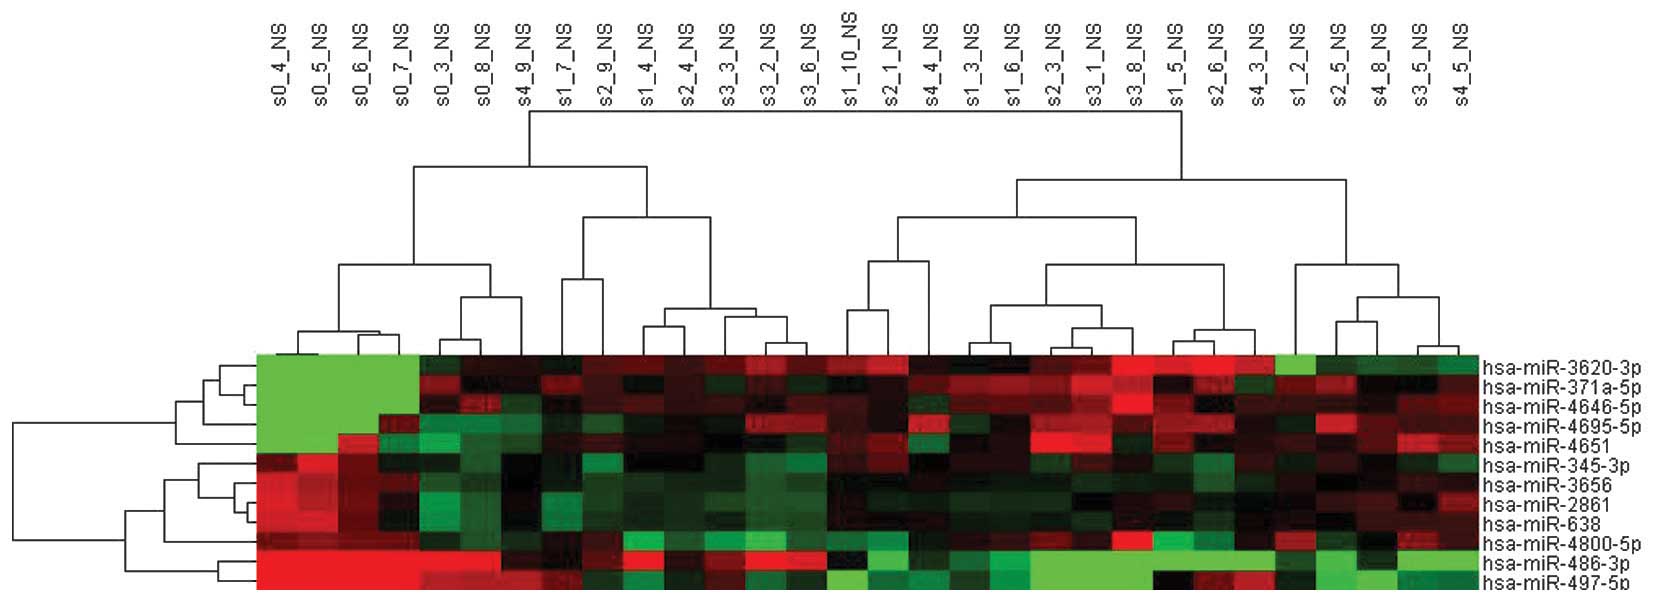
Cluster analysis
Surveillance-based cluster analysis was performed
using the method of Euclidean Distance to analyze the miRNAs with
different expression levels in terms of hepatic fibrosis. A
hierarchical cluster graph of the miRNAs with different expression
levels and fibrosis grouping revealed the characteristics of the
expression levels of miRNA in different Scheuer stages. The plasma
samples with lower levels of fibrosis, according to Scheuer's
criteria, were concentrated to the left of the graph. The plasma
samples with higher levels of fibrosis, according to Scheuer's
criteria, were concentrated to the right of the graph. As shown in
Figs. 1 and 2, the intensity of miRNA expression is
highlighted in green (lower level of expression) and red (higher
level of expression).
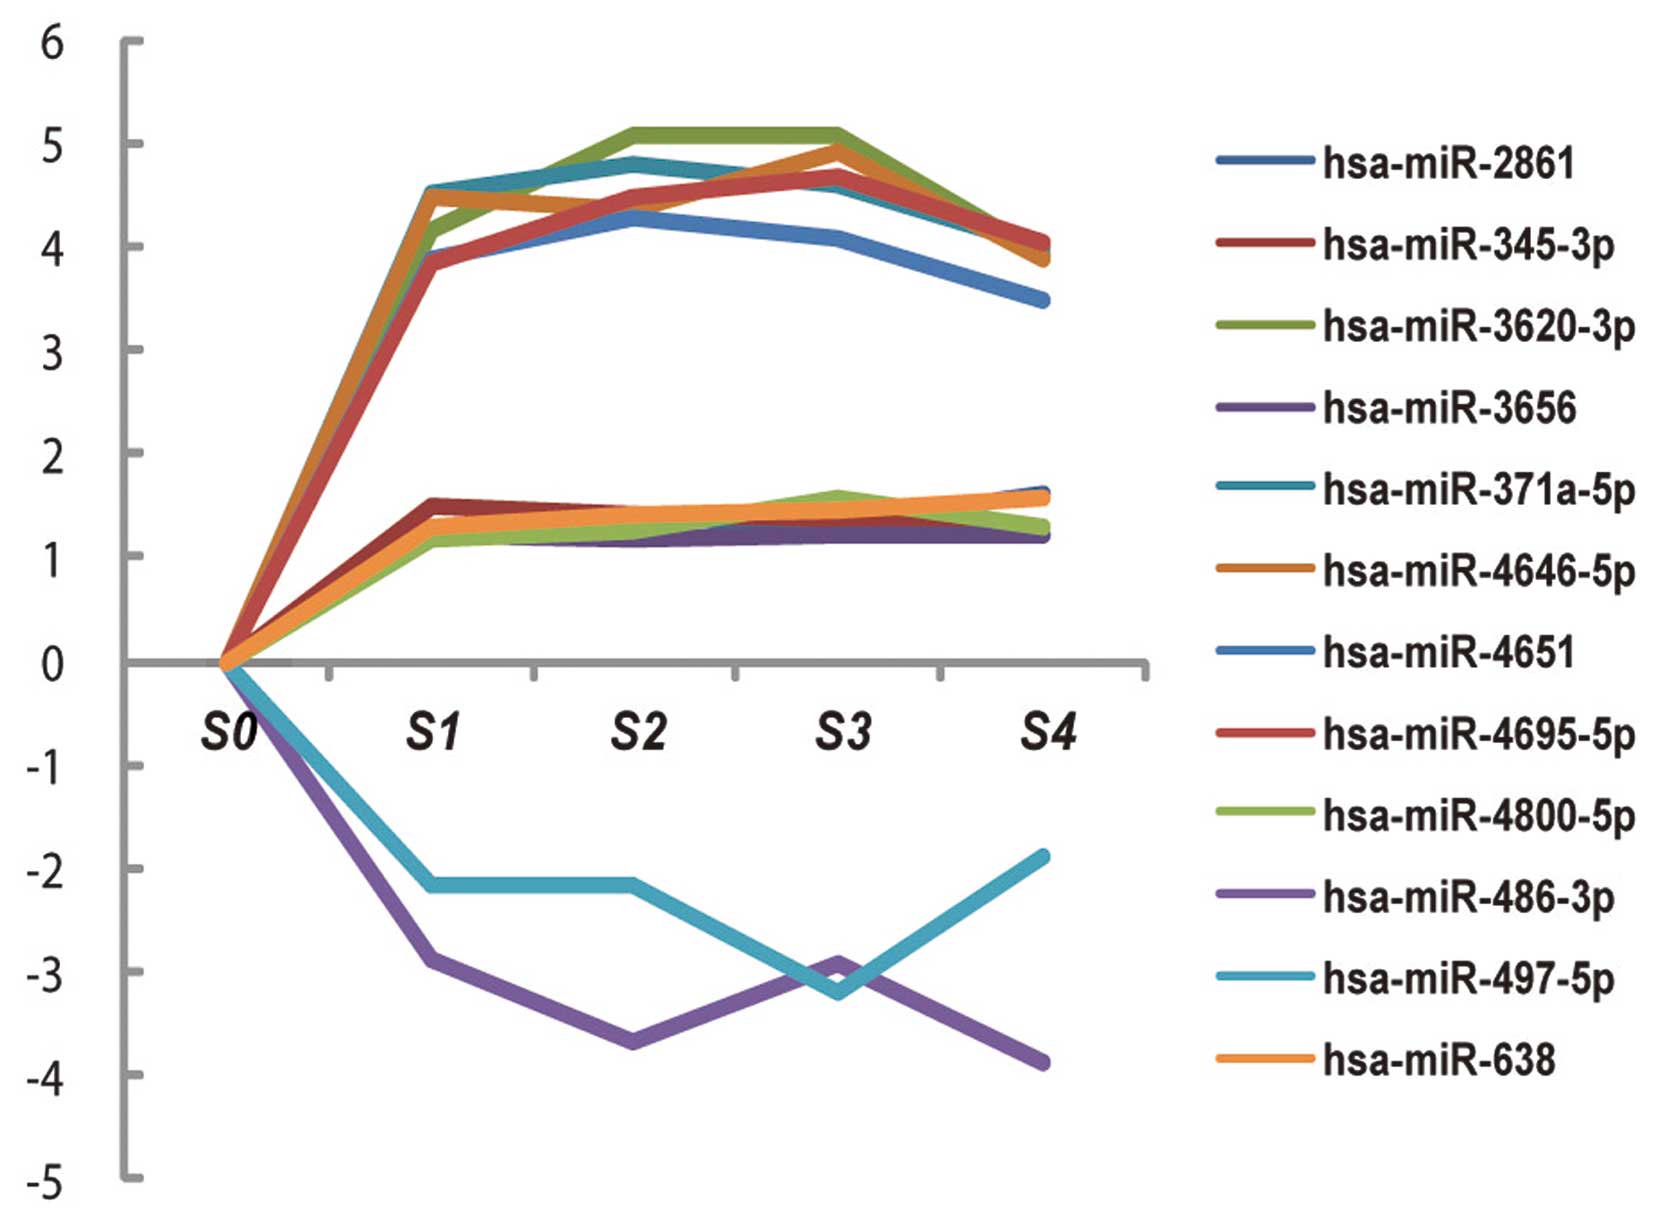
Trend analysis
Log standardization was applied to the different
miRNAs to eliminate the effect from varied baseline values and to
facilitate trend display in the different groups (Fig. 3). This demonstrated that
hsa-miR-4695-5p, hsa-miR-486-3p and
hsa-miR-497-5p were suitable for use as markers to
differentiate between the different stages of hepatic fibrosis due
to HBV infection.
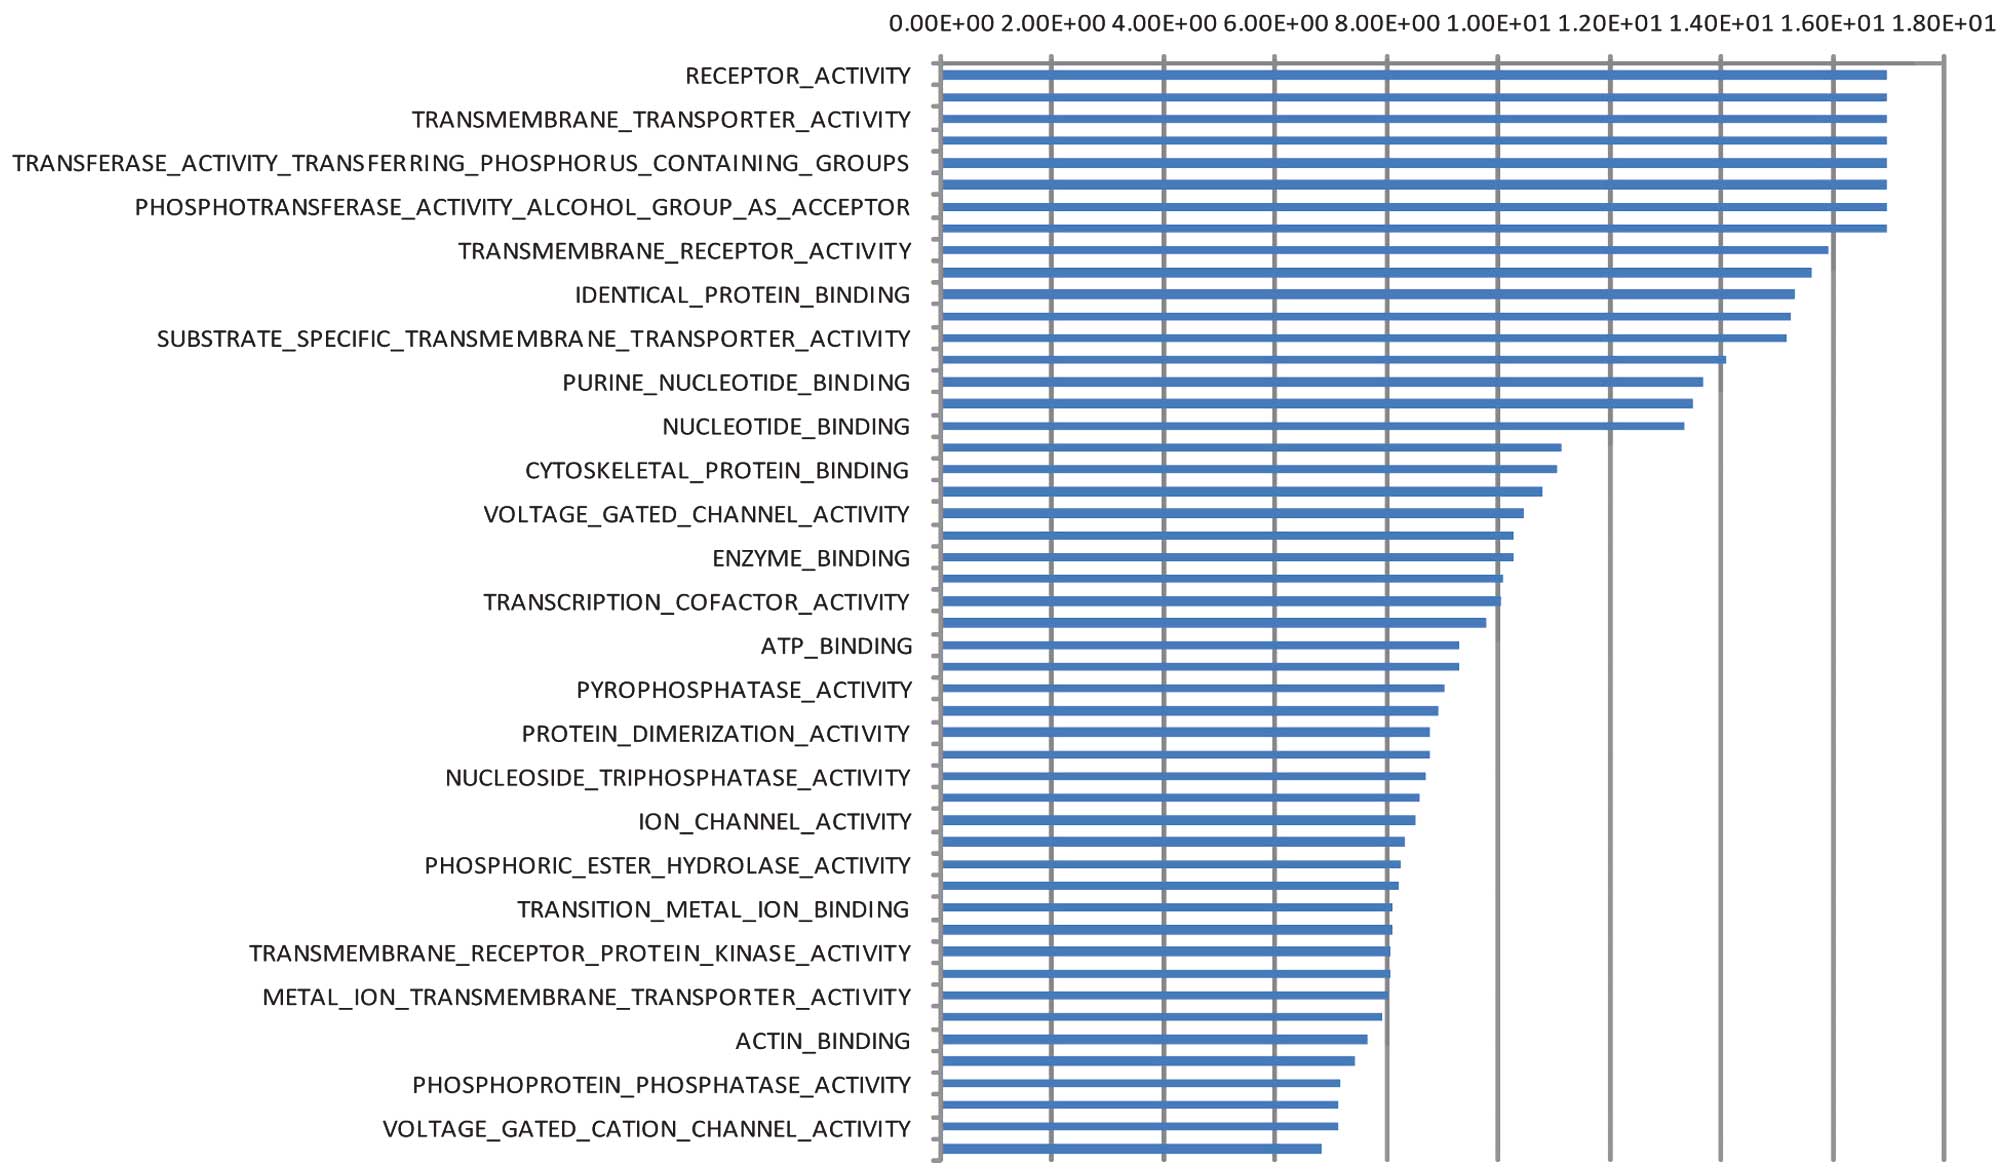
GO functional analysis revealed that the biological
processes, with which the differentially expressed target gene was
markedly involved included biopolymers, signal transduction,
protein metabolism and lipid metabolism. The biological processes
identified to have significant involvement of the differentially
expressed target gene included molecule functional activation,
transmembrane transport, phosphotransferase activity upgrade,
binding with protein, purine nucleotide metabolism upgrade,
peptidase activation, oxidoreductase activation, binding with
L-amino acid peptidase and cytokine activation (Fig. 4).
Pathway significance concentration analysis revealed
that the differentially expressed genes were involved in 100
significant signal transduction pathways, including TGF-β/Smad,
Wnt, MAPK, Jak/STAT and VEGF, which have a significant impact on
hepatic fibrosis (Table III)
(10–13).
| Table IIITop 15 channels identified as
involved with target genes exhibiting differentially expressed mRNA
patients with hepatitis B virus infection and hepatic fibrosis. |
Table III
Top 15 channels identified as
involved with target genes exhibiting differentially expressed mRNA
patients with hepatitis B virus infection and hepatic fibrosis.
| Category | Signaling
pathway | Target genes
involved (n) | P-value | False discovery
rate |
|---|
| PDGF | MAPK | 56 |
1.00−18 | 0.00 |
| PI/3K | |
2.08−06 |
2.33−05 |
| PI3K/p85 | 6 |
1.40−04 |
6.26−04 |
| Erk1/Erk2 Mapk | 14 |
4.59−11 |
1.15−09 |
| Jak-STAT | 31 |
4.02−10 |
8.53−09 |
| Ras | 7 |
1.74−04 |
7.16−04 |
| Rho | Rho | 12 |
6.30−08 |
7.70−07 |
| TGF-β | TGF-β/Smad | 19 |
1.83−07 |
2.00−06 |
| mTOR | mTOR | 15 |
8.37−08 |
9.92−07 |
| AKT/mTOR | 8 |
5.94−06 |
4.20−05 |
| Blood vessel
regeneration | VEGF | 16 |
3.29−06 |
2.60−05 |
| VEGF, anoxia,
angiogenesis | 9 |
1.72−05 |
1.05−04 |
| Wnt | Wnt | 40 |
1.00−18 | 0.00 |
| Integrin | Integrin | 9 |
1.79−04 |
7.27−04 |
| Toll-like
receptor | Toll-like
receptor | 16 |
1.48−04 |
6.49−04 |
Discussion
Hepatic fibrosis is one of the common
characteristics of chronic liver disease. Early diagnosis and
sustained follow-up of the progression of hepatic fibrosis is
essential in terms of preventing hepatic cirrhosis and end-stage
hepatic disease, which result from chronic liver diseases. The
follow up of the chronic progression of hepatic diseases by routine
liver biopsy and histological assessment are associated with
multiple limitations, including patient compliance, risks
associated with the intervention, varied biopsy technique,
inconsistency between 'inner-observer' and 'inter-observer', false
negatives, and inconvenience in sustained assessment and follow up
(14). Non-invasive diagnosis
indices or predictive models for hepatic fibrosis, including the
Forns index (15), Fibrotest
(16) and APRI index, are all
established based on chronic hepatitis C and alcoholic liver
diseases. A non-invasive predictive model, which is specific for
chronic HBV infection and hepatic fibrosis has not yet been
developed.
miRNA is small non-coding RNA, comprising 21–25
nucleotides. miRNA controls the expression of target genes at the
post-transcriptional level by binding to the non-coding region of
the target gene (17). A previous
study reported that one single miRNA can bind with hundreds of
target mRNAs with varied functions, resulting in its modulation of
mRNA (18). miRNA is involved in
almost all pathological and physical activities in mammals,
therefore, it is closely correlated with the development and
progression of various diseases (19). It is now understood that there is
an almost equal quantity of miRNA in human serum and plasma, which
is termed circulative miRNA (20).
This type of endogenous micromolecule non-coding RNA with
modulation activity is characterized by high stability when
combined with proteins in the serum and plasma, providing the
possibility of evaluating circulative miRNA as biomarker. These
miRNAs are not degraded by endogenous or exogenous
ribonucleotidases in the blood and, are refractory to high or low
temperatures, high pH, repetitive freeze thawing or extreme acid
and base environments (21). In
addition, the expression of the miRNA remains consistent among
healthy individuals, without significant individual differences,
while disease significantly affects the expression levels of
circulative miRNA (20,22), leading to favorable repeatability
and comparability. Different diseases are associated with different
miRNA expression profiles, indicating that circulative miRNA can be
used as an effective non-invasive diagnostic parameter and ideal
marker in the blood for disease diagnosis.
It has been demonstrated that the expression levels
of miR-141 in the serum can be used to diagnose advanced stage
prostate cancer. In addition, differential expression levels of
circulative miRNA have also been observed in patients with
gastrointestinal cancer, including esophageal cancer, gastric
cancer, hepatic cancer and large intestine cancer (20,23–25).
A previous study on the miRNA expression levels in the serum of
patients with chronic HBV infection by Zhang et al (26) demonstrated that miRNA-122
can be used as marker of hepatic tissue injury, with favorable
sensitivity and specificity. Xu et al (27) demonstrated that the serum levels of
miR-21, miR-122 and miR-223 are increased in
patients with chronic HBV infection and in patients with
hepatocarcinoma, therefore, they may be regarded as specific
markers of hepatic injury, although they are not specific for
hepatocarcinoma.
In the present study, a mathematical multiple
analytical method was applied to variation analysis. miRNAs, which
have a ratio between 0.5 and 2.0 are not considered indicative of
significant differences in expression levels, while a ratio beyond
0.5–2.0 is regarded as a significant change in expression.
Therefore, the present study screened for miRNAs with upregulated
or downregulated expression levels with a fold change >2 and FDR
<0.05 in patients with hepatic fibrosis (S1–4/S0), and for
miRNAs exhibiting consistent expression in the S1–4 patients. The
results demonstrated that those miRNAs exhibiting a trend of
consistent expression were predominantly upregulated. Upregulated
target genes are involved in signal transduction pathways,
including JAK/STAT, MAPK and p53, while target genes with
downregulated miRNAs are predominantly involved in fatty acid
metabolism and intracellular protein transportation-associated
pathways (28).
Among the 12 miRNAs identified with significant
changes in expression levels, preliminary understanding of the
effects of hsa-miR-345-3p, hsa-miR-371a-5p,
hsa-miR-486-3p, hsa-miR-497-5p and
hsa-miR-2861 have been previously obtained. Shiu et
al (29) revealed that
hsa-miR-345-3p facilitates the progression of
hepatocarcinoma by negatively regulating p21waf1/Cip1 in
cancer cells. Li et al (30) demonstrated that
hsa-miR-371a-5p promotes the progression of nasopharyngeal
carcinoma by its positive regulation of the TGF-β pathway. Other
previous studies (31,32) have reported that
hsa-miR-2861 exerts negative modulation on chordoma and
basalioma through the mitogen-activated protein kinase pathway. The
present study observed upregulated expression levels of
hsa-miR-345-3p, hsa-miR-371a-5p and
hsa-miR-2861 with the development of hepatic fibrosis,
however, the detailed mechanism remains to be elucidated. Kanda
et al (33) demonstrated
that the expression of hsa-miR-486-3p in hepatic tissue is
upregulated in mice with obstructive jaundice resulting from bile
duct ligation, while its expression in hepatocarcinoma is
downregulated (34). Another
previous study (35) revealed that
hsa-miR-486-3p exerts a positive regulatory effect on glioma
via the nuclear factor-κB signaling pathway. The present study
demonstrated a trend of downregulation of hsa-miR-486-3p
with the progression of hepatic fibrosis, however, its clinical
relevance remains to be elucidated. Furuta et al (36) reported that hsa-miR-497-5p
exerts a negative regulatory effect on hepatocarcinoma by
inhibiting the G1-S of cancer cells. Another previous study
(37) demonstrated that
hsa-miR-497-5p inhibits the proliferation, migration and
invasion of colon cancer cells by negatively regulating IGF-1.
Yadav et al (38)
demonstrated that hsa-miR-497-5p is associated with
apoptosis, resulting from the effect this has on the BCL family. In
the present study, downregulation of hsa-miR-497-5p was
observed in all stages of hepatic fibrosis, with a maximum fold
change of 10. The detailed mechanism remains to be elucidated.
The present study had several limitations. Although
the changes in the plasma miRNA expression levels was based on the
screening of samples from patients with hepatic fibrosis due to HBV
infection, whether it is specific to hepatic fibrosis due to HBV
infection remains to be elucidated. Further investigations are
required to exclude other confounding factors. In addition, hepatic
fibrosis staging is the only categorization factor used in the
present study, and the effects of inflammation and qualification of
viral load on the results have not been excluded.
In the present study, a set of miRNAs, potentially
correlating with the development of hepatic fibrosis due to HBV
infection, were identified based on gene microarray screening, may
be used as a potential diagnostic marker to differentiate patients
with chronic HBV infection and hepatic fibrosis at different
stages. Since miRNA is relatively stable and readily obtainable
from serum/plasma, this method provides a novel non-invasive option
for the diagnosis of chronic HBV infection with hepatic fibrosis
and for the staging of this condition. Future investigations aim to
screen miRNAs that may be correlated with the staging of hepatic
fibrosis due to HBV infection and confirming the correlation
between microarray results and hepatic fibrosis using methods,
including quantitative polymerase chain reaction. Further
investigations aim to expand on current knowledge regarding miRNA
in the developmental mechanism of hepatic fibrosis due to HBV
infection, and to identify novel serum molecular biological targets
for the diagnosis of hepatic fibrosis caused by HBV infection.
Acknowledgments
This study was supported by the Development Program
of China during the 11th and 12th Five-year Plan Period (grant.
nos. 2008ZX10002-006, 2012ZX10002007-001-040 and
2013ZX10002004-002-003), the Science and Technology Commission of
Shanghai Municipality (grant. nos. 10411955300 and 12DZ1941603) and
the Shanghai Municipal Health Bureau (grant,. no. XBR2011012).
Abbreviations:
|
HBV
|
hepatitis B virus
|
|
HCC
|
hepatocellular carcinoma
|
|
miRNA
|
microRNA
|
|
HCV
|
hepatitis C virus
|
|
HIV
|
human immunodeficiency virus
|
|
GO
|
gene ontology
|
|
EDTA
|
ethylene diamine tetraacetic acid
|
|
ALT
|
alanine minotransferase
|
|
AST
|
aspartate aminotransferase
|
|
GGT
|
γ glutamyl transpeptidase
|
|
AKP
|
alkline phosphatase
|
|
TBil
|
total bilirubin
|
|
DBil
|
direct bilirubin
|
|
TP
|
total protein
|
|
Alb
|
albumin
|
|
HBeAg
|
hepatitis Be antigen
|
|
FDR
|
error detection rate
|
References
|
1
|
Hou J, Liu Z and Gu F: Epidemiology and
prevention of hepatitis B virus infection. Int J Med Sci. 2:502005.
View Article : Google Scholar : PubMed/NCBI
|
|
2
|
Bartel DP: MicroRNAs: Genomics,
biogenesis, mechanism and function. Cell. 116:281–297. 2004.
View Article : Google Scholar : PubMed/NCBI
|
|
3
|
Vettori S, Gay S and Distler O: Role of
MicroRNAs in Fibrosis. Open Rheumatol J. 6:130–139. 2012.
View Article : Google Scholar : PubMed/NCBI
|
|
4
|
Ura S, Honda M, Yamashita T, Ueda T,
Takatori H, Nishino R, Sunakozaka H, Sakai Y, Horimoto K and Kaneko
S: Differential microRNA expression between hepatitis B and
hepatitis C leading disease progression to hepatocellular
carcinoma. Hepatology. 49:1098–1112. 2009. View Article : Google Scholar : PubMed/NCBI
|
|
5
|
Wang XW, Heegaard NH and Orum H: MicroRNAs
in liver disease. Gastroenterology. 142:1431–1443. 2012. View Article : Google Scholar : PubMed/NCBI
|
|
6
|
Chinese Society of Hepatology, Chinese
Medical Association; Chinese Society of Infectious Diseases,
Chinese Medical Association: The guidelines of prevention and
treatment for chronic hepatitis B. Chin J Hepatol. 13:881–891.
2005.In Chinese.
|
|
7
|
Scheuer PJ: The nomenclature of chronic
hepatitis: Time for a change. J Hepatol. 22:112–114. 1995.
View Article : Google Scholar : PubMed/NCBI
|
|
8
|
Audic S and Claverie JM: The significance
of digital gene expression profiles. Genome Res. 7:986–995.
1997.PubMed/NCBI
|
|
9
|
Mar JC, Kimura Y, Schroder K, Irvine KM,
Hayashizaki Y, Suzuki H, Hume D and Quackenbush J: Data-driven
normalization strategies for high-throughput quantitative RT-PCR.
BMC Bioinformatics. 10:1102009. View Article : Google Scholar : PubMed/NCBI
|
|
10
|
Park JH, Yoon J, Lee KY and Park B:
Effects of geniposide on hepatocytes undergoing
epithelial-mesenchymal transition in hepatic fibrosis by targeting
TGFβ/Smad and ERK-MAPK signaling pathways. Biochimie. 113:26–34.
2015. View Article : Google Scholar : PubMed/NCBI
|
|
11
|
Qu W, Huang H, Li K and Qin C:
Danshensu-mediated protective effect against hepatic fibrosis
induced by carbon tetrachloride in rats. Pathol Biol (Paris).
62:348–353. 2014. View Article : Google Scholar
|
|
12
|
Nakamura I, Zakharia K, Banini BA, Mikhail
DS, Kim TH, Yang JD, Moser CD, Shaleh HM, Thornburgh SR, Walters I
and Roberts LR: Brivanib attenuates hepatic fibrosis in vivo and
stellate cell activation in vitro by inhibition of FGF, VEGF and
PDGF signaling. PLoS One. 9:e922732014. View Article : Google Scholar : PubMed/NCBI
|
|
13
|
Li J, Li X, Xu W, Wang S, Hu Z, Zhang Q,
Deng X, Wang J, Zhang J and Guo C: Antifibrotic effects of luteolin
on hepatic stellate cells and liver fibrosis by targeting
AKT/mTOR/p70S6K and TGFβ/Smad signalling pathways. Liver Int.
35:1222–1233. 2015. View Article : Google Scholar
|
|
14
|
Zhou K and Lu LG: Assessment of fibrosis
in chronic liver diseases. J Dig Dis. 10:7–14. 2009. View Article : Google Scholar : PubMed/NCBI
|
|
15
|
Forns X, Ampurdanès S, Llovet JM, Aponte
J, Quintó L, Martínez-Bauer E, Bruguera M, Sánchez-Tapias JM and
Rodés J: Identification of chronic hepatitis C patients without
hepatic fibrosis by a simple predictive model. Hepatology.
36:986–992. 2002. View Article : Google Scholar : PubMed/NCBI
|
|
16
|
Imbert-Bismut F, Ratziu V, Pieroni L,
Charlotte F, Benhamou Y and Poynard T; MULTIVIRC Group: Biochemical
markers of liver fibrosis in patients with hepatitis C virus
infection: A prospective study. Lancet. 357:1069–1075. 2001.
View Article : Google Scholar : PubMed/NCBI
|
|
17
|
Song Y, Wang F, Huang Q, Cao Y, Zhao Y and
Yang C: MicroRNAs contribute to hepatocellular carcinoma. Mini Rev
Med Chem. 15:459–466. 2015. View Article : Google Scholar : PubMed/NCBI
|
|
18
|
Park K and Kim KB: miRTar Hunter: A
prediction system for identifying human microRNA target sites. Mol
Cells. 35:195–201. 2013. View Article : Google Scholar : PubMed/NCBI
|
|
19
|
Esquela-Kerscher A and Slack FJ:
Oncomirs-microRNAs with a role in cancer. Nat Rev Cancer.
6:259–269. 2006. View
Article : Google Scholar : PubMed/NCBI
|
|
20
|
Mitchell PS, Parkin RK, Kroh EM, Fritz BR,
Wyman SK, Pogosova-Agadjanyan EL, Peterson A, Noteboom J, O'Briant
KC, Allen A, et al: Circulating microRNAs as stable blood-based
markers for cancer detection. Proc Natl Acad Sci USA.
105:10513–10518. 2008. View Article : Google Scholar : PubMed/NCBI
|
|
21
|
Kim T and Reitmair A: Non-Coding RNAs:
Functional aspects and diagnostic utility in oncology. Int J Mol
Sci. 14:4934–4968. 2013. View Article : Google Scholar : PubMed/NCBI
|
|
22
|
Chen X, Ba Y, Ma L, Cai X, Yin Y, Wang K,
Guo J, Zhang Y, Chen J, Guo X, et al: Characterization of microRNAs
in serum: A novel class of biomarkers for diagnosis of cancer and
other diseases. Cell Res. 18:997–1006. 2008. View Article : Google Scholar : PubMed/NCBI
|
|
23
|
Zhang C, Wang C, Chen X, Yang C, Li K,
Wang J, Dai J, Hu Z, Zhou X, Chen L, et al: Expression profile of
microRNAs in serum: a fingerprint for esophageal squamous cell
carcinoma. Clin Chem. 56:1871–1879. 2010. View Article : Google Scholar : PubMed/NCBI
|
|
24
|
Liu R, Zhang C, Hu Z, Li G, Wang C, Yang
C, Huang D, Chen X, Zhang H, Zhuang R, et al: A five-microRNA
signature identified from genome-wide serum microRNA expression
profiling serves as a fingerprint for gastric cancer diagnosis. Eur
J Cancer. 47:784–791. 2011. View Article : Google Scholar
|
|
25
|
Ng EK, Chong WW, Jin H, Lam EK, Shin VY,
Yu J, Poon TC, Ng SS and Sung JJ: Differential expression of
microRNAs in plasma of patients with colorectal cancer: A potential
marker for colorectal cancer screening. Gut. 58:1375–1381. 2009.
View Article : Google Scholar : PubMed/NCBI
|
|
26
|
Zhang Y, Jia Y, Zheng R, Guo Y, Wang Y,
Guo H, Fei M and Sun S: Plasma microRNA-122 as a biomarker for
viral-, alcohol- and chemical-related hepatic diseases. Clin Chem.
56:1830–1838. 2010. View Article : Google Scholar : PubMed/NCBI
|
|
27
|
Xu J, Wu C, Che X, Wang L, Yu D, Zhang T,
Huang L, Li H, Tan W, Wang C, et al: Circulating MicroRNAs, miR-21,
miR-122 and miR-223, in patients with hepatocellular carcinoma or
chronic hepatitis. Mol Carcinog. 50:136–142. 2011. View Article : Google Scholar : PubMed/NCBI
|
|
28
|
Choo KB, Soon YL, Nguyen PN, Hiew MS and
Huang CJ: MicroRNA-5p and -3p co-expression and cross-targeting in
colon cancer cells. J Biomed Sci. 21:952014. View Article : Google Scholar : PubMed/NCBI
|
|
29
|
Shiu TY, Huang SM, Shih YL, Chu HC, Chang
WK and Hsieh TY: Hepatitis C virus core protein down-regulates
p21Waf1/Cip1 and inhibits curcumin-induced apoptosis through
microRNA-345 targeting in human hepatoma cells. PloS One.
8:e610892013. View Article : Google Scholar :
|
|
30
|
Li G, Qiu Y, Su Z, Ren S, Liu C, Tian Y
and Liu Y: Genome-wide analyses of radioresistance-associated miRNA
expression profile in nasopharyngeal carcinoma using next
generation deep sequencing. PLoS One. 8:e844862013. View Article : Google Scholar : PubMed/NCBI
|
|
31
|
Long C, Jiang L, Wei F, Ma C, Zhou H, Yang
S, Liu X and Liu Z: Integrated miRNA-mRNA analysis revealing the
potential roles of miRNAs in chordomas. PLoS One. 8:e666762013.
View Article : Google Scholar : PubMed/NCBI
|
|
32
|
Sand M, Skrygan M, Sand D, Georgas D, Hahn
SA, Gambichler T, Altmeyer P and Bechara FG: Expression of
microRNAs in basal cell carcinoma. Brit J Dermatol. 167:847–855.
2012. View Article : Google Scholar
|
|
33
|
Kanda T, Ishibashi O, Kawahigashi Y,
Mishima T, Kosuge T, Mizuguchi Y, Shimizu T, Arima Y, Yokomuro S,
Yoshida H, et al: Identification of obstructive jaundice-related
microRNAs in mouse liver. Hepatogastroenterology. 57:1013–1023.
2010.
|
|
34
|
Navon R, Wang H, Steinfeld I, Tsalenko A,
Ben-Dor A and Yakhini Z: Novel rank-based statistical methods
reveal microRNAs with differential expression in multiple cancer
types. PLoS One. 4:e80032009. View Article : Google Scholar : PubMed/NCBI
|
|
35
|
Song L, Lin C, Gong H, Wang C, Liu L, Wu
J, Tao S, Hu B, Cheng SY, Li M, et al: miR-486 sustains NF-kappaB
activity by disrupting multiple NF-kappaB-negative feedback loops.
Cell Res. 23:274–289. 2013. View Article : Google Scholar :
|
|
36
|
Furuta M, Kozaki K, Tanimoto K, Tanaka S,
Arii S, Shimamura T, Niida A, Miyano S and Inazawa J: The
tumor-suppressive miR-497-195 cluster targets multiple cell-cycle
regulators in hepatocellular carcinoma. PLoS One. 8:e601552013.
View Article : Google Scholar : PubMed/NCBI
|
|
37
|
Guo ST, Jiang CC, Wang GP, Li YP, Wang CY,
Guo XY, Yang RH, Feng Y, Wang FH, Tseng HY, et al: MicroRNA-497
targets insulin-like growth factor 1 receptor and has a tumour
suppressive role in human colorectal cancer. Oncogene.
32:1910–1920. 2013. View Article : Google Scholar :
|
|
38
|
Yadav S, Pandey A, Shukla A, Talwelkar SS,
Kumar A, Pant AB and Parmar D: miR-497 and miR-302b regulate
ethanol-induced neuronal cell death through BCL2 protein and cyclin
D2. J Biol Chem. 286:37347–37357. 2011. View Article : Google Scholar : PubMed/NCBI
|