Introduction
Melanosis coli (MC) is a condition, in which the
mucous membrane of the colon and rectum appear darker than usual,
with the depth of color varying between pale grey and brown or
black (1). Billiard first
described the occurrence of colonic mucosal hyperpigmentation in
1825, which Virchow termed melanosis coli in 1857. In 1928, Bartle
indicated that MC was associated with long time use of laxatives,
and subsequent studies investigated this association (2–4).
Investigations on animal models of melanosis have indicated that
anthraquinone laxatives, including aloe, senna and rhubarb cause MC
(5,6), however, their role in the etiology
and pathogenesis of MC remains to be elucidated.
Several hypotheses have been suggested to explain
the pigmentation of MC. The majority suggest that the formation of
pigment granules is associated with purgative-induced apoptosis of
colonic mucous membrane epithelial cells. The laxative effect of
anthranoid laxatives induces damage on the epithelial cells; which
causes alterations in absorption, secretion and motility. The
outcome is harmful to the cells in the lining of the intestine and
leads to apoptosis. These apoptotic cells are subsequently
phagocytized by adjacent macrophages, which form a substance that
appears as dark pigmentation granules (7). The distinctive pigmentation of the
bowel wall develops when a sufficient number of cells have been
damaged. It has also been suggested that improvements in standards
of living and lack of proper exercise contribute to decreases in
bowel movements and leads to chronic constipation. This, in turn,
leads to an increased quantity of protein-rich foods remaining in
the intestinal tract. The intestine absorbs the protein degradation
products and converts them into melanin or lipofuscin by
fermentation within the connective tissue cells. When melanin or
lipofuscin is phagocytized by macrophages in the lamina propria,
conditions are favorable for the development of MC (8,9).
Therefore, determination of whether there apoptotic cells are
present in the colonic mucosa of MC patients is required.
The pigment bodies in the intestine may be composed
of lipofuscin, melanin, hemosiderin or bile pigment, however, no
clear experimental evidence has confirmed the type of pigment
present in MC (10). Lipofuscin
granules are residual bodies containing oxidized and/or undigested
lipids. These granules are considered to result from the residue of
cellular organelles within lysosomes (11). Melanin is synthesized through
oxidation of tyrosine to dopamine and eventually melanin in the
melanosome (12). Due to
macrophage phagocytosis of erythrocytes and/or their breakdown
products, hemosiderin develops within residual bodies (13). Each granule type is distinctive and
can be visualized using specific staining. Confirmation of the type
of pigment granules present in MC is required.
The presence of MC may indicate an increased risk
for the development of colorectal cancer. High doses of
anthra-quinone cause tumor development in animals, and colorectal
adenomas occur more frequently in patients with MC (14,15).
Therefore, MC has clinical significance, and further analysis of
its clinical features and pathogenesis is necessary. In previous
years, several studies have been performed to investigate MC,
however, the requirement for comprehensive investigation remains,
and comparative analysis of gene expression differences in MC have
not been determined. Therefore the present study aimed to
investigate MC in terms of its endoscopic features,
histopathological characteristic and gene expression differences,
and provide a novel framework for understanding the pathogenesis of
MC.
Materials and methods
Tissue and patients
A total of 26 patients with MC were recruited in the
present study (Table. I), and
tissue specimens were collected from the First Affiliated Hospital
of Chengdu Medical College (Chengdu, China). Colonoscopy and biopsy
were performed for chronic constipation, abdominal pains,
distention or occasional bloody mucinous diarrhea. The tissue
specimens were surgically removed under endoscopic monitoring. The
Institutional Ethics Committee of Chengdu Medical College approved
the present study. All patients provided informed consent prior to
commencement.
 | Table IClinical features of patients with
melanosis coli. |
Table I
Clinical features of patients with
melanosis coli.
| Clinical feature | Number | Rate (%) |
|---|
| Gender |
| Male | 14 | 53.85 |
| Female | 12 | 46.15 |
| Age (years) | | |
| 30–50 | 6 | 23.07 |
| 51–69 | 12 | 46.15 |
| ≥70 | 8 | 30.76 |
| Obstipation |
| Laxative use | 20 | 76.92 |
| Bloody stools | 3 | 11.53 |
| Abdominal pain | 8 | 30.76 |
| Abdominal
distension | 5 | 19.23 |
| Constipation | 12 | 46.15 |
| Dry stool | 12 | 46.15 |
| Loose stools | 3 | 11.53 |
| Colonoscopic
findings |
| Brown | 18 | 69.23 |
| Red | 8 | 30.76 |
| Mucosal edema | 6 | 23.07 |
| Snake-skin
appearance | 7 | 26.92 |
| Neoplasm | 10 | 38.46 |
| Adenocarcinoma | 9 | 34.62 |
Hematoxylin and eosin (H&E)
staining
The histopathological characteristics of the MC
tissue specimens were evaluated using H&E staining (Beyotime
Institute of Biotechnology, Inc., Shanghai, China). The tissues
were fixed in 10% formalin and embedded in paraffin, and then
sectioned into 4 μm slices prior to staining with
H&E.
Pathology-specific staining of MC
All grain sizes of the tissue blocks were prepared
for specific staining by deparaffinization in xylol and rehydration
in serial dilutions of ethanol and distilled water. All the
chemical reagents used for specific staining were obtained from
Chengdu Changzheng Glass Co., Ltd. (Chengdu, China). The periodic
acid Schiff reaction (PAS) was used to detect lipofuscin. Following
incubation with 0.5% periodic acid for 5 min at room temperature,
sections were washed with distilled water for 15 min. Sections were
incubated with Schiff's reagent (Sigma-Aldrich, St. Louis, MO, USA)
for 30 min at room temperature, followed by washing under running
tap water for 5 min. All sections were counterstained with
hematoxylin for 3 min. Masson-Fontana ammoniacal silver staining
was used for melanin analysis. The sections were incubated with
ammoniacal silver solution (a few drops of ammonia were added into
5% silver nitrate solution until the precipitation disappeared) in
the dark for 15 min at room temperature and then washed twice with
distilled water. The sections were then incubated with 0.2% gold
chloride for 2 min at room temperature and subsequently washed with
distilled water. Sections were then fixed in 2% sodium thiosulfate
and finally counterstained in neutral red for 1 min. Bilirubin is
oxidized to biliverdin in an acid medium, and this oxidation
reaction occurs rapidly by ferric chloride in trichloroacetic acid
solution (16). Sections were
incubated with freshly prepared Fouchet's solution (1%
FeCl3, 25% CCl3COOH) for 5 min at room temperature.
Sections were washed with distilled water and stained with Van
Gieson's solution [1% fuchsin acid:1.22% picric acid (1:9)] for 5
min at room temperature. Tissue hemosiderin was detected using
Prussian blue staining for ferric ion. Sections were incubated with
a freshly prepared solution of a 1:1 mixture of 2% potassium
ferrocyanide and 2% hydrochloric acid for 20 min at 60°C. After
washing with distilled water, the sections were counterstained in
neutral red solution.
Immunohistochemistry
Staining was performed using an Histostain Plus kit
(Zhongshan Golden Bridge, Co., Ltd., Beijing, China). The specimens
were stained with mouse monoclonal immunoglobulin G (IgG)
anti-melanoma antibody (cat. no. ZM0187; Zhongshan Golden Bridge
Co., Ltd.). The antibody was diluted at 1:200 and incubated for 30
min at room temperature.
Terminal deoxynucleotidyl transferase
dUTP nick-end labeling (TUNEL) assay
Cell apoptosis in the MC tissues was detected using
a TUNEL assay kit (KeyGen Biotech Co., Ltd., Nanjing, China)
following the manufacturer's instructions. Briefly, slides
containing the tissue sections were incubated with 20 μg/ml
proteinase K solution (Sigma-Aldrich) for 30 min at room
temperature. Endogenous peroxidases were inactivated by immersing
the slides in 0.3% hydrogen peroxide in phosphate-buffered saline
(PBS; 137 mmol/l NaCl, 2.7 mmol/l KCl, 10 mmol/l
Na2HPO4 and 2 mmol/l
KH2PO4). A reaction mixture of rTdT (2%
Biotin-11-dUTP and 5% TdT enzyme in PBS) was added to the slides,
and the sections were incubated at 37°C for 60 min to allow the
end-labeling reaction to occur. The sections were then incubated
with streptavidin-fluorescein isothiocyanate (FITC) solution (1:20
dilution) for 30 min at room temperature. After washing with PBS
three times, the sections were incubated with peroxidase-conjugated
anti-FITC solution (1:10 dilution) for 30 min at room temperature.
Diaminobenzidine was then added for chromogenesis, for detecting
the appearance of a light brown background.
Expression microarray analysis
Total RNA was extracted from the colon MC and normal
colon tissues using TRIzol reagent (Gibco Life Technologies,
Carlsbad, CA, USA) according to the manufacturer's instructions.
The RNA quantity and quality were measured using a NanoDrop ND-1000
spectrophotometer (Thermo Fisher Scientific, Waltham, MA, USA). RNA
integrity was assessed using standard denaturing agarose gel
electrophoresis. Sample labeling and array hybridization were
performed, according to the Agilent One-Color Microarray-based gene
expression analysis protocol (Agilent Technologies, Inc., Santa
Clara, CA, USA). Briefly, total RNA from each sample was linearly
amplified and labeled with Cy3-UTP. The Labeled cRNAs were purified
by RNeasy Mini kit (Qiagen GmbH, Hilden, Germany). The
concentration and specific activity of the labeled cRNAs (pmol
Cy3/μg cRNA) were measured using the NanoDrop ND-1000. 1
μg each labeled cRNA was fragmented by adding 11 μl
10X blocking agent (Takara Bio, Inc., Shiga, Japan and 2.2
μl 25X fragmentation buffer (Takara Bio, Inc.), then heated
at 60°C for 30 min. Finally, 55 μl 2X gene expression
hybridization buffer (Takara Bio, Inc.) was added to dilute the
labeled cRNA. Hybridization solution (100 μl) was dispensed
into the gasket slide and assembled to the gene expression
microarray slide, and the slides were incubated for 17 h at 65°C.
The hybridized arrays were washed with gene expression wash buffer,
fixed and scanned using the G2505C Agilent DNA Microarray Scanner
(Agilent Technologies, Inc.). Agilent feature extraction software
(version 11.0.1.1; Agilent Technologies, Inc.) was used to analyze
the acquired array images. Differentially expressed genes with
statistical significance were identified through volcano plot
filtering. Hierarchical clustering was performed using Agilent
Genespring GX software (version 11.5.1; Agilent Technologies,
Inc.).
Gene ontology (GO) and pathway analysis were
performed according to the standard enrichment computation method
(17). The GO project provides a
controlled vocabulary to describe gene and gene product attributes
in any organism. The ontology covers three domains: i) Biological
process; ii) cellular components; and iii) molecular function.
Fisher's exact test establishes whether there is more overlap
between the differentially expressed list and the GO annotation
list, than would be expected by chance. The P-value denotes the
significance of GO term's enrichment in the differentially
expressed genes. The lower the P-value, the more significant the GO
term (P<0.05). Pathway analysis is a type of functional analysis
that maps genes to Kyoto Encyclopedia of Genes and Genomes (KEGG)
pathways (http://www.genome.jp/kegg/pathway.html). The P-value
denotes the significance of the pathway correlated with the
conditions. When the P-value is lower the pathway is more
significant is (P<0.05).
Western blotting
The samples (60 μg) were electrophoresed on
10% SDS-PAGE gels (Bio-Rad Laboratories, Inc., Hercules, CA, USA)
and transferred onto polyvinylidene difluoride membranes (Merck
Millipore, Darmstadt, Germany). The rabbit anti-human CYP3A4
polyclonal antibody (cat. no. bs-1472R; Beijing Biosynthesis
Biotechnology Co., Ltd., Beijing, China) was diluted at 1:500,
added to the membranes and incubated for 2 h at room temperature.
Subsequently, the membranes were incubated with horseradish
peroxidase-conjugated IgG (Zhongshan Golden Bridge Co., Ltd.) and
analyzed using an enhanced chemiluminescence system (Amersham
Pharmacia Biotech, Uppsala, Sweden).
Immunofluorescence assay
Briefly, the blocked tissue sections were incubated
overnight at 4°C with rabbit anti-human CYP3A4 polyclonal antibody
(cat. no. bs-1472R; Beijing Biosynthesis Biotechnology Co., Ltd.).
The sections were then incubated with Dylight 649-conjugated
secondary antibodies (GeneTex, Inc., San Antonio, TX, USA) for 30
min. The slides were visualized under a fluorescence microscope
(TI-S; Nikon Corporation, Tokyo, Japan).
Statistical analysis
Statistical analysis of the results in each
experiment was determined using one- or two-way analysis of
variance analysis using SPSS 16.0 analysis software (SPSS, Inc.,
Chicago, IL, USA). P<0.05 was considered to indicate a
statistically significant difference.
Results
Endoscopic and histopathological
characteristics of MC
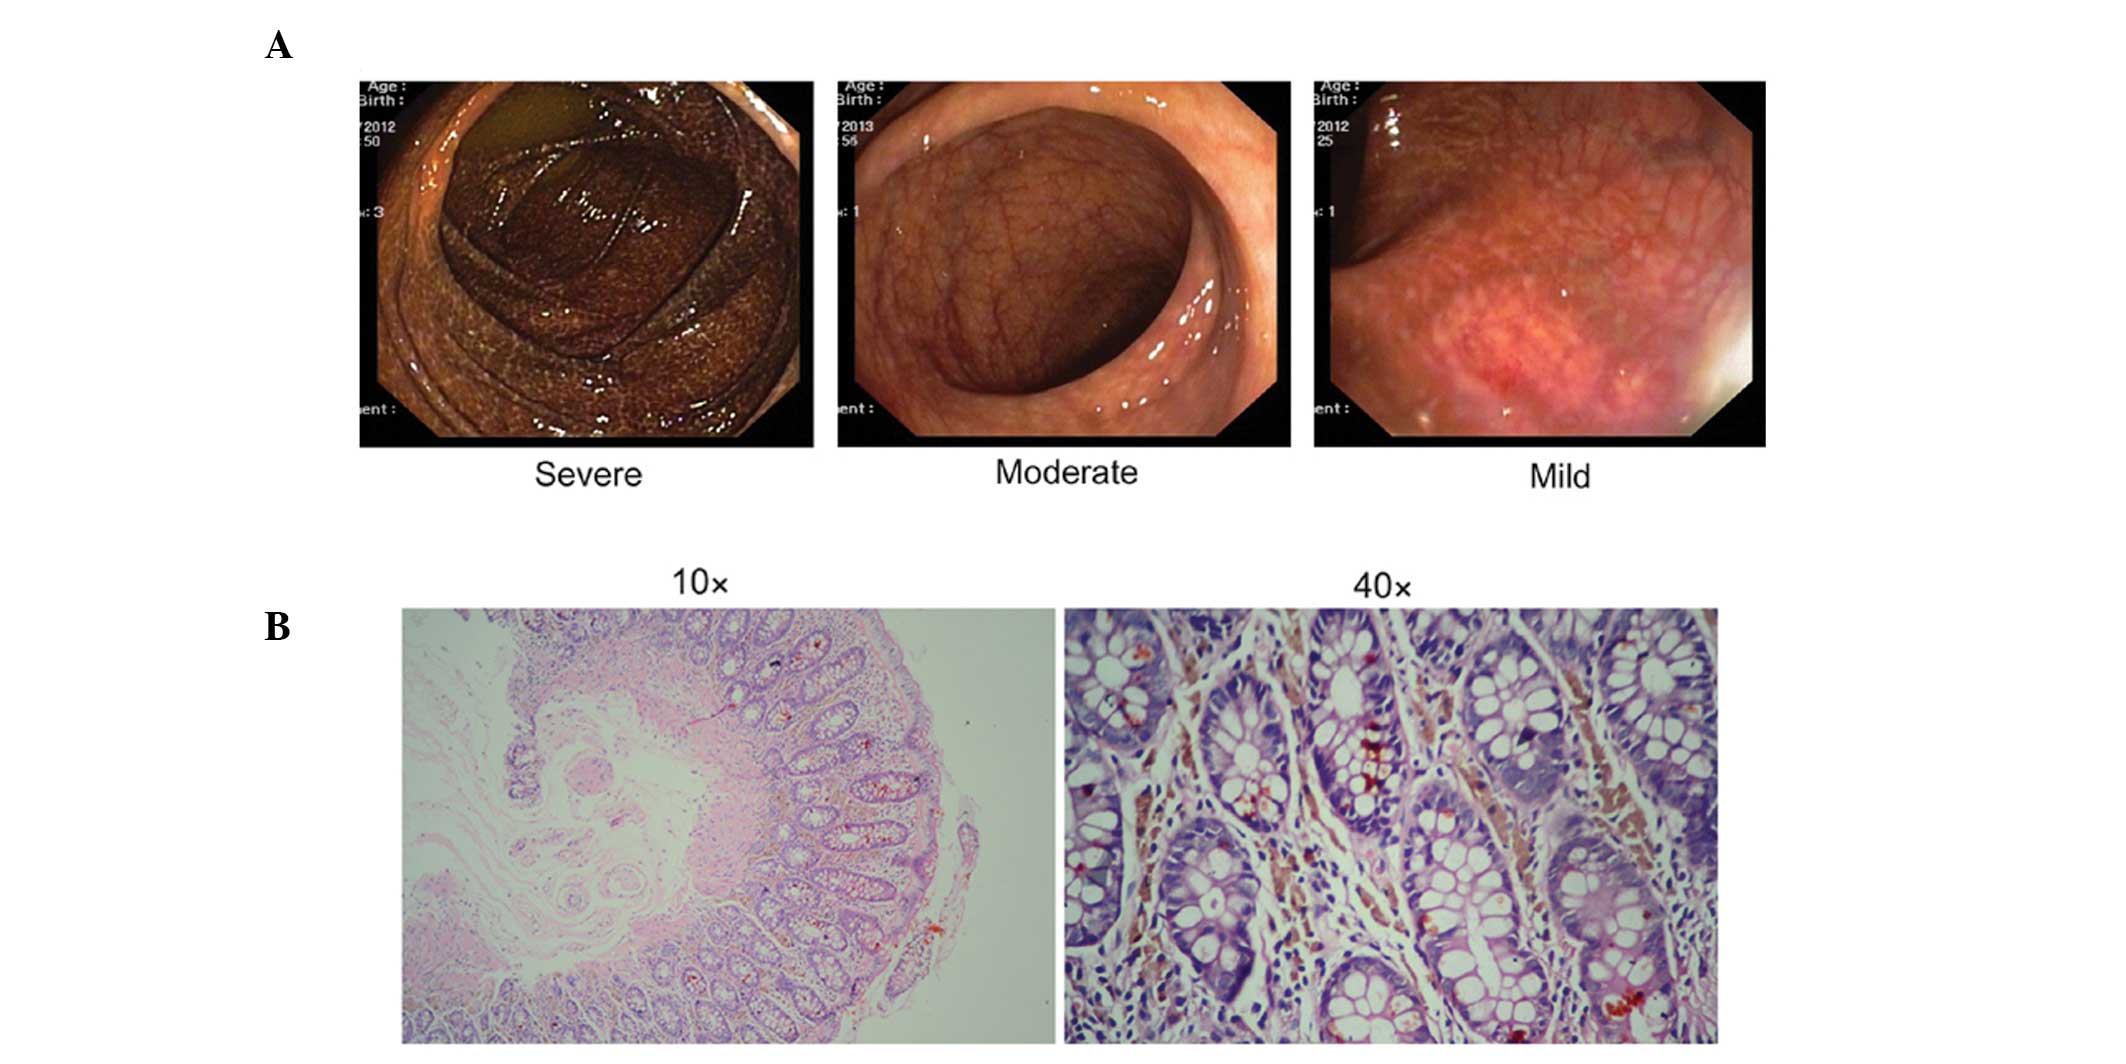
Examining the characteristics of MC revealed
colonoscopy characteristics in three representative cases. Severe
MC, in which a marked black-brownish pigmentation was apparent in
the mucosa of the whole colon; moderate MC, in which diffuse and
brown pigmentation was observed throughout the colon; and mild MC,
in which the mucosa had a diffusely brownish, snake-skin appearance
(Fig. 1A). H&E staining
revealed that the yellow-brown granular pigment was confined to the
tunica propria of the mucosa of large mononuclear histiocytes
(Fig. 1B). Of the 26 patients who
underwent endoscopy, 10 (38.46%) had neoplasia and 10 (34.62%) had
adenocarcinoma. It total, 76.92% of the patients with MC had a
history of long-term laxative use (Table I). This suggested that the use of
laxatives was associated with MC.
Pigment type in MC
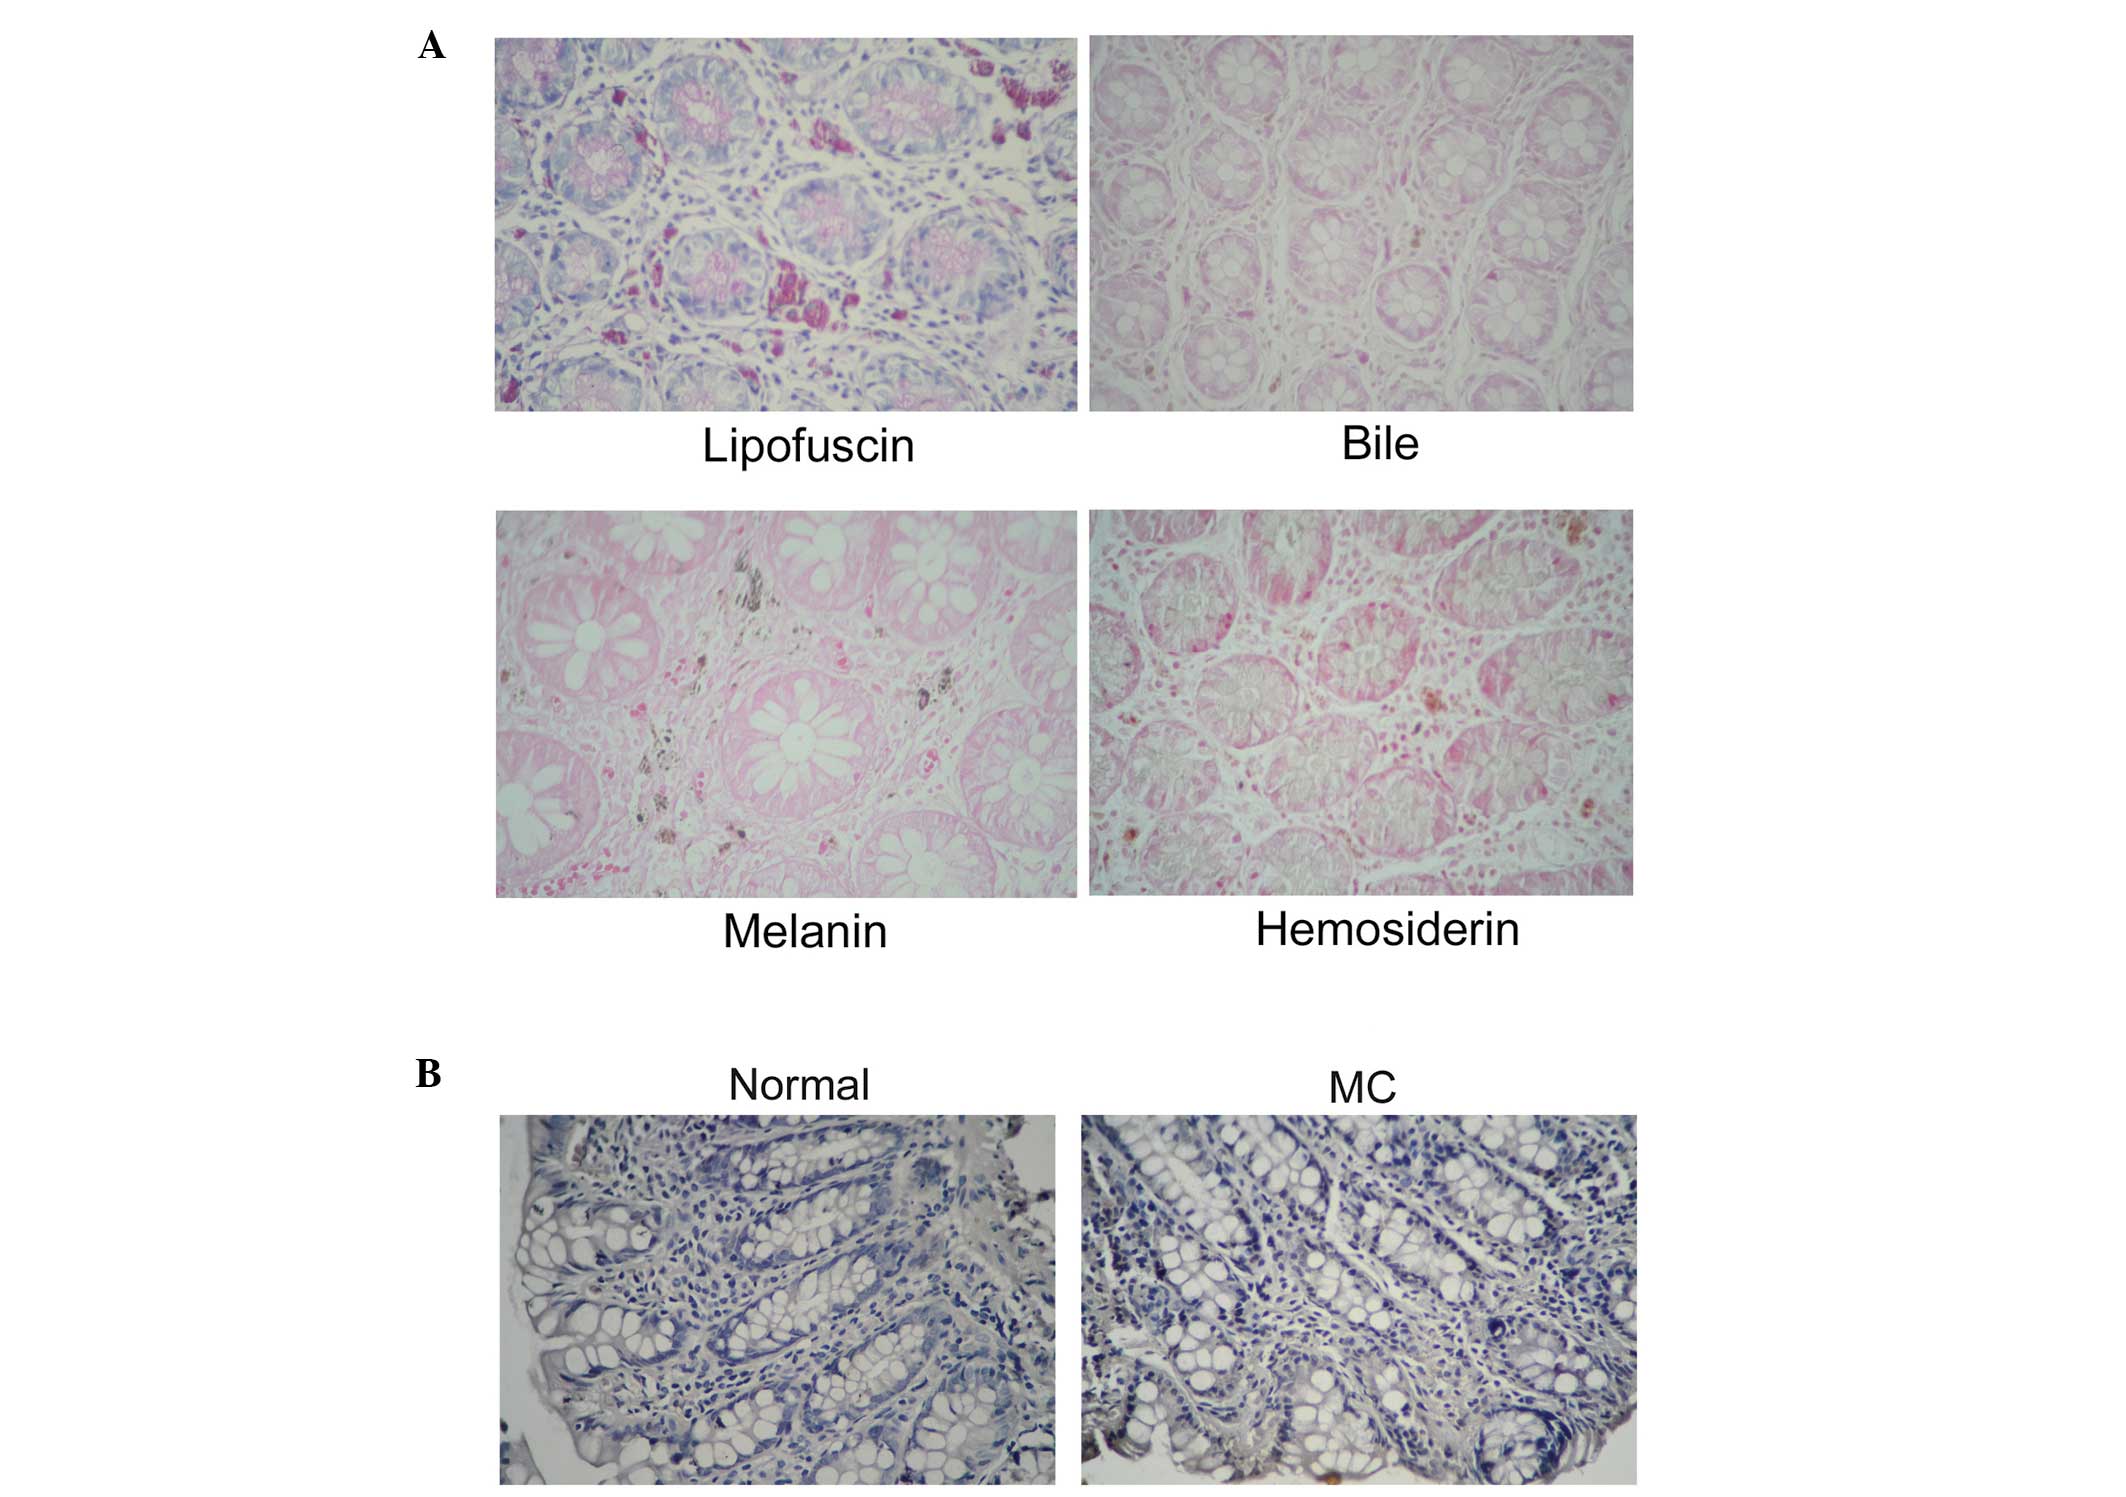
Specific staining and immunohistochemical analyses
of the MC tissues indicated that the pigment granules in the lamina
propria indicated lipofuscin, but not melanin, bile pigment or
hemosiderin. PAS is used to detect the presence of lipofuscin.
Light microscopy of the stained sections revealed blue nuclei, a
pale red gland cavity and several uniform purple particles in the
lamina propria, and there were higher numbers of purple particles
in the MC sections, compared with the normal sections. In addition,
no green or blue staining was identified to indicate the presence
of bile pigment and hemosiderin, and no obvious black particles
were observed in the specimens (Fig.
2A). To confirm the type of pigmentation, 26 MC tissues and 10
normal colon tissues were analyzed using immunohistochemistry. The
results indicated that the expression of melanin was absent in the
MC and normal colon tissues (Fig.
2B). These results confirmed that the pigment deposits in MC
were lipofuscin, not melanin.
Apoptosis in MC tissues
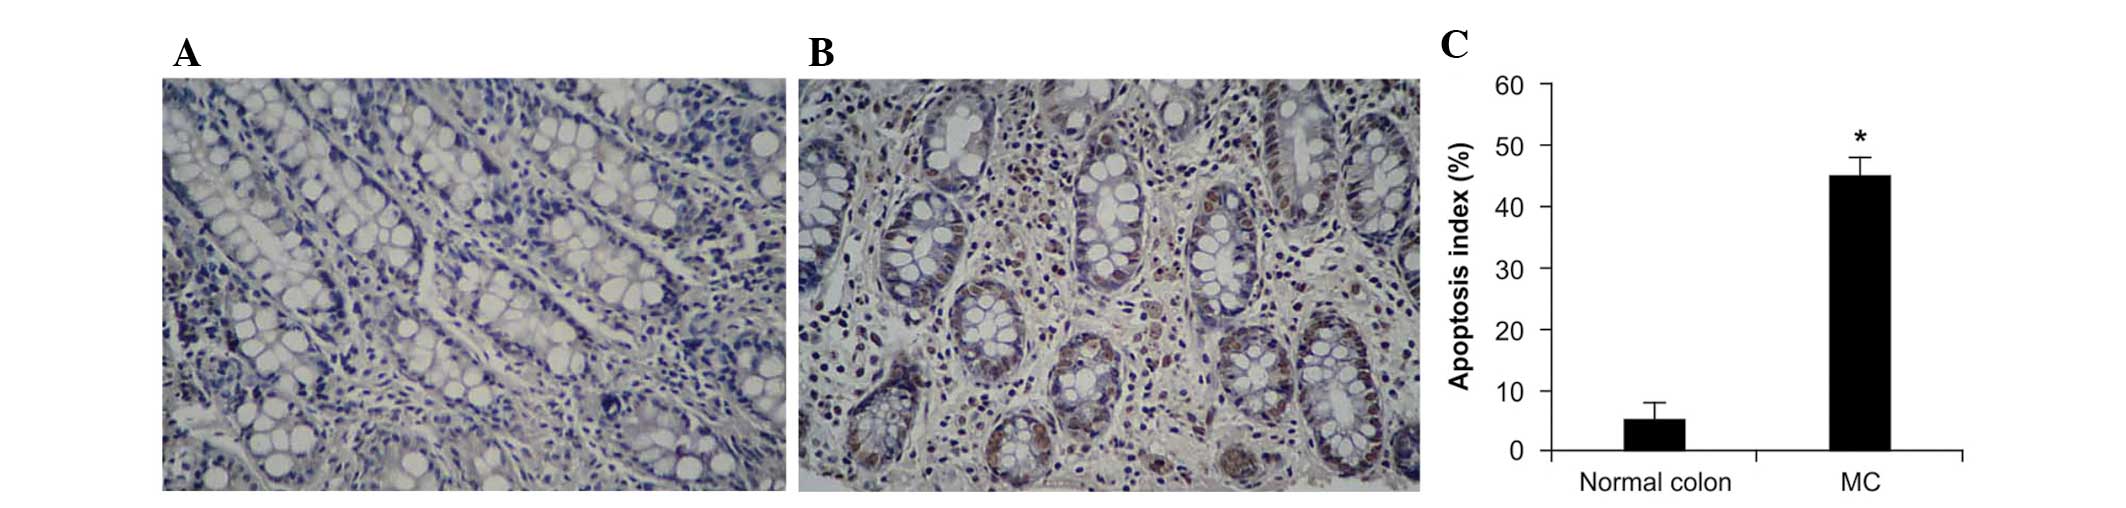
Apoptosis of the colonic cells in MC tissues was
evaluated using a TUNEL assay, with which the 26 MC tissues and 10
normal colon specimens were analyzed. Numerous apoptotic cells were
observed in the MC tissue sections, and the apoptotic rate was
higher than that observed in the normal colon tissue sections.
Apoptotic bodies were observed within the macrophages and
superficial lamina propria of the colonic epithelium (Fig. 3). These results indicates that
pigment storage is a consequence of apoptosis in colonic epithelial
cells.
Analysis of the gene chip expression
profile
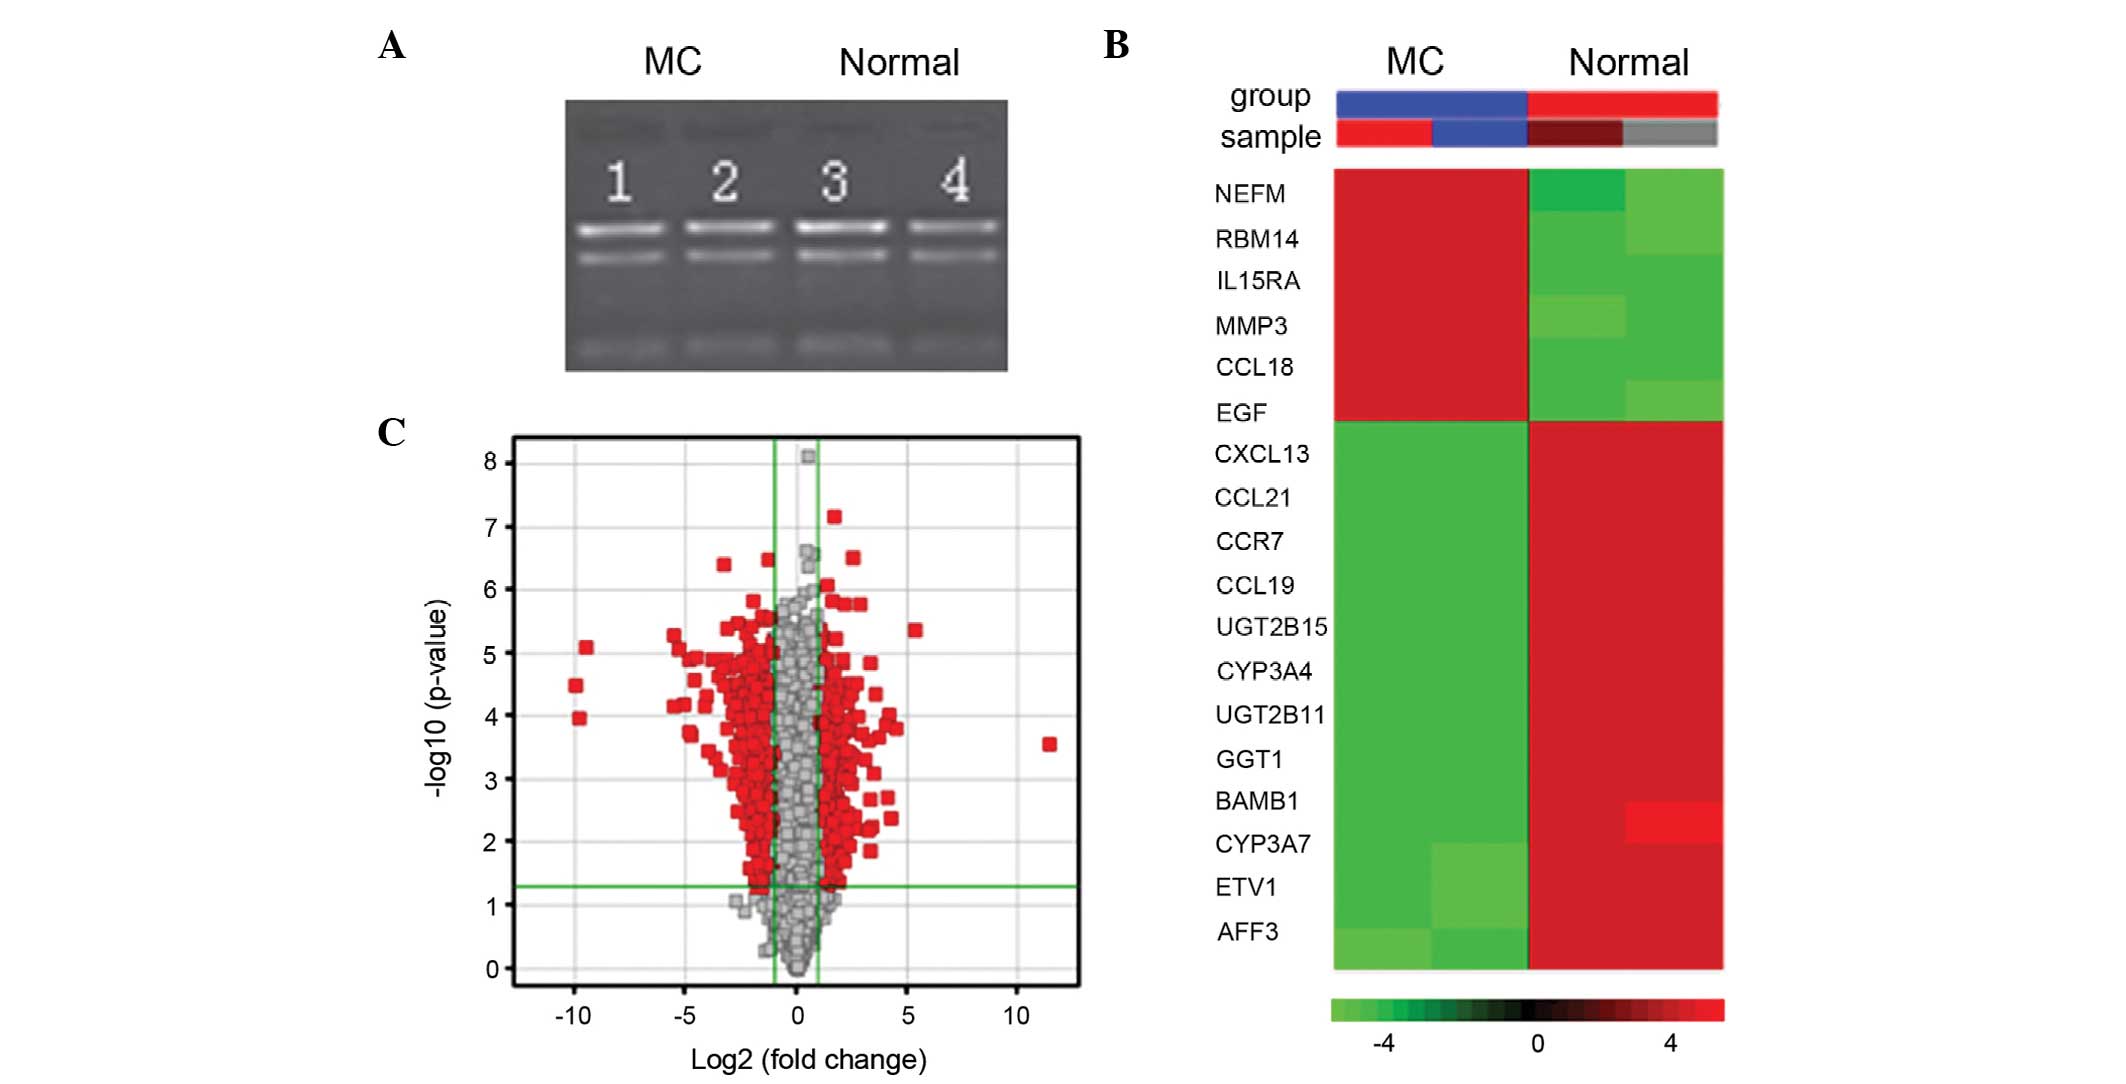
Data from three independent samples demonstrated
that 1,718 genes were differentially expressed between the MC and
control samples (Fig. 4). Of
these, 879 genes were downregulated and 739 genes were upregulated,
as shown by the Volcano plot representation in Fig. 4C. The most significantly
upregulated genes were CCL18, NEFM, EGF and IL15RA, and the most
significantly downregulated genes were CYP3A4, CYP3A7, UGT2B11 and
UGT2B15 (Fig. 4B). The GO
functional class scoring of the differentially expressed genes
demonstrated that the most affected categories were as follows:
Immune response, lymphocyte activation, humoral immune response,
cell chemotaxis, G-protein-coupled chemoattractant receptor
activity, CCR chemokine receptor binding and drug catabolic process
for the downregulated genes and chemokine receptor binding, enzyme
inhibitor activity, acid/thiol ligase activity, bile acid
transmembrane transporter activity, cellular response to inorganic
substance and lipoprotein particle for the upregulated genes
(Table II). Accordingly, the most
affected pathways for the downregulated genes were as follows:
Immune network, NF-κB signaling pathway, metabolism of xenobiotics
by cytochrome P450, vitamin digestion and absorption (Table III) the most affected pathways
for the upregulated genes were as follows: Salmonella infection,
mineral absorption, bile secretion, collecting duct acid secretion
and melanoma (Table IV).
| Table IIGO analysis of differentially
expressed genes in Melanosis coli. |
Table II
GO analysis of differentially
expressed genes in Melanosis coli.
| GO.ID | Term | Ontology | Count | Pop Hits | List Total | Pop Total | Fold Enrichment | P-value | Enrichment Score | Representative
gene |
|---|
| GO:0006955 | Immune response | Biological
process | 61 | 1023 | 463 | 14742 | 1.8985 | 8.8294E-07 | 6.0540 |
C3/FCER1A/IL7R/ELK1/TIRAP/NOS2/CCR7/CD37 |
| GO:0045321 | Leukocyte
activation | Biological
process | 37 | 505 | 463 | 14742 | 2.3328 | 1.5604E-06 | 5.8067 | CCR7/CCL19/CCL21/ITK
CX3CR1/CD1C/GPR183/ |
| GO:0006959 | Humoral immune
response | Biological
process | 14 | 113 | 463 | 14742 | 3.9448 | 1.1939E-05 | 4.9229 |
C3/CD37/CXCL13/CCR7/CLU/C8G/CR2/CR1/CD28 |
| GO:0060326 | Cell chemotaxis | Biological
process | 15 | 129 | 463 | 14742 | 3.7023 | 1.2787E-05 | 4.8932 |
CALCA/CCL23/TNFSF11/GREM1/IL16/CX3CR1/LEF1 |
| GO:0001637 | GPC chemoattractant
receptor activity | Molecular
function | 5 | 25 | 474 | 15325 | 6.4662 | 0.0008 | 3.0545 |
CX3CR1/CCR9/CCR7/CXCR5/CXCR4 |
| GO:0048020 | CCR chemokine
receptor binding | Molecular
function | 4 | 15 | 474 | 15325 | 8.6216 | 0.0009 | 3.0267 |
CCL23/CCL19/CCL21/CXCL13 |
| GO:0017144 | Drug metabolic
process | Biological
process | 4 | 36 | 463 | 14742 | 3.5377 | 0.0255 | 1.5919 |
AKR1C1/CYP3A4/CYP2B6/BCHE |
| GO:0042379 | Chemokine receptor
binding | Molecular
function | 9 | 55 | 395 | 15325 | 6.3486 | 1.0206E-05 | 4.9911 |
CXCL1/CXCL2/CXCL3/PF4/CCL3/CCL18/CXCL11 |
| GO:0004857 | Enzyme inhibitor
activity | Molecular
function | 15 | 306 | 395 | 15325 | 1.9018 | 0.0133 | 1.8753 |
APOC1/PHACTR1/SERPINC1/SERPINB13/SERPINB4 |
| GO:0016878 | Acid-thiol ligase
activity | Molecular
function | 3 | 20 | 395 | 15325 | 5.8196 | 0.0139 | 1.8542 |
ACSM5/C10ORF129/ACSF3 |
| GO:0015125 | Bile acid
transmembrane transporter activity | Molecular
function | 2 | 11 | 395 | 15325 | 7.0540 | 0.0312 | 1.5051 | SLC10A2/ZAR1 |
| GO:0071241 | Cellular response
to inorganic substance | Biological
process | 8 | 83 | 373 | 14742 | 3.8094 | 0.0011 | 2.9292 |
SLC18A2/MT1F/MT1G/MT1H/MT1X/FOS/SLC18A1 |
| GO:0097006 | Regulation of
plasma lipoprotein particle levels | Biological
process | 6 | 45 | 373 | 14742 | 5.2697 | 0.0008 | 3.0498 |
APOC2/APOC1/PCSK9/MPO/PLA2G7/MSR1 |
| Table IIITop KEGG pathways enriched with
downregulated expressed genes and their corresponding Fisher's
exact test P-values. |
Table III
Top KEGG pathways enriched with
downregulated expressed genes and their corresponding Fisher's
exact test P-values.
| KEGG pathway name
(entry ID) | P-value | Differentially
expressed genes | Number of
genes | Ratio |
|---|
| Intestinal immune
network for IgA production (hsa04672) | 3.3E-05 | 9 | 50 | 0.180 |
| NF-κB signaling
pathway (hsa04064) | 4.3E-05 | 12 | 91 | 0.132 |
| Primary
immunodeficiency (hsa05340) | 0.0001 | 7 | 36 | 0.194 |
| Cytokine-cytokine
receptor interaction (hsa04060) | 0.0002 | 21 | 271 | 0.077 |
| Hematopoietic cell
lineage (hsa04640) | 0.0006 | 10 | 88 | 0.114 |
| Vascular smooth
muscle contraction (hsa04270) | 0.0013 | 12 | 131 | 0.092 |
| Steroid hormone
biosynthesis (hsa00140) | 0.0026 | 7 | 57 | 0.123 |
| Retinol metabolism
(hsa00830) | 0.0051 | 7 | 64 | 0.109 |
| Starch and sucrose
metabolisms (hsa00500) | 0.0103 | 6 | 56 | 0.107 |
| Metabolism of
xenobiotics by cytochrome P450 (hsa00980) | 0.0112 | 7 | 74 | 0.095 |
| Arachidonic acid
metabolism (hsa00590) | 0.0191 | 6 | 64 | 0.094 |
| Table IVTop KEGG pathways enriched with
upregulated expressed genes and their corresponding Fisher's exact
test P-values. |
Table IV
Top KEGG pathways enriched with
upregulated expressed genes and their corresponding Fisher's exact
test P-values.
| KEGG pathway name
(entry ID) | P-value | Differentially
expressed genes | Number of
genes | Ratio |
|---|
| Cytokine-cytokine
receptor interaction (hsa04060) | 0.0011 | 17 | 271 | 0.063 |
| Chemokine signaling
pathway (hsa04062) | 0.0019 | 13 | 189 | 0.069 |
| Salmonella
infection (hsa05132) | 0.0022 | 8 | 86 | 0.093 |
| Mineral absorption
(hsa04978) | 0.0024 | 6 | 51 | 0.118 |
| Rheumatoid
arthritis (hsa05323) | 0.0034 | 8 | 92 | 0.087 |
| Butirosin and
neomycin biosynthesis (hsa00524) | 0.0069 | 2 | 5 | 0.400 |
| Bile secretion
(hsa04976) | 0.0133 | 6 | 72 | 0.083 |
| Glycine, serine and
threonine metabolism (hsa00260) | 0.0191 | 4 | 38 | 0.105 |
| Serotonergic
synapse (hsa04726) | 0.0355 | 7 | 114 | 0.061 |
| Collecting duct
acid secretion (hsa04966) | 0.0361 | 3 | 27 | 0.111 |
| Melanoma
(hsa05218) | 0.0436 | 5 | 71 | 0.070 |
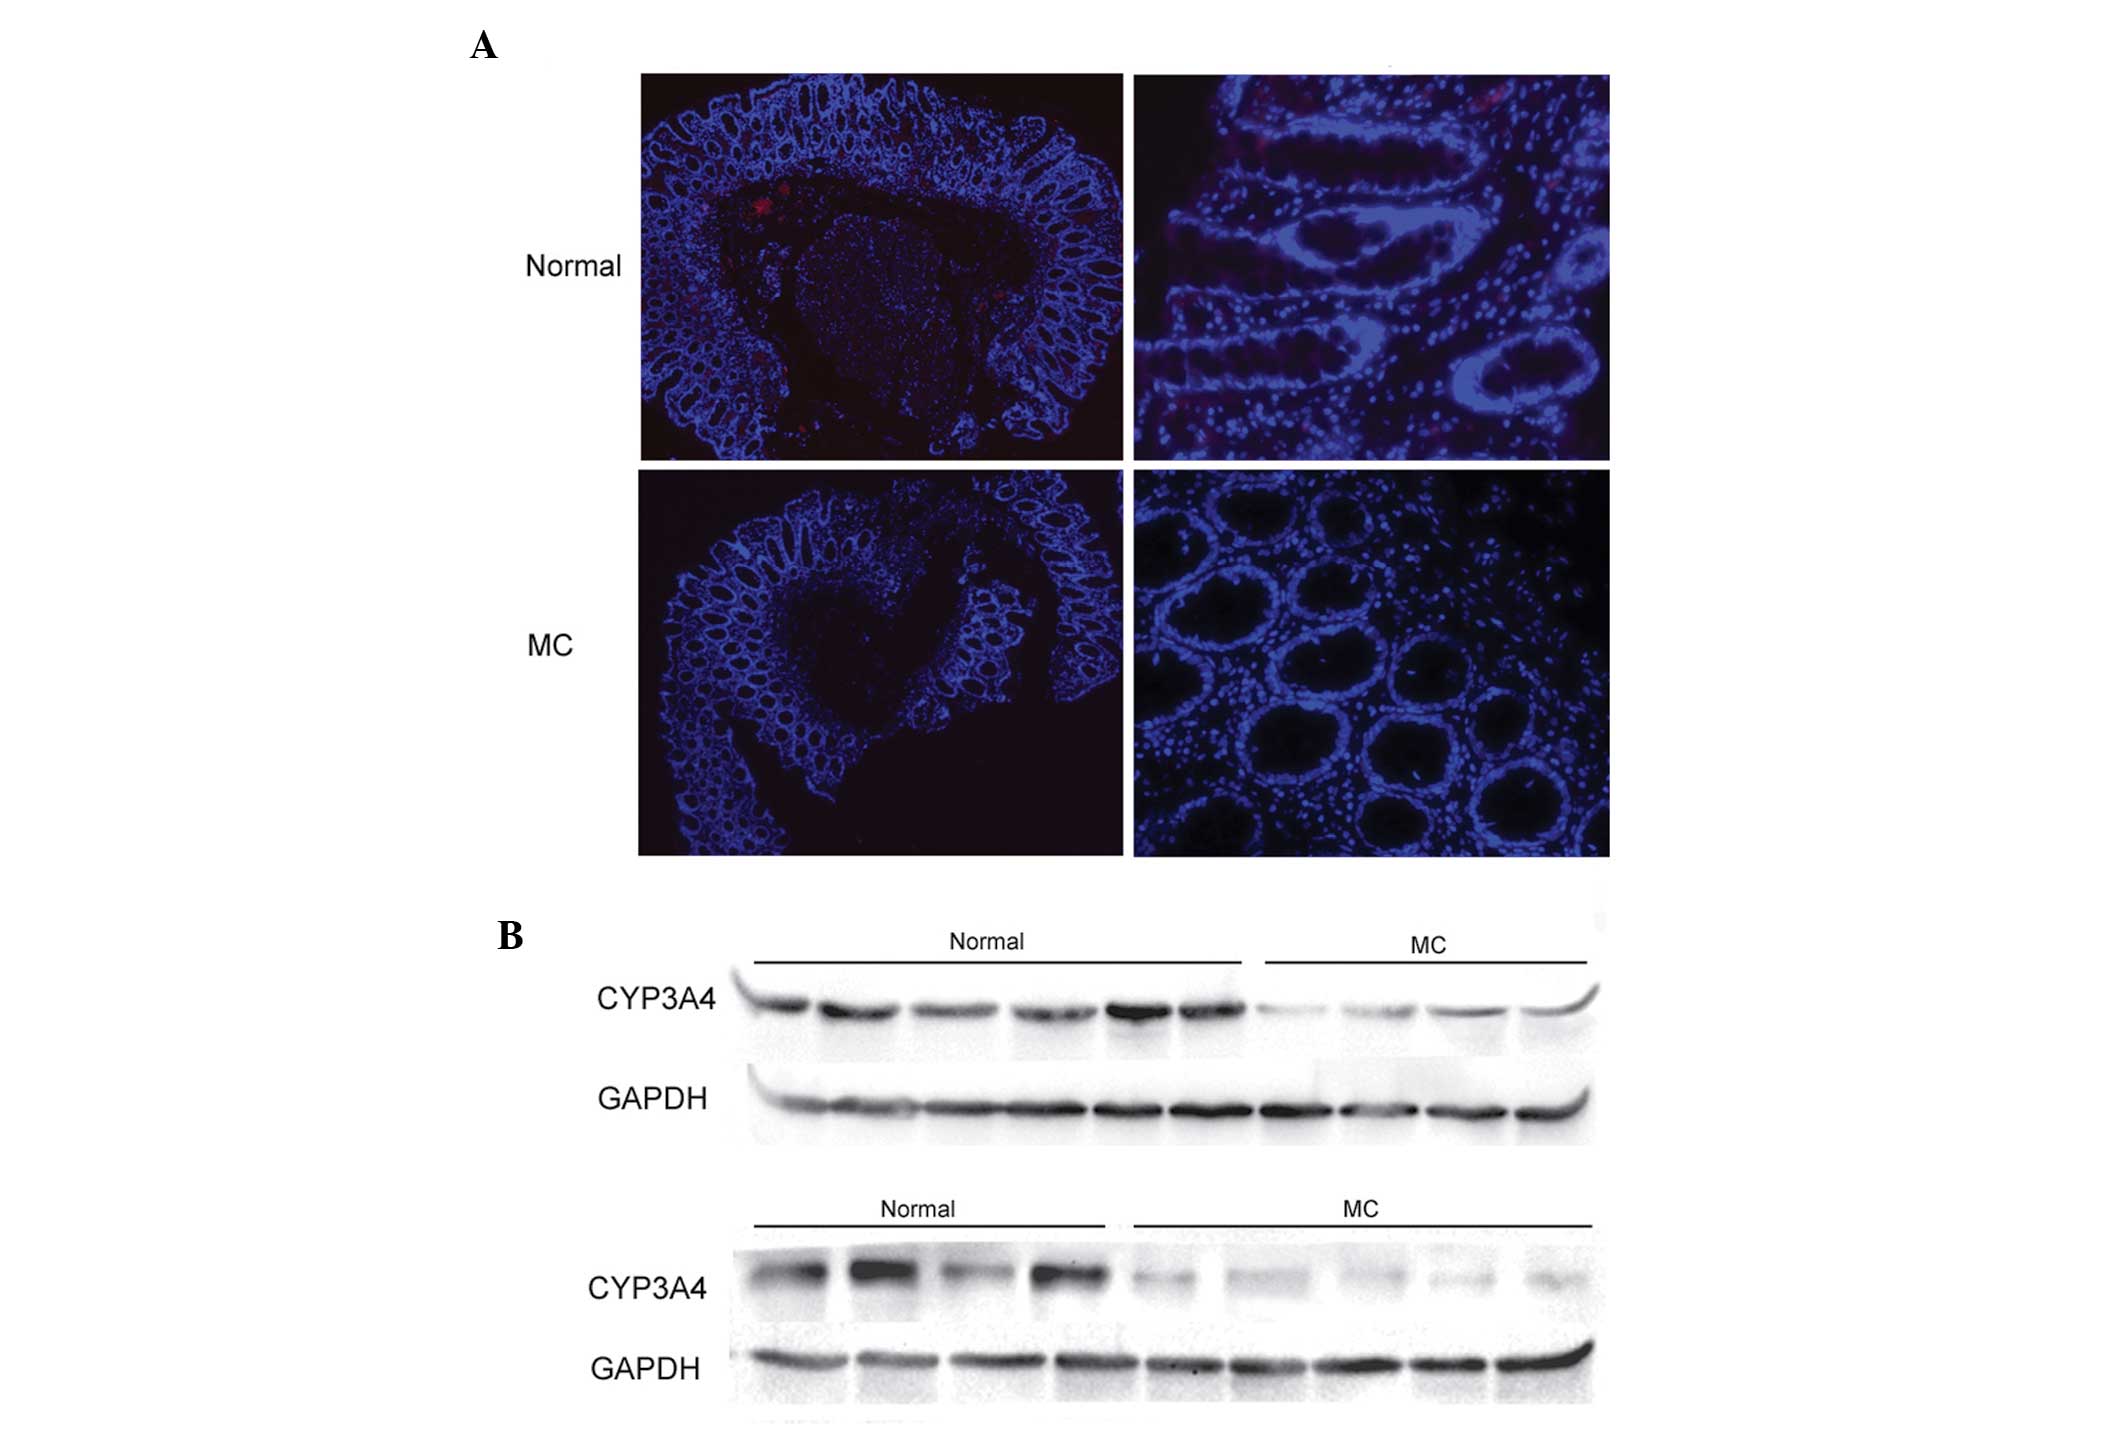
Detection of CYP3A4
P450 families of CYP1, CYP2 and CYP3 are the
predominant contributors to the oxidative metabolism of >90% of
clinical drugs. CYP3A4 is one of these, and is predominantly
present in the intestine. The chip expression data revealed that
CYP3A4 was downregulated in MC by 11.0-fold, compared with normal
tissue. To further verify the results of the gene chip screening,
the expression levels of CYP3A4 were assayed using western blotting
and an immunofluorescence assay in the present study. The results
indicated that the expression of CYP3A4 in MC was higher than in
normal tissue (Fig 5) and were,
therefore, in accordance with the results of the gene chip
screening.
Discussion
MC refers to an abnormality in which brown or black
pigmentation is deposited in the colonic mucosa. It is a relatively
common finding in colonic biopsies and resected specimens, however,
the histopathology and pathogenesis of MC remain to be fully
elucidated. In the present study, the type of pigment in MC was
investigated by performing specific staining and
immunohistochemical analyses in 26 MC specimens. The pigment
deposits in MC were observed to contain lipofuscin and not melanin,
bile pigments or hemosiderin. This condition, in which pigment
deposits consist of lipofuscin rather than melanin is also referred
to as pseudo-MC. In addition, there were a higher number of
apoptotic cells in MC, compared with normal tissues. Expression
microarray analysis demonstrated that the significantly
downregulated genes were CYP3A4, CYP3A7, UGT2B11 and UGT2B15 in MC
tissue, and western blotting and immunofluorescence analyses
indicated that the expression of CYP3A4 in normal tissue was higher
than that in MC.
The pathogenesis of MC has not been investigated in
previous studies at depth. Several hypotheses have been suggested
to explain pigment formation in MC. For example, it has been
suggested that the formation of pigment granules is associated with
apoptosis in colonic mucous membrane epithelial cells induced by
purgatives (18). It has also been
suggested that constipation leads to the retention of protein-rich
foods in the intestinal tract, and that the protein degradation
products are converted into melanin or lipofuscin, which are
phagocytized by macrophages in the lamina propria (8). Despite these hypotheses, there is no
clear experimental evidence to support any single pathogenesis for
MC. In the present study, TUNEL apoptosis analysis revealed
numerous apoptotic bodies in the epithelium and superficial lamina
propria in the colonic mucosal biopsies from patients with MC.
Pigment storage is a consequence of colonic epithelial cells
apoptosis, in which the apoptotic cells are swallowed by
macrophages, which migrate in the lamina propria and the conversion
into lipofuscin pigment occurs by lysosomal enzymes (19).
The gene chip technique has been widely used to
detect gene expression differences using comparative analysis. In
the present study, the Agilent gene chip to analyze the gene
expression profile of human MC and normal colon tissues. As shown
in Fig. 4, significant changes
were observed in the expression of several genes in MC. These genes
included those involved in the intestinal immune network, NF-κ B
signaling pathway and metabolism of xenobiotics and drug by
cytochrome P450 and melanoma. The most significantly downregulation
genes were CYP3A4, CYP3A7, UGT2B11 and UGT2B15. These genes belong
to the cytochrome P450 superfamily, which is involved in the
metabolism of xenobiotics and drugs (20). The human CYP superfamily contains
57 functional genes and 58 pseudogenes. Among these, the members
from the CYP1, CYP2 and CYP3 families are the predominant
contributors to the oxidative metabolism of >90% of clinical
drugs (21,22), and CYP3A4 is one of these, which is
predominantly present in the intestine.
Aloe and emodin are anthraquinones known to be
metabolized by P450s. It has been reported that aloe vera juice
inhibits CYP3A4 and CYP2D6 irreversibly in vitro, having
significantly different half maximal inhibitory concentration
values (23), and emodin inhibits
P450 with an antimutagenic effect (24,25).
These biological effects of emodin prompted the present study to
investigate anthraquinones as potential P450 inhibitors. The chip
expression data in the present study demonstrated that CYP3A4 was
downregulated in the MC tissues by 11.0-fold, compared with normal
tissues. Western blotting and immunofluorescence assays also
indicated that the expression of CYP3A4 in the MC tissue was lower
than in the normal tissue (Fig.
5).
The data of the present study demonstrated that the
pigment deposits in MC contain lipofuscin, and do not contain
melanin, bile pigment or hemosiderin, and numerous apoptotic bodies
were observed in the epithelium and superficial lamina propria in
the colonic mucosal biopsies. Expression micro-array analysis
revealed that the P450-associated genes were significantly
downregulated in MC tissues, and further experiments confirmed that
the expression of CYP3A4 in the normal tissue was higher than in
the MC tissue. To the best of our knowledge, this is the first time
to demonstrate that, for MC patients, long time use of
anthraquinone laxatives may inhibit P450, particularly CYP3A4, in
the intestine. These findings increase understanding for assistance
in further investigations of MC.
Acknowledgments
This study was supported by the National Natural
Science Foundation of China (grant no. 81302170), the Natural
Science Foundation of Chengdu Medical College (grant no. CYZ12-005)
and the National Clinical Medicine Research Foundation of China
(grant no. L2012055).
References
|
1
|
Li D, Browne LW and Ladabaum U: Melanosis
coli. Clin Gastroenterol Hepatol. 7:A202009. View Article : Google Scholar : PubMed/NCBI
|
|
2
|
Kunkel J, Schmidt S, Loddenkemper C, Zeitz
M and Schulzke JD: Chronic diarrhea and melanosis coli caused by
wellness drink. Int J Colorectal Dis. 24:595–596. 2009. View Article : Google Scholar
|
|
3
|
Samenius B: The clinical importance of
melanosis coli. Proc R Soc Med. 52(Suppl): 105–106. 1959.PubMed/NCBI
|
|
4
|
Pardi DS, Tremaine WJ, Rothenberg HJ and
Batts KP: Melanosis coli in inflammatory bowel disease. J Clin
Gastroenterol. 26:167–170. 1998. View Article : Google Scholar : PubMed/NCBI
|
|
5
|
Chen JY, Pan F, Zhang T, Xia J and Li YJ:
Experimental study on the molecular mechanism of anthraquinone
cathartics in inducing melanosis coli. Chin J Integr Med.
17:525–530. 2011. View Article : Google Scholar : PubMed/NCBI
|
|
6
|
Chen JY, Pan F and Zhang T: Rhubarb
induced change of tumor necrosis factor-alpha level in guinea pig
model of melanosis coli and its significance. Zhongguo Zhong Xi Yi
Jie He Za Zhi. 29:140–142. 2009.In Chinese. PubMed/NCBI
|
|
7
|
Wang T, Chen ZW and Streutker CJ:
Melanosis coli sparing adenomatous polyps: Novel findings using
cleaved caspase-3 immunohistochemistry. Histopathology. 62:819–821.
2013. View Article : Google Scholar : PubMed/NCBI
|
|
8
|
Pearce CB, Martin H, Duncan HD, Goggin PM
and Poller DN: Colonic lymphoid hyperplasia in melanosis coli. Arch
Pathol Lab Med. 125:1110–1112. 2001.PubMed/NCBI
|
|
9
|
Loveday RL, Hughes MA, Lovel JA and Duthie
GS: Melanosis coli in the absence of anthranoid laxative use
harbouring adenoma. Colorectal Dis. 15:1044–1045. 2013. View Article : Google Scholar : PubMed/NCBI
|
|
10
|
Franken FH and Wiechers B: Melanosis
coli(author's transl). Leber Magen Darm. 5:269–271. 1975.In German.
PubMed/NCBI
|
|
11
|
Park C, Cho NH and Jeong HJ: Melanosis
coli - histochemical and immunohistochemical comparison of the
pigments of melanosis coli and Dubin-Johnson syndrome. Yonsei Med
J. 31:27–32. 1990. View Article : Google Scholar : PubMed/NCBI
|
|
12
|
Benavides SH, Morgante PE, Monserrat AJ,
Zárate J and Porta EA: The pigment of melanosis coli: A lectin
histochemical study. Gastrointest Endosc. 46:131–138. 1997.
View Article : Google Scholar : PubMed/NCBI
|
|
13
|
Allen EA, Ali SZ and Erozan YS:
Pigment-laden macrophages in ascitic fluid associated with
melanosis coli. Acta Cytol. 41:1249–1251. 1997.PubMed/NCBI
|
|
14
|
Tsobanidou Ch: Melanosis coli in two
patients with colorectal neoplasia. J BUON. 10:131–133. 2005.
|
|
15
|
Puppa G and Colombari R: Brown colon
(melanosis coli) harbouring pale tumors (adenocarcinoma and an
adenomatous polyp). J Gastrointestin Liver Dis. 18:509–511.
2009.
|
|
16
|
Onks DL, Robertson AF and Brodersen R: The
effect of chloral hydrate and its metabolites, trichloroethanol and
trichloroacetic acid, on bilirubin-albumin binding. Pharmacol
Toxicol. 71:196–197. 1992. View Article : Google Scholar : PubMed/NCBI
|
|
17
|
Tian L, Greenberg SA, Kong SW, Altschuler
J, Kohane IS and Park PJ: Discovering statistically significant
pathways in expression profiling studies. Proc Natl Acad Sci USA.
102:13544–13549. 2005. View Article : Google Scholar : PubMed/NCBI
|
|
18
|
Walker NI, Bennett RE and Axelsen RA:
Melanosis coli. A consequence of anthraquinone-induced apoptosis of
colonic epithelial cells. Am J Pathol. 131:465–476. 1988.PubMed/NCBI
|
|
19
|
Chen JY, Pan F, Zhang T, Xia J and Li YJ:
Experimental study on the molecular mechanism of anthraquinone
cathartics in inducing melanosis coli. Chin J Integr Med.
17:525–530. 2011. View Article : Google Scholar : PubMed/NCBI
|
|
20
|
Pandey AV and Flück CE: NADPH P450
oxidoreductase: structure, function, and pathology of diseases.
Pharmacol Ther. 138:229–254. 2013. View Article : Google Scholar : PubMed/NCBI
|
|
21
|
Nebert DW and Russell DW: Clinical
importance of the cyto-chromes P450. Lancet. 360:1155–1162. 2002.
View Article : Google Scholar : PubMed/NCBI
|
|
22
|
Guengerich FP: Cytochrome P450s and other
enzymes in drug metabolism and toxicity. AAPS J. 8:E101–E111. 2006.
View Article : Google Scholar : PubMed/NCBI
|
|
23
|
Djuv A: Co-use of drugs and herbal
remedies in general practice and in vitroinhibition of CYP3A4,
CYP2D6 and P-glycoprotein by the common herb aloe vera (Doctoral
thesis). Department of Cancer and Molecular Medicine, Faculty of
Medicine, Norwegian University of Science and Technology; 333:pp.
1503–8181. 2013, In Norwegian.
|
|
24
|
Sridhar J, Liu J, Foroozesh M and Klein
Stevens CL: Inhibition of cytochrome p450 enzymes by quinones and
anthraquinones. Chem Res Toxicol. 25:357–365. 2012. View Article : Google Scholar
|
|
25
|
Takahashi E, Fujita K, Kamataki T,
Arimoto-Kobayashi S, Okamoto K and Negishi T: Inhibition of human
cytochrome P450 1B1, 1A1 and 1A2 by antigenotoxic compounds,
purpurin and alizarin. Mutat Res. 508:147–156. 2002. View Article : Google Scholar : PubMed/NCBI
|