Introduction
Epilepsy is a common clinical manifestation of
primary brain tumors. The prevalence of epilepsy was reported to be
>89% among patients with low-grade gliomas. Overall, epilepsy
has been estimated to develop in up to 50% of glioma patients
(1–3). However, surgical resection of the
tumor mass does not cure epilepsy in a significant percentage of
the glioma patients. Studies have indicated a variety of factors
which may be linked to the incidence of glioma-associated epilepsy,
including genetic background (4),
tumor location (5), glioma
differentiation status (6) and
alternation of the peritumoral environment [e.g., neuronal cell
migration (7), enhanced cell-cell
communication (8) and increased
glutamate concentration (9)]. To
date, the pathogenesis of glioma-associated epilepsy has largely
remained elusive.
Adenosine, an endogenous regulator of the mammalian
brain, has essential anti-convulsive and neuroprotective roles
(10,11) and adenosine levels have been
demonstrated to rise during seizure activity (12). Maintenance of adenosine homeostasis
depends on metabolic clearance through an evolutionarily-conserved
phosphotransferase, adenosine kinase (ADK), which converts the
purine ribonucleoside adenosine into 5′-adenosine-monophosphate
(13). In a European study of
glioma patients with epilepsy, ADK upregulation was observed in
peritumoral infiltrated tissues (14). In addition, adenosine deaminase
(ADA) is known to be involved in purine metabolism, which
deaminates adenosine and converts it to the respective nucleoside
inosine. Of note, a study using an adult zebrafish model showed
that ADA levels were significantly increased during
pentylenetetrazole-induced seizures (15).
To gain further insight into the potential
involvement of ADA and ADK in glioma-associated epilepsy, the
present study was designed to perform a comparative analysis of ADA
and ADK expression in human glioma tissues, peritumoral tissues and
normal brain tissues. The findings of the present study enhanced
the overall understanding of the pathogenesis of glioma-associated
epilepsy.
Materials and methods
Patients
From April 2012 to July 2012, a total of 45 patients
receiving surgical resection of gliomas at the Department of
Neurosurgery of XiangYa Hospital (Changsha, China) were recruited
for the present study. All patients provided informed written
consent. Among these patients, 30 subjects were male and 15 were
female. The age range of the patients was 2–65 years, with an
average age of 38.24±15.82 Tumor tissues and peritumoral tissues
were obtained from these patients and histologically analyzed to
determine the glioma grade (Grades I–IV) according to the World
Health Organization (WHO) Grading of Tumours of the Central Nervous
System from 2007 (16).
Normal brain tissue samples were obtained from eight
brain trauma patients undergoing nerve decompression or debridement
surgery. XiangYa Hospital of Central South University (Changsha,
China) granted ethical approval of the present study.
Enrolment criteria
Exclusion criteria for glioma tissues were as
follows: i) Ischemic lesions, hemorrhage, vascular malformation or
trauma detected by magnetic resonance imaging; ii) central nervous
system (CNS) disorders other than glioma and epilepsy; and iii) any
other severe disorders. Inclusion criteria of peritumoral tissues
were as follows: i) Clear morphological differences from tumor
tissues upon gross observation; ii) location adjacent to tumor
tissues; and iii) tumor cell invasion as detected using microscopy
with normal cells also observed. Control subjects were included in
the present study if they fulfilled the following criteria: i) No
epilepsy; ii) no other CNS disorders, iii) no other severe
disorders; and iv) normal brain tissue structures confirmed during
pathological examination.
Reagents
The rabbit anti-ADA polyclonal antibody was
purchased from Atlas (AlbaNova University Center, Stockholm,
Sweden; cat. no. HPA023884). The rabbit anti-ADK (cat. no.
PA5-13860) and mouse anti-p53 (cat. no. DO-7+BP53-12) polyclonal
antibodies were obtained from Pierce (Thermo Fisher Scientific,
Waltham, MA, USA). Monoclonal mouse anti-Ki67 was obtained from
Dako (Glostrup, Denmark; cat. no. MIB-1) and polyclonal rabbit
anti-glial fibrillary acidic protein (GFAP; cat. no. ZA-0529),
polyclonal mouse anti-O6-methylguanine-DNA
methyltransferase (MGMT; cat. no. ZM-0461), citrate buffer (0.01 M;
pH 6.0), modified phosphate-buffered saline (MPBS; 0.01 M; pH
7.2–7.6), and Tris-buffered saline containing Tween-20 (TBS-T;
0.01M, pH 7.2–7.6) were obtained from Beijing Zhongshan Golden
Bridge Biotechnology Co., Ltd. (Beijing, China). Secondary
antibodies, including Alexa fluor 488-conjugated goat anti-rabbit
immunoglobulin (Ig)G (cat. no. A-11008) and Alexa fluor
555-conjugated donkey anti-mouse IgG (cat. no. A-31570), were
purchased from Invitrogen Life Technologies, Inc. (Carlsbad, CA,
USA). Reagents used for western blot analyses, including
radioimmunoprecipitation assay (RIPA) lysis buffer, the
bicinchoninic acid (BCA) protein assay kit, the β-actin primary
antibody (cat. no. AA128), horseradish peroxidase (HRP)-conjugated
goat anti-rabbit (cat. no. A0208) anti-mouse (cat. no. A0216) IgG
secondary antibody, phenylmethyl sulfonylfluor (PMSF), DAPI and the
enhanced chemiluminescence (ECL) kit were purchased from the
Beyotime Institute of Biotechnology (Shanghai, China). The
HiFi-Moloney murine leukemia virus (MMLV) first-strand cDNA
synthesis kit, UltraSYBR Mixture (with Rox) and DNase I were
obtained from Beijing CW Biotech Co., Ltd. (Beijing, China).
Sample preparation
Brain tissues obtained from subjects were divided
into two portions. One portion was prepared for histological
examination, immunohistochemistry and immunofluorescence. The other
portion was prepared for western blot analysis and
reverse-transcription quantitative polymerase chain reaction
(RT-qPCR). Briefly, the former set was fixed in 10% formalin for 15
h at room temperature, dehydrated using a graded ethanol series
(75% ethanol for 2 h, 85% ethanol for 2 h, 95% ethanol for 1 h and
100% ethanol for 1 h), cleared in xylene, embedded in paraffin and
stored at 4°C until use. The latter set was stored at −80°C until
use.
Histological examination
For histological studies, the paraffin-embedded
samples were de-paraffinized in xylene and re-hydrated in a graded
ethanol series (100% ethanol for 5 min, 100% ethanol for 5 min, 95%
ethanol for 5 min, 95% ethanol for 5 min, 85% ethanol for 3 min,
75% ethanol for 2 min, and distilled water for 1 min). Next, the
samples were stained with hematoxylin solution (Beijing Dingguo
Changsheng Biotechnology Co., Ltd., Beijing, China) for 5 min,
differentiated by soaking in 1% hydrochloric acid alcohol (pH 5.0;
Beijing CW Biotech Co., Ltd.) for 15 sec and washed under running
tap water for 2 min. After rinsing in 75% ethanol for 2 min and 85%
ethanol for 3 min, the sections were then counterstained with 0.5%
eosin solution (Beijing Dingguo Changsheng Biotechnology Co., Ltd.)
for 1 min. Samples were then de-hydrated using two changes of 95%
ethanol and two changes of 100% ethanol, cleared in xylene and
mounted with neutral balsam (Beijing Dingguo Changsheng
Biotechnology Co., Ltd.).
Immunohistological and immunofluorescence
analyses
The paraffin-embedded sections were de-paraffinized
and re-hydrated as described above. Peroxidase activity was
inactivated by incubating samples for 30 min in 0.3% hydrogen
peroxide in methanol (Changsha Organic Reagents Factory, Changsha,
China). Samples were then processed for antigen retrieval by
heating in citrate buffer for 5 min at 100°C. After blocking in 10%
goat serum (cat. no. SP-9001; reagent A; Beijing Zhongshan Golden
Bridge Biotechnology Co., Ltd.) for 2 h at 37°C, sections were
immunostained with the following primary antibodies overnight at
4°C: ADA (1:500 dilution), ADK (1:50 dilution), GFAP (1:150
dilution), Ki67 (1:100 dilution), TP53 (1:70 dilution for ADK
co-labeling and 1:100 dilution for ADA co-labeling) or MGMT (1:100
dilution). After washing three times with MPBS, sections were
incubated with the appropriate HRP-conjugated secondary antibody
(cat. no. SP-9001, reagent B) for 30 min at 37°C. Antibodies were
stained using the DAB reagent. Subsequently, all sections were
counter-stained with hematoxylin and visualized using light
microscopy (BX-50; Olympus, Tokyo, Japan). Images were captured
using a LEICA DM5000B microscope (Leica Microsystems GmbH, Wetzlar,
Germany) at x400 magnification, and five photomicrographs were
randomly selected from each section. The number of immunopositive
cells was estimated by averaging the number of cells counted per
area.
For immunofluorescence analyses, goat serum-blocked
sections were incubated overnight at 4°C with primary antibodies
for ADA (1:30 dilution), ADK (1:20 dilution), p53 (1:70 or 1:100,
dilution) alone or in combination. After washing in MPBS, sections
were incubated for 3 h at room temperature with Alexa
fluor-conjugated secondary antibodies. Nuclei were counterstained
with DAPI. Images were randomly selected from various fields and
captured using a LEICA DM5000B microscope under ×200/400
magnification.
Western blot analysis
Total protein was extracted from cells using RIPA
lysis buffer containing 1 mM phenylmethylsulfonyl fluoride. The
protein concentration in each sample was measured using a BCA
protein assay kit according to manufacturer's instructions. Equal
amounts of protein (80 µg) were separated by 10% SDS-PAGE
and transferred onto polyvinylidine fluoride membranes. Membranes
were blocked with TBS containing 0.1% Tween-20 with 5% (w/v)
non-fat dry milk, followed by overnight incubation at 4°C with the
following primary antibodies: ADA (1:600 dilution) plus β-actin
(1:1,000 dilution) or ADK (1:1,000 dilution) plus β-actin (1:1,000
dilution). After washing three times with TBS-T, membranes were
incubated for 2 h at room temperature with HRP-labeled anti-rabbit
(1:1,000 dilution) and anti-mouse (1:1,000 dilution) secondary
antibodies. After washing in TBS-T, immunoreactive bands were
visualized using the ECL kit. To quantify protein levels, the
expression bands of target proteins were analyzed using a ChemiDoc
XRS gel imaging system (Image Lab 4.1; Bio-Rad Laboratories, Inc.,
Hercules, CA, USA). Densitometric values were used for statistical
analyses. The housekeeping protein β-actin was used as an internal
control.
RT-qPCR
Total RNA was extracted from brain tissues using an
RNA extraction kit (Beijing CW Biotech Co., Ltd.) following the
manufacturer's instructions. Total RNA (1 µg) was
reverse-transcribed using the HiFi-MMLV first-strand cDNA synthesis
kit, and qPCR was performed using an ABI 7500 sequence detection
system (Applied Biosystems Inc.). PCR amplification was performed
using UltraSYBR Mixture (with Rox) with the specific primers listed
in Table I (obtained from Beijing
CW Biotech Co., Ltd.). PCR reactions were performed in duplicate at
95°C for 10 min followed by 40 cycles of 95°C for 15 sec and 60°C
for 60 sec, with a final extension step at 72°C for 5 min. Each
experimental condition was repeated in triplicate. The relative
expression from amplified RNA samples was calculated using the
2−ΔΔCT method (17).
 | Table IPrimary sequences used for
quantitative polymerase chain reaction analysis. |
Table I
Primary sequences used for
quantitative polymerase chain reaction analysis.
| Target gene | Sequence | Length of amplified
product, bp |
|---|
| ADA | Forward,
5′-GGCTAACTACTCGCTCAACA-3′ | 127 |
| Reverse,
5′-CGCATTGATGTTCAGCCTTT-3′ |
| ADK | Forward,
5′-TGAAAACACAAGCCCAGGAG-3′ | 151 |
| Reverse,
5′-CTACAAGCATTACCATACCC-3′ |
| β-actin | Forward,
5′-CTCCATCCTGGCCTCGCTGT-3′ | 268 |
| Reverse,
5′-GCTGTCACCTTCACCGTTCC-3′ |
Statistical analysis
Values are expressed as the mean ± standard
deviation. All data were analyzed using SPSS 16.0 software (SPSS,
Inc., Chicago, IL, USA) and plotted using Microsoft Excel 2003
(Microsoft Inc., Redmont, WA, USA). Statistical significance was
determined using non-parametric tests, one-way analysis of variance
and Student's t tests. p<0.05 was considered to indicate
a statistically significant difference.
Results
Histological characteristics of glioma of
various grades
The clinical characteristics of patients with glioma
are presented in Table II. Among
the 45 patients included, 16 cases exhibited glioma-associated
epilepsy. None of the control subjects had a history of or current
epilepsy. According to the WHO tumor grading system (16), four cases were classified as Grade
I gliomas, 18 cases as Grade II, 17 cases as Grade III and six
cases were considered Grade IV (Table
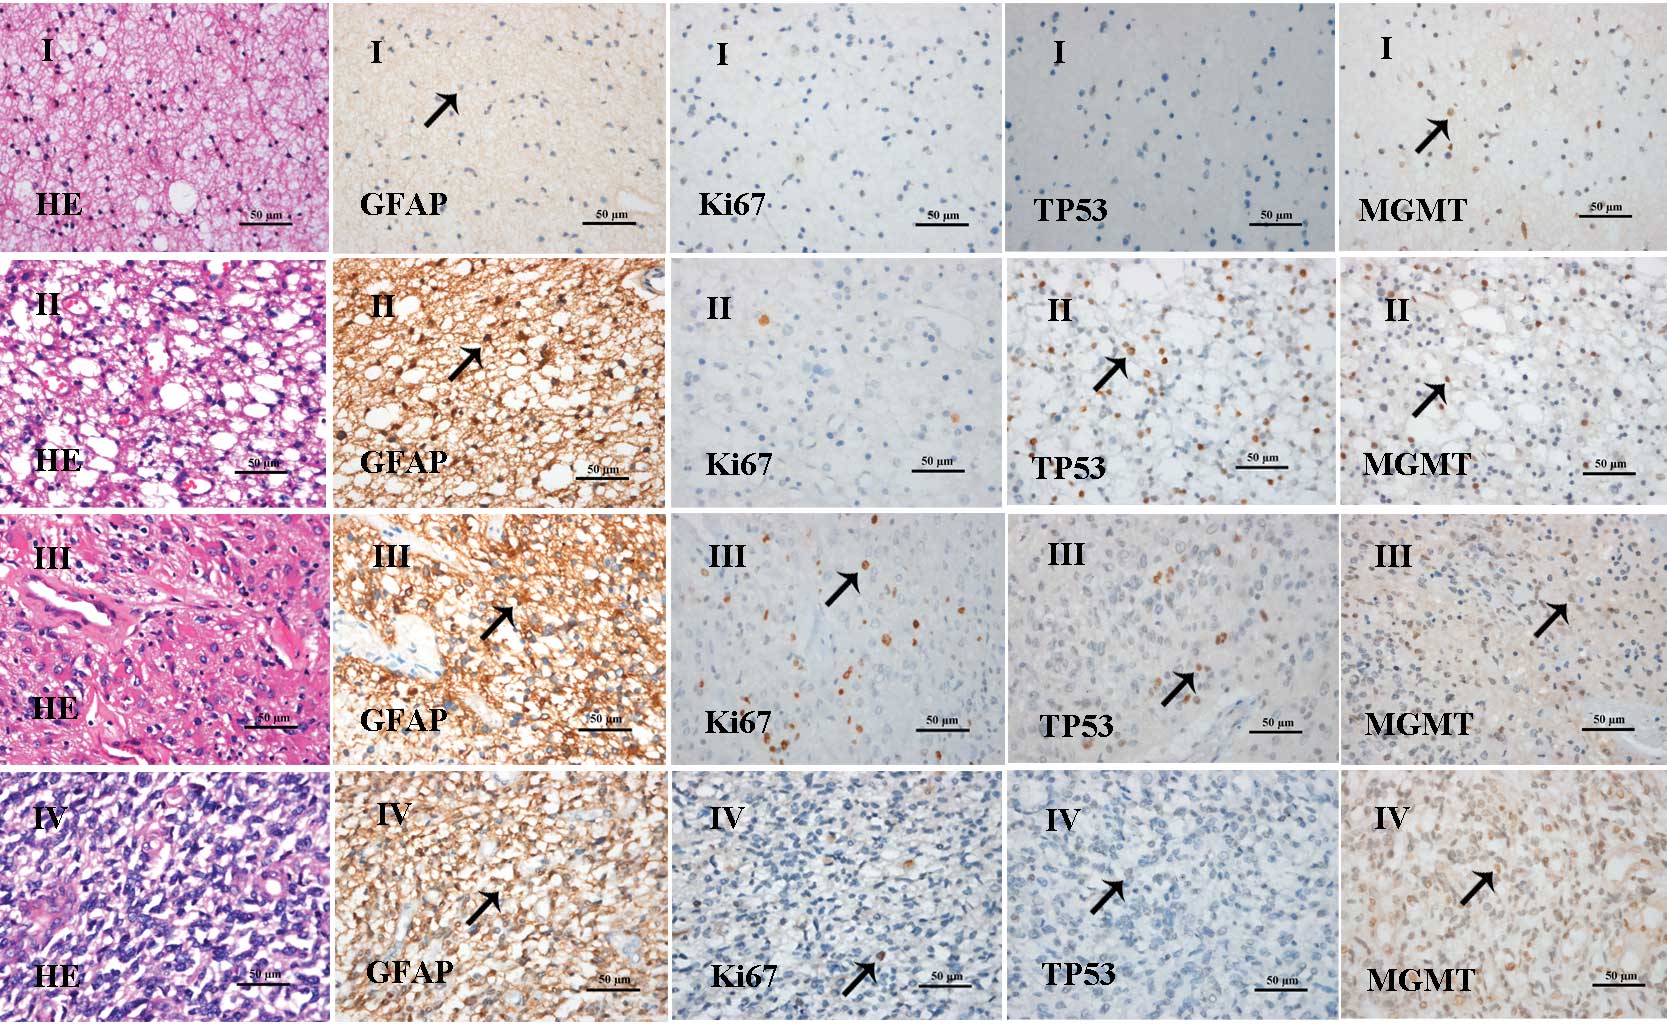
II). Representative histological images are shown in Fig. 1. Grade-I astrocytoma showed
slightly increased cell density and nuclear division was rarely
observed. Tumor cells were predominantly GFAP-positive and
MGMT-positive, with a number of cells positive for Ki67 staining.
In Grade-II oligodendroglioma, a moderate increase in tumor-cell
density was noted, with few nuclear pleomorphisms and rare nuclear
division. Tumor cells were largely GFAP-positive, TP53-positive and
MGMT-positive. In addition, a number of cells were positive for
Ki67 staining. Grade-III anaplastic astrocytoma exhibited local or
diffuse cell proliferation, anaplasia and excessive nuclear
division. Tumor cells were GFAP-positive, Ki67-positive and
MGMT-positive, and a number of cells were positive for TP53.
Grade-IV glioblastoma showed enhanced cell density, atypical
shapes, poor differentiation, marked nuclear pleomorphisms, nuclear
division, microvessel proliferation, thrombosis and tissue
necrosis. Tumor cells were predominantly GFAP-positive,
Ki67-positive and MGMT-positive.
| Table IIClinical characteristics of study
subjects. |
Table II
Clinical characteristics of study
subjects.
| Group | n | Age range
(years) | Gender (n)
| Tumor grade (n)
| Glioma-associated
epilepsy cases (n) |
|---|
| Male | Female | I | II | III | IV |
|---|
| Tumor tissues | 45 | 2–65 | 30 | 15 | 4 | 18 | 17 | 6 | 16 |
| Peritumoral
tissues | 14 | 18–55 | 5 | 9 | 1 | 8 | 4 | 1 | 8 |
| Normal control | 8 | 27–46 | 5 | 3 | – | – | – | – | 0 |
ADA and ADK are overexpressed in glioma
tissues from patients with various disease grades
The present study next evaluated the distribution of
ADA and ADK in tumor tissues obtained from patients with various
glioma grades. As shown in Fig. 2A and
B, ADA and ADK were expressed at low levels in control brain
tissues. Increased numbers of ADA-positive and ADK-positive cells
were observed in patients with Grade I-IV gliomas compared to those
in the normal tissues (Fig. 2C-H).
ADA was primarily distributed throughout the cytoplasm of tumor
cells, whereas ADK was expressed in the cytoplasm as well as the
nuclei. Statistical analyses showed that the number of ADA-positive
and ADK-positive cells was significantly upregulated in tumor
tissues from patients with different glioma grades compared to that
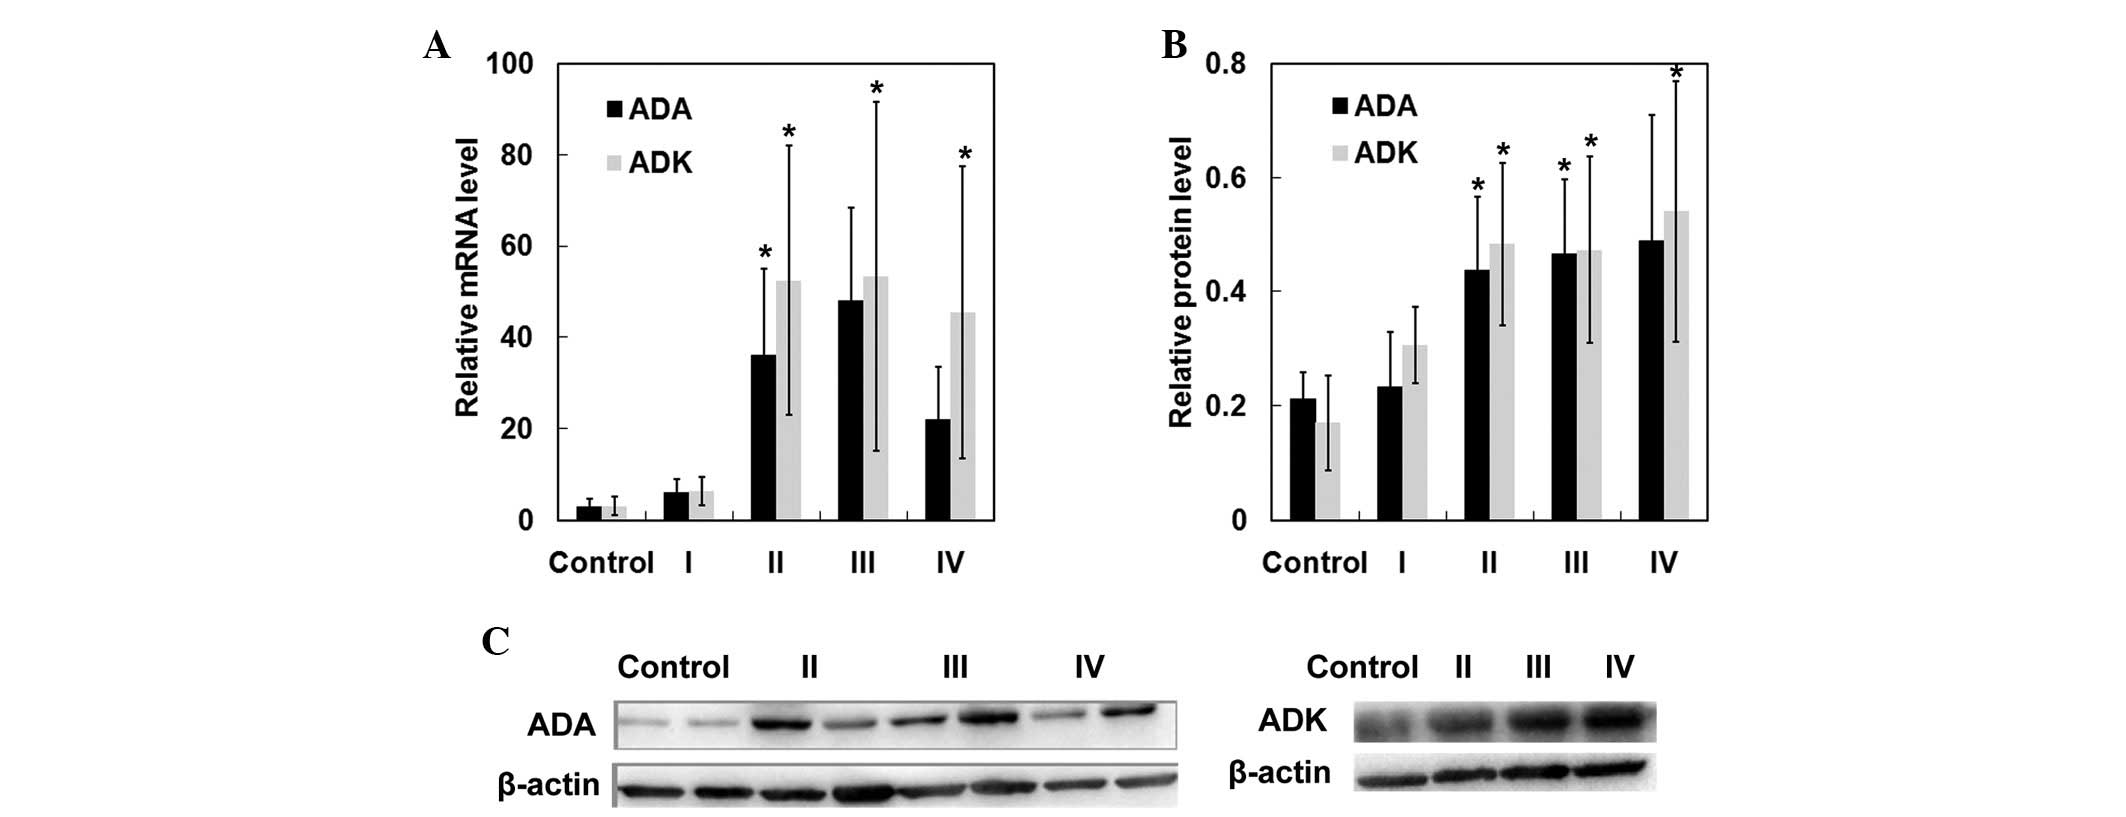
in brain tissues from control cases (p<0.05) (Fig. 2I). In addition, RT-qPCR and western
blot analyses further confirmed significant upregulation of ADA and
ADK in patients with Grade II–IV gliomas (Fig. 3). These results demonstrated that
ADA and ADK expression was upregulated in patients with Grade II–IV
gliomas.
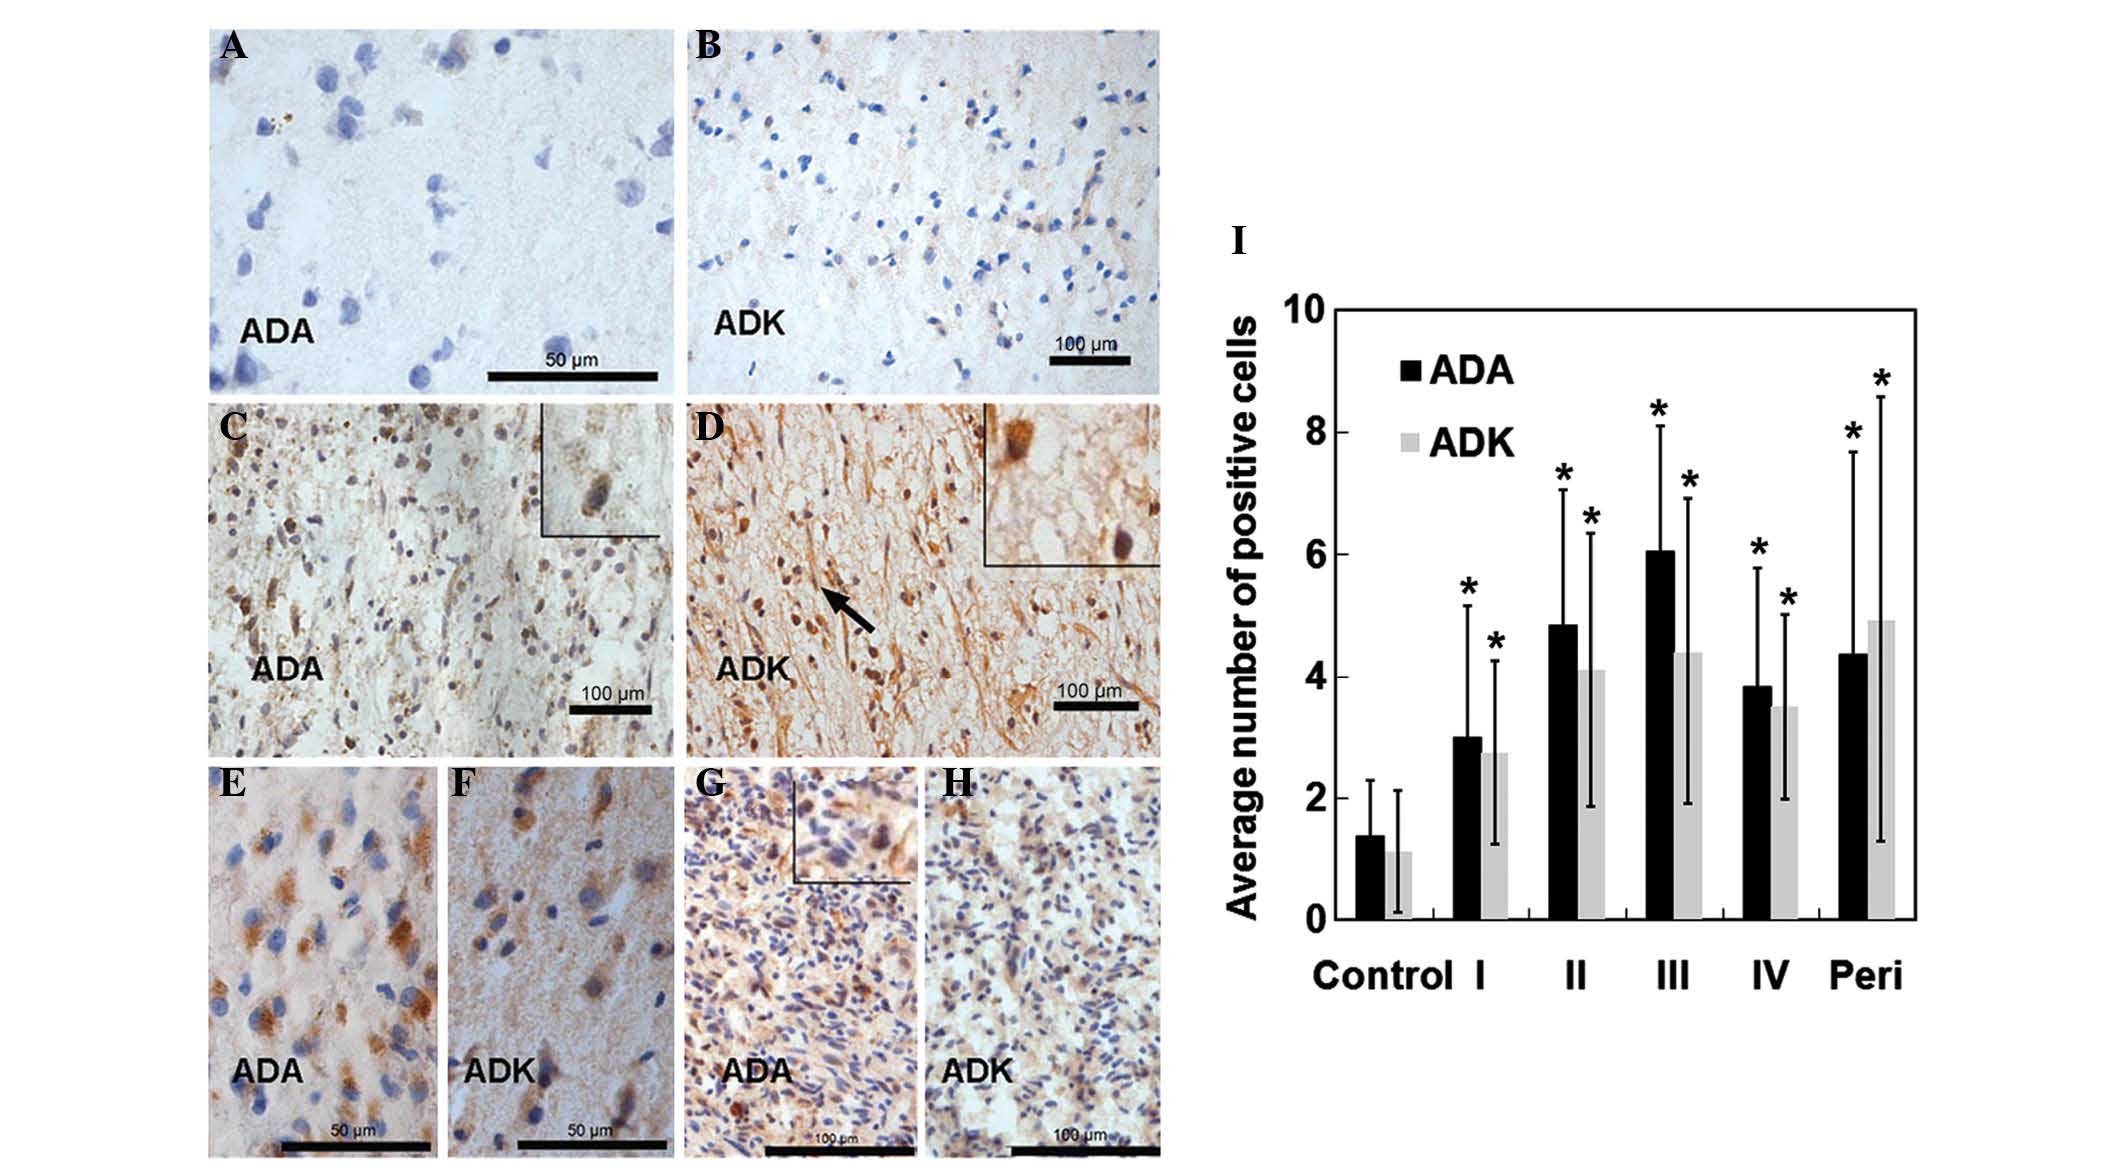 | Figure 2ADA and ADK expression in tissues from
patients with various grades of glioma or from non-glioma and
non-epileptic patients (normal controls). Normal brain tissues were
stained with either (A) anti-ADA or (B) anti-ADK antibodies. Tumor
tissues derived from patients with (C and D) Grade II, (E and F)
Grade III or (G and H) Grade IV gliomas were stained with (C, E and
G) anti-ADA or (D, F and H) anti-ADK antibodies (scale bars: 50
µm for A–F; 100 µm for G and H for. Magnification: A,
B, C, D, E, and F, and magnified boxes in C, D, and G x400; G and
H, x200). (I) Average number of immunopositive cells per field of
view. Values are expressed as the mean ± standard deviation.
*p<0.05 vs. control. Peri, peritumoral tissues
derived from patients with glioma; ADA, adenosine deaminase; ADK,
adenosine kinase. |
ADA and ADK are overexpressed in
peritumoral tissues
Similarly to that in glioma tissues, ADA and ADK
expression in peritumoral tissues derived from patients with glioma
(n=14) was markedly elevated compared with that in control tissues
(p<0.05) (Fig. 2B). Therefore,
immunofluorescence assays were performed to investigate tumor
invasion in peritumoral tissues. As revealed in Fig. 4, TP53-positive tumor cells were
observed in peritumoral tissues derived from glioma patients.
Furthermore, ADA and TP53 were co-expressed in numerous cells, with
ADA located in the cytoplasm and TP53 located in the nuclei.
Similarly, ADK and TP53 co-localization was observed, with TP53
located in the nuclei and ADK located in the cytoplasm and nuclei.
These results confirmed tumor invasion in peritumoral tissues.
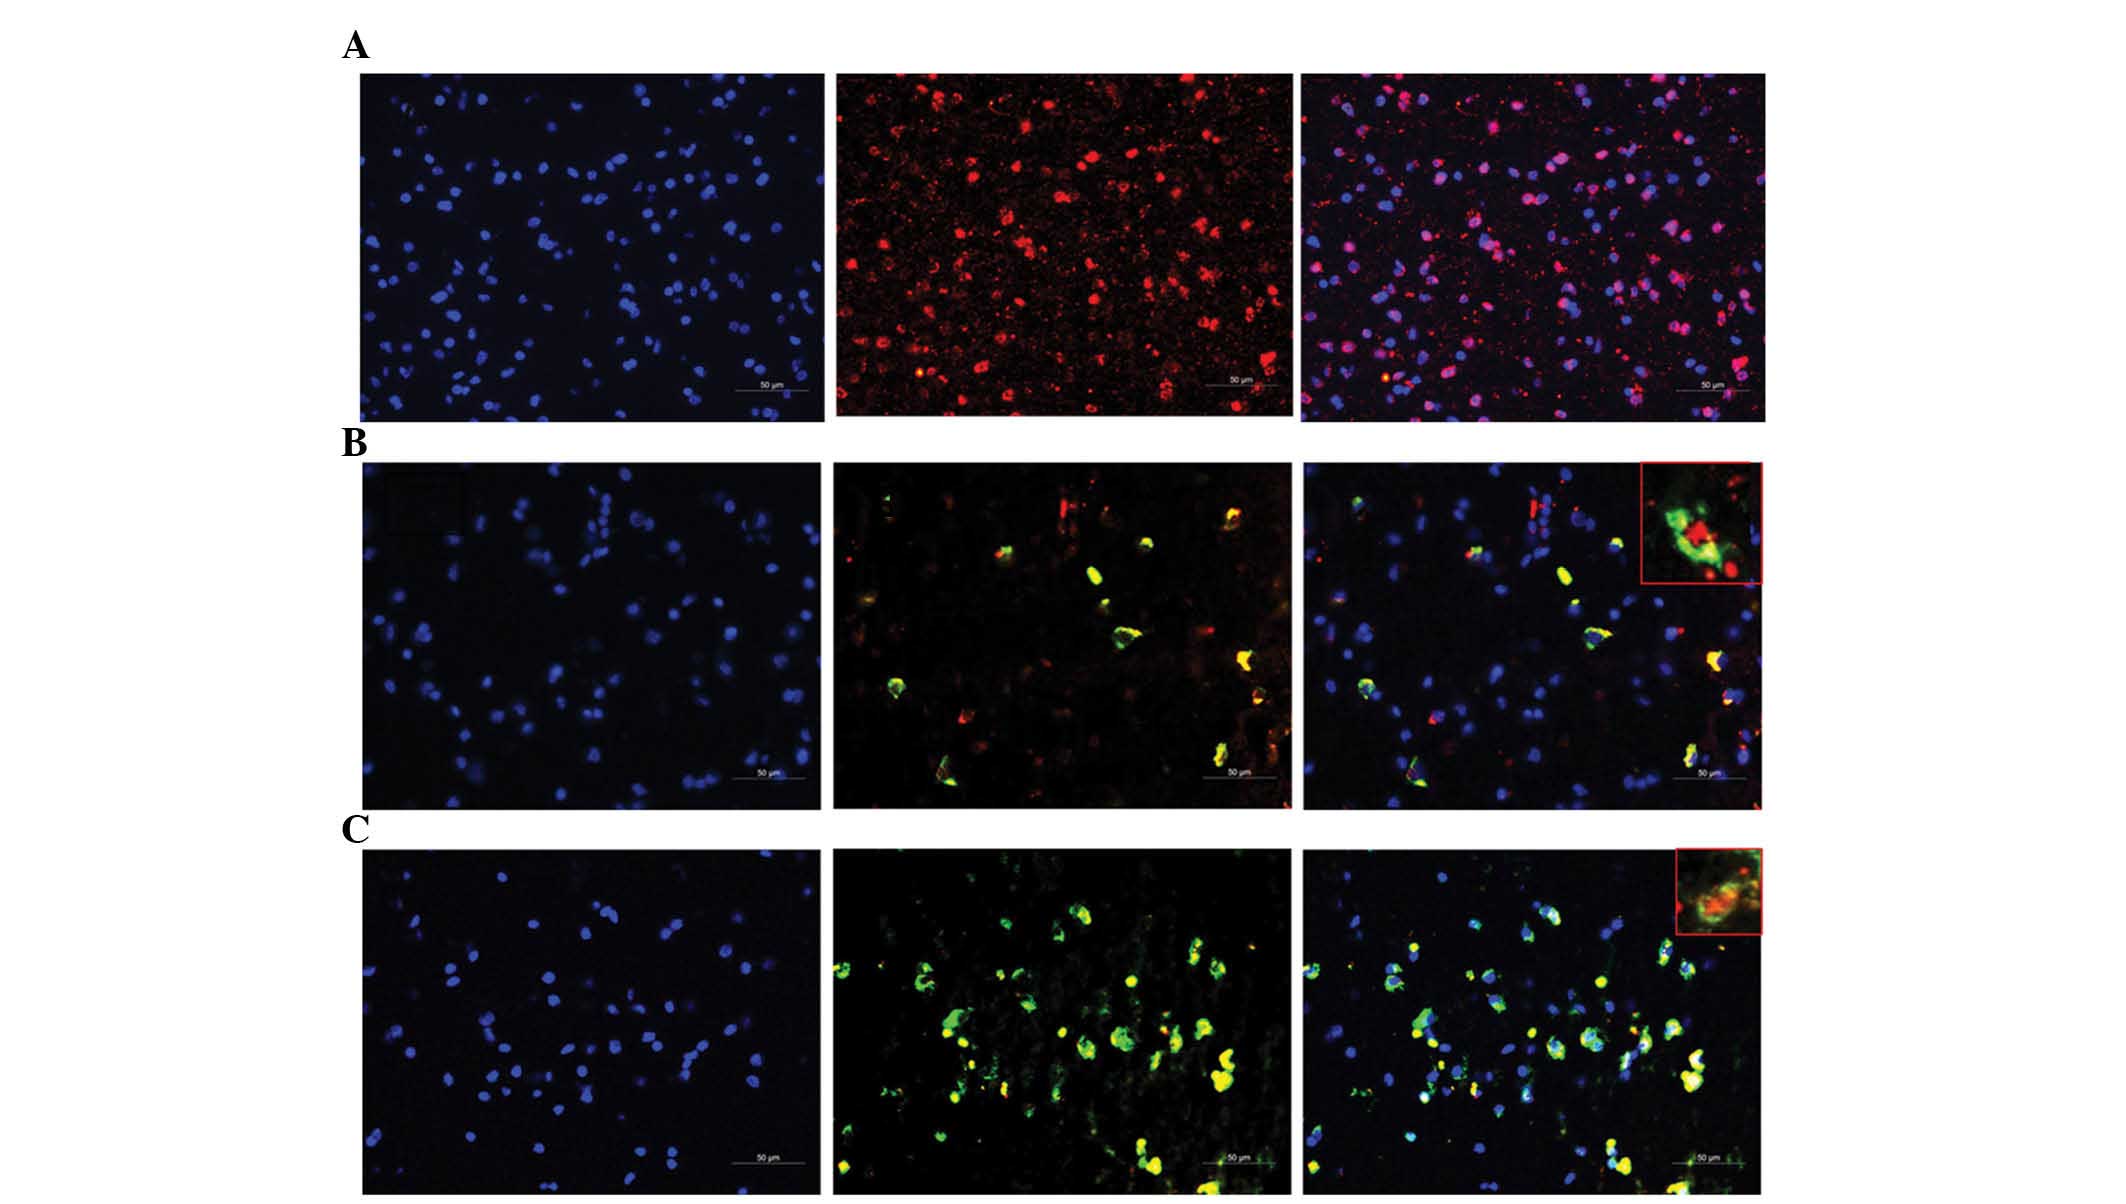 | Figure 4Immunostaining of peritumoral tissues
with anti-p53, anti-ADA, and anti-ADK antibodies (magnification,
×200; magnified boxes, ×400). Peritumoral tissues derived from 14
patients with glioma were immunostained with the anti-p53 antibody
alone (red) or co-stained with anti-p53 (red) and anti-ADA or
anti-ADK (green) antibodies. Nuclei were counterstained using DAPI
(blue). Representative immunostaining images for (A) p53 alone
(red), (B) ADA (green) and p53 (red), and (C) ADK (green) and p53
(red). Left-hand column, cell nuclei; middle column,
immunostaining; right-hand column, merged image, containing
magnified window (scale bars, 50 µm). ADA, adenosine
deaminase; ADK, adenosine kinase. |
ADA and ADK expression is increased in
peritumoral tissues from glioma patients with epilepsy vs.
non-epilepsy patients
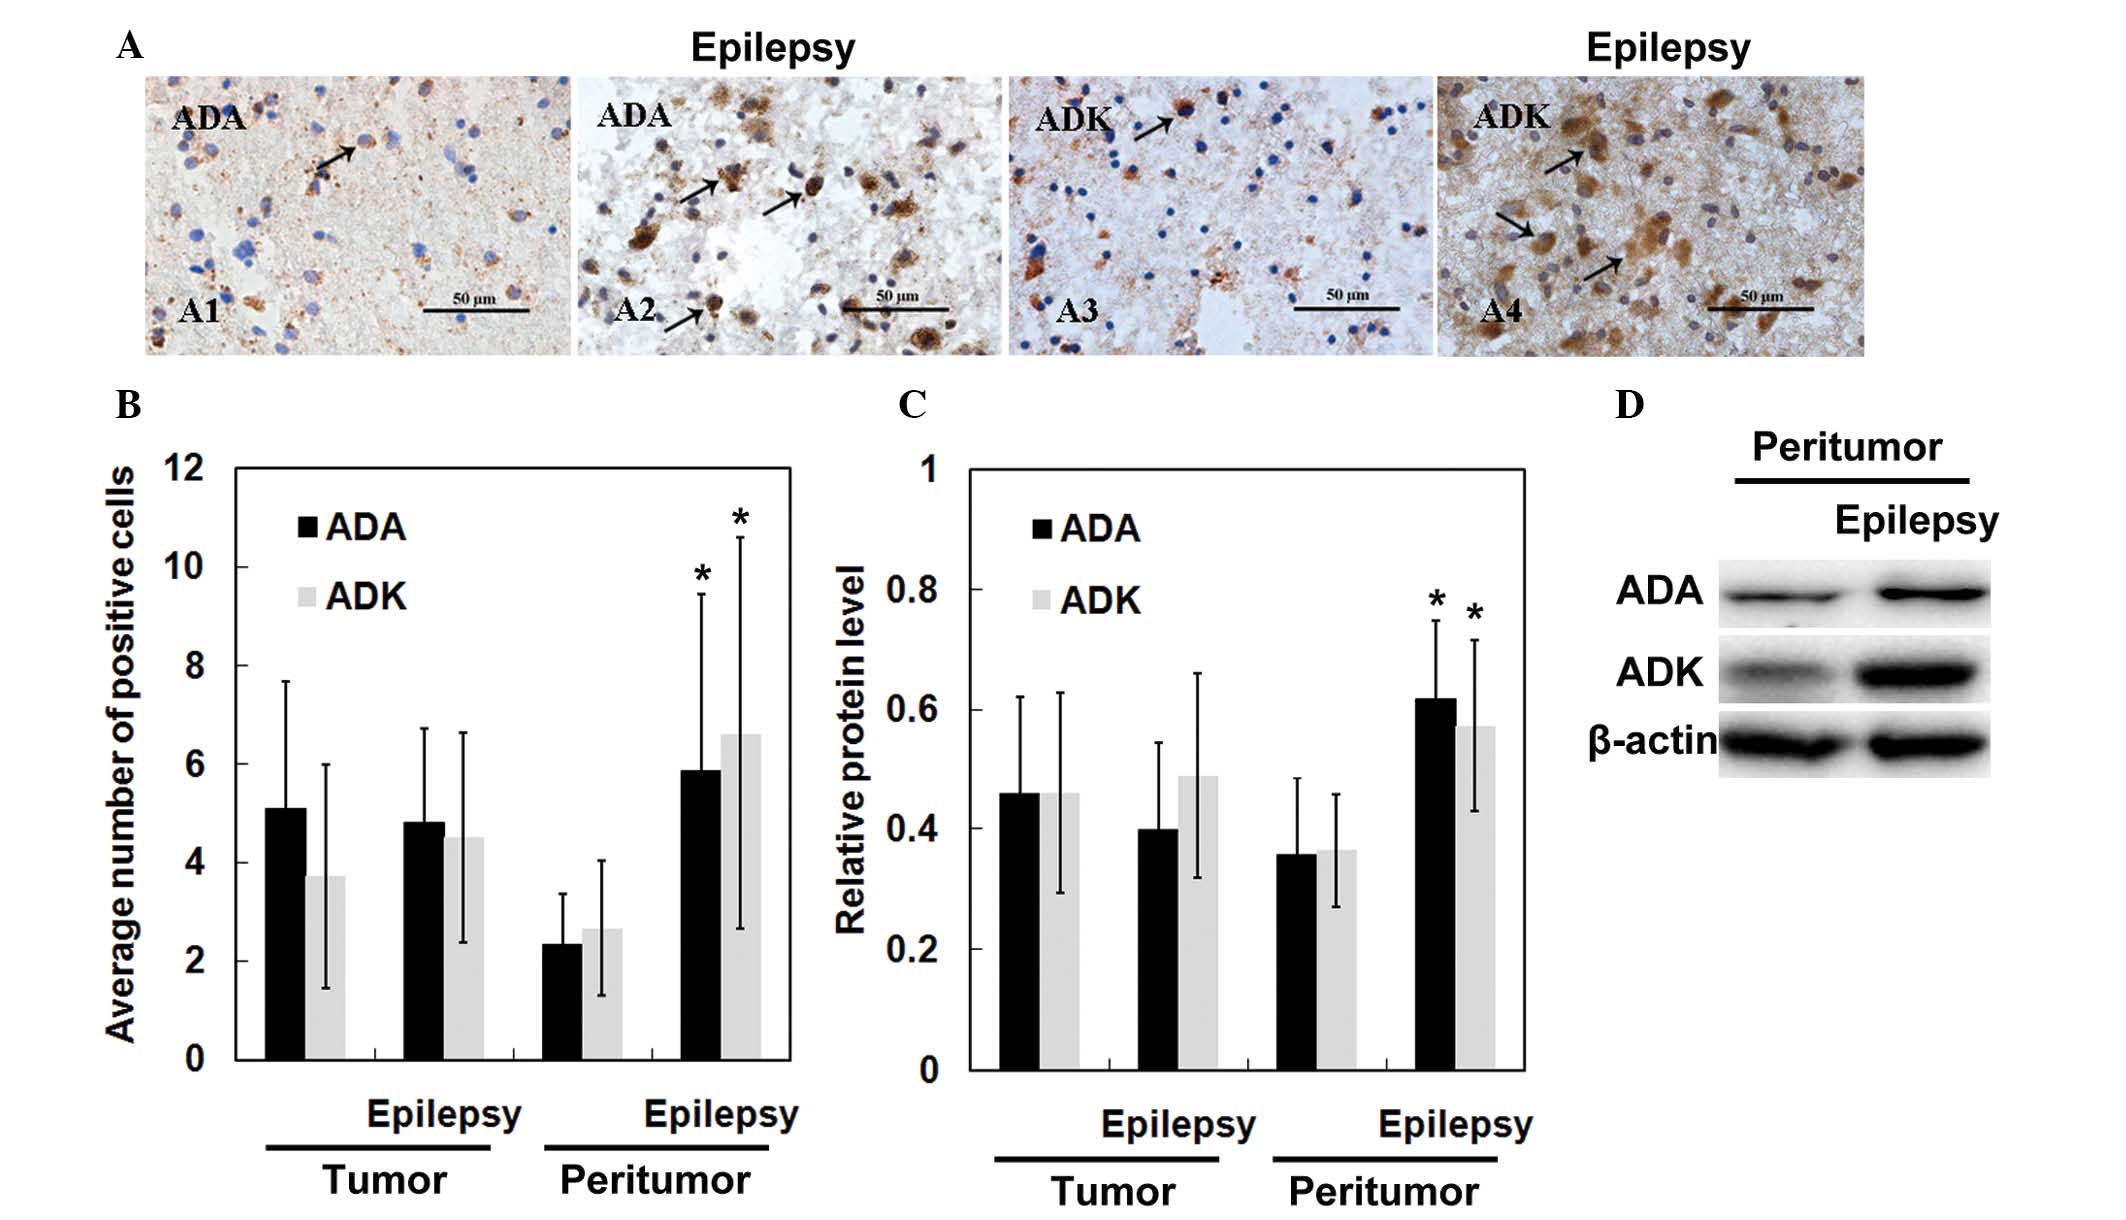
Finally, the present study compared ADA and ADK
expression between glioma patients with and without epilepsy. As
shown in Fig. 5A, the number of
ADA-positive or ADK-positive cells was markedly increased in
peritumoral tissues derived from glioma patients associated with
epilepsy compared to that in patients without epilepsy. Statistical
analyses revealed no significant differences in the number of
ADA-positive and ADK-positive cells in tumor tissues derived from
glioma patients with or without epilepsy (p>0.05) (Fig. 5B). However, the levels of ADA and
ADK tended to be higher in peritumoral tissues from patients
associated with epilepsy compared to those in glioma patients
without epilepsy (p<0.05). Furthermore, western blot analysis
confirmed upregulated ADA and ADK expression in peritumoral tissues
derived from patients with epilepsy (Fig. 5C and D).
Discussion
The present study assessed ADA and ADK expression in
tumor tissues and peritumoral tissues derived from glioma patients
and compared their expression levels with those in brain tissues
from normal control subjects. In addition, ADA and ADK levels were
compared between glioma patients with and without epilepsy.
Adenosine is an endogenous mediator of brain
function (10,11). Metabolic disorders of purine
metabolism, including adenosine metabolism, affect the nervous
system (18) and are linked to
glioma in humans (19). Castillo
et al (20) reported that
moderate hypoxia modulates adenosine receptors in C6 glioma cells,
which suggests that the activation of endogenous adenosine
receptors occurs during hypoxia.
ADA and ADK are capable of regulating adenosine
levels and may thus contribute to abnormal adenosine
metabolism-induced diseases. ADA has a critical role in purine
metabolism by catalyzing the deamination of adenosine and
deoxyadenosine. In a study on C6 glioma cells, ADA was demonstrated
to eliminate adenosine-mediated growth inhibition of cells
(21). Furthermore, ADK, another
enzyme associated with adenosine metabolism, has also been shown to
be associated with human gliomas. ADK expression was found to be
significantly increased in human astrocytic tumors and peritumoral
tissues compared to levels detected in normal white matter and
normal cortices (14).
In the present study, increased ADA and ADK
expression was noted in tumor tissues and peritumoral tissues
compared to that in normal control tissues, and these findings were
consistent with those from a previous study (14). Peritumoral tissues containing
invading tumor cells were found to be immunopositive for TP53.
Furthermore, ADA and ADK levels were found to be upregulated
particularly in patients with Grade II–IV gliomas. These results
demonstrated that ADA and ADK levels may be associated with glioma
pathogenesis and progression. However, the underlying mechanism of
the roles of ADK and ADA in glioma requires further study.
Epilepsy is a frequent clinical manifestation of
glioma. Considering the anti-convulsive role of endogenous
adenosine, modulation of the adenosinergic system has been
suggested to be a potential target for the treatment of epilepsy
(22). A previous study
demonstrated significantly elevated ADK expression in peritumoral
infiltrated tissues from patients with epilepsy compared to that in
patients without epilepsy (14).
In addition, ADA has been shown to be involved in controlling
seizure development in zebrafish, and anti-epileptic drugs
administered during these acute seizure episodes in the zebrafish
prevented changes in adenosine desamination (15). In accordance with these
observations, the present study found that ADA and ADK were
upregulated in peritumoral tissues from patients with epilepsy, as
compared to those in glioma patients without epilepsy. However, no
significant differences were observed in the number of ADA- or
ADK-positive cells in tumor tissues from epileptic and
non-epileptic glioma patients. It is possible that increased ADA
and ADK expression may induce excessive adenosine degradation,
resulting in a reduced inhibitory role of adenosine and subsequent
epilepsy attacks in glioma patients (23,24).
Adenosine augmentation therapies (AATs), which
upregulate the adenosine concentration in the brain and thereby
help to control the occurrence of seizures, have been demonstrated
to be effective in managing epilepsy (25). ADA and ADK have critical roles in
the metabolism of adenosine as well as the development of epilepsy.
Accumulating evidence suggested that ADK may represent a
therapeutic target for AATs. For example, upregulation of the local
adenosine concentration by transplantation of encapsulated
adenosine-releasing cells, including kidney fibroblasts (26), mouse myoblasts (27) and mouse embryonic stem cells
(28,29), into the lateral ventricle acts
against brain damage and epilepsy by disrupting ADK gene
expression. Using zebrafish as a model organism, ADA was found to
be involved in the development of epilepsy (15). In analogy with these findings, the
present study also indicated that ADA was involved in the
development and progression of human epilepsy. Hence, ADA may be a
novel target for AATs. Administration of ADA or ADK inhibitors may
also be a feasible approach for anti-epilepsy therapies. To the
best of our knowledge, the present study was the first to report
ADA upregulation in glioma-associated epilepsy.
In conclusion, the present study demonstrated that
ADA and ADK levels were upregulated in patients with gliomas with
and without epilepsy. Furthermore, ADA and ADK expression was
upregulated in the peritumor tissues of patients with
glioma-associated epilepsy as compared with those in non-epileptic
patients. These findings suggested an essential role for adenosine
metabolism in regulating glioma pathogenesis and progression as
well as in glioma-associated epilepsy.
Acknowledgments
The present study was supported by a grant from the
Department of Science and Technology of Hunan Province, P.R. China
(no. 2013FJ4367).
References
|
1
|
Pace A, Bove L, Innocenti P, Pietrangeli
A, Carapella CM, Oppido P, Raus L, Occhipinti E and Jandolo B:
Epilepsy and gliomas: Incidence and treatment in 119 patients. J
Exp Clin Cancer Res. 17:479–482. 1998.
|
|
2
|
Behin A, Hoang-Xuan K, Carpentier AF and
Delattre JY: Primary brain tumours in adults. Lancet. 361:323–331.
2003. View Article : Google Scholar : PubMed/NCBI
|
|
3
|
Pallud J, Audureau E, Blonski M, Sanai N,
Bauchet L, Fontaine D, Mandonnet E, Dezamis E, Psimaras D, Guyotat
J, et al: Epileptic seizures in diffuse low-grade gliomas in
adults. Brain. 137:449–462. 2014. View Article : Google Scholar : PubMed/NCBI
|
|
4
|
Berntsson SG, Malmer B, Bondy ML, Qu M and
Smits A: Tumor-associated epilepsy and glioma: Are there common
genetic pathways? Acta Oncol. 48:955–963. 2009. View Article : Google Scholar : PubMed/NCBI
|
|
5
|
Lynam LM, Lyons MK, Drazkowski JF, Sirven
JI, Noe KH, Zimmerman RS and Wilkens JA: Frequency of seizures in
patients with newly diagnosed brain tumors: A retrospective review.
Clin Neurol Neurosurg. 109:634–638. 2007. View Article : Google Scholar : PubMed/NCBI
|
|
6
|
Stieber VW: Low-grade gliomas. Curr Treat
Options Oncol. 2:495–506. 2001. View Article : Google Scholar
|
|
7
|
Lee MC, Kim GM, Woo YJ, Kim MK, Kim JH,
Nam SC, Suh JJ, Chung WK, Lee JS, Kim HI, et al: Pathogenic
significance of neuronal migration disorders in temporal lobe
epilepsy. Hum Pathol. 32:643–648. 2001. View Article : Google Scholar : PubMed/NCBI
|
|
8
|
Aronica E, Gorter JA, Jansen GH, Leenstra
S, Yankaya B and Troost D: Expression of connexin 43 and connexin
32 gap-junction proteins in epilepsy-associated brain tumors and in
the perilesional epileptic cortex. Acta Neuropathol. 101:449–459.
2001.PubMed/NCBI
|
|
9
|
Yuen TI, Morokoff AP, Bjorksten A, D'Abaco
G, Paradiso L, Finch S, Wong D, Reid CA, Powell KL, Drummond KJ, et
al: Glutamate is associated with a higher risk of seizures in
patients with gliomas. Neurology. 79:883–889. 2012. View Article : Google Scholar : PubMed/NCBI
|
|
10
|
Boison D: Role of adenosine in status
epilepticus: A potential new target? Epilepsia. 54(Suppl 6): 20–22.
2013. View Article : Google Scholar : PubMed/NCBI
|
|
11
|
Boison D: Adenosine and seizure
termination: Endogenous mechanisms. Epilepsy Curr. 13:35–37. 2013.
View Article : Google Scholar : PubMed/NCBI
|
|
12
|
Hargus NJ, Jennings C, Perez-Reyes E,
Bertram EH and Patel MK: Enhanced actions of adenosine in medial
entorhinal cortex layer II stellate neurons in temporal lobe
epilepsy are mediated via A(1)-receptor activation. Epilepsia.
53:168–176. 2012. View Article : Google Scholar :
|
|
13
|
Boison D: Adenosine kinase: Exploitation
for therapeutic gain. Pharmacol Rev. 65:906–943. 2013. View Article : Google Scholar : PubMed/NCBI
|
|
14
|
de Groot M, Iyer A, Zurolo E, Anink J,
Heimans JJ, Boison D, Reijneveld JC and Aronica E: Overexpression
of ADK in human astrocytic tumors and peritumoral tissue is related
to tumor-associated epilepsy. Epilepsia. 53:58–66. 2012. View Article : Google Scholar :
|
|
15
|
Siebel AM, Piato AL, Schaefer IC, Nery LR,
Bogo MR and Bonan CD: Antiepileptic drugs prevent changes in
adenosine deamination during acute seizure episodes in adult
zebrafish. Pharmacol Biochem Behav. 104:20–26. 2013. View Article : Google Scholar : PubMed/NCBI
|
|
16
|
Louis DN, Ohgaki H, Wiestler OD, Cavenee
WK, Burger PC, Jouvet A, Scheithauer BW and Kleihues P: The 2007
WHO classification of tumours of the central nervous system. Acta
Neuropathol. 114:97–109. 2007. View Article : Google Scholar : PubMed/NCBI
|
|
17
|
Livak KJ and Schmittgen TD: Analysis of
relative gene expression data using real-time quantitative PCR and
the 2(-Delta Delta C(T)) Method. Methods. 25:402–408. 2001.
View Article : Google Scholar
|
|
18
|
Jinnah HA, Sabina RL and Van Den Berghe G:
Metabolic disorders of purine metabolism affecting the nervous
system. Handb Clin Neurol. 113:1827–1836. 2013. View Article : Google Scholar : PubMed/NCBI
|
|
19
|
Bardot V, Dutrillaux AM, Delattre JY, Vega
F, Poisson M, Dutrillaux B and Luccioni C: Purine and pyrimidine
metabolism in human gliomas: Relation to chromosomal aberrations.
Br J Cancer. 70:212–218. 1994. View Article : Google Scholar : PubMed/NCBI
|
|
20
|
Castillo CA, León D, Ruiz MA, Albasanz JL
and Martín M: Modulation of adenosine A1 and A2A receptors in C6
glioma cells during hypoxia: Involvement of endogenous adenosine. J
Neurochem. 105:2315–2329. 2008. View Article : Google Scholar : PubMed/NCBI
|
|
21
|
Ohkubo S, Nagata K and Nakahata N:
Adenosine uptake-dependent C6 cell growth inhibition. Eur J
Pharmacol. 577:35–43. 2007. View Article : Google Scholar : PubMed/NCBI
|
|
22
|
Swiader MJ, Kotowski J and Łuszczki JJ:
Modulation of adenosinergic system and its application for the
treatment of epilepsy. Pharmacol Rep. 66:335–342. 2014. View Article : Google Scholar : PubMed/NCBI
|
|
23
|
Pence S, Erkutlu I, Kurtul N, Bosnak M,
Alptekin M and Tan U: Antiepileptogenic effects of glutathione
against increased brain ADA in PTZ-induced epilepsy. Int J
Neurosci. 119:616–629. 2009. View Article : Google Scholar : PubMed/NCBI
|
|
24
|
Shen HY, Sun H, Hanthorn MM, Zhi Z, Lan
JQ, Poulsen DJ, Wang RK and Boison D: Overexpression of adenosine
kinase in cortical astrocytes and focal neocortical epilepsy in
mice. J Neurosurg. 120:628–638. 2014. View Article : Google Scholar :
|
|
25
|
Boison D: Adenosine augmentation therapies
(AATs) for epilepsy: Prospect of cell and gene therapies. Epilepsy
Res. 85:131–141. 2009. View Article : Google Scholar : PubMed/NCBI
|
|
26
|
Huber A, Padrun V, Déglon N, Aebischer P,
Möhler H and Boison D: Grafts of adenosine-releasing cells suppress
seizures in kindling epilepsy. Proc Natl Acad Sci USA.
98:7611–7616. 2001. View Article : Google Scholar : PubMed/NCBI
|
|
27
|
Güttinger M, Padrun V, Pralong WF and
Boison D: Seizure suppression and lack of adenosine A1 receptor
desensitization after focal long-term delivery of adenosine by
encapsulated myoblasts. Exp Neurol. 193:53–64. 2005. View Article : Google Scholar : PubMed/NCBI
|
|
28
|
Güttinger M, Fedele D, Koch P, Padrun V,
Pralong WF, Brüstle O and Boison D: Suppression of kindled seizures
by paracrine adenosine release from stem cell-derived brain
implants. Epilepsia. 46:1162–1169. 2005. View Article : Google Scholar : PubMed/NCBI
|
|
29
|
Fedele DE, Koch P, Scheurer L, Simpson EM,
Möhler H, Brüstle O and Boison D: Engineering embryonic stem cell
derived glia for adenosine delivery. Neurosci Lett. 370:160–165.
2004. View Article : Google Scholar : PubMed/NCBI
|