Introduction
Neuroblastoma (NB) is a cancer of the peripheral
sympathetic neurons, which occurs during childhood, and the
percentage of NB of all pediatric oncology-associated mortality is
~10% worldwide (1). NB
predominately occurs in young children, of which the average age is
17 months (2) NB derives from
undifferentiated neural crest cells and metastasizes to other
organs (3). Patients with NB have
poor prognosis with a 5-year survival rate of no more than 30%
(4).
With the development of the field of biology,
increasing numbers of markers correlated with NB have been
identified. MYCN is a well-known prognostic marker of NB
(5), and MYCN amplification
is the most significant molecular marker of risk in NB (6). Tang et al demonstrated that
patients with NB exhibiting low expression levels of MYCN
and TrkA have a 5-year survival rate of 63.7%, whereas the
5-year survival rate of patients with high expression levels of the
two is 88.1% (7). In addition, the
alternative TrkAIII splice variant is involved in the
pathogenesis of advanced stage human NB through microtubules, which
are involved in the promotion and maintenance of NB cells (8). In addition to these reports,
NCYM has been observed to act as a cis-antisense gene
of MYCN, and contributes to the stabilization of MYCN
in human NB by inhibiting GSK3β (9). NCYM, co-amplified with
MYCN, is involved in the pathogenesis of NB (10). Although several studies have
reported that MYCN is key in the pathogenesis of NB, the
genes correlated with MYCN amplification remain to be fully
elucidated. Therefore, the present study aimed to examine the
molecular mechanism of MYCN amplification in NB.
Wu et al analyzed expression profiles using
Ingenuity Pathway Analysis, and found that the aryl hydrocarbon
receptor downregulates the expression of MYCN through the
mediation of E2F1 in the protein-protein interaction (PPI)
network, and further confirmed that the aryl hydrocarbon receptor
regulates the activity of the MYCN promoter and results in
the downregulated expression of MYCN (11). To identify more genes correlated
with MYCN in the present study, the determination of
differentially expressed genes (DEGs) between NB cell lines
exhibiting MYCN amplification (MYCN amplification
group) and NB cell lines with a normal MYCN copy number
(control group) were identified. Hierarchical clustering and Gene
Ontology (GO) analysis were performed for these DEGs, and a
protein-protein interaction (PPI) network was constructed for the
DEGs to identify the key genes associated with MYCN. Kyoto
Encyclopedia of Genes and Genomes (KEGG) pathway enrichment
analysis was also performed for the DEGs in PPI network. The
correlation of MYCN and the key gene associated with to
MYCN was determined using Pearson's correlation coefficient,
in order to investigate whether their association was synergistic
or antagonistic.
Materials and methods
Microarray data
Microarray data (accession. no. GSE53371) were
downloaded from the Gene Expression Omnibus (GEO, http://www.ncbi.nlm.nih.gov/geo/) (11). The microarray platform of GSE53371
was GPL887 Agilent-012097 Human 1A Microarray (V2) G4110B (Feature
Number version; Agilent Technologies, Inc., Santa Clara, CA, USA).
A total of 20 samples were available, which included 10 NB cell
lines with MYCN amplification and 10 NB cell lines with a
normal MYCN copy number.
Data preprocessing and identification of
DEGs
Normalization of the microarray data were performed
using a median normalization method (12). The DEGs were identified using the
Linear Models for Microarray Data (Limma) package (13). The raw P-value was adjusted into a
false discovery rate (FDR) using the Benjamini & Hochberg
method (14,15). The genes with an FDR <0.05 and
|log2FC (fold change)|>1 were considered
significantly different between the MYCN amplification group
and the control group.
Hierarchical clustering analysis of
DEGs
Based on the Euclidean distance, which is the actual
distance between two points that may be calculated using the
Pythagorean formula, hierarchical clustering analysis (16) was performed to evaluate the sample
specificity. In the hierarchical clustering analysis, the
expression value of the DEGs were extracted, and subsequent
analysis was performed of the DEGs using the Pheatmap package in R
language (http://cran.r-project.org/web/packages/pheatmap/index.html)
(16,17).
Functional enrichment analysis of
DEGs
The Database for Annotation, Visualization and
Integrated Discovery (DAVID) is a comprehensive functional
annotation tool (18). Gene
Ontology (GO) analysis was performed for the DEGs using the DAVID
database (http://david.abcc.ncifcrf.gov/). The raw P-value was
adjusted into the FDR using Benjamini & Hochberg's method and
an FDR <0.05 was selected as the cut-off criterion.
Construction of the PPI network
The Search Tool for the Retrieval of Interacting
Genes (STRING) database is used to collect and predict PPI
associations (19). In the present
study, a PPI network was constructed for the DEGs using STRING, and
a confidence score >0.4 was selected as the cut-off criterion.
Subsequent visualization of the PPI network was performed using
Cytoscape (http://cytoscape.org/) (20).
Pathway analysis of DEGs in the PPI
network
The WEB-based GEne SeT AnaLysis Toolkit (WebGestalt)
aims to examine large sets of genes, and is used for functional
enrichment analysis, including GO enrichment, pathway enrichment
and transcription factor analysis, by integrating functional
categories (21,22). KEGG (http://www.genome.ad.jp/kegg) pathway enrichment
analysis was performed for the DEGs in the PPI network using
WebGestalt, and P<0.05 was selected as the cut-off
criterion.
Correlation analysis
Based on the PPI network, the expression values of
the genes correlated directly with MYCN were extracted, and
correlation analysis was performed using the expression values of
the genes. For this correlation analysis, the correlation of
MYCN and the key gene associated with MYCN was
determined using Pearson's correlation coefficient (23) with SPSS 13.0 (SPSS Inc., Chicago,
IL, USA).
Results
Identification of DEGs
In total, 172 DEGs between the MYCN
amplification group and the control group were identified, which
included 137 downregulated DEGs and 35 upregulated DEGs.
Hierarchical clustering analysis of the
DEGs
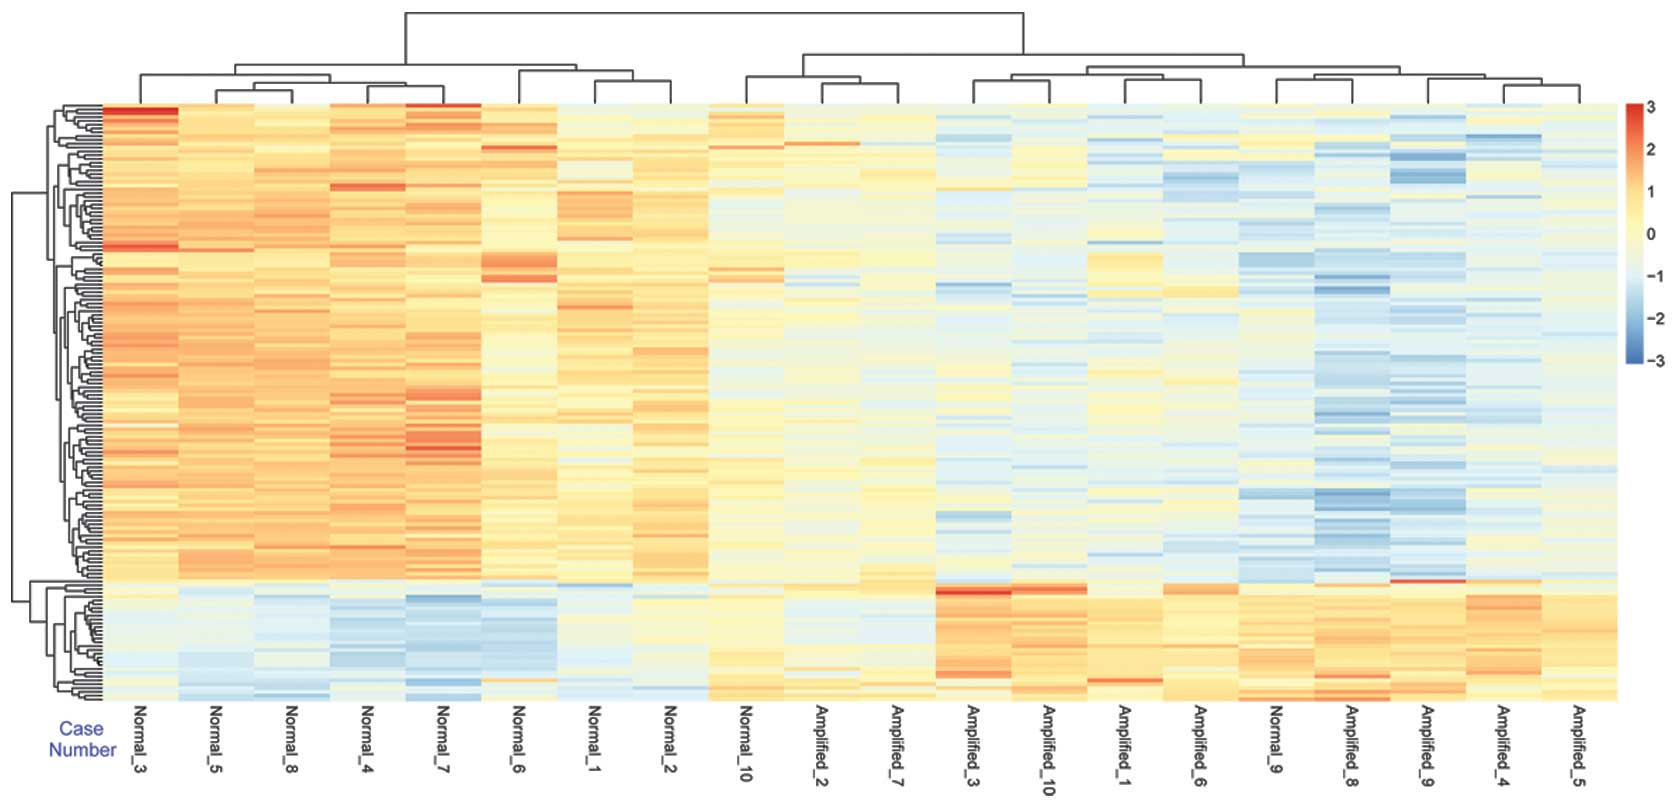
Following hierarchical clustering analysis, there
were two distinct gene clusters identified, including the
MYCN amplification cluster and control cluster (Fig. 1). These results suggested that
there were two different gene expression patterns with marked color
differences, which were available for use to distinguish between
the MYCN amplification samples and the control samples.
GO enrichment analysis of the DEGs
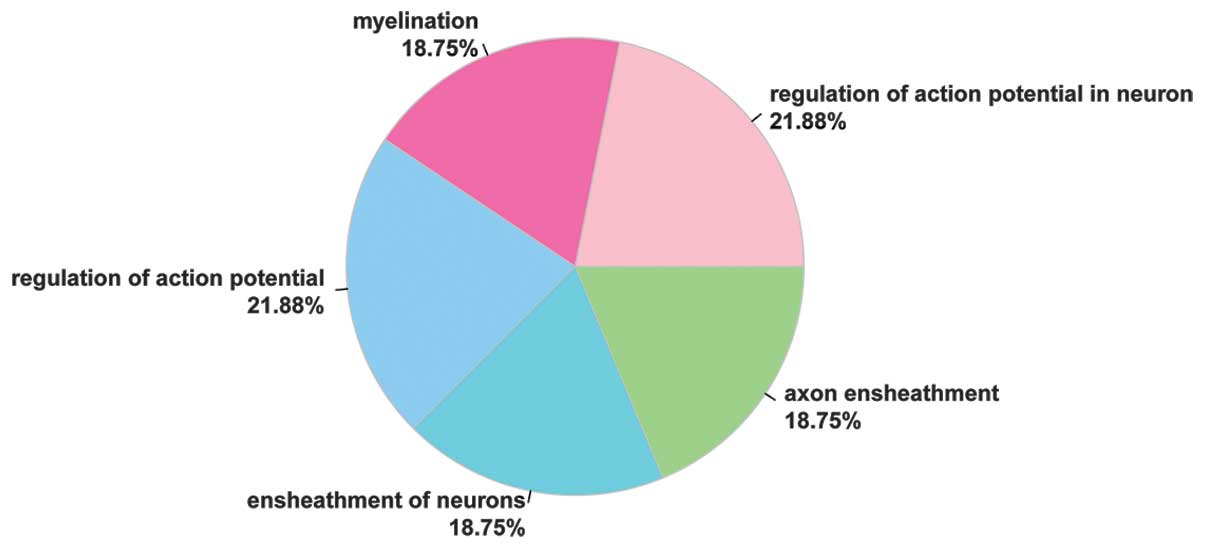
GO enrichment analysis revealed that the five
enriched terms were as follows: Regulation of action potential in
neuron (P=1.24E-05), myelination (P=2.95E-05), regulation of action
potential (P=4.71E-05), ensheathment of neurons (P=4.85E-05) and
axon ensheathment (P=4.85E-05), as listed in Table I. The KCNMB4, PLP1,
CLDN1, LGI4, MAL, PMP22 and
GAL3ST1 genes were involved in the regulation of action
potential in neuron biological process, and the percentage of the
genes enriched in this term was 21.88% (Fig. 2).
 | Table ITop five most enriched GO terms for
the differentially expressed genes. |
Table I
Top five most enriched GO terms for
the differentially expressed genes.
| GO ID | GO term | Gene count | P-value | FDR | Gene |
|---|
| GO:0019228 | Regulation of
action potential in neuron | 7 | 1.24E-05 | 0.015898 | KCNMB4, PLP1,
CLDN1, LGI4, MAL, PMP22, GAL3ST1 |
| GO:0042552 | Myelination | 6 | 2.95E-05 | 0.018878 | PLP1, CLDN1,
LGI4, MAL, PMP22, GAL3ST1 |
| GO:0001508 | Regulation of
action potential | 7 | 4.71E-05 | 0.020080 | KCNMB4, PLP1,
CLDN1, LGI4, MAL, PMP22, GAL3ST1 |
| GO:0007272 | Ensheathment of
neurons | 6 | 4.85E-05 | 0.015539 | PLP1, CLDN1,
LGI4, MAL, PMP22, GAL3ST1 |
| GO:0008366 | Axon
ensheathment | 6 | 4.85E-05 | 0.015539 | PLP1, CLDN1,
LGI4, MAL, PMP22, GAL3ST1 |
PPI network analysis of DEGs and pathway
analysis
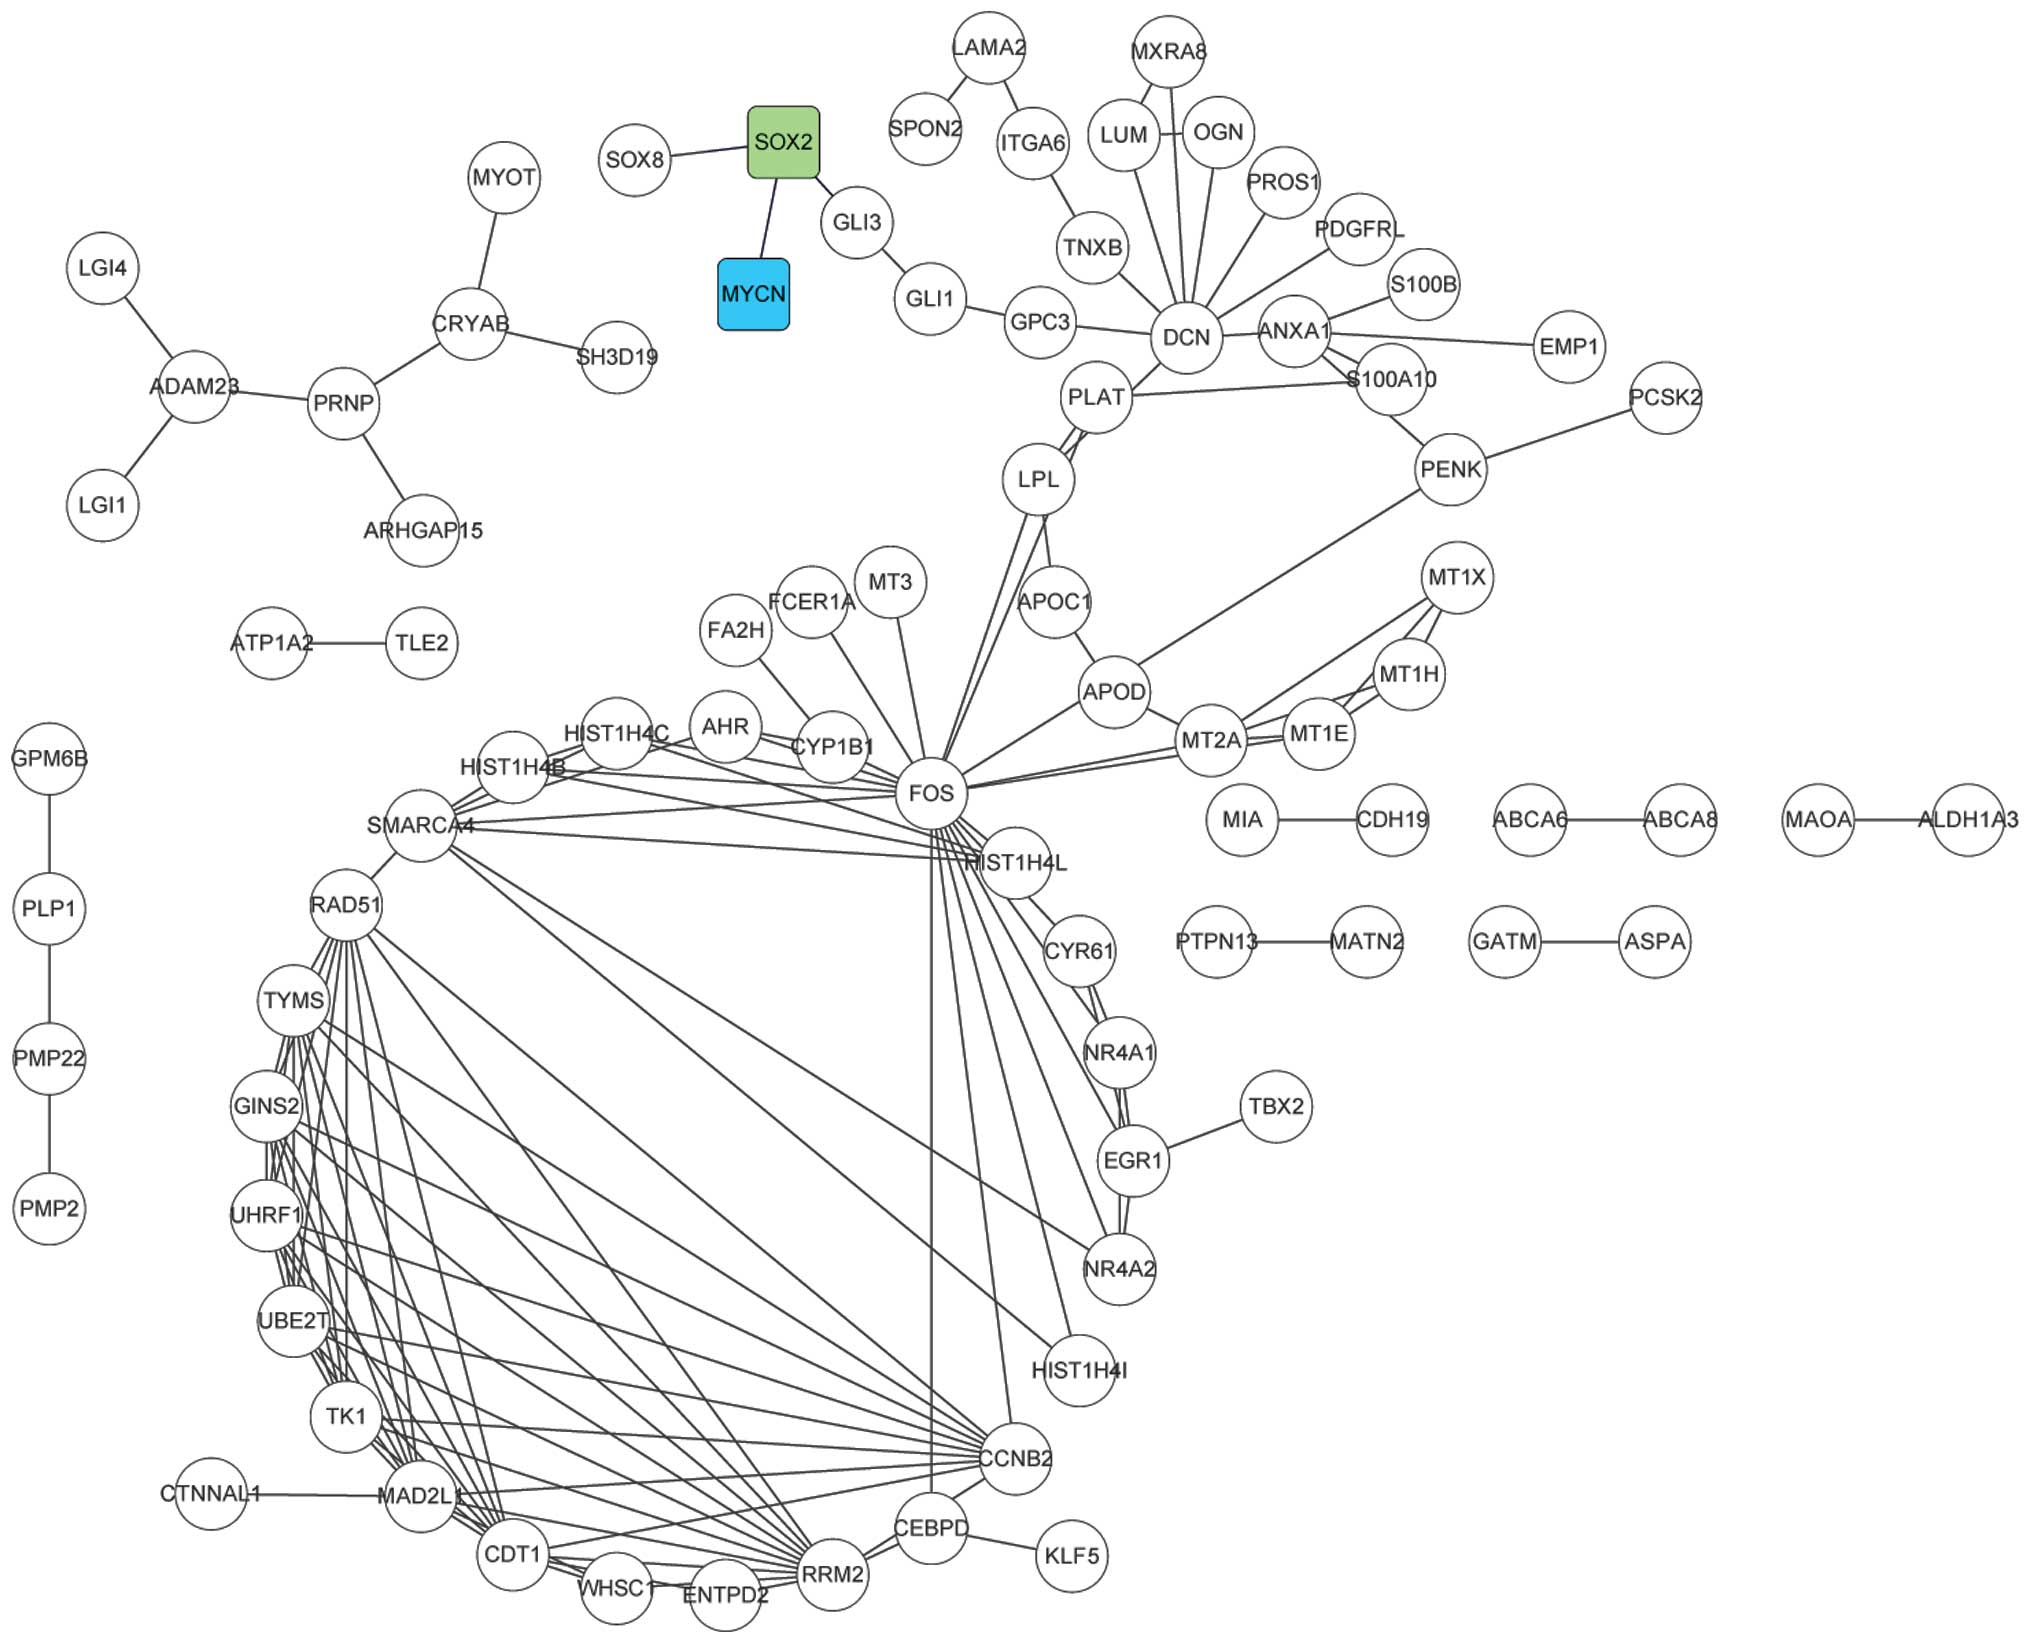
Analysis of the PPI network revealed that there were
85 nodes and 142 gene links, and SOX2 was identified as the
key gene correlated directly with MYCN (Fig. 3).
KEGG pathway enrichment analysis of the DEGs in the
PPI network indicated that the ASPA, MAOA and
ALDH1A3 genes were involved in the histidine metabolism
pathway (P=0.012376), and the LAMA2, FOS,
ITGA6, GLI3, GLI1 and RAD51 genes were
involved in the extracellular matrix (ECM)-receptor interaction
pathway (P=0.040716; Table
II).
| Table IITop two most enriched KEGG pathways
of the differentially expressed genes in the protein-protein
interaction network. |
Table II
Top two most enriched KEGG pathways
of the differentially expressed genes in the protein-protein
interaction network.
| ID | KEGG pathway | Gene count | P-value | Gene |
|---|
| hsa00340 | Histidine
metabolism | 3 | 0.012376 | ASPA, MAOA,
ALDH1A3 |
| hsa04512 | ECM-receptor
interaction | 6 | 0.040716 | LAMA2, FOS,
ITGA6, GLI3, GLI1, RAD51 |
Correlation analysis of genes
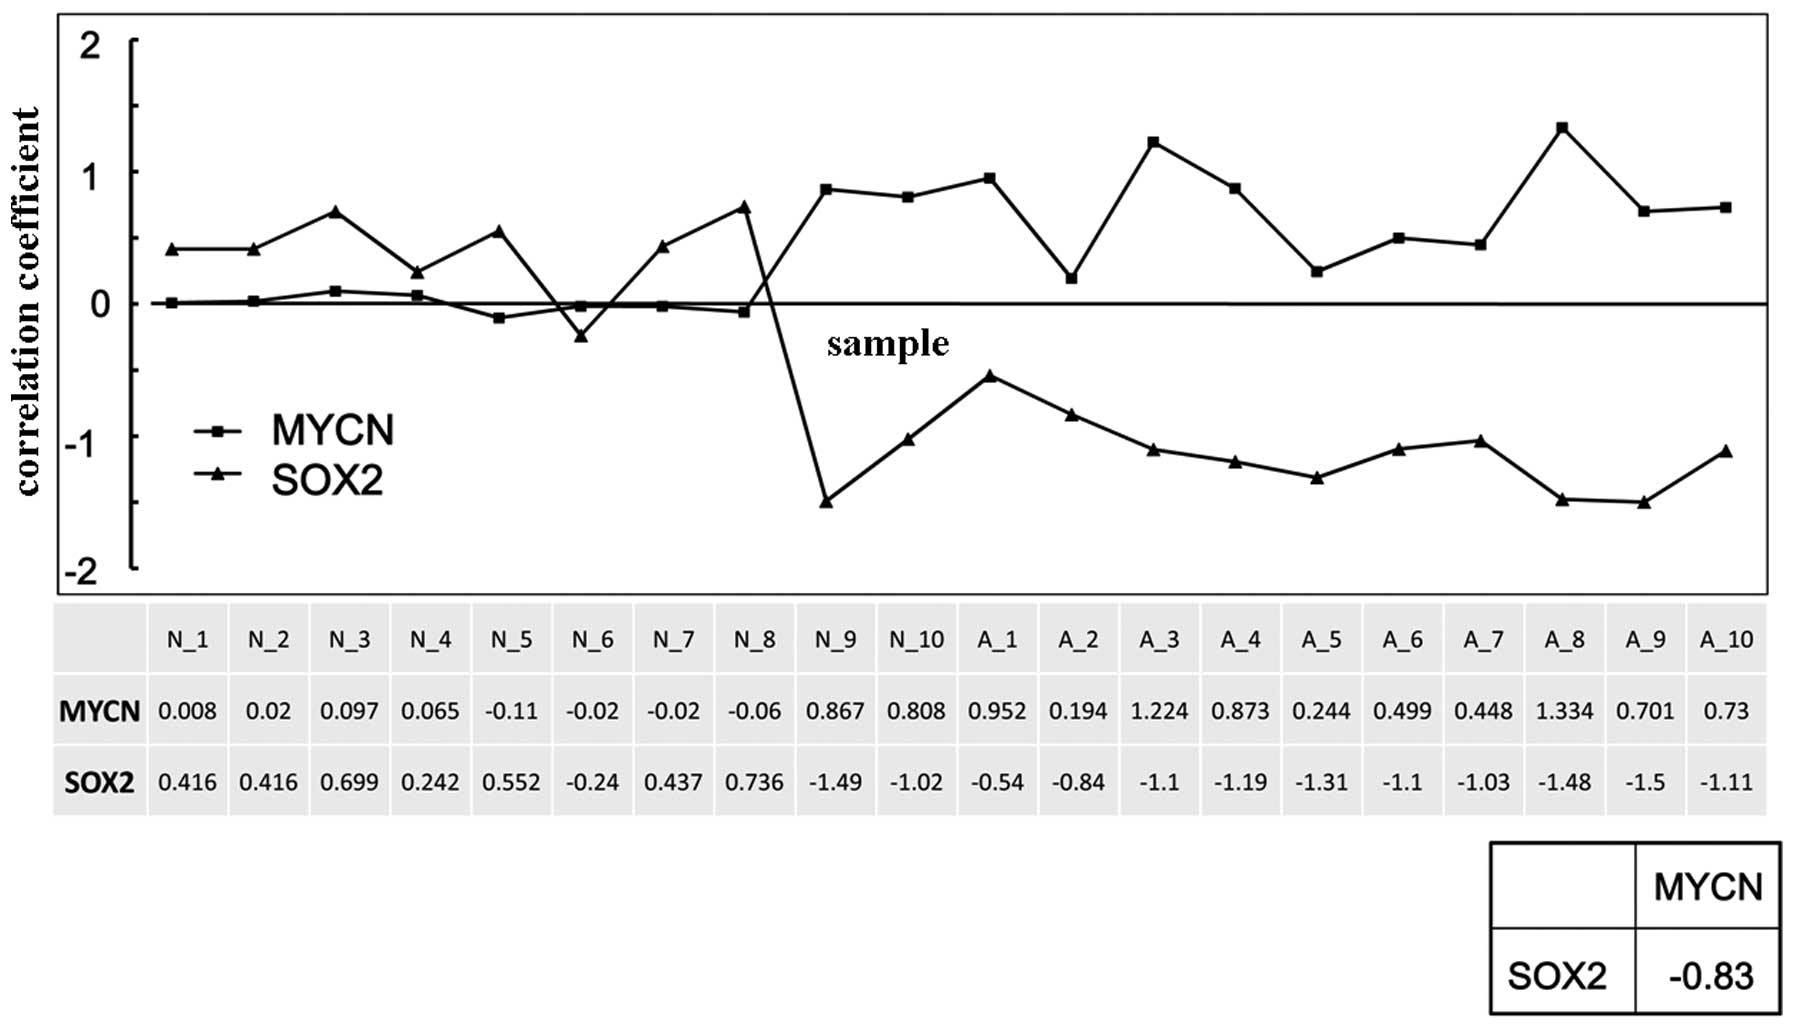
Correlation analysis indicated that the expression
of SOX2 was inversely correlated with the expression of
MYCN in the NB cell lines, and the correlation coefficient
of SOX2 and MYCN was −0.83 (Fig. 4).
Discussion
In the present study, 172 DEGs between the
MYCN amplification group and control group were identified,
which included 137 downregulated and 35 upregulated DEGs.
Functional enrichment analysis indicated that the KCNMB4
gene was involved in the regulation of action potential in neuron
pethway, and the FOS, GLI3 and GLI1 genes were
involved in the ECM-receptor interaction pathway. Correlation
analysis demonstrated that the expression of SOX2 was
inversely correlated with the expression of MYCN in the NB
cell lines.
Neurons encode and convey information by generating
action potentials (24). According
to a previous report by Hall et al, the expression of
specific Kv3.1 glycoprotein, which is a voltage-gated potassium
(Kv) channel, has an impact on the wave form of action potentials
and N-glycans associated with the Kv3.1 protein affect the
migratory rate of The NB cell (25). In addition, Leung et al
demonstrated that the voltage-gated Kv channel has an effect on
cAMP-stimulated neuritogenesis in mouse NB N2A cells (26). These findings suggest that the
voltage-gated Kv channels are important in the development of NB
through the modulation of action potentials. Large-conductance
Ca2+-activated K+ (BK) channels contribute to
the excitability of neurons (27).
The two subunits of BKβ are BKβ3 (KCNMB3) and BKβ4 (KCNMB4)
(28). Therefore, KCNMB4 may be
involved in the pathogenesis of NB through the voltage-gated Kv
channel. In the present study, KCNMB4 was involved in the
regulation of action potential in neuron biological process. Based
on these findings, it was hypothesized that KCNMB4 is
involved in the development of NB by the regulation of action
potentials in neurons.
SOX2, located in chromosome 3q26.33, is a
transcription factor which is involved in the regulation of stem
cell properties (29,30). Previously, it has been reported
that neural stem cell-like cells are isolated from certain types of
neural cancer, including glioblastoma, medulloblastoma and NB
(31,32). In addition, Das et al
demonstrated that SOX2 is involved in the maintenance of
undifferentiated stem cells by the regulation of all-trans retinoic
acid, which induces the differentiation of NB cells. Furthermore,
miR-340 has been found to be involved in the pathogenesis of
NB by mediating the expression of SOX2 (33). Wang et al found that
FoxM1 is involved in the tumorigenicity of aggressive NB
cells by activating the expression of SOX2 (34). According to a report by Yang et
al, the expression of OCT4 and SOX2 are involved
in the progression of NB (35).
These results indicate that SOX2 is important in the
pathogenesis of NB. The results of the present study, which
revealed that the expression of SOX2 was directly correlated
with the expression of MYCN, were consistent with previous
findings. Therefore, SOX2 may be involved in the pathology
of NB through the regulation of MYCN.
In the present study, PPI network analysis indicated
that GLI1 regulated SOX2 by the mediation of
GLI3, and FOX also regulated the expression of
SOX2 by the mediation of DCN. GLI1 and
GLI3 are mediators of the SHH pathway, which has an
effect on the early development of the central nervous system
(36). In addition,
SHH-GLI1 is involved in the self-renewal of cancer
stem cells (37). Furthermore,
Shahi et al reported that the expression of SMO and
GLI3 are partially correlated in NB (38). These results suggest that
GLI1 and GLI3 may be involved in the development of
NB by the mediation of SOX2. In addition, FOX
proteins are a conserved transcriptional regulator superfamily, and
FOX family transcription factors are key in the progression
of cancer (39). In NB,
FOXR1, fused to MLL or PAFAH1B due to
interstitial deletions, function as oncogenes (40). Santo et al demonstrated that
events of intra-chromosomal deletion/fusion at 11q23 activate the
expression of FOXR1 in NB (41). This suggested that FOX may
also be involved in the pathogenesis of NB by the regulation of
SOX2. According to these findings, the present study
hypothesized that FOS, GLI3 and GLI1 may
regulate the expression of MYCN by the mediation of
SOX2. Although the findings of the present study were
consistent with previous observations that the FOS,
GLI3 and GLI1 genes are involved in the pathogenesis
of NB, the present study revealed that the FOS, GLI3
and GLI1 genes were involved in the ECM-receptor interaction
pathway. Therefore, FOS, GLI3 and GLI1 may be
involved in the ECM-receptor interaction pathway to contribute to
the development of NB.
In conclusion, the present study identified 172 DEGs
between the MYCN amplification group and the control group,
including 137 downregulated and 35 upregulated DEGs. KCNMB4
may contribute to the development of NB by the regulation of action
potentials in neurons. FOS, GLI3 and GLI1 may
be involved in the pathogenesis of NB by the regulation of
SOX2, the expression of which was inversely correlated to
the expression of MYCN in the NB cell lines. These findings
have provided a novel opportunity to investigate the pathogenesis
of NB, however, these results require confirmation by further
investigations.
References
|
1
|
Wang K, Diskin SJ, Zhang H, Attiyeh EF,
Winter C, Hou C, Schnepp RW, Diamond M, Bosse K, Mayes PA, et al:
Integrative genomics identifies LMO1 as a neuroblastoma oncogene.
Nature. 469:216–220. 2011. View Article : Google Scholar
|
|
2
|
Maris JM: Recent advances in
neuroblastoma. N Engl J Med. 362:2202–2211. 2010. View Article : Google Scholar : PubMed/NCBI
|
|
3
|
Huang M and Weiss WA: Neuroblastoma and
MYCN. Cold Spring Harb Perspect Med. 3:a0144152013. View Article : Google Scholar : PubMed/NCBI
|
|
4
|
Nishihira H, Toyoda Y, Tanaka Y, Ijiri R,
Aida N, Takeuchi M, Ohnuma K, Kigasawa H, Kato K and Nishi T:
Natural course of neuroblastoma detected by mass screening: S
5-year prospective study at a single institution. J Clin Oncol.
18:3012–3017. 2000.PubMed/NCBI
|
|
5
|
De Bernardi B, Gerrard M, Boni L, Rubie H,
Cañete A, Di Cataldo A, Castel V, Forjaz de Lacerda A, Ladenstein
R, Ruud E, et al: Excellent outcome with reduced treatment for
infants with disseminated neuroblastoma without MYCN gene
amplification. J Clin Oncol. 27:1034–1040. 2009. View Article : Google Scholar : PubMed/NCBI
|
|
6
|
Kaneko M, Tsuchida Y, Mugishima H, Ohnuma
N, Yamamoto K, Kawa K, Iwafuchi M, Sawada T and Suita S:
Intensified chemotherapy increases the survival rates in patients
with stage 4 neuroblastoma with MYCN amplification. J Pediatr
Hematol Oncol. 24:613–621. 2002. View Article : Google Scholar : PubMed/NCBI
|
|
7
|
Tang XX, Zhao H, Kung B, Kim DY, Hicks SL,
Cohn SL, Cheung NK, Seeger RC, Evans AE and Ikegaki N: The MYCN
enigma: Significance of MYCN expression in neuroblastoma. Cancer
Res. 66:2826–2833. 2006. View Article : Google Scholar : PubMed/NCBI
|
|
8
|
Farina AR, Di Ianni N, Cappabianca L,
Ruggeri P, Ragone M, Ianni G, Gulino A and Mackay AR: TrkAIII
promotes micro-tubule nucleation and assembly at the centrosome in
SH-SY5Y neuroblastoma cells, contributing to an undifferentiated
anaplastic phenotype. Biomed Res Int. 2013:7401872013. View Article : Google Scholar
|
|
9
|
Suenaga Y, Islam SM, Alagu J, Kaneko Y,
Kato M, Tanaka Y, Kawana H, Hossain S, Matsumoto D, Yamamoto M, et
al: NCYM, a Cis-antisense gene of MYCN, encodes a de novo evolved
protein that inhibits GSK3β resulting in the stabilization of MYCN
in human neuroblastomas. PLoS Genet. 10:e10039962014. View Article : Google Scholar
|
|
10
|
Alderton GK: Neuroblastoma: A new gene
that promotes NMYC activity. Nature Reviews Cancer. 14:155.
2014.
|
|
11
|
Wu PY, Liao YF, Juan HF, Huang HC, Wang
BJ, Lu YL, Yu IS, Shih YY, Jeng YM, Hsu WM and Lee H: Aryl
hydrocarbon receptor downregulates MYCN expression and promotes
cell differentiation of neuroblastoma. PLoS One. 9:e887952014.
View Article : Google Scholar : PubMed/NCBI
|
|
12
|
Fujita A, Sato JR, Rodrigues Lde O,
Ferreira CE and Sogayar MC: Evaluating different methods of
microarray data normalization. BMC Bioinformatics. 7:4692006.
View Article : Google Scholar : PubMed/NCBI
|
|
13
|
Smyth GK: Limma: Linear models for
microarray data. Bioinformatics and computational biology solutions
using R and Bioconductor. Springer; pp. 397–420. 2005, View Article : Google Scholar
|
|
14
|
Benjamini Y: Discovering the false
discovery rate. J R Stat Soc Series B Stat Methodol. 72:405–416.
2010. View Article : Google Scholar
|
|
15
|
Benjamini Y and Hochberg Y: Controlling
the false discovery rate: a practical and powerful approach to
multiple testing. J R Stat Soc Series B Stat Methodol. 289–300.
1995.
|
|
16
|
Szekely GJ and Rizzo ML: Hierarchical
clustering via joint between-within distances: Extending Ward's
minimum variance method. Journal of Classification. 22:151–183.
2005. View Article : Google Scholar
|
|
17
|
Deza MM and Deza E: Encyclopedia of
distances. Springer; 2009, View Article : Google Scholar
|
|
18
|
Jiao X, Sherman BT, Huang da W, Stephens
R, Baseler MW, Lane HC and Lempicki RA: DAVID-WS: A stateful web
service to facilitate gene/protein list analysis. Bioinformatics.
28:1805–1806. 2012. View Article : Google Scholar : PubMed/NCBI
|
|
19
|
Szklarczyk D, Franceschini A, Kuhn M,
Simonovic M, Roth A, Minguez P, Doerks T, Stark M, Muller J, Bork
P, et al: The STRING database in 2011: Functional interaction
networks of proteins, globally integrated and scored. Nucleic Acids
Res. 39:D561–D568. 2011. View Article : Google Scholar :
|
|
20
|
Smoot ME, Ono K, Ruscheinski J, Wang PL
and Ideker T: Cytoscape 2.8: New features for data integration and
network visualization. Bioinformatics. 27:431–432. 2011. View Article : Google Scholar :
|
|
21
|
Zhang B, Kirov S and Snoddy J: WebGestalt:
An integrated system for exploring gene sets in various biological
contexts. Nucleic Acids Res. 33:W741–W748. 2005. View Article : Google Scholar : PubMed/NCBI
|
|
22
|
Wang J, Duncan D, Shi Z and Zhang B:
WEB-based GEne SeT AnaLysis Toolkit (WebGestalt): Update 2013.
Nucleic Acids Res. 41:W77–W83. 2013. View Article : Google Scholar : PubMed/NCBI
|
|
23
|
Bieniasz M, Oszajca K, Eusebio M, Kordiak
J, Bartkowiak J and Szemraj J: The positive correlation between
gene expression of the two angiogenic factors: VEGF and BMP-2 in
lung cancer patients. Lung Cancer. 66:319–326. 2009. View Article : Google Scholar : PubMed/NCBI
|
|
24
|
Bean BP: The action potential in mammalian
central neurons. Nat Rev Neurosci. 8:451–465. 2007. View Article : Google Scholar : PubMed/NCBI
|
|
25
|
Hall MK, Cartwright TA, Fleming CM and
Schwalbe RA: Importance of glycosylation on function of a potassium
channel in neuroblastoma cells. PLoS One. 6:e193172011. View Article : Google Scholar : PubMed/NCBI
|
|
26
|
Leung YM, Huang CF, Chao CC, Lu DY, Kuo
CS, Cheng TH, Chang LY and Chou CH: Voltage-gated K+ channels play
a role in cAMP-stimulated neuritogenesis in mouse neuroblastoma N2A
cells. J Cell Physiol. 226:1090–1098. 2011. View Article : Google Scholar
|
|
27
|
Manna I, Labate A, Mumoli L, Ferlazzo E,
Aguglia U, Quattrone A and Gambardella A: Failure to confirm
association of a polymorphism in KCNMB4 gene with mesial temporal
lobe epilepsy. Epilepsy Res. 106:284–287. 2013. View Article : Google Scholar : PubMed/NCBI
|
|
28
|
Behrens R, Nolting A, Reimann F, Schwarz
M, Waldschütz R and Pongs O: HKCNMB3 and hKCNMB4, cloning and
characterization of two members of the large-conductance
calcium-activated potassium channel beta subunit family. FEBS Lett.
474:99–106. 2000. View Article : Google Scholar : PubMed/NCBI
|
|
29
|
Gómez-Mateo Mdel C, Piqueras M, Påhlman S,
Noguera R and Navarro S: Prognostic value of SOX2 expression in neu
roblastoma. Genes Chromosomes Cancer. 50:374–377. 2011. View Article : Google Scholar
|
|
30
|
Pietras A, Gisselsson D, Ora I, Noguera R,
Beckman S, Navarro S and Påhlman S: High levels of HIF-2alpha
highlight an immature neural crest-like neuroblastoma cell cohort
located in a perivascular niche. J Pathol. 214:482–488. 2008.
View Article : Google Scholar : PubMed/NCBI
|
|
31
|
Melone MA, Giuliano M, Squillaro T,
Alessio N, Casale F, Mattioli E, Cipollaro M, Giordano A and
Galderisi U: Genes involved in regulation of stem cell properties:
Studies on their expression in a small cohort of neuroblastoma
patients. Cancer Biol Ther. 8:1300–1306. 2009. View Article : Google Scholar : PubMed/NCBI
|
|
32
|
Hansford LM, McKee AE, Zhang L, George RE,
Gerstle JT, Thorner PS, Smith KM, Look AT, Yeger H, Miller FD, et
al: Neuroblastoma cells isolated from bone marrow metastases
contain a naturally enriched tumor-initiating cell. Cancer Res.
67:11234–11243. 2007. View Article : Google Scholar : PubMed/NCBI
|
|
33
|
Das S, Bryan K, Buckley PG, Piskareva O,
Bray IM, Foley N, Ryan J, Lynch J, Creevey L, Fay J, et al:
Modulation of neuroblastoma disease pathogenesis by an extensive
network of epigenetically regulated microRNAs. Oncogene.
32:2927–2936. 2013. View Article : Google Scholar
|
|
34
|
Wang Z, Park HJ, Carr JR, Chen YJ, Zheng
Y, Li J, Tyner AL, Costa RH, Bagchi S and Raychaudhuri P: FoxM1 in
tumorigenicity of the neuroblastoma cells and renewal of the neural
progenitors. Cancer Res. 71:4292–4302. 2011. View Article : Google Scholar : PubMed/NCBI
|
|
35
|
Yang S, Zheng J, Ma Y, Zhu H, Xu T, Dong K
and Xiao X: Oct4 and Sox2 are overexpressed in human neuroblastoma
and inhibited by chemotherapy. Oncol Rep. 28:186–192.
2012.PubMed/NCBI
|
|
36
|
Zhu H and Lo HW: The human
glioma-associated oncogene homolog 1 (Gli1) family of transcription
factors in gene regulation and diseases. Curr Genomics. 11:238–245.
2010. View Article : Google Scholar : PubMed/NCBI
|
|
37
|
Clement V, Sanchez P, de Tribolet N,
Radovanovic I and Ruiz i Altaba A: HEDGEHOG-GLI1 signaling
regulates human glioma growth, cancer stem cell self-renewal and
tumorigenicity. Curr Biol. 17:165–172. 2007. View Article : Google Scholar : PubMed/NCBI
|
|
38
|
Shahi MH, Lorente A and Castresana JS:
Hedgehog signalling in medulloblastoma, glioblastoma and
neuroblastoma. Oncol Rep. 19:681–688. 2008.PubMed/NCBI
|
|
39
|
Myatt SS and Lam EWF: The emerging roles
of forkhead box (Fox) proteins in cancer. Nat Rev Cancer.
7:847–859. 2007. View Article : Google Scholar : PubMed/NCBI
|
|
40
|
Katoh M, Igarashi M, Fukuda H and Nakagama
H: Cancer genetics and genomics of human FOX family genes. Cancer
Lett. 328:198–206. 2013. View Article : Google Scholar
|
|
41
|
Santo EE, Ebus ME, Koster J, Schulte JH,
Lakeman A, van Sluis P, Vermeulen J, Gisselsson D, Øra I, Lindner
S, et al: Oncogenic activation of FOXR1 by 11q23 intrachromosomal
deletion-fusions in neuroblastoma. Oncogene. 31:1571–1581. 2012.
View Article : Google Scholar
|