Introduction
Coptidis rhizoma (Coptis), which is the
rhizome of Coptis chinensis Franch from the Ranunculaceae
family, is widely used in traditional Chinese medicine (TCM).
Coptis has been used to treat various diseases, including
dysentery, hypertension, inflammation, tumor and liver diseases
(1–3). Modern pharmacological studies have
demonstrated that Coptis exerts numerous activities,
including antibacterial (4),
antiviral (5), anti-inflammatory
(6,7), antineoplastic (8,9),
anti-diarrheal (10),
antihypertensive (11),
anti-oxidative (12),
antidiabetic, anti-hypercholesterolemic and hepatoprotective
effects (13–16). The bioactive compounds in
Coptis remain to be fully identified; however, it is
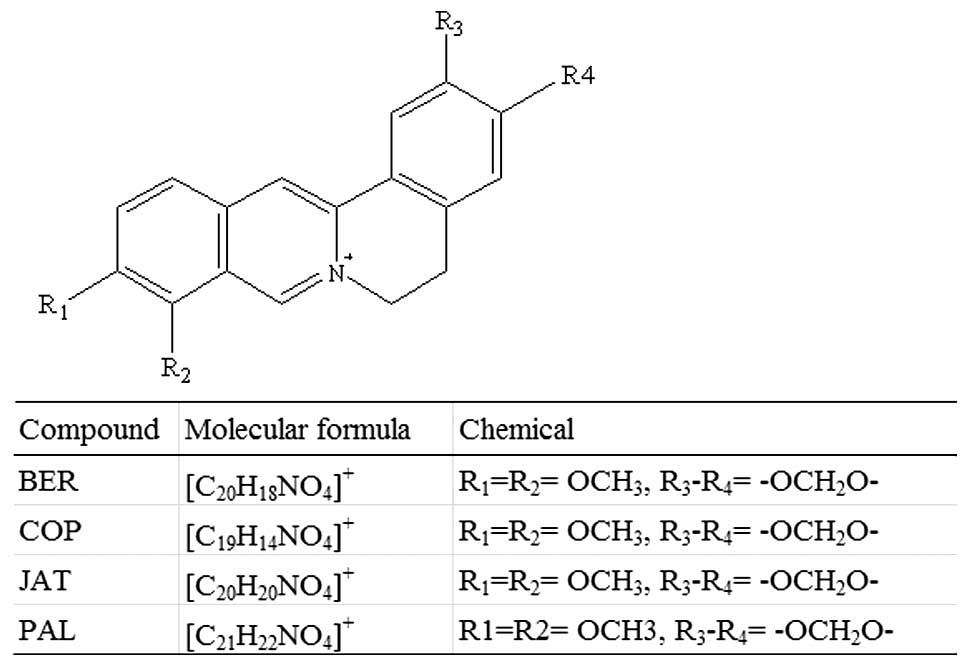
generally considered that the predominant bioactive components are
protoberberine alkaloids, including berberine (BER), palmatine
(PAL), jatrorrhizine (JAT) and coptisine (COP) (Fig. 1) (17,18).
Previous studies have suggested that the protoberberine alkaloids
have multiple pharmacological functions, including the ability to
improve glycemic control and lipid profile, as well as antibiotic,
anti-inflammatory, anti-diarrheal, antineoplastic, antiarrhythmic
and immunosuppressive properties (19–23).
Although the pharmacological effects of BER and other Coptis
extracts have been widely reported, information regarding their
oral absorption remains to be fully elucidated. Previous
pharmacokinetic studies have demonstrated that the four
protoberberine alkaloids have markedly low plasma concentrations
and poor oral bioavailability in rats, beagle dogs and humans
following oral administration (24–27).
Furthermore, several studies have reported that BER is a
P-glycoprotein (P-gp) substrate, which is extensively metabolized
by CYP2D6 and CYP1A2 in the liver (17,28–34).
Accordingly, poor absorption, P-gp efflux and extensive metabolism
may be responsible for the poor bioavailability and low plasma
concentration of these alkaloids. The present study aimed to
determine the oil/water partition coefficient (Po/w) of
these four alkaloids. In addition, the permeability of the four
alkaloids was determined using an in vitro Caco-2 cell
monolayer model and pre-coated parallel artificial membrane
permeability assay (PAMPA) plates. Intestinal absorption was
determined in various intestinal segments using an in situ
rat gut circulation perfusion model.
Materials and methods
Equipment
The ultra performance liquid chromatography (UPLC)
H-class system (Singapore) was equipped with Empower 3 software
(Waters Corporation, Milford, MA, USA), and an H-class Waters
column (ACQUITY UPLC BEH C18; 2.1×100 mm; 1.7 µm; Waters
Corporation) for UPLC separation. The RF-5301PC fluorescence
spectrophotometer was purchased from Shimadzu Scientific
Instruments (Columbia, MD, USA). The Bio-Tech Synergy 22100
microplate reader (cat. no. 168-1002XC) was obtained from Bio-Rad
Laboratories, Inc. (Hercules, CA, USA), and the CF16RX-II
centrifuge was purchased from Hitachi Koki Co., Ltd (Tokyo, Japan).
A Nikon ECLIPSE Ti-U biological microscope (Nikon Corporation,
Tokyo, Japan) was used to count the number of cells. Transwell
culture plates were purchased from Corning Costar (Corning
Incorporated, Corning, NY, USA) and the Pre-Coated PAMPA Plate
system was obtained from BD Biosciences (Bedford, MA, USA).
Chemicals and reagents
Standards of berberine hydrochloride and palmatine
hydrochloride were purchased from the National Institutes for Food
and Drug Control of China (Beijing, China). Standards of coptisine
hydrochloride and jatrorrhizine hydrochloride were purchased from
Shanghai Tauto Biotech Co., Ltd. (Shanghai, China). Fluorescein
sodium, propranolol, verapamil, furosemide, hydrochlorothiazide,
caffeine and metoprolol were purchased from Sigma-Aldrich (St.
Louis, MO, USA), and the purity of all of the chemicals was
>98%. Methyl thiazolyl tetrazolium (MTT) was dissolved in
trypsin, which was purchased from Amresco LLC (Solon, OH, USA).
Dulbecco's modified Eagle's medium (DMEM) and fetal bovine serum
(FBS) were purchased from Gibco Life Technologies (Carlsbad, CA,
USA). Acetonitrile and methanol were obtained from Thermo Fisher
Scientific (Waltham, MA, USA). Ammonium acetate was purchased from
Fluka (Sigma-Aldrich Trading Co., Ltd.) and formic acid was
obtained from TEDIA Company (Fairfield, OH, USA). These were
commercially available products of high performance liquid
chromatography grade.
Cells and animals
The Caco-2 human colon carcinoma cells were
purchased from the Cell Culture Center of the Chinese Academy of
Medical Sciences (Beijing, China). Sprague-Dawley (SD) male rats
were purchased from Beijing HFK Bioscience Co., Ltd. (license no.
SCXK2009-0007; Beijing, China). Animal and cell experimental
procedures were performed according to the guide for the Care and
Use of Laboratory Animals (National Research Council Of USA, 1996),
and the associated ethical regulations of the ethics committee of
Guang'anmen Hospital (Beijing, China).
UPLC method validation
Simultaneous determination of the four alkaloids was
achieved on the UPLC system. The mobile phase was composed of
acetonitrile-water 30:70 (containing 2 mmol formic acid and 0.05%
ammonium acetate at pH 3.20) at a flow rate of 0.3
ml·min−1. The column temperature was 30°C and the
detector was a photo-diode array detector (345 nm). The injection
volume was 5 µl.
For specificity, each standard was diluted with
different solvents [mobile phase: 10% methanol containing
phosphate-buffered saline (PBS), Hanks' solution or Krebs-Ringer
solution with 20 µg·ml−1 phenol red] and then
determined according to the UPLC method described above. For
linearity, a series of concentrations of the standards was used,
and linear regression was calculated as the peak area (Y) versus
the concentration (x), in order to obtain the linear correlation
coefficient. For precision, mixed standard solutions at three
concentrations, from low to high, were assessed under UPLC
conditions for five sequential days. The inter-assay and
inner-assay precision of the four alkaloids was calculated as the
relative standard deviation (RSD%) of the obtained peak area (n=6).
For stability, the four alkaloids in each type of medium were
assessed at 0, 1, 2, 4, 8 and 24 h, and the RSD% was used to
evaluate the stability of the alkaloids. For recovery, appropriate
quantities of the four reference alkaloids were added to the blank
sample to produce a final concentration of 150 ng·ml−1
with six duplicates for each medium, and the recovery was
calculated compared with each standard. The lower limit of
detection (LOD) and the lower limit of quantification (LOQ) were
determined using a final concentration, according to the ratio of
signal to noise (S/N)>3 for LOD and S/N>10 for LOQ.
Determination of Po/w
The Po/w was determined using a shake
flask method with solutions of octanol with 0.1 M HCl, and octanol
with pH 7.4 buffer solution (1.36 g KH2PO4,
79 ml 0.1 M NaOH, diluted with H2O to 200 ml). A total
of 100 ml of the two solutions were placed separately into a
separation funnel, and shaken three times prior to the natural
separation of the solution into two layers at room temperature.
Subsequently, 10 ml of the upper oil phase layer and 10 ml of the
lower aqueous phase layer was transferred into a flask. The
standard solution of the four alkaloids (20 µg/ml) was
prepared using the octanol with HCl solution, and the octanol with
buffer solution, respectively. The flasks were placed into a
thermostatic water bath at 37°C with agitation for 24 h, prior to
being centrifuged (13,800 × g; 4°C; 10 min). Subsequently, 1.0 ml
of the solution was evaporated using nitrogen, and the residual
solution was dissolved in the mobile phase and transferred into a
glass vial. The samples were then analyzed in triplicate using the
UPLC method, and the concentrations of each alkaloid in the oil
phase (Coil) and aqueous phase (CWater) were
obtained. The Po/wwas calculated using the following
formula: Po/w = Coil / CWater.
Permeability assay using the PAMPA
plate
Drugs with poor passive absorption (furosemide and
hydrochlorothiazide) and drugs with good absorption (caffeine and
metoprolol) were selected as a cocktail tool to investigate the
permeability and absorption of the alkaloids, according to the BD
Biosciences PAMPA plate permeability instructions (35). The test standards were prepared by
dissolving BER, PAL, JAT and COP in methanol, which was then
diluted in phosphate buffer solution (PBS), containing 8.0 g NaCl;
0.2 g KCl; 1.6 g Na2HPO4·12H2O and
0.2 g KH2PO4 per liter in H2O
(adjusted to pH 7.40 using 0.1 mol NaOH), to obtain a concentration
of 75 µg·ml−1 for each standard.
The PAMPA plate was pre-cooled at −20°C prior to
incubation at ambient temperature for 30 min. A total of 200
µl PBS was added to the upper layer of the plate and 300
µl of the BER, COP, JAT and JAT solutions (25, 50 and 75
µg·ml−1, respectively) were added to the lower
layer. The layers were then placed together, ensuring no bubbles
were present, and incubated at 25°C for 5 h (n=6). Subsequently,
100 µl of the upper and lower layer solutions were
transferred to a tube and centrifuged at 13,800 × g for 10 min. The
supernatant was then transferred into a glass vial for analysis,
according to the validated UPLC method. Drug-free PBS samples were
used as a control group. The Papp and membrane retention
coefficient (R%) were calculated as follows: Papp = −ln [1 − C A /
Ce] / A × (1 / VD + 1 / VA) × t (cm/s); Ce = [CD (t) × V D + CAt ×
VA)] / (VD + VA); R (%) = [1 − (CDt × VD + CA t × VA)] / C0 × VD ×
100%. t, incubation time (18,000 sec); C0, initial compound
concentration in the donor well (mM); CDt, compound concentration
in the donor well at t in mM; CAt, compound concentration in the
acceptor well at t in mM; Ce, compound at equilibrium
concentration; VD, donor well volume (0.3 ml); VA, acceptor well
volume (0.2 ml); A, filter area (0.3 cm2).
Bidirectional transportation of the
alkaloids and the effect of the P-gp transporter
The present study aimed to verify whether the P-gp
transporter affected the uptake of the four alkaloids. According to
the literature, the Caco-2 cell monolayer model is an advantageous
artificial tool for drug bidirectional transportation and P-gp
efflux investigation (36–42). Verification of the active Caco-2
cell monolayer model is a procedure used to select a Caco-2 cell
monolayer model with good absorption and transportation of
propranolol, but weak absorption and transportation of fluorescent
yellow (purity >98%; Sigma-Aldrich), which may then be used as a
tool for drug evaluation. An MTT assay was used to evaluate the
effects of the four alkaloids on Caco-2 cell activity (43).
Hanks' solution was prepared, and test solutions of
BER, COP, JAT and PAL were prepared using Hanks' solution, in order
to obtain a stock solution with a concentration of 100
µmol·l−1 of each alkaloid. The solutions were
then diluted to 10, 20, 60 and 100 µmol·l−1
concentrations, respectively. Tool drugs were prepared at 30
µg·ml−1 for propranolol, 20
µg·ml−1 for fluorescent yellow and 100
µmol·l−1 for verapamil dissolved (containing 30
µmol·l−1 of BER) in Hanks' solution.
The Caco-2 cells were cultured in high glucose DMEM
supplemented with 10% FBS, 1% non-essential amino acids
(Sigma-Aldrich) and 1% green-streptomycin (Sigma-Aldrich) at 37°C,
in an incubator of 5% CO2 under 90% relative humidity.
The cells (5×10⁴/cm2) were then seeded into a
Transwell 12-well plate, and the medium was replaced every other
day; the cells were continuously cultured for 21 days.
Subsequently, a Caco-2 cell monolayer with good absorption and
transportation of propranolol, but weak absorption and
transportation of fluorescent yellow, was selected. Briefly, 0.5 ml
propranolol (30 µg·ml−1) or fluorescent yellow
(20 µg·ml−1) was added to the apical (AP) side
and 1.5 ml blank Hanks' solution was added to the basolateral (BL)
side. The cells were incubated at 37°C in a water bath for 60 min.
The concentrations of propranolol and fluorescent yellow in the BL
side were used to evaluate transport ability.
An MTT assay was performed as follows: 100 µl
cell suspension (1×10⁶/ml) was added to a 96-well plate,
and 200 µl culture medium was added to each well prior to
plate incubation for 24 h. The medium in each well was then
aspirated and 200 µl test solution (BER, COP, JAT and PAL)
was added and incubated for 48 h. Subsequently, 20 µl MTT (5
mg·ml−1 in PBS) was added to each well and incubated for
4 h prior to termination with 150 µl/well dimethyl
sulfoxide. The experimental group, the control group (no cells or
drugs), and the negative group (cell culture medium only) were
assessed in six duplicates. The absorbance value was measured at
570 nm using a microplate reader. Survival rates were calculated
and compared between the experimental group and the untreated
negative group using the following formula: Survival rate (%) =
(Aexperiment - Ablank) /
(Anegative - Ablank).
Bidirectional transportation of the four alkaloids
in the Caco-2 cell monolayer was determined, as previously
described (29–31,44–46).
Caco-2 cells cultured in Transwell plates (1×10⁶
cells/ml) for 21 days with a resistance value >350 Ω were
selected using an Epithelial Volt-Ohm meter (Millicell®
ERS-2; Millipore Corporation, Billerica, MA, USA) for the
bidirectional transportation experiments. The cells were washed
twice with Hanks' solution at 37°C and then incubated for 30 min at
37°C. The culture medium was then discarded, and equal volumes of
BER, COP, JAT and PAL at various concentrations were added to the
AP side or to the BL side. Blank Hanks' solution was used as a
control. The Transwell plates were then incubated at 37°C in an
oscillating water bath agitated at 50 r·min−1.
Subsequently, 0.1 ml of each sample was collected at 30, 60, 90 and
120 min from the AP or BL side, with an equal volume of blank
Hanks' collected at the same time-points. The samples were then
centrifuged at 13,800 × g for 10 min, and the supernatants were
analyzed using the validated UPLC method (n=6).
The P-gp inhibitor verapamil is considered a useful
tool as a cocktail drug to investigate drug transportation
(29,31,44–46).
Caco-2 cells with a resistance >350 Ω were selected for the
transport experiments in the present study. Following 21 days
incubation in Transwell plates, 100 µmol·l−1 of
verapamil and 30 µmol·l−1 of BER, COP, PAL and
JAT solutions were added to the AP or BL side, respectively. The
plates were then incubated at 37°C in an oscillating water bath
agitated at 50 r·min−1. Subsequently, 100 µl
samples were collected at 30, 60, 90 and 120 min from the AP or BL
side, with an equal volume of blank Hanks' solution collected at
the same time-points (n=6). The samples were centrifuged at 13,800
× g for 10 min, and the supernatants were measured using the
validated UPLC method. The Papp (1×10⁻⁵
cm·s−1) was calculated as follows: Papp = (dQ / dt) / (A
x C), where dQ / dt (µg·s−1) is the rate of drug
transportation; A is the surface area of the cell mono-layer
(cm2); and C is the initial concentration of the drug in
the administered side (µg·ml−1).
Absorption evaluation of the four
alkaloids by perfusion in rat intestine
The perfusion solution was prepared using 20
µg·ml−1 phenol red Krebs-Ringer buffer solution
(7.8 g NaCl; 0.35 g KCl; 0.37 g CaCl2; 0.32 g
NaH2PO4·2H2O; 0.02 g
MgCl2; 1.37 g NaHCO3 and 1.4 g glucose (per
liter of H2O), in order to obtain 20
µg·ml−1 of 58.82 µg·ml−1 for
BER, 51.35 µg·ml−1 for COP, 46.36
µg·ml−1 for PAL and 62.18
µg·ml−1 for JAT.
The intestinal perfusion experiments were performed,
as described previously (41,47,48).
Six SD male rats weighing 300–320 g were reared in the Guang' An
Men Hospital Experimental Animal Center (Beijing, China), and were
maintained under an alternating 12 h light-dark cycle with ad
libitum access to water. The jejunum and ileum of the rats were
collected under anesthesia using intraperitoneal injection of 20%
urethane (Sigma-Aldrich) solution at a dose of 5
ml·kg−1. For the 10 cm jejunum section, the pylorus was
selected as a starting point, and 10 cm down from the starting
point was considered the terminal point. A sterile polyethylene
pipe was inserted through a small hole from the starting point
(inlet) to the terminal point (outlet). The intestinal content was
flushed with saline at 37°C and replaced with perfusate at 37°C.
The inlet and outlet pipes were connected with a pool using a
peristaltic pump at a flow rate of 1 ml·min−1 for the
perfusion circulation. For the 10 cm ileum section, the ileocecal
was selected as the terminal point for the outlet, and 10 cm up
from the terminal was selected as the starting point for the inlet.
A sterile polyethylene pipe was inserted from the starting point
(inlet) to the terminal point (outlet). The same wash and perfusion
program was performed, as described for the jejunum perfusion. A
total of 0.6 ml of each sample was collected at after 0.5, 1.0,
1.5, 2.0, 3.0 and 4.0 h, and an equal volume of Krebs-Ringer
solution (20 µg·ml−1 phenol red) was added to the
pool immediately following removal. The removal of the perfused
solution was used to determine the quantity of phenol red and the
absorption of the four alkaloids (n=6). The inner diameter of the
small intestine (R) was determined for calculation of the surface
area of the bowel perfusion (A). A blank sample was collected from
the drug-free perfusion test solution, which contained 20
µg·ml−1 phenol red.
The percentage of absorption (A %) for each drug was
calculated using the following formula: A (%) = (initial
concentration C0 × volume of the drug V0 - Ct × Vt) / (initial
concentration C0 × volume of the drug V0) × 100%. The perfusion
fluid volume was normalized to the concentration of phenol red. The
A % was obtained following administration of the drugs for 4 h. The
absorption rate constant (Ka) was obtained from the slope of the
regression equation, calculated by the logarithmic of the remaining
doses in the pool versus time.
Method validation for the phenol red: The phenol red
assay was performed using an ultraviolet-visible 2102-PC
spectrophotometer (Unico, East Dayton, NJ, USA) at a wavelength of
559 nm, with no interference verified by the blank intestine
perfusion solution. The concentration of phenol red was evaluated
by the linearity via diluting the standard of phenol red with
Krebs-Ringer solution to produce the following concentrations: 10,
20, 30, 40, 50 and 60 µg·ml−1, there is a good
linearity by regression of the concentration (x) and absorbance
values (y) at range of 10.12–60.72 µg·ml−1. The
linearity equation was Y = 0.015x + 0.0419 with a correlation
coefficient of 0.9994. The precision and stability of the
experiment were evaluated using the RSD% <5% during the
analysis, which was compliant with the phenol red
determination.
Statistical analysis
Statistical analysis was performed using Microsoft
Excel 2007 software (Microsoft Corporation, Redmond, WA, USA). Data
are presented as the mean ± standard deviation. The difference
between the groups was analyzed using a one-way analysis of
variance. P<0.05 was considered to indicate a statistically
significant difference.
Results
UPLC validation for determination of the
four alkaloids
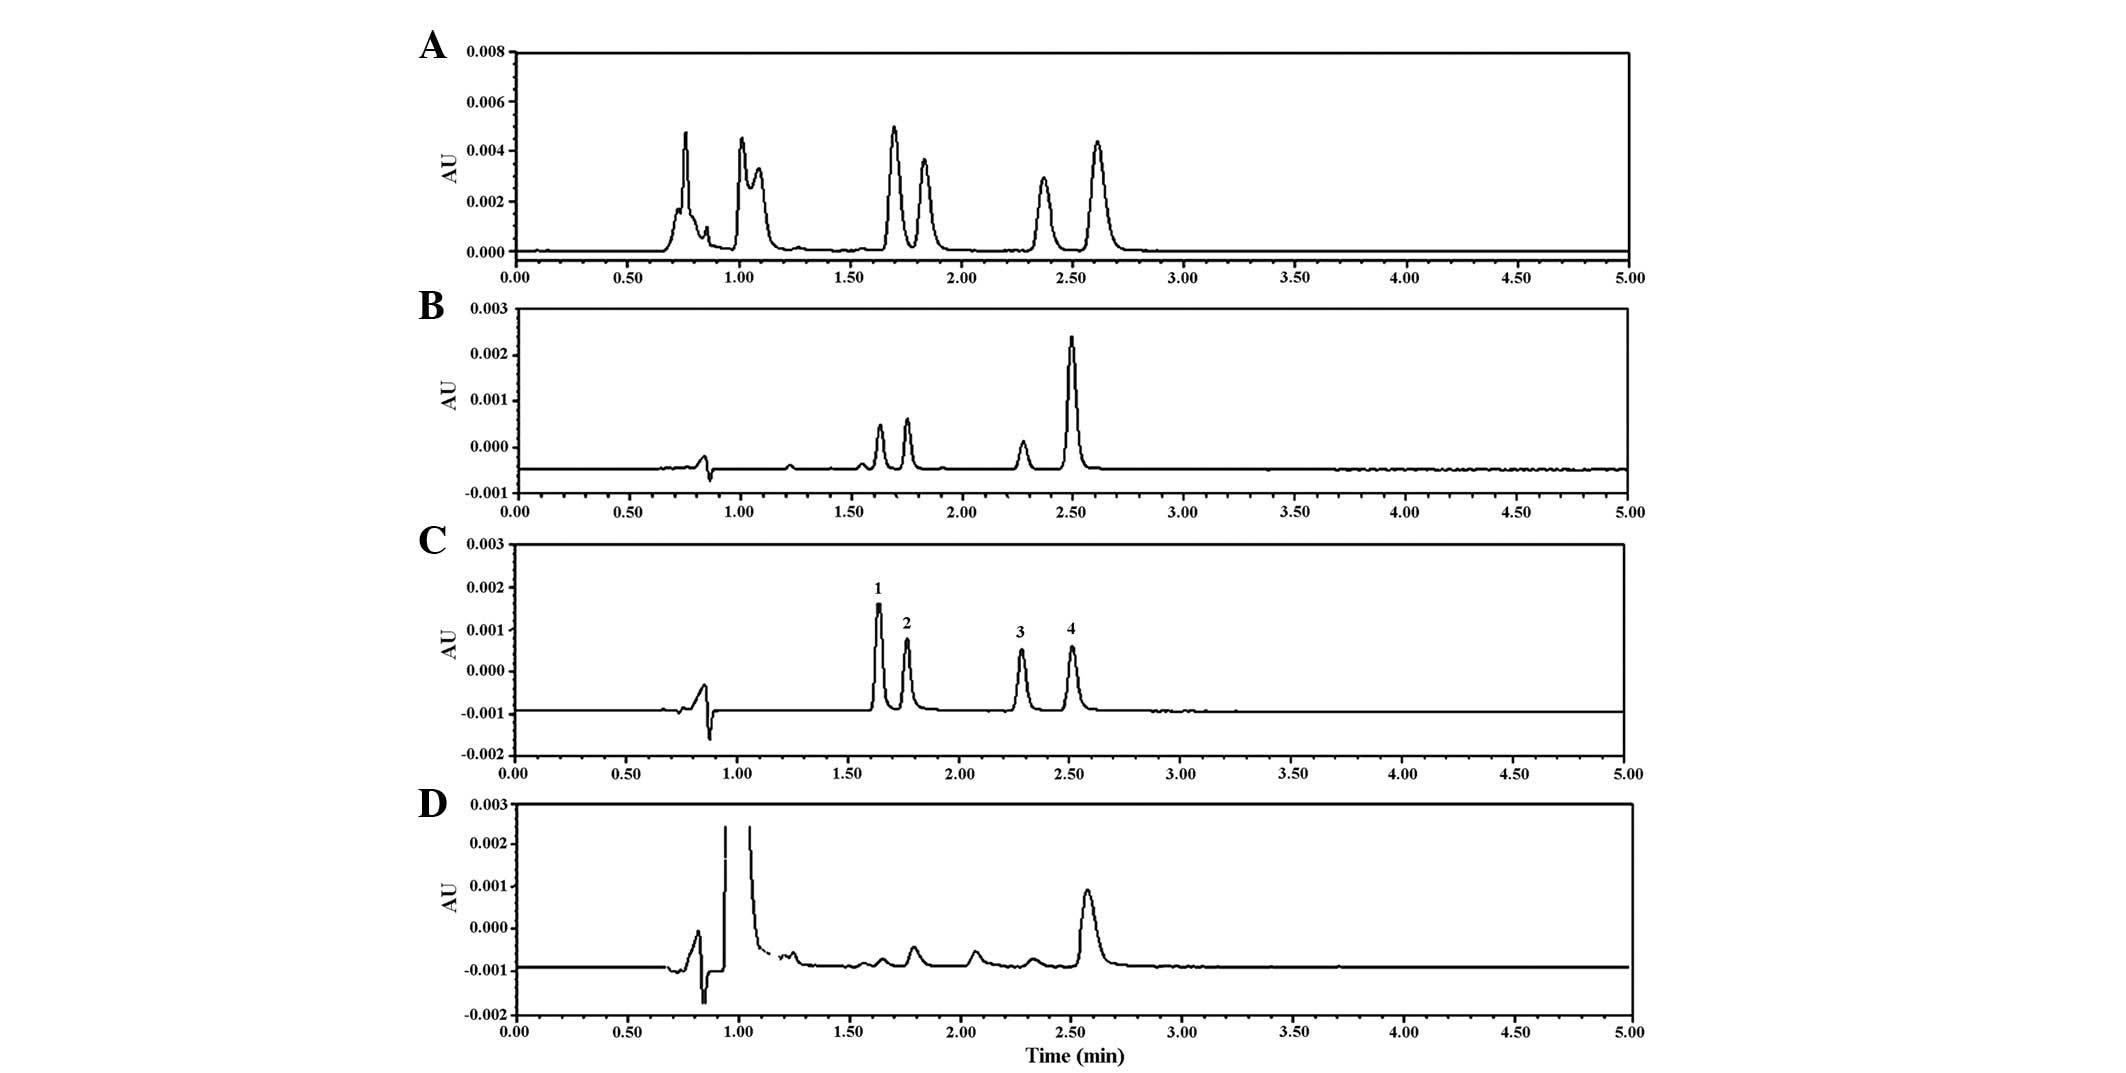
No interference was detected in either the Caco-2
cell model or the intestinal perfusion fluid model from PBS, Hanks'
solution, or Krebs-Ringer solution with phenol red (Fig. 2). The RSD% for the inter-assay and
inner-assay were <5.33 and 8.58%, respectively. The alkaloids
were relatively stable in the medium of the Caco-2 cell model and
intestinal perfusion fluid, with an RSD% <4.04% within 24 h. The
recovery of the four alkaloids was at a range between 95.46 and
100.99%. The LOD (S/N ≥3) and the LOQ (S/N ≥10) were 4.50 and 15.01
ng·ml−1, respectively. All data was compliant with the
requirement of analytical method validation (49,50).
UPLC validation for determination of the
apparent partition coefficient
The Po/w of BER was significantly higher,
compared with the three other alkaloids, which may be due to the
polarity of BER. The Po/w of the four alkaloids were
higher in 0.1 mol·l−1 HCl, compared with in pH 7.4 PBS
(Table I).
 | Table IOctanol-water partition coefficient
of the four alkaloids from Coptis. |
Table I
Octanol-water partition coefficient
of the four alkaloids from Coptis.
| Compound | HCl (0.1
mol·l−1) | Phosphate buffer
solution (pH 7.4) |
|---|
| COP | 0.65±0.0046 | 0.079±0.0075 |
| PAL | 0.78±0.020 | 0.082±0.0024 |
| JAT | 0.84±0.033 | 0.080±0.0025 |
| BER | 1.43±0.036a | 0.213±0.017 |
UPLC validation for determination of
permeability
Validation of the PAMPA plate model using poor and
good absorptive drugs is shown in Table II, the results of which were
concordant with previous literature (35,41).
These results suggested that a PAMPA plate may be used to
investigate the penetration and transportation of the four
alkaloids.
| Table IIPermeability assessment of four tool
drugs (×10−6 cm·s−1). |
Table II
Permeability assessment of four tool
drugs (×10−6 cm·s−1).
| Tool drug | Plate 1 | Plate 2 |
|---|
| Furosemide | 0.64±0.046 | 0.65±0.039 |
|
Hydrochlorothiazide | 0.48±0.052 | 0.59±0.13 |
| Caffeine | 11.21±0.29 | 11.31±0.048 |
| Metoprolol | 5.35±0.32 | 5.61±0.48 |
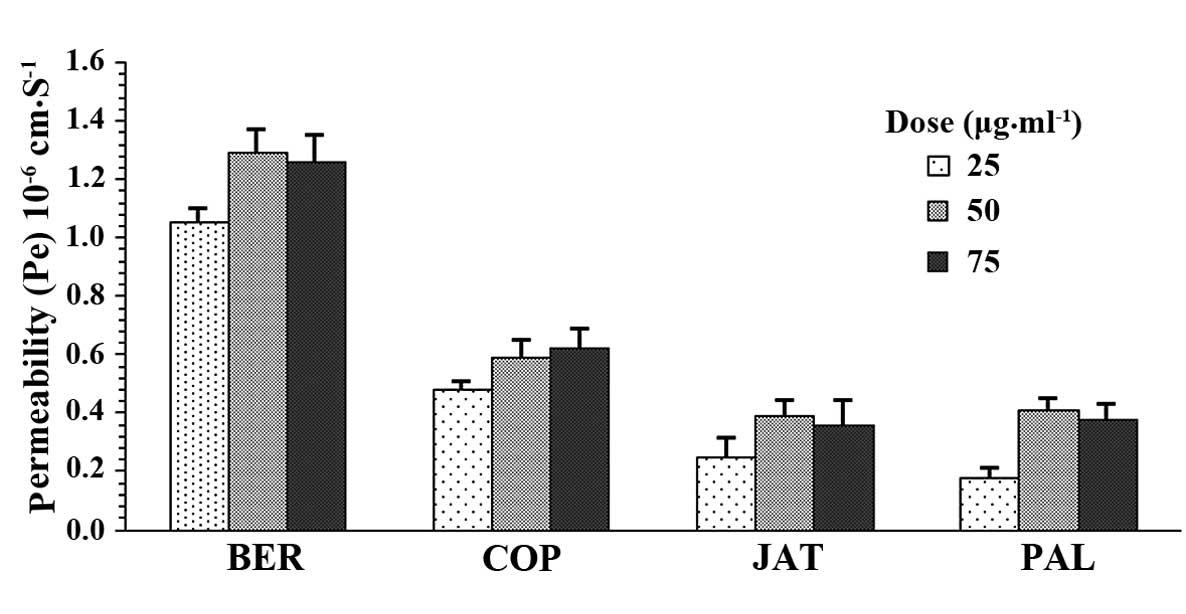
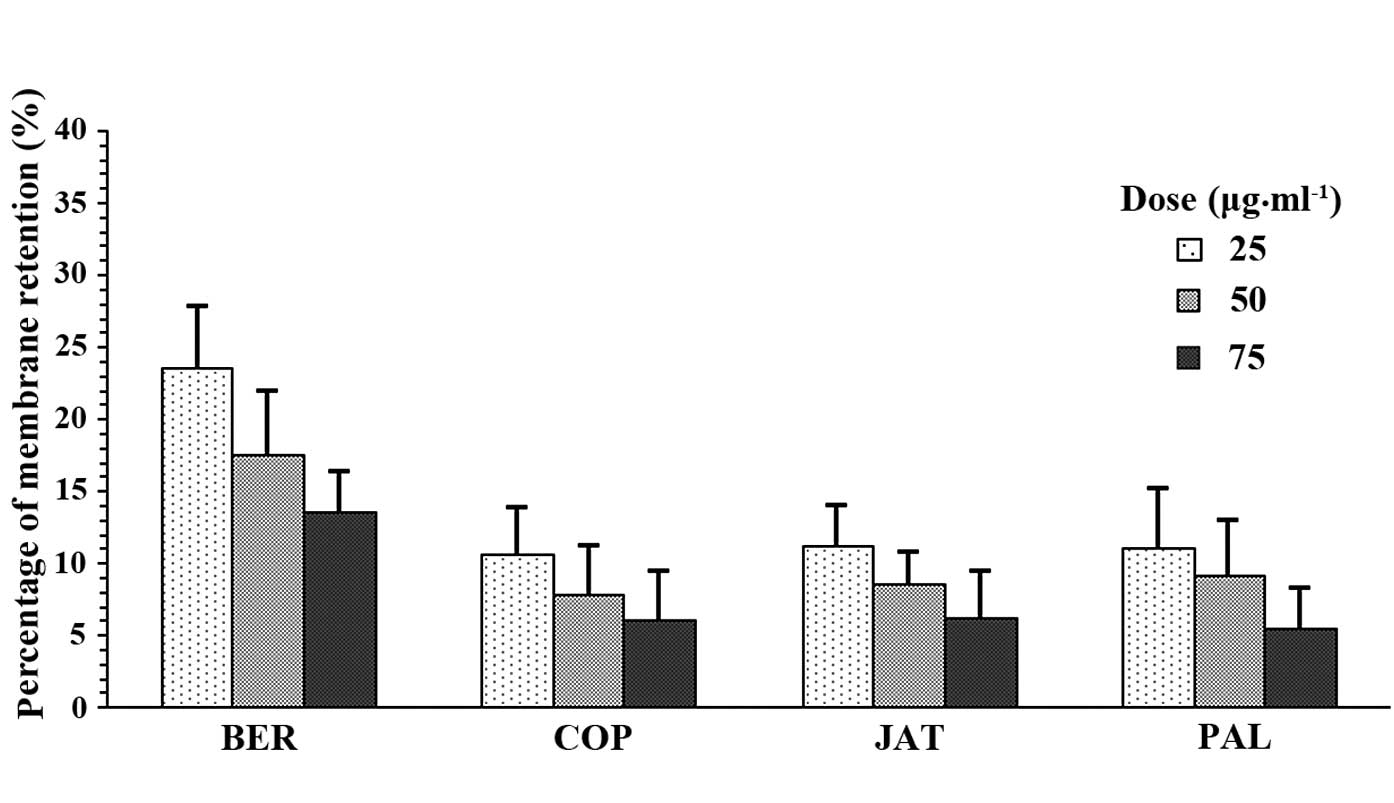
The Papp and R% of BER, COP, JAT and PAL are shown
in Fig. 3 and 4. The Papp of BER was at between 1.06 and
1.33×10⁻⁶ cm·s−1 under three concentrations,
which was significantly higher than COP (0.49–0.64×10⁻⁶
cm·s−1), PAL (0.15–0.32×10⁻⁶
cm·s−1) and JAT (0.23–0.36×10⁻⁶
cm·s−1). The R% of BER was also significantly higher
than the three other alkaloids.
Bidirectional transportation and the
effect of the P-gp transporter
The survival rate of the Caco-2 cells following
treatment with the alkaloids was determined using an MTT assay. The
survival rate (%) of all of the cells was >97.5% (Table III), and there was no effect on
Caco-2 activity following treatment with 10–100
µmol·l−1 of each alkaloid.
| Table IIIEffects of different concentrations
of the four alkaloids on the survival rate of Caco-2 cells. |
Table III
Effects of different concentrations
of the four alkaloids on the survival rate of Caco-2 cells.
| Compound | 10
µmol·l−1 | Survival rate (%)
|
|---|
| 20
µmol·l−1 | 30
µmol·l−1 | 60
µmol·l−1 | 100
µmol·l−1 |
|---|
| BER | 99.20 | 97.80 | 97.57 | 98.18 | 96.32 |
| COP | 99.56 | 98.25 | 98.02 | 98.45 | 97.23 |
| PAL | 99.35 | 98.06 | 97.88 | 97.67 | 96.18 |
| JAT | 99.38 | 98.79 | 98.34 | 98.01 | 97.72 |
Verification of the Caco-2 monolayer cell model was
performed using the propranolol cocktail drug. The Papp values of
propranolol and fluorescent yellow were 1.29×10⁻⁵ and
5.17×10⁻⁷ cm·s, respectively, which was concordant with
the findings of a previous study (51). The resistance value of the Caco-2
cells was 350–450 Ω, which indicated that the Caco-2 cell monolayer
model was successfully validated (40–42,50,52,53).
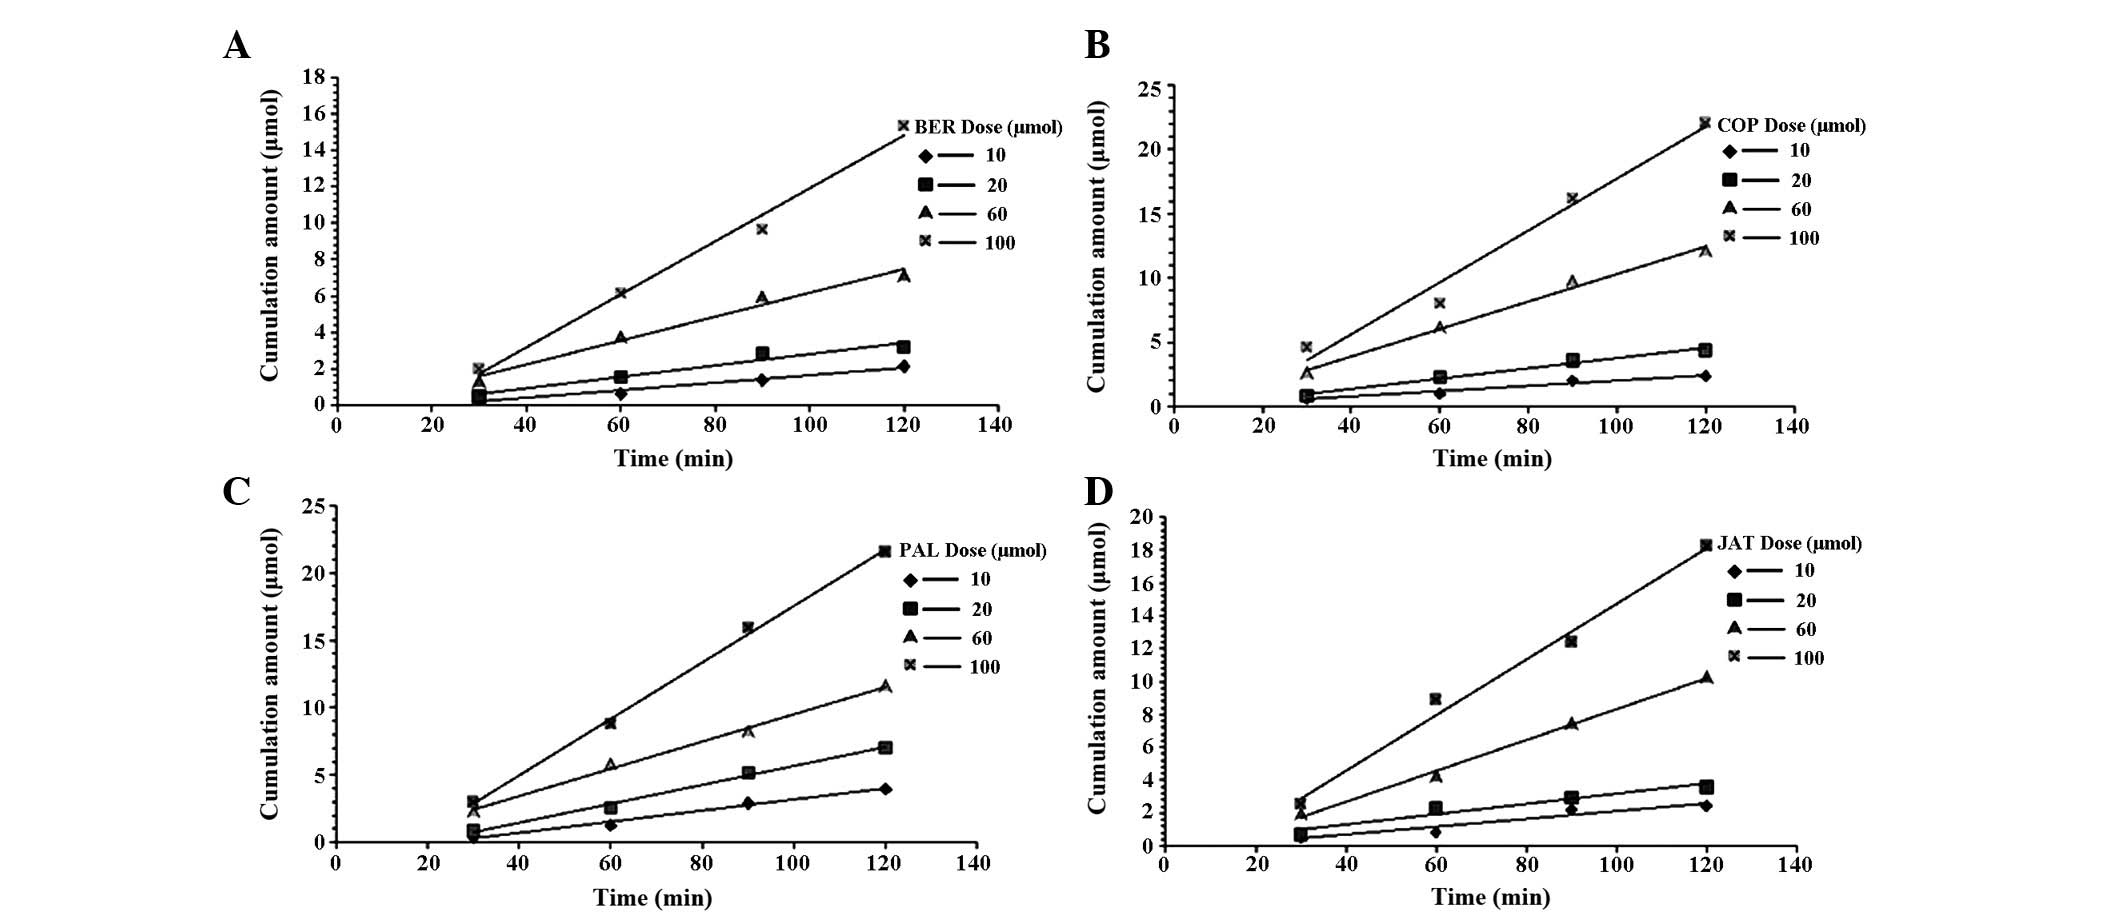
The validated Caco-2 cell monolayer model was used
to determine the bidirectional transportation of the four alkaloids
at various concentrations (AP-BL or BL-AP). The Papp results are
shown in Table IV. The Papp
(AP-BL) and Papp (BL-AP) of BER were similar as the dose increased,
indicating that other alkaloids did not affect the transportation
of BER. The Papp (AP-BL) and Papp (BL-AP) of BER linearly increased
with increasing dose (10–100 µmol·l−1) (Fig. 5). The concentration of the four
alkaloids was higher on the BL-AP side in the Caco-2 cell monolayer
model, compared with the AP-BL side, which may be caused by
carrier-mediated transportation of BER from the BL side to the AP
side. The cumulative concentration of BER versus time is shown in
Fig. 5, Papp (BL-to-AP) was
increased in a dose-dependent linear manner.
| Table IVApparent permeability coefficient of
the four alkaloids in a Caco-2 cell model. |
Table IV
Apparent permeability coefficient of
the four alkaloids in a Caco-2 cell model.
| Compound | Papp direction | 10 µmol | Papp
(×10−6 cm/s)
|
|---|
| 20 µmol | 30 µmol | 60 µmol | 100
µmol |
|---|
| BER | (AP-BL) | 2.59 | 3.53 | 2.85 | 2.98 | 2.68 |
| (BL-AP) | 25.18 | 31.30 | 20.81 | 25.30 | 25.90 |
|
(BL-AP)/(AP-BL) | 9.72 | 8.87 | 7.30 | 8.49 | 9.66 |
| COP | (AP-BL) | 1.79 | 1.97 | 2.24 | 2.49 | 2.55 |
| (BL-AP) | 16.05 | 18.81 | 20.03 | 22.83 | 23.80 |
|
(BL-AP)/(AP-BL) | 8.97 | 9.55 | 8.94 | 9.17 | 9.33 |
| PAL | (AP-BL) | 1.46 | 1.82 | 2.03 | 2.25 | 2.39 |
| (BL-AP) | 11.51 | 14.89 | 15.67 | 18.38 | 20.89 |
|
(BL-AP)/(AP-BL) | 7.88 | 8.18 | 7.72 | 8.17 | 8.74 |
| JAT | (AP-BL) | 1.46 | 1.59 | 1.78 | 2.04 | 2.37 |
| (BL-AP) | 9.50 | 10.86 | 12.32 | 15.80 | 20.80 |
|
(BL-AP)/(AP-BL) | 6.51 | 6.83 | 6.92 | 7.75 | 8.78 |
The effects of verapamil on the bidirectional
transport of the four alkaloids were determined using the Caco-2
cell monolayer. The Papp (AP-BL/BL-AP) was significantly decreased
following treatment with verapamil (Table V), indicating that P-gp proteins
may be involved in the efflux of the four alkaloids.
| Table VApparent permeability coefficient of
the four alkaloids induced by verapamil. |
Table V
Apparent permeability coefficient of
the four alkaloids induced by verapamil.
| Group | Papp
(×10−6 cm/s)
|
|---|
| AP-BL | BL-AP | AP-BL/BL-AP |
|---|
| BER | 2.85±0.02 | 20.81±0.19 | 7.30±0.02 |
| BER and
verapamil | 8.93±0.18 | 17.90±0.26 | 2.00±0.20a |
| COP | 2.24±0.12 | 20.03±0.42 | 8.94±0.36 |
| COP and
verapamil | 7.25±0.16 | 16.16±0.37 | 2.23±0.28a |
| PAL | 2.03±0.08 | 15.67±0.23 | 7.72±0.16 |
| PAL and
verapamil | 6.35±0.27 | 15.94±0.46 | 2.51±0.21a |
| JAT | 1.78±0.09 | 12.32±0.15 | 6.92±0.22 |
| JAT and
verapamil | 7.62±0.18 | 13.98±0.38 | 1.83±0.28a |
Intestinal perfusion in rats
The present study demonstrated that BER, COP, PAL
and JAT were absorbed into the rat jejunum and ileum. The level of
absorption of the compounds was markedly higher in the jejunum than
in the ileum (Table VI). The A %
of the four alkaloids were small. The absorption rate of BER was
significantly higher in the jejunum than in the ileum
(P<0.05).
| Table VIKa and absorption percentage of the
four alkaloids from Coptis in the rat intestine. |
Table VI
Ka and absorption percentage of the
four alkaloids from Coptis in the rat intestine.
| Compound | Intestinal
segment | Absorption
percentage (A %) | Ka
(h−1) |
|---|
| BER | Jejunum | 12.11±1.15a |
0.0351±0.0012a |
| Ileum | 9.82±0.89 | 0.0266±0.0024 |
| COP | Jejunum | 8.64±2.58 | 0.0235±0.0038 |
| Ileum | 6.39±3.09 | 0.0196±0.0048 |
| PAL | Jejunum | 14.36±4.56 | 0.0358±0.0089 |
| Ileum | 12.17±5.71 | 0.0323±0.0092 |
| JAT | Jejunum | 8.98±2.43 | 0.0219±0.0036 |
| Ileum | 7.54±1.45 | 0.0198±0.0024 |
Discussion
The hydrophilic or lipophilic ability of a drug can
be determined by measuring its Papp, which is an important
parameter for the prediction of passive drug diffusion. The
solubility of a drug in n-octanol is similar to that in biofilm,
and n-octanol may be used to simulate the lipid barrier of the
digestive tract. In addition, 0.1 mol·l−1 HCl and
phosphate buffer (pH 7.4) may be used to simulate the environment
of the stomach and intestines (54). The results of the present study
demonstrated that the Po/w of the four alkaloids were
significantly higher in 0.1 mol·l−1 HCl than in PBS (pH
7.4). Furthermore, the Po/w of BER was significantly
higher than the three other alkaloids in 0.1 mol·l−1 HCl
and PBS (pH 7.4).
PAMPA is a high throughput tool used for passive
diffusion drug screening. The Papp (AP-BL) of the four alkaloids
was between 0.15 and 1.33×10⁻⁶ cm·s−1; and a
drug with a Papp >1.5×10⁻⁶ cm·s−1 is
considered to be highly penetrative; therefore, the Papp of the
four alkaloids assessed in the present study indicated poor
permeability. In addition, the Papp of the four alkaloids from
BL-to-AP was significantly higher than from AP-to-BL.
The present study demonstrated that the quantity of
BER migrating through the Caco-2 cell monolayer model increased
linearly with increasing concentration. The Papp value of BER was
markedly dependent on concentration, indicating that passive
diffusion was responsible for the transport of BER from AP-to-BL.
In the presence of verapamil, the speed of transportation and the
Papp of BER were significantly increased on the AP-to-BL surface,
and significantly decreased on the BL-to-AP surface. These results
indicated that P-gp may be involved in the efflux transportation of
the alkaloids, which is concordant with previous findings (29–31,41).
The Ka for the P-gp carrier of BER was >100 µmol.
The rat intestinal perfusion experiments
demonstrated that the four alkaloids were absorbed in the jejunum
and ileum. The absorption of the four alkaloids was higher in the
jejunum, compared with in the ileum. The cumulative percentage of
intestinal absorption for the four alkaloids within 4 h was
>15.75%. These results suggested that gastrointestinal
absorption was weak due to the poor permeability and absorption of
BER, COP, PAL and JAT.
In conclusion, in combination with a previous
metabolic investigation of BER in the liver (51), the present study indicated that
weak permeability, poor absorption, rapid P-gp efflux and rapid
hepatic metabolism leads to the low oral bioavailability and low
plasma concentrations of BER, COP, PAL and JAT, and may affect
their pharmacological functions.
Acknowledgments
The present study was supported by the Technology
Major Projects for Major New Drugs Innovation and Development
(grant no. 2011ZX09102-011-08) and the National Basic Research
Program (973 Program; grant no. 2010CB530601).
References
|
1
|
Tang J, Feng Y, Tsao S, Wang N, Curtain R
and Wang Y: Berberine and Coptidis rhizoma as novel antineoplastic
agents: A review of traditional use and biomedical investigations.
J Ethnopharmacol. 126:5–17. 2009. View Article : Google Scholar : PubMed/NCBI
|
|
2
|
Choi UK, Kim MH and Lee NH: Optimization
of antibacterial activity by Gold–Thread (Coptidis Rhizoma Franch)
against Streptococcus mutans using evolutionary operation-factorial
design technique. J Microbiol Biotechnol. 17:1880–1884.
2007.PubMed/NCBI
|
|
3
|
Ye X, Feng Y, Tong Y, Ng KM, Tsao S, Lau
GK, Sze C, Zhang Y, Tang J, Shen J and Kobayashi S:
Hepatoprotective effects of Coptidis rhizoma aqueous extract on
carbon tetrachloride-induced acute liver hepatotoxicity in rats. J
Ethnopharmacol. 124:130–136. 2009. View Article : Google Scholar : PubMed/NCBI
|
|
4
|
Lin SJ, Chen CS, Lin SS, Chou MY, Shih HC,
Lee IP, Kao CT, Ho CC, Chen FL, Ho YC, et al: In vitro
anti-microbial and in vivo cytokine modulating effects of different
prepared Chinese herbal medicines. Food Chem Toxicol. 44:2078–2085.
2006. View Article : Google Scholar : PubMed/NCBI
|
|
5
|
Kim HY, Shin HS, Park H, Kim YC, Yun YG,
Park S, Shin HJ and Kim K: In vitro inhibition of coronavirus
replications by the traditionally used medicinal herbal extracts,
Cimicifuga rhizoma, Meliae cortex, Coptidis rhizoma, and
Phellodendron cortex. J Clin Virol. 41:122–128. 2008. View Article : Google Scholar
|
|
6
|
Enk R, Ehehalt R, Graham JE, Bierhaus A,
Remppis A and Greten HJ: Differential effect of Rhizoma coptidis
and its main alkaloid compound berberine on TNF-alpha induced
NFkappaB translocation in human keratinocytes. J Ethnopharmacol.
109:170–175. 2007. View Article : Google Scholar
|
|
7
|
Tse WP, Che CT, Liu K and Lin ZX:
Evaluation of the anti-proliferative properties of selected
psoriasis-treating Chinese medicines on cultured HaCaT cells. J
Ethnopharmacol. 108:133–141. 2006. View Article : Google Scholar : PubMed/NCBI
|
|
8
|
Kim YJ, Kang SA, Hong MS, Park HJ, Kim MJ,
Park HJ and Kim HK: Coptidis rhizoma induces apoptosis in human
colorectal cancer cells SNU-C4. Am J Chin Med. 32:873–882. 2004.
View Article : Google Scholar
|
|
9
|
Serafim TL, Oliveira PJ, Sardao VA,
Perkins E, Parke D and Holy J: Different concentrations of
berberine result in distinct cellular localization patterns and
cell cycle effects in a melanoma cell line. Cancer Chemother
Pharmacol. 61:1007–1018. 2008. View Article : Google Scholar
|
|
10
|
Tsai JC, Tsai S and Chang WC: Effect of
ethanol extracts of three Chinese medicinal plants with
anti-diarrheal properties on ion transport of the rat intestinal
epithelia. J Pharmacol Sci. 94:60–66. 2004. View Article : Google Scholar : PubMed/NCBI
|
|
11
|
Derosa G, Maffioli P and Cicero AF:
Berberine on metabolic and cardiovascular risk factors: An analysis
from preclinical evidences to clinical trials. Expert Opin Biol
Ther. 12:1113–1124. 2012. View Article : Google Scholar : PubMed/NCBI
|
|
12
|
Yokozawa T, Ishida A, Kashiwada Y, Cho EJ,
Kim HY and Ikeshiro Y: Coptidis Rhizoma: Protective effects against
peroxynitrite-induced oxidative damage and elucidation of its
active components. J Pharm Pharmacol. 56:547–556. 2004. View Article : Google Scholar : PubMed/NCBI
|
|
13
|
Gulfraz M, Mehmood S, Ahmad A, Fatima N,
Praveen Z and Williamson EM: Comparison of the antidiabetic
activity of Berberis lyceum root extract and berberine in
alloxan-induced diabetic rats. Phytother Res. 22:1208–1212. 2008.
View Article : Google Scholar : PubMed/NCBI
|
|
14
|
Yokozawa T, Ishida A, Cho EJ and Nakagawa
T: The effects of Coptidis Rhizoma extract on a
hypercholesterolemic animal model. Phytomedicine. 10:17–22. 2003.
View Article : Google Scholar : PubMed/NCBI
|
|
15
|
Yin J, Zhang H and Ye J: Traditional
chinese medicine in treatment of metabolic syndrome. Endocr Metab
Immune Disord Drug Targets. 8:99–111. 2008. View Article : Google Scholar : PubMed/NCBI
|
|
16
|
Guo Y, Wang QZ, Li FM, Jiang X, Zuo YF and
Wang L: Biochemical pathways in the antiatherosclerotic effect of
berberine. Chin Med J (Engl). 121:1197–1203. 2008.
|
|
17
|
Han YL, Yu HL, Lin D, Meng XL, Zhou ZY, Yu
Q, Zhang XY, Wang FJ and Guo C: In vitro inhibition of Huanglian
[Rhizoma coptidis (L.)] and its six active alkaloids on six
cyXto-chrome P450 isoforms in human liver microsomes. Phytother
Res. 25:1660–1665. 2011. View Article : Google Scholar : PubMed/NCBI
|
|
18
|
Kim JM, Jung HA, Choi JS and Lee NG:
Identification of anti-inflammatory target genes of Rhizoma
coptidis extract in lipopolysaccharide-stimulated RAW264.7 murine
macrophage-like cells. J Ethnopharmacol. 130:354–362. 2010.
View Article : Google Scholar : PubMed/NCBI
|
|
19
|
Wang Q, Zhang M, Liang B, Shirwany N, Zhu
Y and Zou MH: Activation of AMP-activated protein kinase is
required for berberine-induced reduction of atherosclerosis in
mice: The role of uncoupling protein 2. PLoS One. 6:e254362011.
View Article : Google Scholar : PubMed/NCBI
|
|
20
|
Wang C, Li J, Lv X, Zhang M, Song Y, Chen
L and Liu Y: Ameliorative effect of berberine on endothelial
dysfunction in diabetic rats induced by high-fat diet and
streptozotocin. Eur J Pharmacol. 620:131–137. 2009. View Article : Google Scholar : PubMed/NCBI
|
|
21
|
Grycová L, Dostál J and Marek R:
Quaternary protoberberine alkaloids. Phytochemistry. 68:150–175.
2007. View Article : Google Scholar
|
|
22
|
Zhang M and Chen L: Berberine in type 2
diabetes therapy: A new perspective for an old antidiarrheal drug?
Acta Pharmaceutica Sinica B. 2:379–386. 2012. View Article : Google Scholar
|
|
23
|
Ma BL, Ma YM, Gao CL, Wu JS, Qiu FR, Wang
CH and Wang X: Lipopolysaccharide increased the acute toxicity of
the Rhizoma coptidis extract in mice by increasing the systemic
exposure to Rhizoma coptidis alkaloids. J Ethnopharmacol.
138:169–174. 2011. View Article : Google Scholar : PubMed/NCBI
|
|
24
|
Yu S, Pang XY, Deng YX, Liu L, Liang Y,
Liu XD, Xie L, Wang GJ and Wang XT: A sensitive and specific liquid
chromatography mass spectrometry method for simultaneous
determination of berberine, palmatine, coptisine, epiberberine and
jatrorrhizine from Coptidis Rhizoma in rat plasma. Int J Mass
Spectrom. 268:30–37. 2007. View Article : Google Scholar
|
|
25
|
Deng Y, Liao Q, Li S, Bi K, Pan B and Xie
Z: Simultaneous determination of berberine, palmatine and
jatrorrhizine by liquid chromatography-tandem mass spectrometry in
rat plasma and its application in a pharmacokinetic study after
oral administration of coptis-evodia herb couple. J Chromatogr B
Analyt Technol Biomed Life Sci. 863:195–205. 2008. View Article : Google Scholar : PubMed/NCBI
|
|
26
|
Huang JM, Wang GQ, Jin YE, Shen T and Weng
W: Determination of palmatine in canine plasma by liquid
chromatography-tandem mass spectrometry with solid-phase
extraction. J Chromatogr B Analyt Technol Biomed Life Sci.
854:279–285. 2007. View Article : Google Scholar : PubMed/NCBI
|
|
27
|
Hua W, Ding L, Chen Y, Gong B, He J and Xu
G: Determination of berberine in human plasma by liquid
chromatography-electrospray ionization-mass spectrometry. J Pharm
Biomed Anal. 44:931–937. 2007. View Article : Google Scholar : PubMed/NCBI
|
|
28
|
Pan GY, Wang GJ, Liu XD, Fawcett JP and
Xie YY: The involvement of P-glycoprotein in berberine absorption.
Pharmacol Toxicol. 91:193–197. 2002. View Article : Google Scholar
|
|
29
|
Zhang X, Qiu F, Jiang J, Gao C and Tan Y:
Intestinal absorption mechanisms of berberine, palmatine,
jateorhizine, and coptisine: Involvement of P-glycoprotein.
Xenobiotica. 41:290–296. 2011. View Article : Google Scholar : PubMed/NCBI
|
|
30
|
Wang X, Xing D, Wang W, Lei F, Su H and Du
L: The uptake and transport behavior of berberine in Coptidis
Rhizoma extract through rat primary cultured cortical neurons.
Neurosci Lett. 379:132–137. 2005. View Article : Google Scholar : PubMed/NCBI
|
|
31
|
Maeng HJ, Yoo HJ, Kim IW, Song IS, Chung
SJ and Shim CK: P-glycoprotein-mediated transport of berberine
across Caco-2 cell monolayers. J Pharm Sci. 91:2614–2621. 2002.
View Article : Google Scholar : PubMed/NCBI
|
|
32
|
Guo Y, Li F, Ma X, Cheng X, Zhou H and
Klaassen CD: CYP2D plays a major role in berberine metabolism in
liver of mice and humans. Xenobiotica. 41:996–1005. 2011.
View Article : Google Scholar : PubMed/NCBI
|
|
33
|
Liu Y, Hao H, Xie H, Lv H, Liu C and Wang
G: Oxidative demethylenation and subsequent glucuronidation are the
major metabolic pathways of berberine in rats. J Pharm Sci.
98:4391–4401. 2009. View Article : Google Scholar : PubMed/NCBI
|
|
34
|
Li Y, Ren G, Wang YX, Kong WJ, Yang P,
Wang YM, Li YH, Yi H, Li ZR, Song DQ and Jiang JD: Bioactivities of
berberine metabolites after transformation through CYP450
isoenzymes. J Transl Med. 9:622011. View Article : Google Scholar : PubMed/NCBI
|
|
35
|
Chen X, Murawski A, Patel K, Crespi CL and
Balimane PV: A novel design of artificial membrane for improving
the PAMPA model. Pharm Res. 25:1511–1520. 2008. View Article : Google Scholar : PubMed/NCBI
|
|
36
|
Avdeef A and Testa B: Physicochemical
profiling in drug research: A brief survey of the state-of-the-art
of experimental techniques. Cell Mol Life Sci. 59:1681–1689. 2002.
View Article : Google Scholar : PubMed/NCBI
|
|
37
|
Hilgers AR, Conradi RA and Burton PS:
Caco-2 cell monolayers as a model for drug transport across the
intestinal mucosa. Pharm Res. 7:902–910. 1990. View Article : Google Scholar : PubMed/NCBI
|
|
38
|
Le Ferrec E, Chesne C, Artusson P, Brayden
D, Fabre G, Gires P, Guillou F, Rousset M, Rubas W and Scarino ML:
In vitro models of the intestinal barrier. The report and
recommendations of ECVAM Workshop 46 European Centre for the
Validation of Alternative methods. Altern Lab Anim. 29:649–668.
2001.PubMed/NCBI
|
|
39
|
Kerns EH, Di L, Petusky S, Farris M, Ley R
and Jupp P: Combined application of parallel artificial membrane
permeability assay and Caco-2 permeability assays in drug
discovery. J Pharm Sci. 93:1440–1453. 2004. View Article : Google Scholar : PubMed/NCBI
|
|
40
|
Artursson P, Palm K and Luthman K: Caco-2
monolayers in experimental and theoretical predictions of drug
transport. Adv Drug Deliv Rev. 46:27–43. 2001. View Article : Google Scholar : PubMed/NCBI
|
|
41
|
Gu L, Li N, Li Q, Zhang Q, Wang C, Zhu W
and Li J: The effect of berberine in vitro on tight junctions in
human Caco-2 intestinal epithelial cells. Fitoterapia. 80:241–248.
2009. View Article : Google Scholar : PubMed/NCBI
|
|
42
|
Stenberg P, Norinder U, Luthman K and
Artursson P: Experimental and computational screening models for
the prediction of intestinal drug absorption. J Med Chem.
44:1927–1937. 2001. View Article : Google Scholar : PubMed/NCBI
|
|
43
|
Troutman MD and Thakker DR: Efflux ratio
cannot assess P-glycoprotein-mediated attenuation of absorptive
transport: Asymmetric effect of P-glycoprotein on absorptive and
secretory transport across Caco-2 cell monolayers. Pharm Res.
20:1200–1209. 2003. View Article : Google Scholar : PubMed/NCBI
|
|
44
|
Troutman MD and Thakker DR: Novel
experimental parameters to quantify the modulation of absorptive
and secretory transport of compounds by P-glycoprotein in cell
culture models of intestinal epithelium. Pharm Res. 20:1210–1224.
2003. View Article : Google Scholar : PubMed/NCBI
|
|
45
|
Polli JW, Wring SA, Humphreys JE, Huang L,
Morgan JB, Webster LO and Serabjit-Singh CS: Rational use of in
vitro P-glycoprotein assays in drug discovery. J Pharmacol Exp
Ther. 299:620–628. 2001.PubMed/NCBI
|
|
46
|
Bermejo M, Avdeef A, Ruiz A, Nalda R,
Ruell JA, Tsinman O, González I, Fernández C, Sánchez G, Garrigues
TM and Merino V: PAMPA - a drug absorption in vitro model 7.
Comparing rat in situ, Caco-2, and PAMPA permeability of
fluoroquinolones. Eur J Pharm Sci. 21:429–441. 2004. View Article : Google Scholar : PubMed/NCBI
|
|
47
|
Reis JM, Dezani AB, Pereira TM, Avdeef A
and Serra CH: Lamivudine permeability study: A comparison between
PAMPA, ex vivo and in situ Single-Pass Intestinal Perfusion (SPIP)
in rat jejunum. Eur J Pharm Sci. 48:781–789. 2013. View Article : Google Scholar : PubMed/NCBI
|
|
48
|
U.S. Department of Health and Human
Services, Food and Drug Administration, Center for Drug Evaluation
Research (CDER) and Center for Veterinary Medicine (CVM): Guidance
for Industry. Bioanalytical Method Validation. 2001.
|
|
49
|
Tang YB: Quality by Design Approaches to
Analytical Methods - FDA Perspective. FDA/CDER. 2011.
|
|
50
|
Adson A, Burton PS, Raub TJ, Barsuhn CL,
Audus KL and Ho NF: Passive diffusion of weak organic electrolytes
across Caco-2 cell monolayers: Uncoupling the contributions of
hydrodynamic, transcellular, and paracellular barriers. J Pharm
Sci. 84:1197–1204. 1995. View Article : Google Scholar : PubMed/NCBI
|
|
51
|
Cui HM, Zhang QY, Wang JL, Chen JL, Zhang
YL and Tong XL: In vitro studies of berberine metabolism and its
effect of enzyme induction on HepG2 cells. J Ethnopharmacol. 158(Pt
A): 388–396. 2014. View Article : Google Scholar : PubMed/NCBI
|
|
52
|
Pade V and Stavchansky S: Estimation of
the relative contribution of the transcellular and paracellular
pathway to the transport of passively absorbed drugs in the Caco-2
cell culture model. Pharm Res. 14:1210–1215. 1997. View Article : Google Scholar : PubMed/NCBI
|
|
53
|
Mandagere AK, Thompson TN and Hwang KK:
Graphical model for estimating oral bioavailability of drugs in
humans and other species from their Caco-2 permeability and in
vitro liver enzyme metabolic stability rates. J Med Chem.
45:304–311. 2002. View Article : Google Scholar : PubMed/NCBI
|
|
54
|
Kostewicz ES, Aarons L, Bergstrand M,
Bolger MB, Galetin A, Hatley O, Jamei M, Lloyd R, Pepin X,
Rostami-Hodjegan A, et al: PBPK models for the prediction of in
vivo performance of oral dosage forms. Eur J Pharm Sci. 57:300–21.
2014. View Article : Google Scholar
|