Introduction
Reverse transcription-quantitative polymerase chain
reaction (RT-qPCR) is considered the most reliable technique for
the detection and quantification of mRNA expression due to its high
levels of accuracy and sensitivity (1). However, several lines of evidence
have suggested that the expression of reference genes vary between
cell types and experimental conditions (2–4). The
use of unstable internal controls can lead to incorrect results and
erroneous conclusions. Therefore, it is essential to use suitable
reference genes as a standard internal control to normalize levels
of gene expression (5). An ideal
reference gene is that which is unaffected by external or internal
factors, including cell type or experimental conditions (6), and they are stably expressed in
different samples (7). However, no
single reference gene has been reported to exhibit constant
expression levels, and there is increasing evidence suggesting that
the expression levels of commonly used reference genes, including
glyceraldehyde 3-phosphate dehydrogenase (GAPDH) and β-actin (ACTB)
vary substantially depending on experimental conditions (3,8).
Therefore, it is essential to compare and evaluate the stability of
each reference gene prior to its use in experiments.
Human mesenchymal stem cells (MSCs) are highly
proliferative, plastic adherent, fibroblast-like cells, which are
capable of osteogenic, chondrogenic and adipogenic differentiation
(9). MSCs are considered to assist
healing, in part via modulation and downregulation of the immune
response, including decreasing cytokine-associated acute
inflammation and increasing blood flow to promote normal healing,
rather than scarring (10).
Although the mechanisms underlying the behavior of MSCs during an
immune response and their immunomodula-tory effects remain to be
elucidated, it is widely-accepted that tissue-derived MSCs exhibit
potent immunomodulatory properties, including T lymphocyte, B
lymphocyte and natural killer cell suppression (11–13).
To further investigate the molecular mechanisms underlying MSC
suppression of T lymphocytes, careful selection of an appropriate
reference gene is required. To the best of our knowledge, no
previous report has described the experimental identification and
validation of suitable endogenous controls for the normalization of
T lymphocytes co-cultured with MSCs. The present study aimed to
identify the most stable endogenous controls for the normalization
of the gene expression of T lymphocytes co-cultured with different
MSCs. In total, eight common reference genes were selected and used
in the present study, and their expression stability was analyzed
using the geNorm (14), NormFinder
(15) and BestKeeper (16) algorithms.
Materials and methods
Isolation and expansion of MSCs
MSCs were isolated from four human tissue harvest
sites: Bone marrow (BM), adipose tissue (AT), umbilical cord
Wharton's jelly (WJ) and placenta (PL). Eight BM and AT tissue
samples were obtained from healthy donors (age, 18–43 and 23–50
years, respectively), and eight WJ and PL tissue samples were
obtained from female patients (age, 23–38 years) following normal
birth via caesarean section at the China-Japan Union Hospital,
Jilin University (Changchun, China). All patients provided written
informed consent, and the present study was approved by the Ethical
Committee of the China-Japan Union Hospital, Jilin University. MSCs
from the BM, AT, WJ and PL were isolated, using an enzymatid
digestion method as previously described (17). Briefly, collagenase and
hyaluronidase (Sigma-Aldrich, St. Louis, MO, USA) were used to
digest the umbilical cord tissue samples following removal of the
outer skin layer. The PL and AT were digested by collagenase only.
BM-MSCs were obtained by BM adherence culture. Briefly, the cells
were maintained in a humidified incubator containing 5%
CO2 at 37°C for 48 h, and non-adherent cells were
removed when the media was changed (18). Following processing, the MSCs were
plated in a culture flask with α-minimal essential medium (MEM)
supplemented with 10% fetal bovine serum (FBS; Gibco Life
Technologies, Carlsbad, CA, USA) and 1% penicillin/streptomycin (GE
Healthcare Life Sciences, Logan, UT, USA) (17). The culture was maintained at 37°C
with saturated humidity in an atmosphere containing 5%
CO2.
Co-culture of MSCs and T lymphocytes
Human T lymphocytes were purchased from Guangzhou
Jennio Biological Technology Co., Ltd. (Guangdong, China).
Co-culture of the MSCs and T lymphocytes was performed using 6-well
plates. Briefly, the BM, AT, WJ and PL MSCs were seeded at
5×10⁵ cells/well in regular 6-well plates containing
a-MEM supplemented with 10% FBS and 100 U/ml
penicillin/streptomycin. After 24 h, 10 µg/ml mitomycin C
(Sigma-Aldrich) was added to inhibit MSC proliferation, and the
cells were incubated for 2 h at 37°C, followed by five extensive
washes with α-MEM. A total of 5×10⁵ T lymphocytes/well
were added and stimulated with 10 ng/ml phytohemagglutinin (PHA;
Sigma-Aldrich) and 10 ng/ml interleukin (IL)-2 (Sigma-Aldrich). The
IL-2/PHA-activated T lymphocytes were subsequently cultured in
presence of the MSCs and the T lymphocytes were obtained following
incubation for 4 days.
Reference gene selection and primer
design
A total of eight commonly-used stable reference
genes were selected, including 18S ribosomal RNA (18S), GAPDH,
ACTB, peptidyl-prolylisomerase A (PPIA), β-2-microglobulin (B2M),
ribosomal protein L13a (RPL13A), hypoxanthinephosphori-bosyl
transferase 1 (HPRT1), and TATA box-binding protein (TBP), based on
previous studies (19,20). The gene sequences were obtained
from GenBank (http://www.ncbi.nlm.nih.gov/genbank/). The full name
of the reference genes, primer sequences, accession number, and
corresponding amplicon sizes are listed in Table I. Primers were designed using
Primer3 (http://flypush.imgen.bcm.tmc.edu/primer/primer3_www.cgi)/All
PCR primers were synthesized by Sangon Biotech Co., Ltd. (Shanghai,
China), with melting temperatures of 60°C. All primers were
purified using ultrapage (Research Scientific Instruments Co.,
Ltd., Xiamen, China).
 | Table ISummary of the reference genes and
primers used in the present study. |
Table I
Summary of the reference genes and
primers used in the present study.
| Symbol | Gene name | Accession no | Primer efficiency
(%) | Primer sequence | Product size
(bp) |
|---|
| 18S | 18S ribosomal
RNA | NM10098.1 | F:
5′-GTGGAGCGATTTGTCTGGTT-3′
R: 5′-AACGCCACTTGTCCCTCTAA-3′ | 92.31 | 115 |
| GAPDH |
Glyceraldehyde-3-phosphate
dehydrogenase | NM 002046 | F:
5′-ATGGGGAAGGTGAAGGTCG-3′
R: 5′-GGGGTCATTGATGGCAACAATA-3′ | 99.04 | 108 |
| ACTB | β-actin | NM_001101 | F:
5′-GAAGATCAAGATCATTGCTCCT-3′
R: 5′-TACTCCTGCTTGCTGATCCA-3′ | 89.78 | 111 |
| PPIA |
Peptidyl-prolylisomerase A | NM_021130.3 | F:
5′-TCCTGGCATCTTGTCCAT-3′
R: 5′-TGCTGGTCTTGCCATTCCT-3′ | 103.09 | 179 |
| B2M |
β-2-microglobulin | NM_004048.2 | F:
5′-CTATCCAGCGTACTCCAAAG-3′
R: 5′-GAAAGACCAGTCCTTGCTGA-3′ | 98.89 | 188 |
| RPL13A | Ribosomal protein
L13a | NM_012423.2 | F:
5′-CGAGGTTGGCTGGAAGTACC-3′
R: 5′-CTTCTCGGCCTGTTTCCGTAG-3′ | 99.79 | 121 |
| HPRT1 |
Hypoxanthinephosphoribosyl
transferase1 | NM_000194 | F:
5′-CCTGGCGTCGTGATTAGTGAT-3′
R: 5′-AGACGTTCAGTCCTGTCCATAA-3′ | 86.56 | 131 |
| TBP | TATA box-binding
protein | NM_003194 | F:
5′-GCACAGGAGCCAAGAGTGA-3′
R: 5′-GTTGGTGGGTGAGCACAAG-3′ | 98.46 | 174 |
RNA extraction and RT-qPCR
Total RNA from the co-cultured T lymphocytes was
extracted and RT-qPCR was performed, as previously described
(17). Total cellular RNA was
extracted using TRIzol® reagent (Invitrogen Life
Technologies, Carlsbad, CA, USA) according to the manufacturer's
instructions. RNA integrity was electrophoretically verified by
ethidium bromide (Sigma-Aldrich) staining and an optical density
(OD)260/OD280 nm absorption ratio >1.9. Total RNA (500 ng) was
reverse transcribed into cDNA using AWV reverse trancriptase, oligo
dT (~20 mer, Takara Biotechnology Co., Ltd., Dalian, China)
according to the manufacturer's instructions. A non-amplification
control was included without adding reverse transcriptase. The
following reaction conditions were used: 42°C for 30 min, then 95°C
for 5 min, and 5°C for 5 min. RT-qPCR was carried out using the ABI
PRISM 7900 Sequence Detection system (Applied Biosystems Life
Technologies, Foster City, CA, USA). A total of 25 ng cDNA was used
in the qRT-PCR reactions with SYBR® Green PCR Master Mix
(Applied Biosystems Life Technologies), as well as 5 µM of
gene-specific forward and reverse primers (Sangon Biotech Co.,
Ltd.). All PCR products demonstrated a single band by a
dissociation curve and gel electrophoresis. The thermocycler (Prism
7900; Applied Biosystems Life Technologies) parameters for the
amplification of these genes were as follows: 95°C for 10 min,
followed by 40 cycles at 95°C for 15 s, 55°C for 15 s and 72°C for
30 s. To evaluate the efficiency of the PCR, a standard curve was
generated using linear regression based on the cycle threshold (CT)
values. The PCR amplification products were analyzed using 2%
agarose gel electrophoresis (Sigma-Aldrich) and dissociation
curves. A single band with anticipate size indicated the PCR
product was specific. Each sample, with 10-fold serial dilutions,
was plotted against the logarithm of the cDNA dilution factor. An
estimation of PCR efficiency was calculated from the slope of the
calibration curve using the following equation: Efficiency =
[101/−slop−1] x 100%, where slop
represents the slope of the linear regression (16). All reactions were performed in
triplicate and the data were analyzed using the 2−ΔΔCt
method (5).
Reference gene evaluation using the
GeNorm, NormFinder and BestKeeper algorithms
The expression stability of the eight reference
genes were measured using three commonly used algorithms: geNorm
(https://genorm.cmgg.be/), NormFinder (http://moma.dk/normfinder-software/normfinder-faq) and
BestKeeper (http://www.gene-quantification.de/bestkeeper.html).
These three programs are based on Microsoft Excel and use different
algorithms to evaluate the expression stability of reference genes.
For geNorm and NormFinder, the Ct values were converted into
relative quantities using the 2−(Ct-lowest Ct) formula.
For BestKeeper, the Ct values were used directly.
GeNorm analyzes the gene expression stability
(M-value) and pair-wise variation (V), with the lowest M-value
representing the highest stability. V is calculated to determine
the minimal number of reference genes required. If V<0.15, the
number of reference genes is sufficient for valid
normalization.
NormFinder is based on a variance estimation
approach. Higher values indicate lower stabilities. NormFinder is
also able to compare inter- and intra-group variations in gene
stability.
BestKeeper calculates the expression level variation
for reference gene stability based on the standard deviation (SD)
and correlation coefficient (r). Genes with SD>1.00 are
considered unreliable as reference genes, and the remaining genes
are ranked according to their r-values, with the highest r-value
indicating the highest stability.
Results
Amplification specificity and primer
efficiency
The A260/280 ratio for the isolated RNA was
1.85–2.0. The amplification performance of each primer pair was
analyzed using RT-qPCR. The specificity of the PCR products were
analyzed using a dissociation curve and 2% agarose gel. No
primer/dimers or multibands/peaks were detected, confirming a
single amplified band of a predicted size (Fig. 1). All primer pairs exhibited
efficiency values ranging between 86.56 and 103.09% (Table I), with correlation coefficients of
R2>0.97.
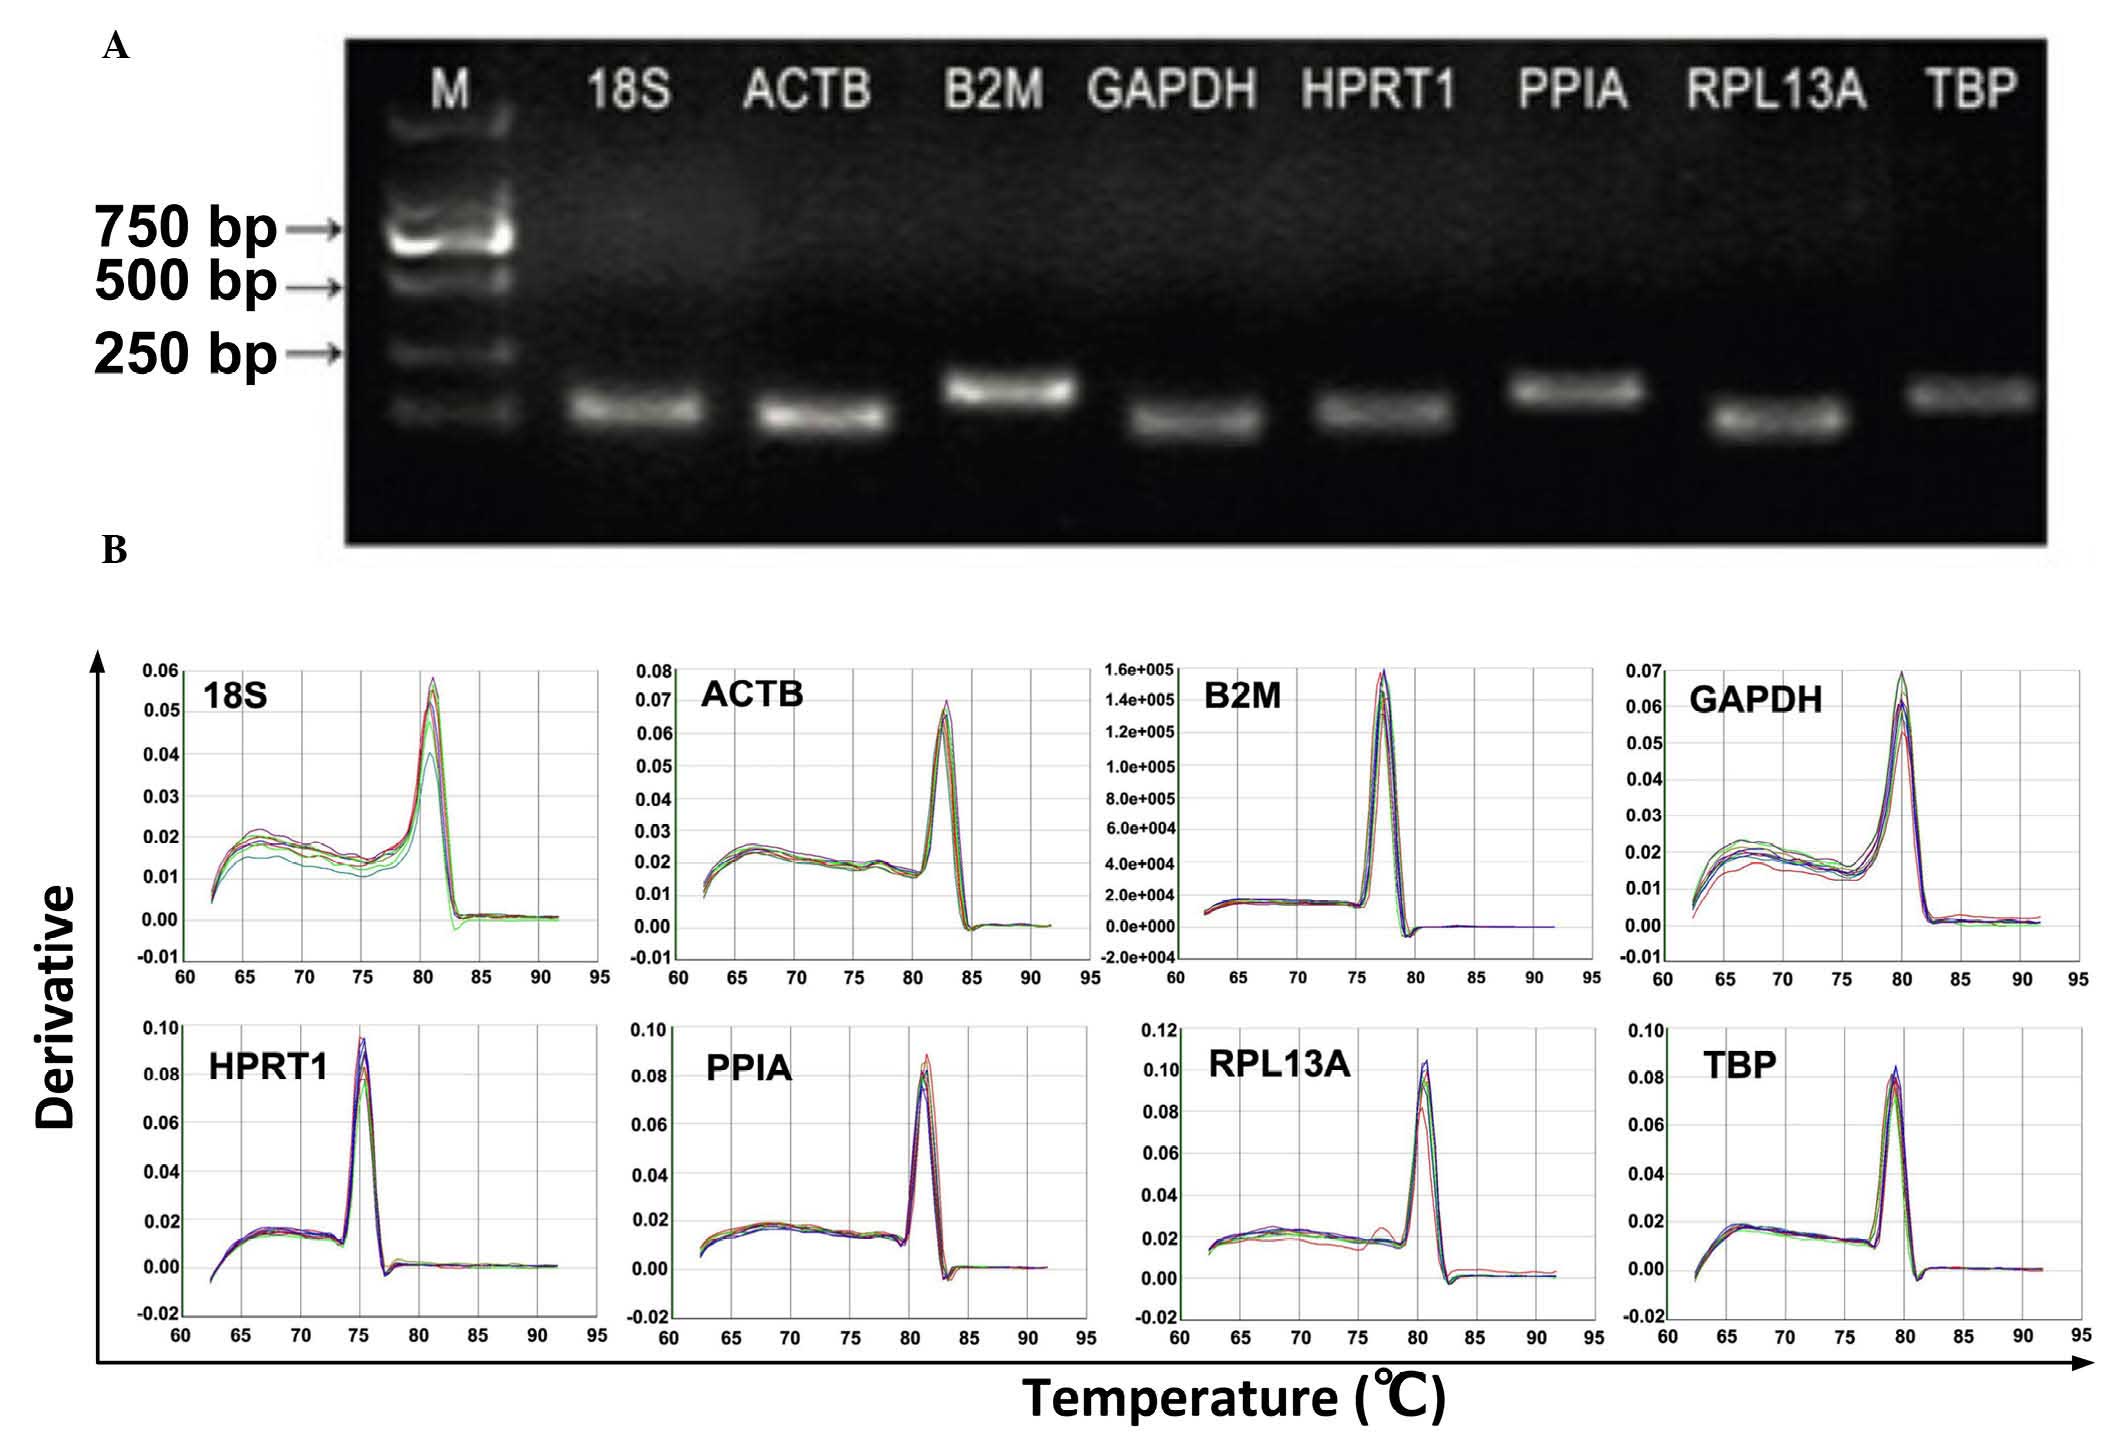 | Figure 1Primer specificity and amplicon
length. The PCR amplification products were analyzed using agarose
gel electrophoresis and dissociation curves. (A) PCR products were
run on a 2% agarose gel. The presence of a single band with
anticipate size indicated the PCR product was specific (B)
Dissociation curves for the PCR products. The single peak indicates
a specific PCR product. PCR, polymerase chain reaction; M, marker;
18S, 18S ribosomal RNA; PPIA, peptidyl-prolylisomerase A; RPL13A,
ribosomal protein L13a; HPRT1, hypoxanthinephosphoribosyl
transferase 1; ACTB, β-actin; B2M, β-2-microglobulin; GADPH,
glyceraldehyde-3-phosphate dehydrogenase; TBP, TATA box-binding
protein. |
Expression levels of the reference
genes
An ideal reference gene is expressed at relatively
high and stable levels (21).
Figure 2 shows the mean Ct-values
for each reference gene in the five samples, indicating the
expression levels in the different experimental groups. The eight
experimental reference genes exhibited a wide range of expression,
with Ct-values ranging between 15.58 for GAPDH and 22.94 for TBP.
Among these genes, GAPDH (Ct, 15.58–17.25) and 18S (Ct,
16.54–16.60) exhibited the highest expression levels, and TBP (Ct,
20.32–22.75) exhibited the lowest expression levels in the T
lymphocytes. The expression levels of each reference gene was
significantly different in all experimental cells, with the
smallest difference observed for 18S (ΔCt=0.06) and the most marked
difference observed for hypoxanthinephosphoribosyl transferase 1
(ΔCt=2.69).
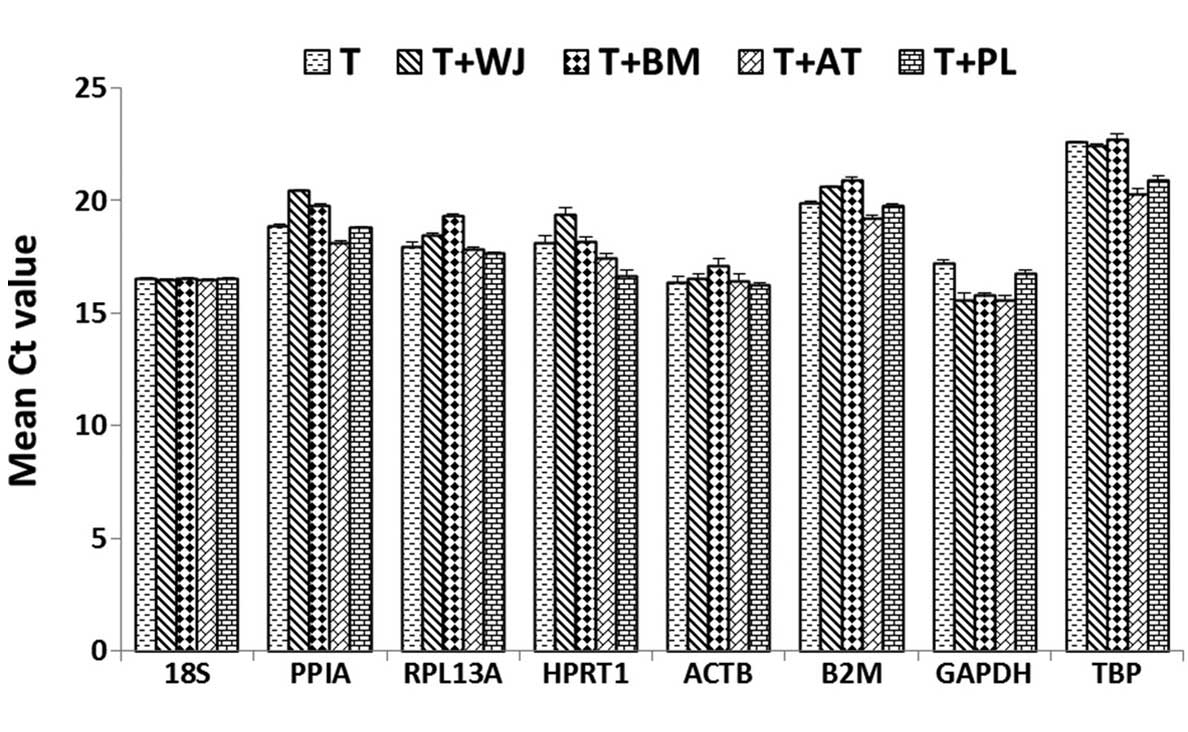 | Figure 2Expression levels of the reference
genes in the five cell groups. The values are presented in the form
of Ct values as the mean ± standard deviation (n=5). MSCs,
mesenchymal stem cells; WJ, Wharton's jelly; BM, bone marrow; AT,
adipose tissue; PL, placenta; WJ+T, T lymphocytes co-cultured with
WJ MSCs; BM+T, T lymphocytes co-cultured with BM MSCs; AT+T, T
lymphocytes co-cultured with AT MSCs; PL+T, T lymphocytes
co-cultured with PL MSCs; Ct, threshold cycle. |
RPL13A are the most stably expressed
reference genes in T lymphocytes co-cultured with MSCs
The average stability M-values of the eight
reference genes in the experimental tissue samples are shown in
Fig. 3A. According the principles
of geNorm, B2M and RPL13A were the most stably expressed genes
(M<0.4). GAPDH and TBP were the least stably expressed genes,
although their M-values remained <0.9. The V2/3 value, which
indicates the pair-wise variation when the number of normalization
factors increases between two and three, was 0.142, which was below
the cut-off value of 0.15. Therefore, the B2M and RPL13A reference
genes were considered sufficiently stable, and addition of the
third gene is optional (Fig.
3B).
 | Figure 3Selection of the most suitable
reference genes among the samples, determined by geNorm. (A)
M-values of the eight reference genes. Ranking of the genes
according to their expression stability is indicated on the x-axis.
Low M-values indicate high expression stability. (B) Optimal number
of reference genes for normalization based on their V-values. The
V-value defines the pair-wise variation between two sequential
normalization factors, determined by geNorm. M-value, expression
stability measure; GADPH, glyceraldehyde-3-phosphate dehydrogenase;
TBP, TATA box-binding protein; HPRT1, hypoxanthinephosphoribosyl
transferase 1; PPIA, pep-tidyl-prolylisomerase A; 18S, 18S
ribosomal RNA; ACTB, β-actin; RPL13A, ribosomal protein L13a; B2M,
β-2-microglobulin. |
According to NormFinder, reference genes that are
more stably expressed are indicated by lower stability values. The
most stable genes identified in the present study were B2M, with a
stability value of 0.251. The most unstable genes were GAPDH, HPRT1
and TBP, which exhibited stability values of 0.594, 0.473 and
0.465, respectively (Fig. 4). The
ranking of the selected reference genes used in the present study,
according to stability was as follows: B2M>RPL13A> PPIA>
ACTB>18S>TBP>hypoxanthinephosphoribosyl transferase 1
(HPRT1)>GAPDH. GAPDH was found to be the most unstable reference
gene.
 | Figure 4Expression stability values of the
reference genes, determined by NormFinder. The genes were ranked
according to their expression stability, with the lowest stability
values indicating stable expression. GADPH,
glycer-aldehyde-3-phosphate dehydrogenase; HPRT1,
hypoxanthinephosphoribosyl transferase 1; TBP, TATA box-binding
protein; 18S, 18S ribosomal RNA; ACTB, β-actin; PPIA,
peptidyl-prolylisomerase A; RPL13A, ribosomal protein L13a; B2M,
β-2-microglobulin. |
The results of the BestKeeper analysis are presented
in Table II. GAPDH was the most
unstable reference gene and TBP was the most stable reference gene
determined by BestKeeper (Fig. 5).
These results suggested that TBP, B2M and PPIA were the most stable
reference genes, with the highest r-values, whereas GAPDH had the
lowest r-value (0.04), reflecting the least stable expression.
 | Figure 5Evaluation of reference gene
stability, determined by BestKeeper. (A) Correlation coefficient
(r) values of the reference genes, determined by BestKeeper.
Ranking of the genes according to their expression stability, with
low stability values indicating stable expression. (B) Standard
deviation values of the reference genes. GADPH,
glyceraldehyde-3-phosphate dehydrogenase; 18S, 18S ribosomal RNA;
ACTB, β-actin; HPRT1, hypo-xanthinephosphoribosyl transferase 1;
RPL13A, ribosomal protein L13a; PPIA, peptidyl-prolylisomerase A;
B2M, β-2-microglobulin; TBP, TATA box-binding protein. |
| Table IIStability of the eight reference
genes, determined using the BestKeeper algorithm. |
Table II
Stability of the eight reference
genes, determined using the BestKeeper algorithm.
| Parameter | 18S | PPIA | RPL13A | HPRT1 | ACTB | B2M | GAPDH | TBP |
|---|
| Samples (n) | 10 | 10 | 10 | 10 | 10 | 10 | 10 | 10 |
| CT geo mean | 16.556 | 19.212 | 18.268 | 17.964 | 16.567 | 20.085 | 16.204 | 21.783 |
| CT ar mean | 16.556 | 19.229 | 18.278 | 17.988 | 16.571 | 20.095 | 16.219 | 21.807 |
| CT min | 16.529 | 18.132 | 17.674 | 16.452 | 16.164 | 19.061 | 15.279 | 20.086 |
| CT max | 16.593 | 20.476 | 19.428 | 19.664 | 17.427 | 21.046 | 17.382 | 22.943 |
| CT ± SD | 0.020 | 0.735 | 0.509 | 0.741 | 0.297 | 0.548 | 0.652 | 0.944 |
| CV (%CT) | 0.120 | 3.820 | 2.786 | 4.118 | 1.792 | 2.725 | 4.022 | 4.327 |
| R-value | 0.474 | 0.865 | 0.794 | 0.78 | 0.578 | 0.915 | −0.04 | 0.946 |
Overall, following stability analysis of the eight
reference genes using the geNorm, NormFinder and BestKeeper
algorithms, geNorm and NormFinder indicated that B2M and RPL13A
were the most stable reference genes, and that GAPDH was the least
stable reference gene. However BestKeeper demonstrated that TBP and
B2M were the most stable reference genes. A summary of the rankings
produced by the three algorithms is shown in Table III.
| Table IIIRanking of reference gene stability
using the geNorm, NormFinder and BestKeeper algorithms. |
Table III
Ranking of reference gene stability
using the geNorm, NormFinder and BestKeeper algorithms.
| Rank | geNorm | M-value | NormFinder | Stability | BestKeeper | r-value |
|---|
| 1 | B2M/RPL13A | 0.364 | B2M | 0.251 | TBP | 0. 946 |
| 2 | a | | RPL13A | 0.272 | B2M | 0.915 |
| 3 | ACTB | 0.426 | PPIA | 0.308 | PPIA | 0.865 |
| 4 | 18S | 0.487 | ACTB | 0.332 | RPL13A | 0.794 |
| 5 | PPIA | 0.559 | 18S | 0.341 | HPRT1 | 0.780 |
| 6 | HPRT1 | 0.646 | TBP | 0.465 | ACTB | 0.578 |
| 7 | TBP | 0.697 | HPRT1 | 0.473 | 18S | 0.474 |
| 8 | GAPDH | 0.803 | GAPDH | 0.594 | GAPDH | 0.040 |
Discussion
It is well established that a reference gene
requires validation prior to a specific experiment in order to
confirm that gene expression is not affected by the experimental
conditions. However, increasing evidence suggests that the
expression levels of widely-used reference genes vary significantly
in independent investigations (3,22).
Therefore, it is essential to normalize the expression levels of
reference genes, and determine their reliability prior to RT-qPCR
analysis. To the best of our knowledge, the present study is the
first to investigate the stability of reference genes in T
lymphocytes co-cultured with different MSCs.
The results of the present study suggested that the
expression of reference genes varied significantly between
different cells. Therefore, investigations of gene expression
alterations between different cell types requires careful selection
of reference genes, which are expressed at similar relative levels
between the cell types.
In the present study, the results obtained from the
three algorithms, geNorm, NormFinder and BestKeeper, demonstrated
discrepancies in the stability ranking of the reference genes.
These differences were likely to be caused by the different
calculation algorithms used in these software programs (8). According to geNorm, the reference
genes with an average M-value expression <1.5 are considered
reliable. Therefore, RPL13A and B2M were the most stable reference
genes determined by geNorm in the present study. Similarly, the
results of NormFinder suggested that B2M was the most stable
reference gene, followed by RPL13A. When intergroup variation was
taken into consideration, 18S and TBP were revealed as the optimal
combination. In addition, the stability value of this combination
(0.163) was lower than that of B2M (0.251), indicating that the
combination of 18S and TBP as reference genes is sufficiently
reliable for relative quantification. Therefore, the number of
reference genes also depends on the experimental conditions.
BestKeeper identified TBP and B2M as the most stable reference
genes. All three algorithms determined GAPDH as the least stable
reference gene.
In the present study, GAPDH was confirmed as the
least stable reference gene. Another reference gene, ACTB, is
frequently used to normalize RT-qPCR data without any prior
validation (23). However, ACTB
was ranked with low stability in the present study, indicating that
it was unsuitable for use in T lymphocytes. The results of the
present study demonstrated that the evaluation of reference genes
for normalization of RT-qPCR data is essential, and the use of
common reference genes, including ACTB and GAPDH, without prior
validation may lead to false results.
PPIA has a versatile role as a reference gene in
immuno-suppression, being regulated by CD4+ T cells and
inducing leukocyte subsets (24–26).
It has been suggested that the expression of PPIA is lower in
unstimulated T lymphocytes, but may be higher than normal in T
lymphocytes stimulated with allergens or MSCs (19). Although the results of the present
study did not indicate high expression levels of PPIA in the MSC
co-cultured groups, its readily altered characteristics makes PPIA
unreliable as a reference gene. Therefore, when the experimental
conditions or experimental treatments may lead to a change in the
expression levels of the reference gene, this reference gene cannot
be used to normalize the results of RT-qPCR.
In conclusion, among the eight genes analyzed in the
present study, RPL13A and B2M were identified as the most suitable
for analysis of gene expression levels in T cells co-cultured with
MSCs, whereas GAPDH is the least stable gene, and is unsuitable for
use as an internal control. These findings may also be useful when
validating other genes using selected reference genes from T
lymphocytes.
Acknowledgments
This study was supported by Jilin university funding
from the Tang Ao Qing Distinguished Professorship (Professor Y
Wang) (grant no. 450091105188).
References
|
1
|
Cikos S and Koppel J: Transformation of
real-time PCR fluorescence data to target gene quantity. Anal
Biochem. 384:1–10. 2009. View Article : Google Scholar
|
|
2
|
Zhong Q, Zhang Q, Wang Z, Qi J, Chen Y, Li
S, Sun Y, Li C and Lan X: Expression profiling and validation of
potential reference genes during Paralichthys olivaceus
embryogenesis. Mar Biotechnol (NY). 10:310–318. 2008. View Article : Google Scholar
|
|
3
|
Cordoba EM, Die JV, Gonzalez-Verdejo CI,
Nadal S and Román B: Selection of reference genes in Hedysarum
coronarium under various stresses and stages of development. Anal
Biochem. 409:236–243. 2011. View Article : Google Scholar
|
|
4
|
Schmittgen TD and Zakrajsek BA: Effect of
experimental treatment on housekeeping gene expression: Validation
by real-time, quantitative RT-PCR. J Biochem Biophys Methods.
46:69–81. 2000. View Article : Google Scholar : PubMed/NCBI
|
|
5
|
Dheda K, Huggett JF, Bustin SA, Johnson
MA, Rook G and Zumla A: Validation of housekeeping genes for
normalizing RNA expression in real-time PCR. Biotechniques.
37:112–114. 2004.PubMed/NCBI
|
|
6
|
Radonić A, Thulke S, Mackay IM, Landt O,
Siegert W and Nitsche A: Guideline to reference gene selection for
quantitative real-time PCR. Biochem Biophys Res Commun.
313:856–862. 2004. View Article : Google Scholar
|
|
7
|
Suzuki T, Higgins PJ and Crawford DR:
Control selection for RNA quantitation. Biotechniques. 29:332–337.
2000.PubMed/NCBI
|
|
8
|
Chang E, Shi S, Liu J, Cheng T, Xue L,
Yang X, Yang W, Lan Q and Jiang Z: Selection of reference genes for
quantitative gene expression studies in Platycladus orientalis
(Cupressaceae) Using real-time PCR. PLoS One. 7:e332782012.
View Article : Google Scholar : PubMed/NCBI
|
|
9
|
Pittenger MF, Mackay AM, Beck SC, Jaiswal
RK, Douglas R, Mosca JD, Moorman MA, Simonetti DW, Craig S and
Marshak DR: Multilineage potential of adult human mesen-chymal stem
cells. Science. 284:143–147. 1999. View Article : Google Scholar : PubMed/NCBI
|
|
10
|
Tomic S, Djokic J, Vasilijic S, Vucevic D,
Todorovic V, Supic G and Colic M: Immunomodulatory properties of
mesenchymal stem cells derived from dental pulp and dental follicle
are susceptible to activation by toll-like receptor agonists. Stem
Cells Dev. 20:695–708. 2011. View Article : Google Scholar
|
|
11
|
Ramasamy R, Tong CK, Seow HF, Vidyadaran S
and Dazzi F: The immunosuppressive effects of human bone
marrow-derived mesenchymal stem cells target T cell proliferation
but not its effector function. Cell Immunol. 251:131–136. 2008.
View Article : Google Scholar : PubMed/NCBI
|
|
12
|
Che N, Li X, Zhou S, Liu R, Shi D, Lu L
and Sun L: Umbilical cord mesenchymal stem cells suppress B-cell
proliferation and differentiation. Cell Immunol. 274:46–53. 2012.
View Article : Google Scholar : PubMed/NCBI
|
|
13
|
Spaggiari GM, Capobianco A, Becchetti S,
Mingari MC and Moretta L: Mesenchymal stem cell-natural killer cell
interactions: Evidence that activated NK cells are capable of
killing MSCs, whereas MSCs can inhibit IL-2-induced NK-cell
proliferation. Blood. 107:1484–1490. 2006. View Article : Google Scholar
|
|
14
|
Vandesompele J, De Preter K, Pattyn F,
Poppe B, Van Roy N, De Paepe A and Speleman F: Accurate
normalization of real-time quantitative RT-PCR data by geometric
averaging of multiple internal control genes. Genome Biol.
3:RESEARCH00342002. View Article : Google Scholar : PubMed/NCBI
|
|
15
|
Andersen CL, Jensen JL and Ørntoft TF:
Normalization of real-time quantitative reverse transcription-PCR
data: A model-based variance estimation approach to identify genes
suited for normalization, applied to bladder and colon cancer data
sets. Cancer Res. 64:5245–5250. 2004. View Article : Google Scholar : PubMed/NCBI
|
|
16
|
Pfaffl MW, Tichopad A, Prgomet C and
Neuvians TP: Determination of stable housekeeping genes,
differentially regulated target genes and sample integrity:
BestKeeper-Excel-based tool using pair-wise correlations.
Biotechnol Lett. 26:509–515. 2004. View Article : Google Scholar : PubMed/NCBI
|
|
17
|
Li X, Bai J, Ji X, Li R, Xuan Y and Wang
Y: Comprehensive characterization of four different populations of
human mesenchymal stem cells as regards their immune properties,
proliferation and differentiation. Int J Mol Med. 34:695–704.
2014.PubMed/NCBI
|
|
18
|
Meirelles Lda S and Nardi NB: Murine
marrow-derived mesenchymal stem cell: Isolation, in vitro
expansion, and char-acterization. Br J Haematol. 123:702–711. 2003.
View Article : Google Scholar : PubMed/NCBI
|
|
19
|
Mane VP, Heuer MA, Hillyer P, Navarro MB
and Rabin RL: Systematic method for determining an ideal
housekeeping gene for real-time PCR analysis. J Biomol Tech.
19:342–347. 2008.
|
|
20
|
Wang T, Liang ZA, Sandford AJ, Xiong XY,
Yang YY, Ji YL and He JQ: Selection of suitable housekeeping genes
for real-time quantitative PCR in CD4 (+) lymphocytes from
asthmatics with or without depression. PloS One. 7:e483672012.
View Article : Google Scholar
|
|
21
|
Huggett J, Dheda K, Bustin S and Zumla A:
Real-time RT-PCR normalisation; strategies and considerations.
Genes Immun. 6:279–284. 2005. View Article : Google Scholar : PubMed/NCBI
|
|
22
|
Schmittgen TD and Zakrajsek BA: Effect of
experimental treatment on housekeeping gene expression: Validation
by real-time, quantitative RT-PCR. J Biochem Biophys Methods.
46:69–81. 2000. View Article : Google Scholar : PubMed/NCBI
|
|
23
|
Najar M, Raicevic G, Boufker HI, Fayyad
Kazan H, De Bruyn C, Meuleman N, Bron D, Toungouz M and Lagneaux L:
Mesenchymal stromal cells use PGE2 to modulate activation and
proliferation of lymphocyte subsets: Combined comparison of adipose
tissue, Wharton's Jelly and bone marrow sources. Cell Immunol.
264:171–179. 2010. View Article : Google Scholar : PubMed/NCBI
|
|
24
|
Colgan J, Asmal M, Neagu M, Yu B,
Schneidkraut J, Lee Y, Sokolskaja E, Andreotti A and Luban J:
Cyclophilin A regulates TCR signal strength in CD4+ T cells via a
proline-directed conformational switch in Itk. Immunity.
21:189–201. 2004. View Article : Google Scholar : PubMed/NCBI
|
|
25
|
Arora K, Gwinn WM, Bower MA, Watson A,
Okwumabua I, MacDonald HR, Bukrinsky MI and Constant SL:
Extracellular cyclophilins contribute to the regulation of
inflammatory responses. J Immunol. 175:517–522. 2005. View Article : Google Scholar : PubMed/NCBI
|
|
26
|
Damsker JM, Bukrinsky MI and Constant SL:
Preferential chemotaxis of activated human CD4+ T cells by
extracellular cyclophilin A. J Leukoc Biol. 82:613–618. 2007.
View Article : Google Scholar : PubMed/NCBI
|


