Introduction
It has been reported that gliomas arise following
the malignant transformation of neural stem cells or progenitors
(1–4). Glioma stem cells (GSCs) are a rare
subpopulation of cells within glioma tissues. GSCs have a distinct
self-renewal property and can generate all the heterogeneous
lineages of cancer cells, which eventually constitute a tumor
(5). GSCs are responsible for the
initiation, progression, metastasis and recurrence of cancer
(6). Investigations on cancer stem
cells (CSCs) may assist in further understanding the mechanisms of
development of glioma, and may provide a more effective method for
their treatment.
In previous studies, several markers of CSCs have
been found, including CD133, SSEA1, CD44 and A2B5 (7–9).
However, not all CSCs express all of the above-mentioned stem cell
markers. In a previous study, it was reported that only
CD133+ cells were found in CSCs (5,10).
Subsequent studies by Beier et al (5) and Wang et al (11) found the existence of
CD133− cells in CSCs. In a previous study, it was
reported that A2B5+ cells from glioblastma also exhibit
cancer stem-like properties (8).
Compared with A2B5− cells from glioblastoma tissue,
A2B5+ cells exhibit more marked tumorigenic potential
in vivo (7). However, in
CSC lines, the differences between A2B5− and
A2B5+ cells remain to be fully elucidated.
In the present study, the differences between
A2B5− cells and A2B5+ cells from the SHG139s
GSC line were compared. A SHG139s GCS line possessing the molecular
phenotype of CD133low/A2B5high was cultured
and developed in a previous study (12). In order to rule out the effect of
the expression of CD133, the CD133+ cells were first
excluded using magnetic-activated cell sorting (MACS). As
A2B5− and A2B5+ cells from CD133−
SHG139s possess stem cell properties the aim of the present study
was to investigate whether expression of A2B5 affects
proliferation, invasion, and angiogenesis of CD133−
SHG139s.
Materials and methods
Cell culture
The SHG139s GSC line was developed and provided by
the Neurosurgery and Brain and Nerve Research Laboratory, The First
Affiliated Hospital of Soochow University, (Suzhou, China). The
SHG139s cell line was maintained in stem-cell permissive medium
[Dulbecco's modified Eagle's medium (DMEM)-F12 containing 20 ng/ml
epidermal growth factor, basic fibroblast growth factor (bFGF;
R&D Systems, Inc., Minneapolis, MN, USA), nitrogen gas
(dilution, 1:50) and B27 (dilution, 1:50; Invitrogen; Thermo Fisher
Scientific, Inc., Waltham, MA, USA)].
MACS
The cells were dissociated using 0.25% trypsin
(Beyotime Institute of Biotechnology, Haimen, China) and
resuspended in phosphate-buffered saline (PBS). All reagents and
supplies for MACS separation were purchased from Miltenyi Biotec
GmbH (Bergisch-Gladbach, Germany). Selection of CD133−
SHG139s cells was performed, according to the manufacturer's
instructions, using CD133/1 Micro Beads. Subsequently, the
CD133− cells were separated from the A2B5+
cells and A2B5− cells, according to the manufacturer's
instructions, using A2B5 Micro Beads.
In vitro invasion assay
The CD133−/A2B5+and
CD133−/A2B5− cells were transferred onto
Matrigel-coated invasion chambers (24-well insert, 8-µm
pores; BD Biosciences, Franklin Lakes, NJ, USA), containing
serum-free DMEM. DMEM containing 10% fetal bovine serum was added
to the lower chamber as a chemoattractant. Following an incubation
period at 37.5°C for 48–72 h, non-invading cells were removed from
the inner part of the insert using a cotton swab. The cells on the
lower membrane surface were fixed in 4% formaldehyde (Beyotime
Institute of Biotechnology) and stained with 0.1% crystal violet
(Beyotime Institute of Biotechnology). The number of invading cells
were manually counted in five randomly-selected fields under a
microscope (CKX41SF inverted microscope; Olympus Corporation,
Tokyo, Japan) and images were captured.
Western blot analysis
The primary antibodies used in the present study
were polyclonal rabbit anti-human tissue inhibitor of
metalloproteinase 3 (TIMP3; cat. no. BA0577), polyclonal rabbit
anti-human E-cadherin (cat. no. PB0583), polyclonal rabbit
anti-human matrix metalloproteinase (MMP) 2 (cat. no. BA0569) and
anti-MMP9 (cat. no. BM0573) all purchased from Wuhan Boster
Bioengineering Co., Ltd. (Wuhan, China). Total protein from the
cells was directly extracted in lysis buffer (Beyotime Institute of
Biotechnology) and the concentration of total protein was
quantified using an ultraviolet spectrophotometer (Multiskan Mk3;
Thermo Fisher Scientific, Waltham, MA, USA). Protein samples (100
or 50 µg) were separated using 12% sodium dodecyl
sulfate-polyacrylamide gel electrophoresis (Beyotime Institute of
Biotechnology). The proteins were then transferred onto
nitrocellulose membranes (Beyotime Institute of Biotechnology) and
non-specific binding was blocked by incubating the membranes in 5%
non-fat milk. The membranes were incubated at 37°C with primary
antibodies overnight at 4°C. Following incubation, the membranes
were washed with PBS with Tween-20 and incubated at 37°C for 2 h
with horseradish peroxidase (HRP)-conjugated monoclonal goat
anti-rabbit secondary antibodies (cat no. Beyotime Institute of
Biotechnology; cat. no. A0208), followed by detection and
visualization using electrochemiluminescence western blotting
detection reagents (Pierce Biotechnology, Inc.; Thermo Fisher
Scientific, Inc.). Quantification of protein expression was
performed by measuring the gray-scale value of bands using ImageJ
software (version 2.1.4.7; National Institutes of Health, Bethesda,
MD, USA).
Subcutaneous implanted models
A total of 16 nude mice were separated into two
groups (each group comprised of four female and four male mice).
The mice were aged ~4–6 weeks and weighed 24–28g. The mice were
raised in specific-pathogen free conditions, and the temperature
was maintained between 26 and 28°C. The mice were exposed to ~10 h
light per day, and given food and water following high-temperature
sterilization. The mice were raised separately, but under the same
conditions and were fed standard chow. To investigate the effects
of A2B5 expression on tumor growth in vivo, cells
(1×10⁶) from the two groups
(CD133−/A2B5+ and
CD133−/A2B5−) were injected into the left
axilla of nude mice (n=8). For the injection, the cells were
suspended in DMEM-F12 to the same concentration (1×10⁷
cells/ml) and 100 µl cell suspension was injected into each
of the mice on the same day. On day 17 post-implantation, caliper
measurements were performed to assess tumor growth.
Immunohistochemistry (IHC) and
immunofluorescence (ICC)
Mice received an intraperitoneal injection of 45
mg/kg pentobarbital sodium (Shanghai Westang Bio-tech Co., Ltd.,
Shanghai, China) for anesthetization. The tumors (weight, 1–2.5 g)
were excised using tweezers and scissors, and the mice were
sacrificed by cervical dislocation. The formalin-fixed
paraffin-embedded (Qilin Environmental Technology Firm, Guangzhou,
China) SHG139s tumors were cut into 6-µm sections using a
microtome (RM2016; Leica Biosystems, Nussloch, Germany). Antigen
retrieval was performed in 10 mM sodium citrate buffer (pH 6;
Beyotime Institute of Biotechnology) for 16 min at 96–98°C. The
slides were then incubated with primary antibodies against MMP9,
MMP2, E-cadherin, TIMP3 and Ki-67 (cat. no. BA2888; Wuhan Boster
Bioengineering Co., Ltd.), and with antibodies against vascular
endothelial growth factor (VEGF; cat. no. ab46154), VEGF receptor 2
(VEGFR2; cat. no. ab2349) and CD34 (cat. no. ab81289; Abcam, Tokyo,
Japan). The sections were subsequently incubated with a cell and
tissue HRP-DAB staining system (R&D Systems, Inc., Minneapolis,
MN, USA), according to the manufacturer's instructions.
Immunostaining was performed using tumor controls that were
positive (tumors formed by A2B5+ cells) and negative
(tumors formed by A2B5− cells), and was evaluated by a
pathologist in a blinded-manner. For ICC staining, the cells were
seeded onto coverslips (~5×10⁵ cells/ml) and fixed with
4% paraformaldehyde (Sigma-Aldrich), treated with 3% hydrogen
peroxide for 10 min and incubated with the antibodies, described
above, overnight at 4°C. Fluorescein isothiocyanate- or
tetramethyl-rhodamine isothiocyanate-labeled goat anti-rabbit
secondary antibodies (1:200; cat. no. ab97178; Abcam) were then
added and incubated for 2 h at 37°C. The
4′,6-diamidino-2-phenyl-indole reagent (Wuhan Boster Bioengineering
Co., Ltd.) was used to stain the cell nuclei, and the cells were
visualized using fluorescence microscopy (BX40F4; Olympus
Corporation).
Secondary sphere forming assay
The cells, which were isolated using MACS were
seeded (100 cells/well) into 96-well plates in the presence of the
stem cell-permissive medium (0.2 ml). The cultures were maintained
by replacing half of the medium every 3 days. A subsphere-forming
assay (also termed passaging) was repeated every 2 weeks. Following
each passage, the number and the size of the spheres were assessed,
on days 7 and 14, under a CKX41SF inverted microscope.
Cell cycle analysis and cell
proliferation assay
Cells were collected in an exponential growth phase
and then fixed with ethanol. Subsequently, RNase A treatment
(Beyotime Institute of Biotechnology) and propidium iodide staining
were performed. The cells were detected using flow cytometry with a
FACSCalibur (BD Biosciences). The number of cells at the
G0/G1, S and G2/M phases were
quantified using Modfit software (BD Biosciences), excluding the
calculation of cell debris and fixation artifacts. Cell
proliferation was quantified using a Cell Counting Kit-8 (CCK-8;
Beyotime Institute of Biotechnology). Briefly, 100 µl cells
(suspended in stem-cell permissive medium) from the two groups
(CD133−/A2B5+and
CD133−/A2B5+ cells) were seeded onto a
96-well plate at a concentration of 2,000/cells per well and
incubated at 37°C. At daily intervals (1, 2 and 3 days), the
optical density was measured at 450 nm using a microtiter plate
reader (Thermo Multiskan MK3; Thermo Fisher Scientific, Inc.) with
the cell survival rate expressed as the absorbance. The results
represent the average of six replicates under the same
conditions.
Statistical analysis
Statistical analyses were performed using SPSS
software, version 13.0 (SPSS, Inc., Chicago, IL, USA). Statistical
significance was determined using two-tailed Student's t-test and
data are expressed as the mean ± standard error. P<0.05 was
considered to indicate a statistically significant difference.
Results
Isolation and stem cell characteristics
of CD133−/A2B5+ and
CD133−/A2B5− cells of SHG139s
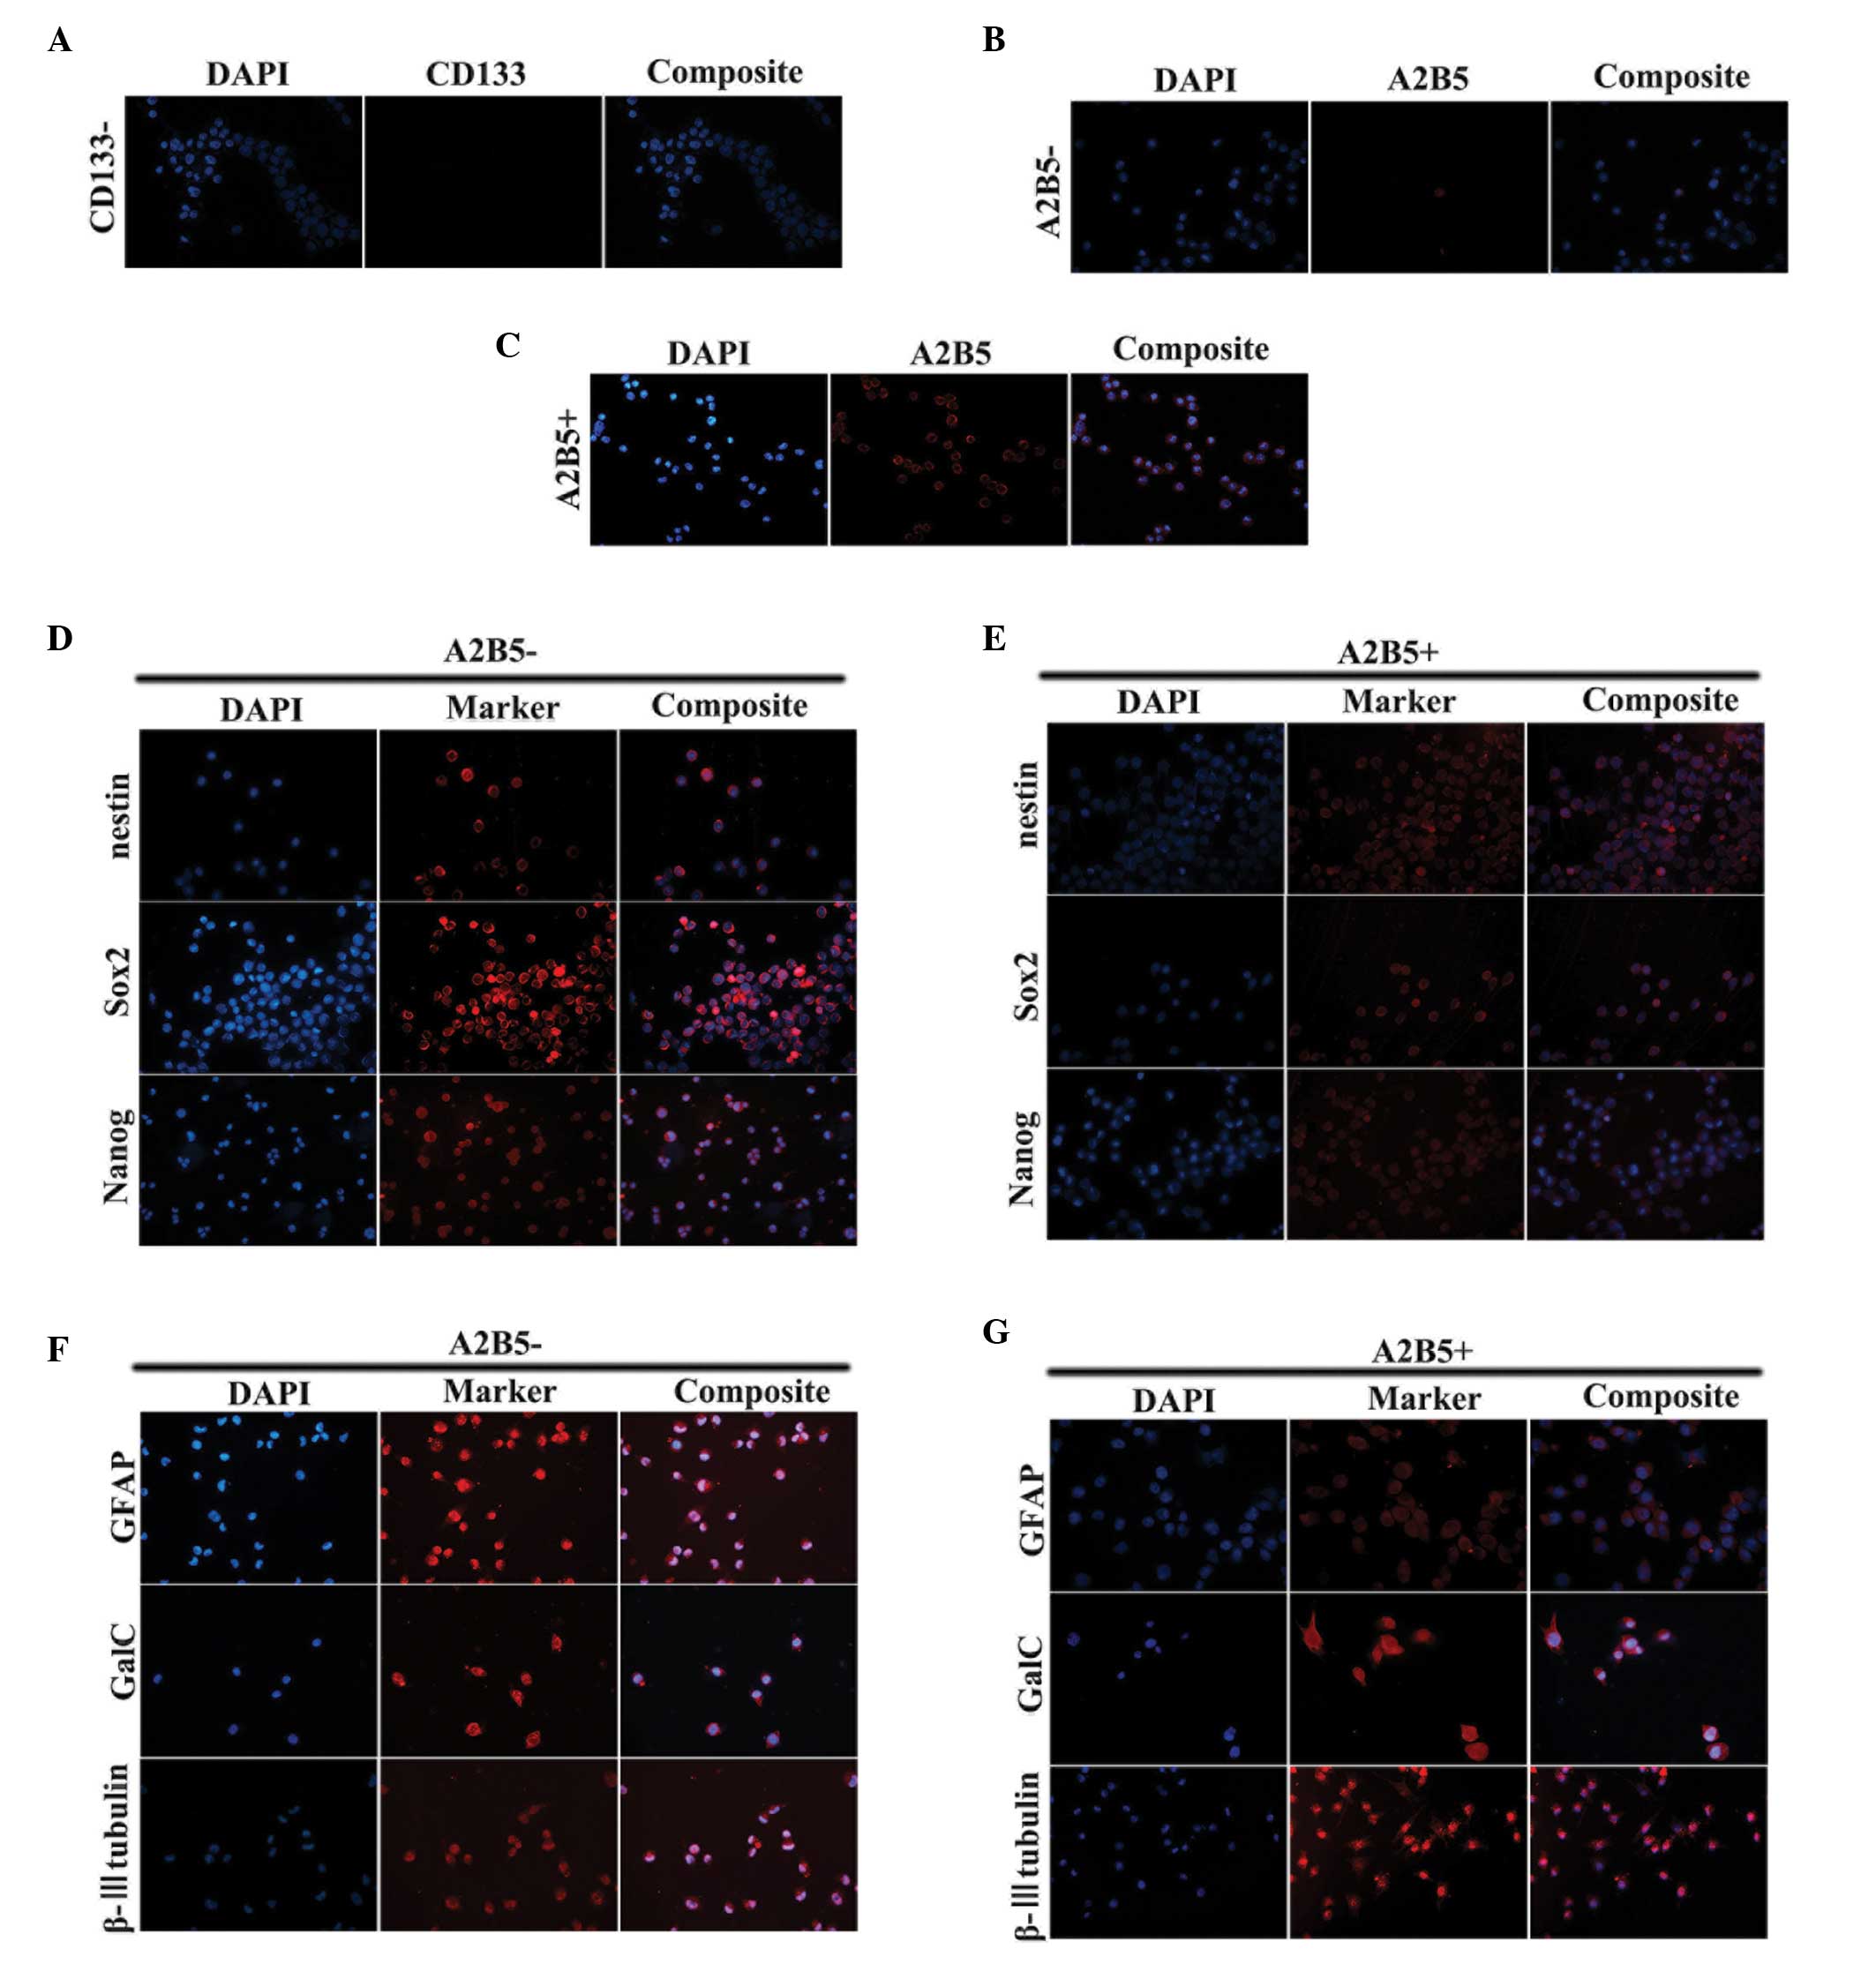
The SHG139s cells were dissociated using 0.25%
trypsin, following which the cells were subjected to MACS. The
results revealed two groups of cells:
CD133−/A2B5+ and
CD133−/A2B5− cells. The purity of the
isolated cells was determined using ICC, and the purity of the two
groups was >90% (Fig.
1A–C).
The ICC staining also demonstrated that the majority
of cells in the two subpopulations expressed Nestin, sex
determining region Y-box 2 (Sox2) and Nanog stem cell markers
(Fig. 1D and E). To assess the
differentiation potential of the cells, the two populations of
cells were cultured in serum-containing medium. The cells presented
with adherent growth. The expression levels of glial fibrillary
acidic protein (GFAP), β-III tubulin and galactosylceramidase
(Galc) were assessed using ICC. The adherent cells in the two
groups exhibited expression of the three differentiation markers
(Fig. 1F and G).
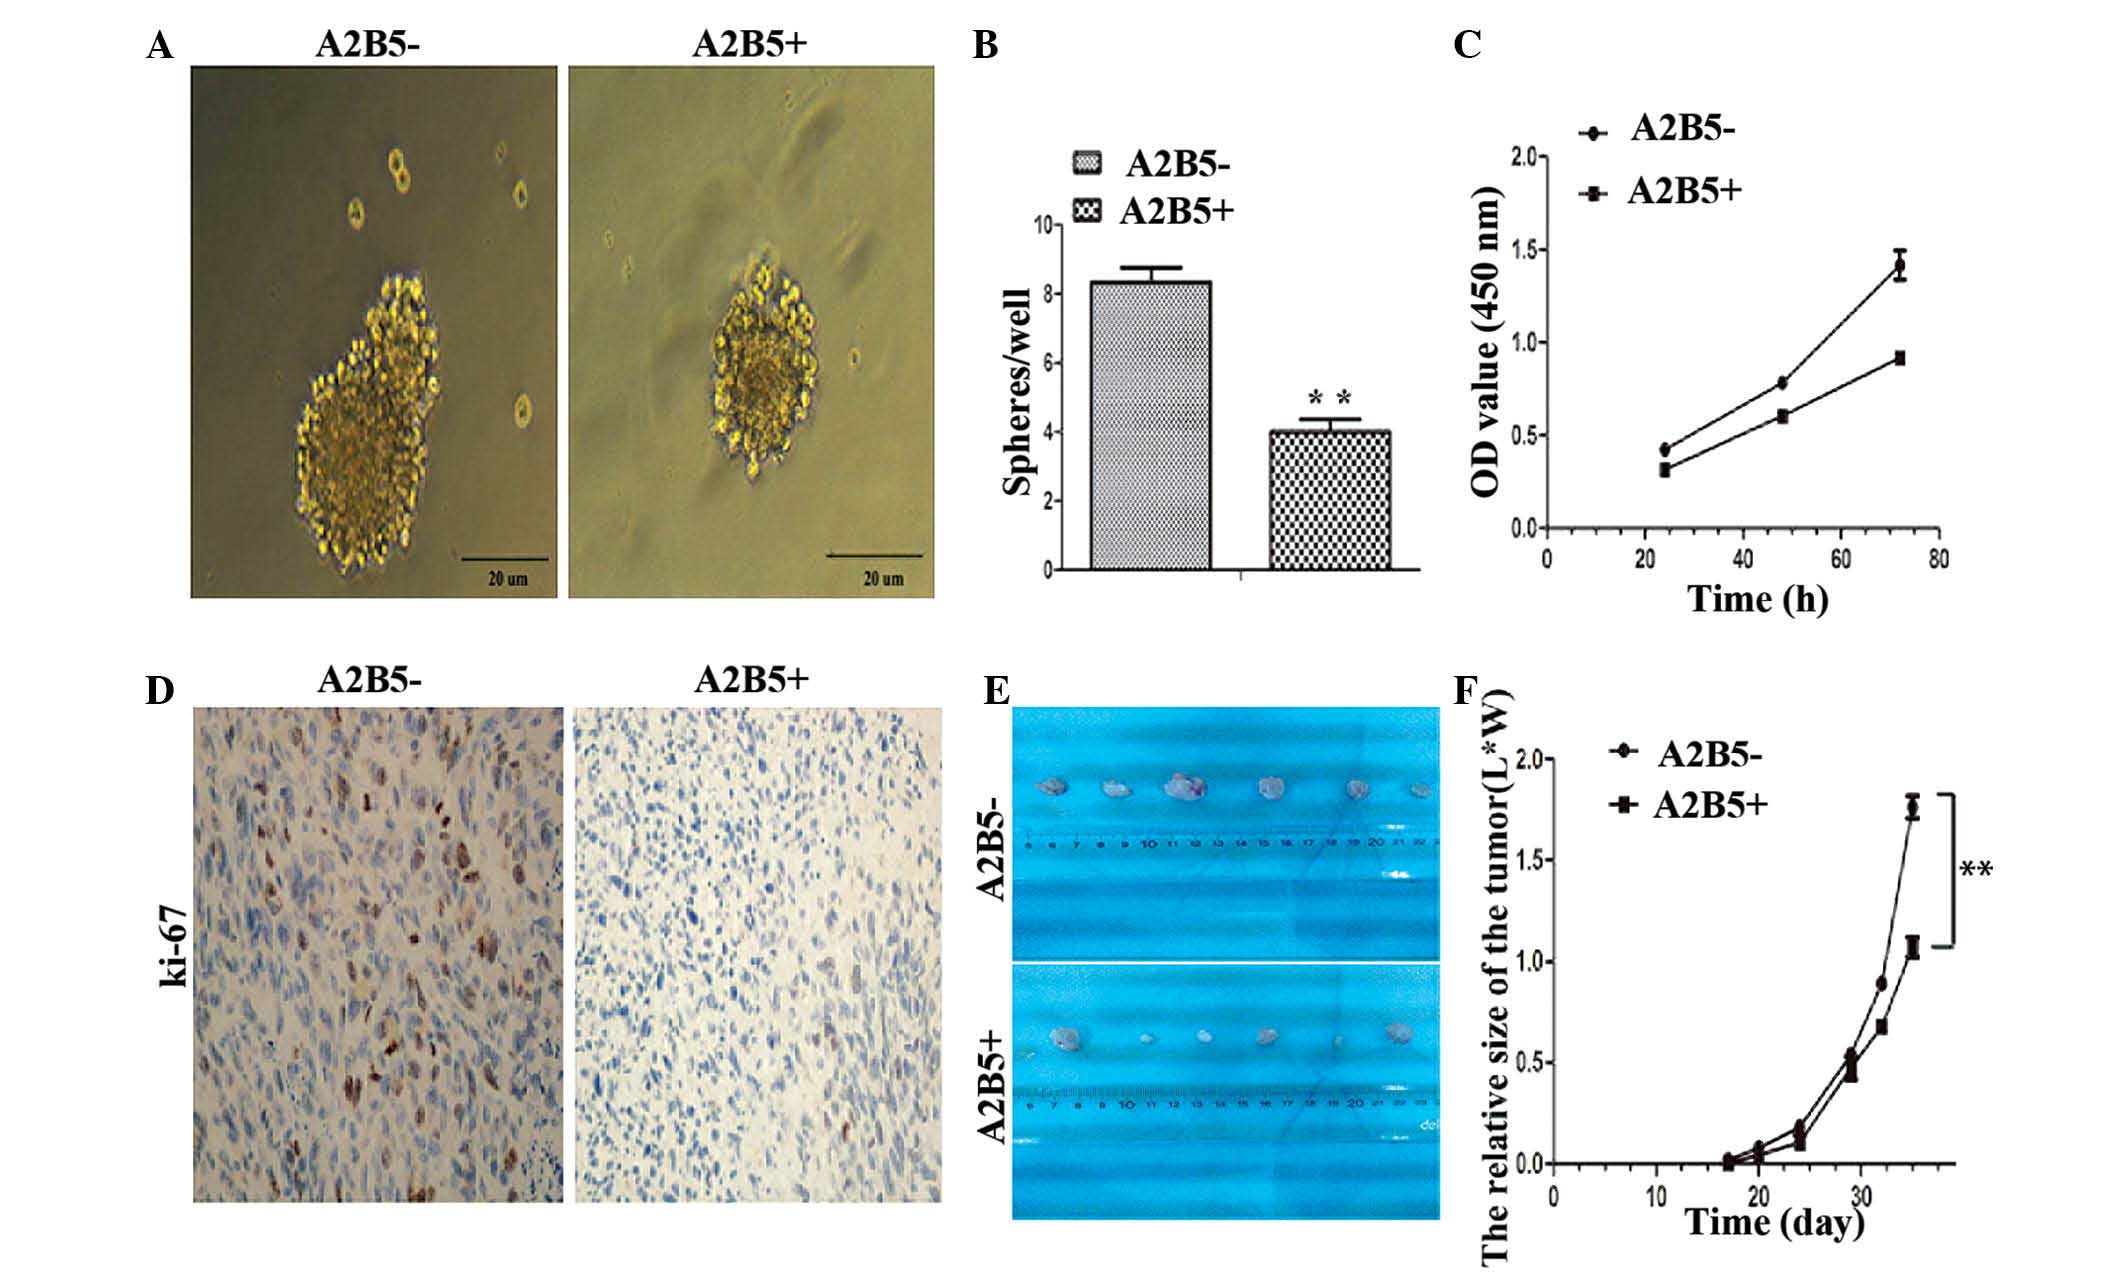
Self-renewal and proliferation ability of
CD133−/A2B5−-derived cells
An in vitro sphere formation assay was used
to examine whether the expression of A2B5 was involved in cell
renewal upon serial passaging. It was found that the high
expression level of A2B5 not only affected the size of the spheres,
but also led to the reduction in the numbers of spheres in
subsequent generations (Fig. 2A and
B). To investigate whether the expression of A2B5 affected the
proliferation of cells in vitro, a CCK-8 assay (Fig. 2C) and flow cytometric analysis of
the cell cycle were performed. The results showed that the
proliferation abilities of the A2B5−-derived cells were
more marked than those of the A2B5+-derived cells.
Furthermore, to probe the effects of high expression levels of A2B5
on cancer cell growth in vivo, a mouse model of human glioma
was used. The A2B5−-derived cells and
A2B5+-derived cells were injected into the left axilla
of nude mice. The results showed that the two A2B5 subtypes had
similar tumorigenicity in nude mice in vivo. However, that
the expression levels of Ki-67 in the tumors formed from the
A2B5−-derived cells were higher, compared with those
formed by the A2B5+-derived cells (Fig. 2D). In addition, the growth of the
tumors from the A2B5+-derived cells was significantly
inhibited, compared with that of the tumors formed by the
A2B5−-derived cells (Fig.
2E and F; P<0.05).
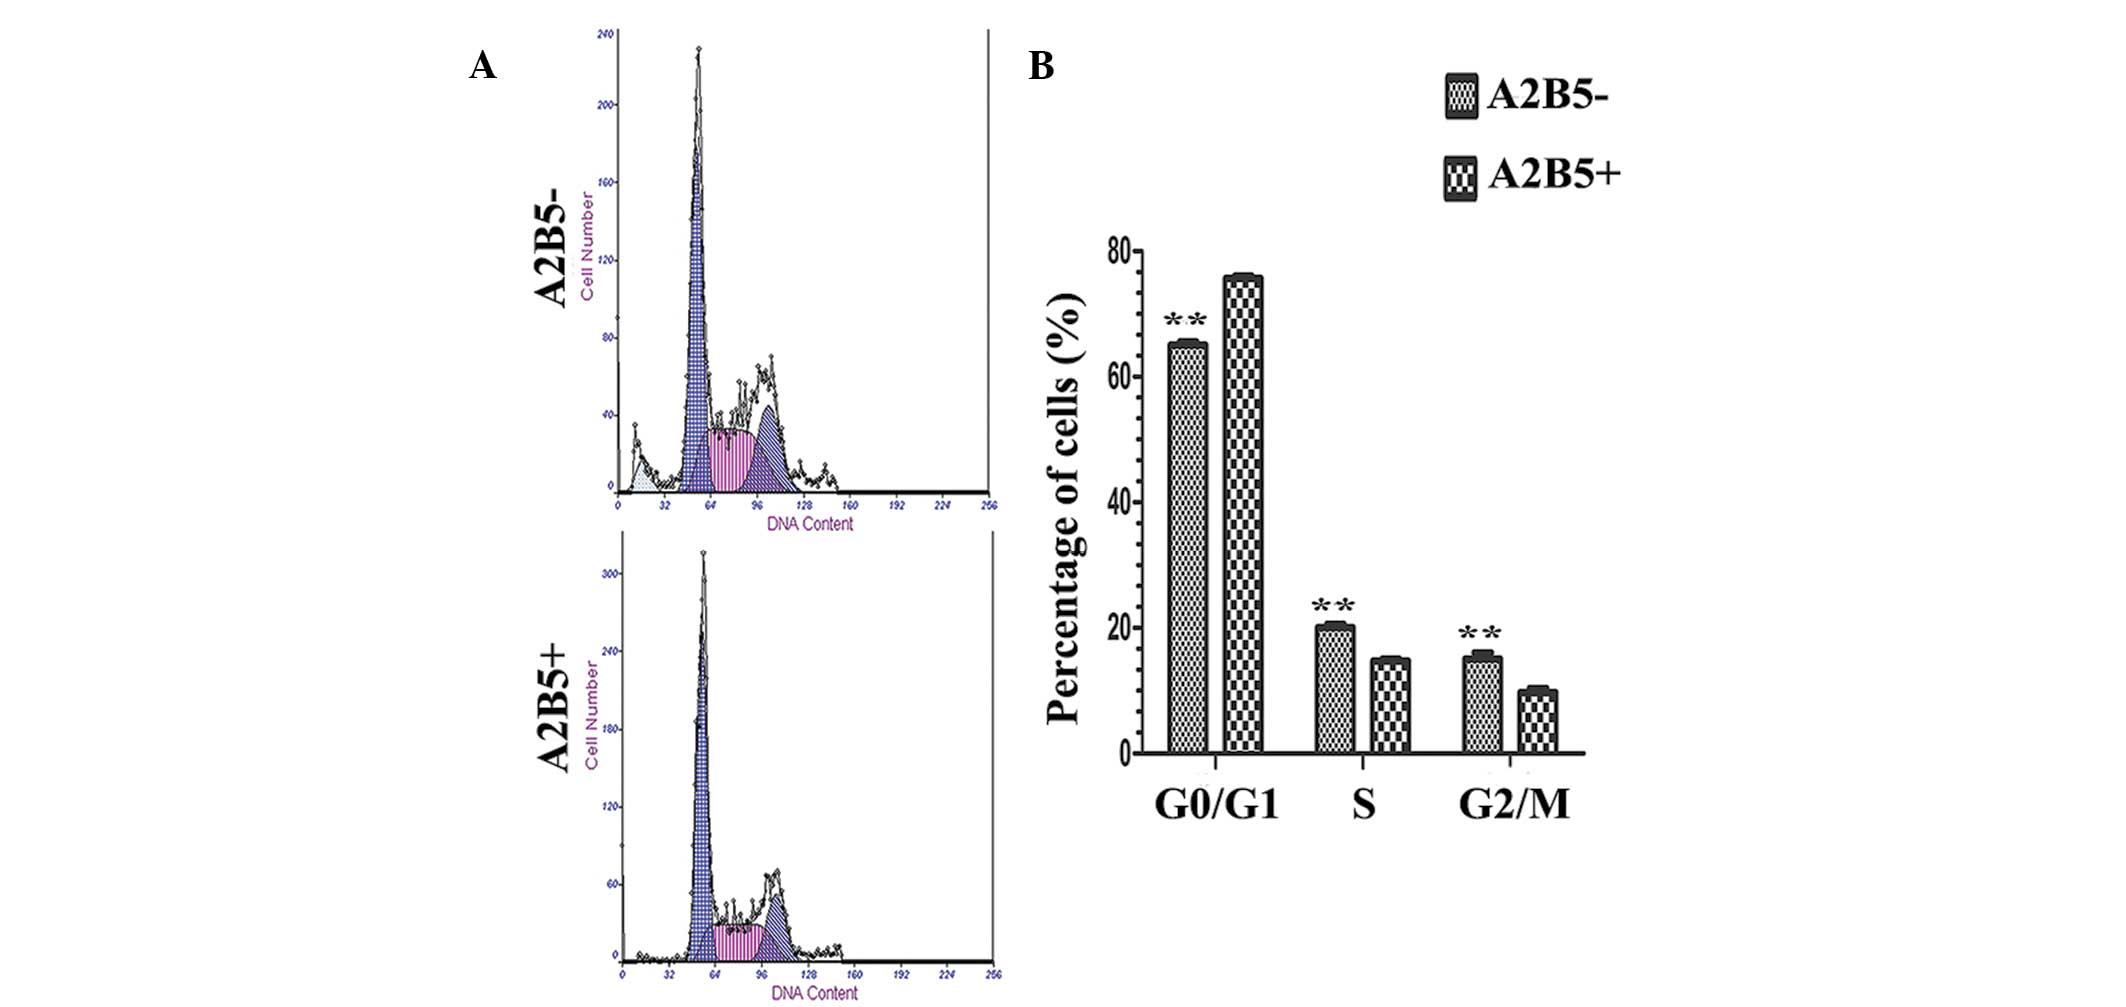
Effect of A2B5 on cell cycle
The results of flow cytometry indicate that A2B5
expression increased the percentage of G0/G1
phase cells, and decreased the percentage of S and G2/M
phase cells (P<0.05; Fig.
3).
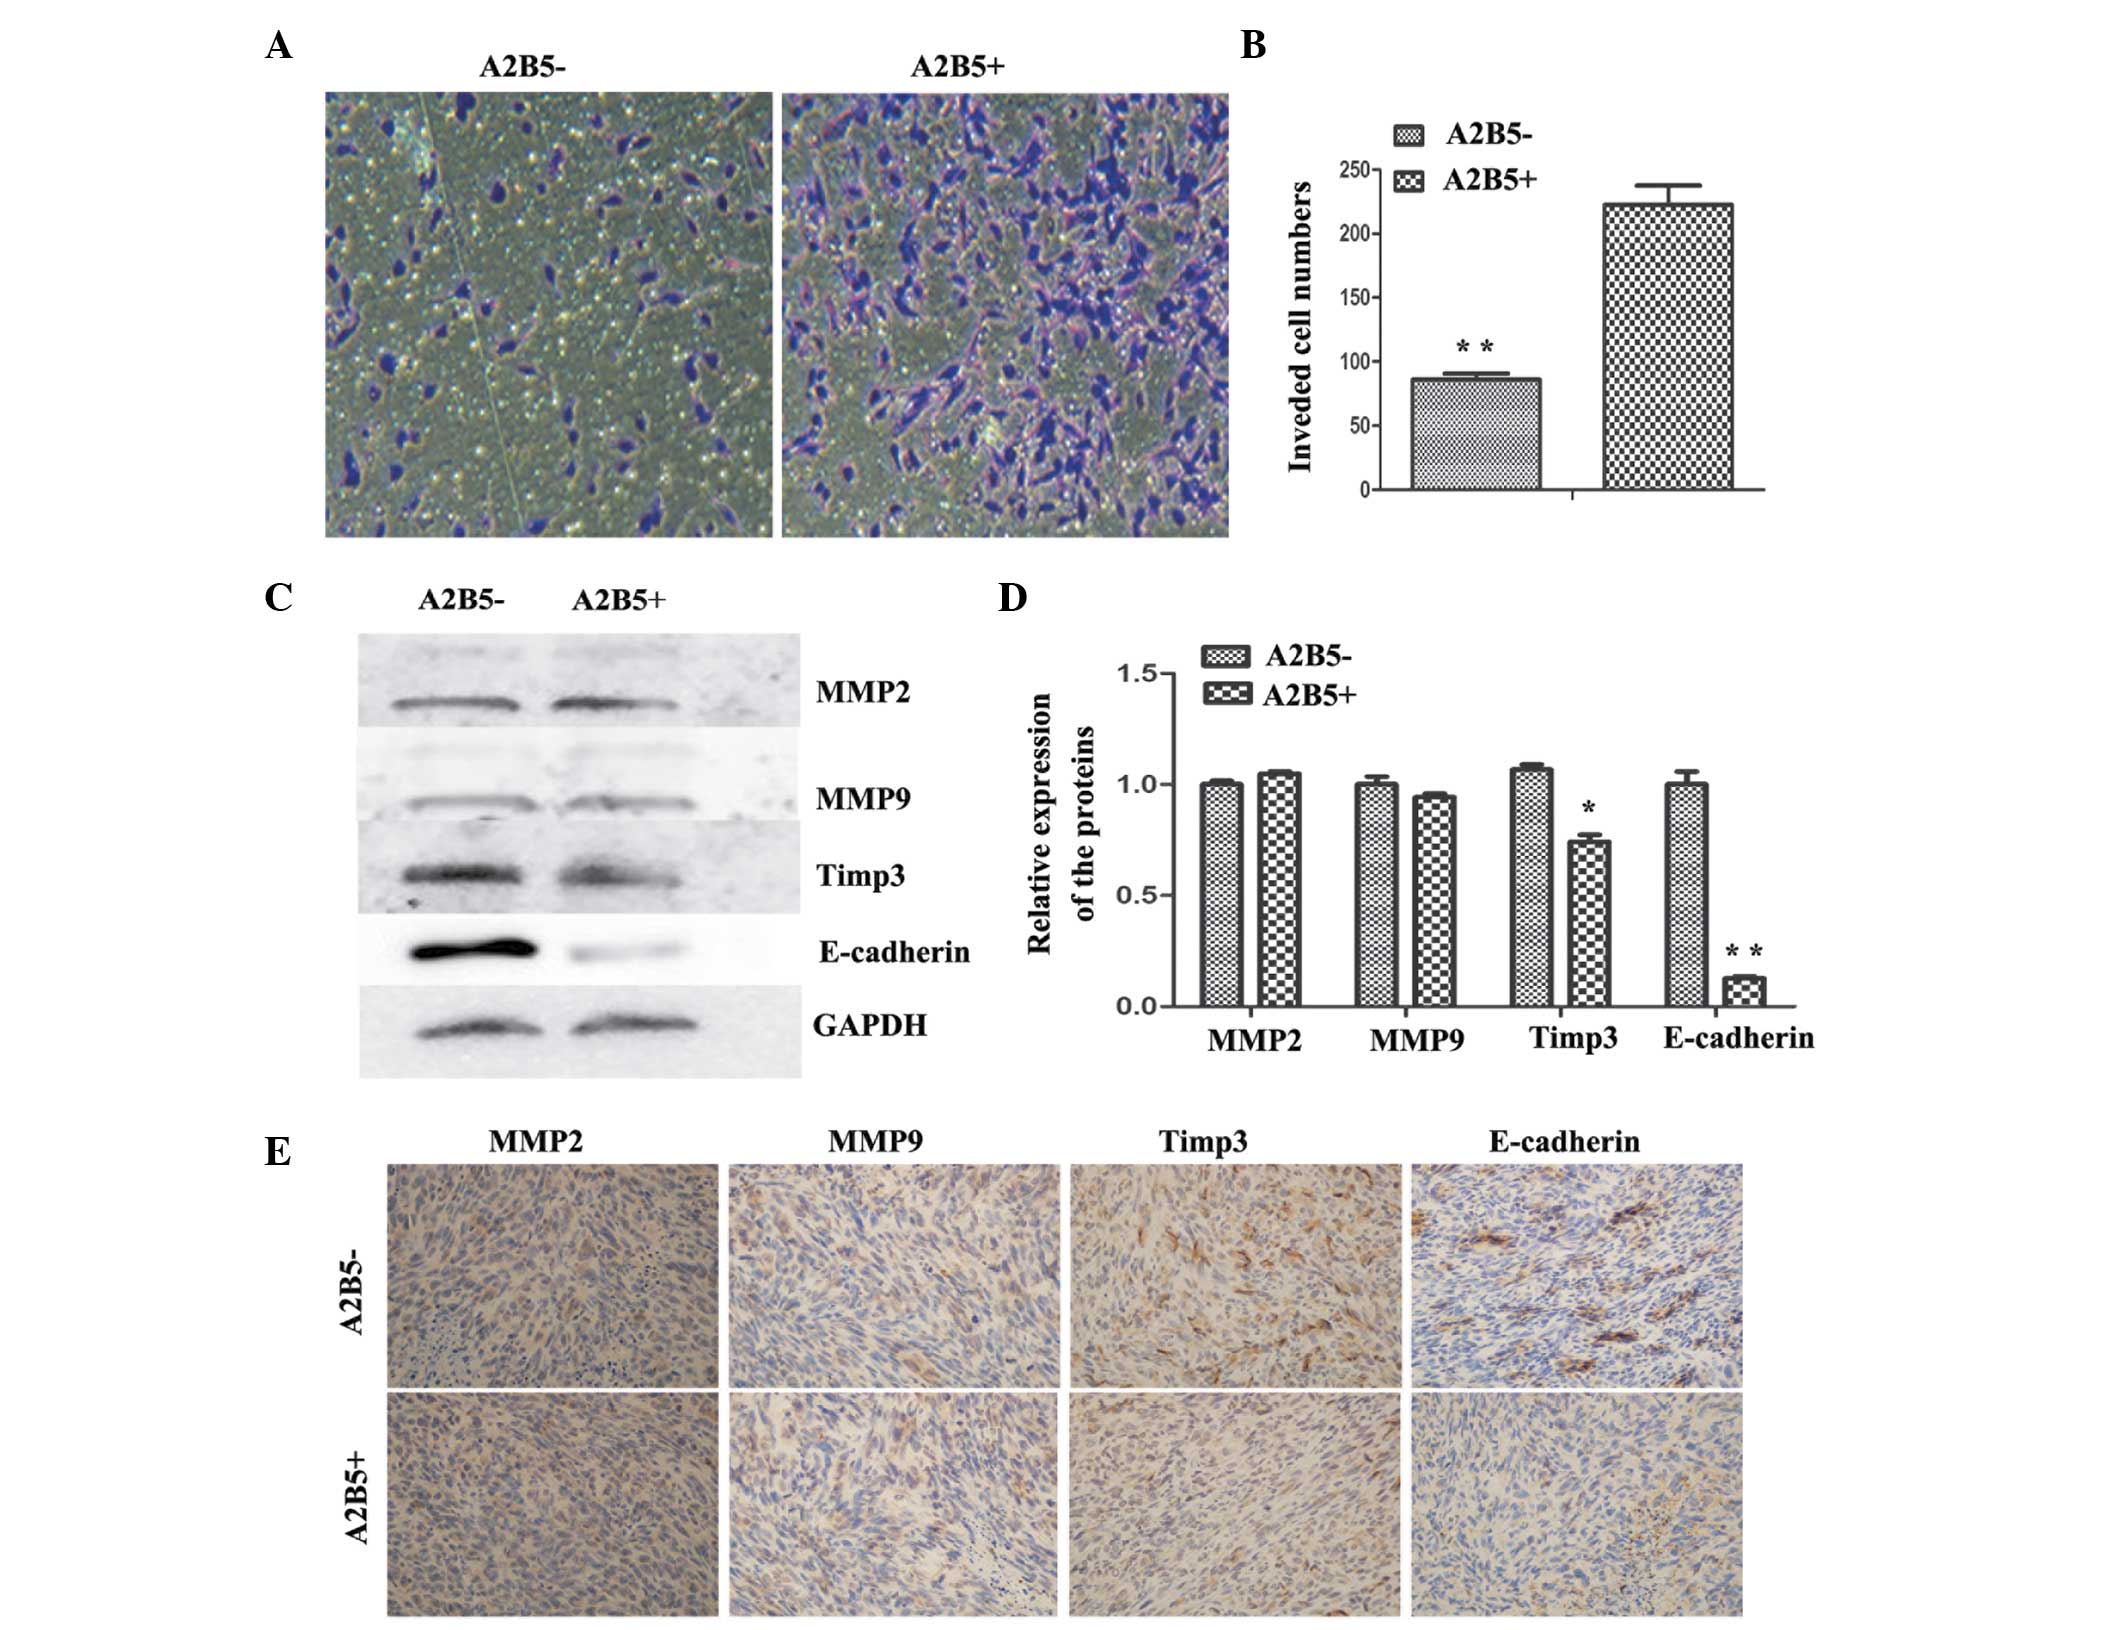
Comparison of the invasion abilities of
the A2B5−- and A2B5+-derived cells
To assess the effects of high expression levels of
A2B5 on the invasiveness of glioma cells, a Transwell invasion
system was used. The number of invasive cells from the
A2B5−-derived cells was significantly reduced, compared
with the A2B5+-derived cells (Fig. 4A and B). To further examine the
molecular associations between the high expression levels of A2B5
and invasiveness in human glioma, the relative expression levels of
MMP9, MMP2, E-cadherin and TIMP3 were analyzed using western blot
analysis. The results revealed no difference in the expression
levels of MMP2 and MMP9, whereas E-cadherin and TIMP3 were
expressed at high levels in the A2B5−-derived cells
(Fig. 4C and D). The subcutaneous
tumors were removed and sectioned, and the sections were stained
with antibodies against MMP2, MMP9, E-cadherin and TIMP3.
Subsequent IHC analysis showed that the tumors formed from
A2B5−-derived cells had higher expression levels of
E-cadherin and TIMP3; however, no difference was observed between
the expression levels of MMP2 and MMP9 (Fig. 4E). Thus, the data indicated that
higher expression levels of A2B5 led to enhancement of glioma cell
invasion in the tumor xenografts.
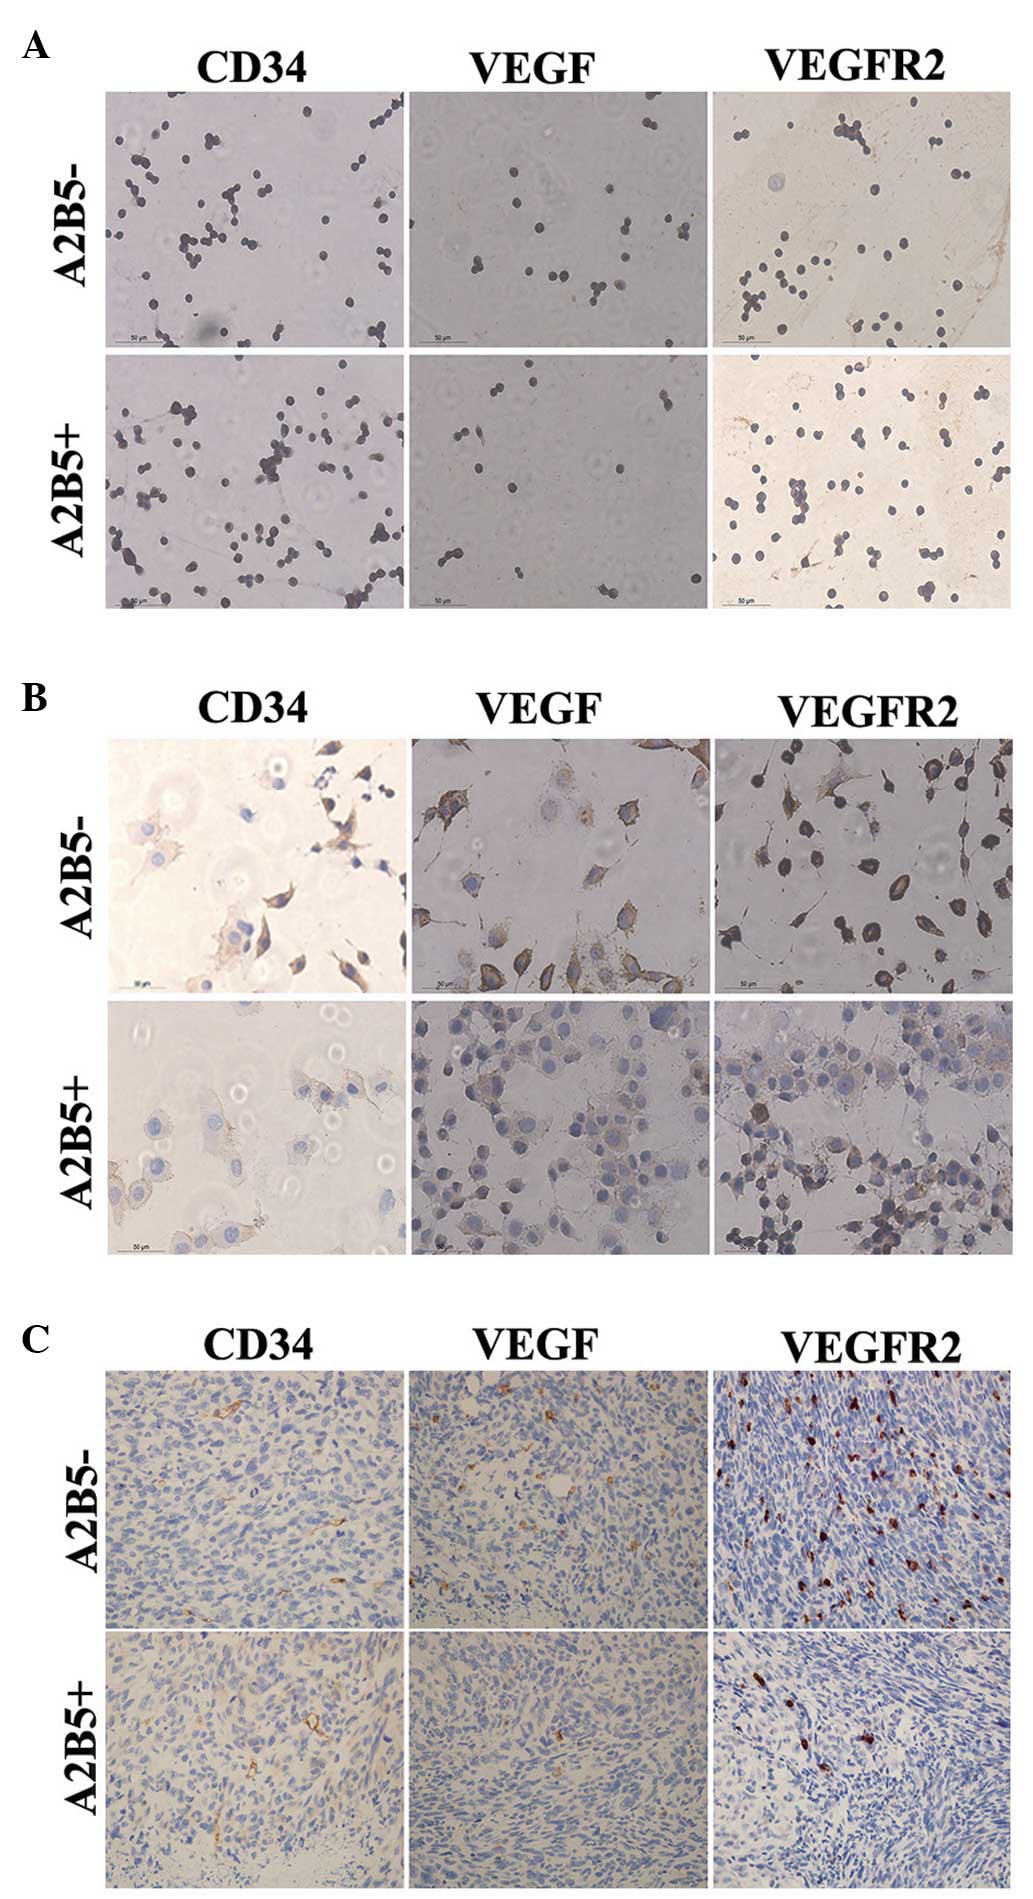
Angiogenesis of the two cell
subpopulations
To assess the angiogenesis of the two groups of
cells, the expression levels of CD34, VEGF and VEGFR2 in the
differentiated cells of each group were assayed using IHC (13–15).
No significant difference was observed between the percentages of
CD34-positive cells between the two groups (Fig. 5A). However, the percentage of
VEGF-positive and VEGFR2-positive cells in the differentiated cells
from the A2B5−-derived cells were higher than those in
the A2B5+-derived cells (Fig. 5B). In addition, these three
indicators were assessed in vivo using IHC. A small number
of CD34+ cells were involved in the formation of tumors
in the two groups. Tumors formed by A2B5−-derived cells
exhibited higher expression levels of VEGF and VEGFR2 (Fig. 5C).
Discussion
CD133 is a 5-transmembrane glycoprotein, expressed
in the membranes of human hematopoietic cells and neural progenitor
cells. Singh et al (10)
demonstrated that 100 CD133+ cells from glioblastoma
multiforme (GBM) were able to form a tumor in mice, which was
similar to the original patient tumor, suggesting that
CD133+ cells from GBM exhibit GSC properties (16). However, Beier et al reported
the existence of CD133− GSCs in a later study (5). The results of the present stud also
confirmed the existence of CD133− GSCs.
A2B5 is a type of multi monosialoganglioside, which
is expressed on the cell surface. It is also a marker of
progenitors of oligodendrocyte-type-2-astrocyte (O-2A).
Tchoghandjian et al (7)
reported that A2B5+ cells isolated from GBM can form
spheres. Previous flow cytometric characterization of
A2B5+-derived spheres revealed three distinct
populations of cells: A2B5+/CD133+,
A2B5+/CD133− and
A2B5−/CD133− cells (7). CD133+/A2B5+ and
CD133−/A2B5+ cells exhibit CSC properties,
and it has been shown that A2B5+ cells are crucial for
the initiation and maintenance of GBM, whereas the expression of
CD133 is more involved in determining tumor behavior (7). Ogden et al (13) reported that the majority of gliomas
can be divided into the three subpopulations described above; and
it has been demonstrated that the tumorigenic potential of the
CD133+/A2B5+ and
CD133−/A2B5+ cells are more marked, compared
with that of the CD133−/A2B5− cells.
Similarly, in the present study, three distinct populations of
cells from SHG139 lines were isolated using MACS. The cell purity
of the isolated cells populations was determined using ICC and flow
cytometry, which revealed all three cells subpopulations had
>90% purity. In a previous study, it was found that
CD133−/A2B5+ and
CD133−/A2B5− cells can form tumors in mice,
and have similar tumorigenic potential. Therefore, the present
study focussed predominantly on comparing the other functions of
CD133−/A2B5+ and
CD133−/A2B5− cells. It was found that the
groups of the cells exhibited characteristics of CSCs, and
confirmed the existence of CD133−/A2B5−GSCs
in the SHG139s cells, whereas a previous study reported that only
A2B5+/CD133+ and
A2B5+/CD133− cells from
A2B5+-derived cells exhibit CSC characteristics
(7,13). This contradictory result may be
caused by the differences between different GSC lines.
Tchoghandjian et al (7)
isolated the GSCs of A2B5+ cells derived from GBM;
however, it was not clear whether there were A2B5− GSCs
in the GBM, which requires ruling out to confirm that the GSC
characteristics are part of the A2B5+ cells. In the
present study, the SHG139s cells were derived from SHG139 glioma
cells by culturing SHG139 in stem cell-permissive medium. In the
previous study, it was demonstrated that SHG44 GSCs (SHG44s) were
CD133high/A2B5low, which indicated that not
all GSCs express A2B5 at high levels (16). Notably the present study confirmed
the existence of A2B5−GSCs.
In the present study, the results of the Tanswell
assay showed that the number of invasive A2B5+ cells was
increased, compared with the A2B5− cells. Subsequently,
indicators, including MMP2, MMP9, E-cadherin and TIMP3, that are
associated with invasion, were examined using western blot and IHC
analyses (17–20). The results showed no difference in
the expression levels of MMP2 and MMP9; however, the expression
levels of E-cadherin and TIMP3 in the A2B5+ -derived
cells were reduced, compared with the A2B5−-derived
cells. This indicated that the A2B5+-derived cells
promoted invasion by reducing the expression levels of E-cadherin
and TIMP3. The assays comparing the ability of self-renewal and
proliferation showed that the self-renewal and proliferation
abilities of the A2B5−-derived cells were more marked,
compared with the A2B5+-derived cells. Usually, if a
gene promotes invasion, it will also promote proliferation
(7,21,22).
However, the results of the present study are contradictory to
this, which may be due to the inherent properties of GSCs.
Accordingly, different subpopulations may exist in the GSCs, with
certain cell subpopulations responsible for proliferation and other
subpopulations responsible for invasion.
In the present study, the expression levels of CD34,
VEGF and VEGFR2 in the GSCs and their differentiated cells were
examined using IHC analysis. The results showed that VEGF and
VEGFR2 were expressed at high levels in the GSCs, indicating that
high expression levels of VEGF and VEGFR2 are characteristic of
GSCs. However, the expression levels of VEGF and VEGFR2 in the
cells differentiated from A2B5− cells were higher than
those in the cells differentiated from A2B5+ cells. The
IHC analysis of in vivo tumor tissues also revealed the same
results, indicating that A2B5−-derived cells had
increased angiogenic ability. In a previous study, specific
anti-human CD34 IHC analysis of tumor samples revealed that a small
number of CD34+ cells were involved in tumor formation
and may also be involved in the formation of vascular mimicry
(23).
In conclusion, the results of the present study
revealed the effects of the expression of A2B5 on the phenomenon of
GSCs. Future investigations are likely to further elucidate the
regulatory mechanisms of A2B5 on GSCs, and may provide a novel
therapeutic approach to eliminate GSCs.
Acknowledgments
The authors would like to thank the Animal Research
Institute of Nanjing University for providing the nude mice. This
study was supported by the National Natural Science Foundation of
China (grant. no. 81372689), the Major Issues Foundation of the
Health Department of Jiangsu Province (grant. no. K201106) and the
Six Big Talent Peak Project in Jiangsu province. (grant. no.
2012-WS-050).
References
|
1
|
Galli R, Binda E, Orfanelli U, Cipelletti
B, Gritti A, De Vitis S, Fiocco R, Foroni C, Dimeco F and Vescovi
A: Isolation and characterization of tumorigenic, stem-like neural
precursors from human glioblastoma. Cancer Res. 64:7011–7021. 2004.
View Article : Google Scholar : PubMed/NCBI
|
|
2
|
Hemmati HD, Nakano I, Lazareff JA,
Masterman-Smith M, Geschwind DH, Bronner-Fraser M and Kornblum HI:
Cancerous stem cells can arise from pediatric brain tumors. Proc
Natl Acad Sci USA. 100:15178–15183. 2003. View Article : Google Scholar : PubMed/NCBI
|
|
3
|
Ignatova TN, Kukekov VG, Laywell ED,
Suslov ON, Vrionis FD and Steindler DA: Human cortical glial tumors
contain neural stem-like cells expressing astroglial and neuronal
markers in vitro. Glia. 39:193–206. 2002. View Article : Google Scholar : PubMed/NCBI
|
|
4
|
Singh SK, Clarke ID, Terasaki M, Bonn VE,
Hawkins C, Squire J and Dirks PB: Identification of a cancer stem
cell in human brain tumors. Cancer Res. 63:5821–5828.
2003.PubMed/NCBI
|
|
5
|
Beier D, Hau P, Proescholdt M, Lohmeier A,
Wischhusen J, Oefner PJ, Aigner L, Brawanski A, Bogdahn U and Beier
CP: CD133(+) and CD133 (−) glioblastoma-derived cancer stem cells
show differential growth characteristics and molecular profiles.
Cancer Res. 67:4010–4015. 2007. View Article : Google Scholar : PubMed/NCBI
|
|
6
|
Zhou C and Sun B: The prognostic role of
the cancer stem cell marker aldehyde dehydrogenase 1 in head and
neck squamous cell carcinomas: A meta-analysis. Oral Oncol.
50:1144–1148. 2014. View Article : Google Scholar : PubMed/NCBI
|
|
7
|
Tchoghandjian A, Baeza N, Colin C, Cayre
M, Metellus P, Beclin C, Ouafik L and Figarella-Branger D: A2B5
cells from human glioblastoma have cancer stem cell properties.
Brain Pathol. 20:211–221. 2010. View Article : Google Scholar
|
|
8
|
Son MJ, Woolard K, Nam DH, Lee J and Fine
HA: SSEA-1 is an enrichment marker for tumor-initiating cells in
human glioblastoma. Cell Stem Cell. 4:440–452. 2009. View Article : Google Scholar : PubMed/NCBI
|
|
9
|
Lathia JD, Gallagher J, Heddleston JM,
Wang J, Eyler CE, Macswords J, Wu Q, Vasanji A, McLendon RE,
Hjelmeland AB and Rich JN: Integrin alpha 6 regulates glioblastoma
stem cells. Cell Stem Cell. 6:421–432. 2010. View Article : Google Scholar : PubMed/NCBI
|
|
10
|
Singh SK, Hawkins C, Clarke ID, Squire JA,
Bayani J, Hide T, Henkelman RM, Cusimano MD and Dirks PB:
Identification of human brain tumour initiating cells. Nature.
432:396–401. 2004. View Article : Google Scholar : PubMed/NCBI
|
|
11
|
Wang J, Sakariassen PØ, Tsinkalovsky O,
Immervoll H, Bøe SO, Svendsen A, Prestegarden L, Røsland G, Thorsen
F and Stuhr L: CD133 negative glioma cells form tumors in nude rats
and give rise to CD133 positive cells. Int J Cancer. 122:761–768.
2008. View Article : Google Scholar
|
|
12
|
Chen GL, Li YY, Xie XS, Chen JM, Wu TF and
Li XT: The establishment of a new human glioma cell line and its
biological characteristic analysis. Chin J Oncol. 39:1–7. 2014.
|
|
13
|
Ogden AT, Waziri AE, Lochhead RA, Fusco D,
Lopez K, Ellis JA, Kang J, Assanah M, McKhann GM, Sisti MB, et al:
Identification of A2B5+CD133- tumor-initiating cells in adult human
gliomas. Neurosurgery. 62:505–514; discussion 514–515. 2008.
View Article : Google Scholar : PubMed/NCBI
|
|
14
|
Kumagai Y, Sobajima J, Higashi M, Ishiguro
T, Fukuchi M, Ishibashi K, Baba H, Mochiki E, Yakabi K, Kawano T,
et al: Angiogenesis in superficial esophageal squamous cell
carcinoma: Assessment of microvessel density based on
immunostaining for CD34 and CD105. Jpn J Clin Oncol. 44:526–533.
2014. View Article : Google Scholar : PubMed/NCBI
|
|
15
|
Takahashi H, Inoue A, Kawabe Y, Hosokawa
Y, Iwata S, Sugimoto K, Yano H, Yamashita D, Harada H, Kohno S, et
al: Oct-3/4 promotes tumor angiogenesis through VEGF production in
glioblastoma. Brain Tumor Pathol. 32:31–40. 2015. View Article : Google Scholar
|
|
16
|
Wu TF, Chen JM, Chen SS, Chen GL, Wei YX,
Xie XS, Du ZW and Zhou YX: Phenotype of SHG-44 glioma stem cell
spheres and pathological characteristics of their xenograft tumors.
Zhonghua Zhong Liu Za Zhi. 35:726–731. 2013.In Chinese.
|
|
17
|
Yang X, Du WW, Li H, Liu F, Khorshidi A,
Rutnam ZJ and Yang BB: Both mature miR-17-5p and passenger strand
miR-17-3p target TIMP3 and induce prostate tumor growth and
invasion. Nucleic Acids Res. 41:9688–9704. 2013. View Article : Google Scholar : PubMed/NCBI
|
|
18
|
Li H, Chen X, Gao Y, Wu J, Zeng F and Song
F: XBP1 induces snail expression to promote epithelial-
to-mesenchymal transition and invasion of breast cancer cells. Cell
Signal. 27:82–89. 2015. View Article : Google Scholar
|
|
19
|
Huang D, Du X, Yuan R, Chen L, Liu T, Wen
C, Huang M, Li M, Hao L and Shao J: Rock2 promotes the invasion and
metastasis of hepatocellular carcinoma by modifying MMP2
ubiquitination and degradation. Biochem Biophys Res Commun.
453:49–56. 2014. View Article : Google Scholar : PubMed/NCBI
|
|
20
|
Jia LF, Wei SB, Mitchelson K, Gao Y, Zheng
YF, Meng Z, Gan YH and Yu GY: miR-34a Inhibits migration and
invasion of tongue squamous cell carcinoma via targeting MMP9 and
MMP14. PloS one. 9:e1084352014. View Article : Google Scholar : PubMed/NCBI
|
|
21
|
Tan J, Yang S, Shen P, Sun H, Xiao J, Wang
Y, Wu B, Ji F, Yan J, Xue H and Zhou D: C-kit signaling promotes
proliferation and invasion of colorectal mucinous adenocarcinoma in
a murine model. Oncotarget. Sep 2–2015.Epub ahead of print.
View Article : Google Scholar
|
|
22
|
Zhuo Z, Yang XF, Huang KQ, Ren L, Zhao S,
Gou WF, Shen DF, Sun HZ, Takano Y and Zheng HC: The upregulated
α-catulin expression was involved in head-neck squamous cell
carcinogenesis by promoting proliferation, migration, invasion, and
epithelial to mesenchymal transition. Tumour Biol. Aug 27–2015.Epub
ahead of print.
|
|
23
|
Liu TJ, Sun BC, Zhao XL, Zhao XM, Sun T,
Gu Q, Yao Z, Dong XY, Zhao N and Liu N: CD133+ cells with cancer
stem cell characteristics associates with vasculogenic mimicry in
triple-negative breast cancer. Oncogene. 32:544–553. 2013.
View Article : Google Scholar
|