Introduction
Ovarian cancer accounts for approximately one
quarter of gynecological malignancies, however, it is the most
life-threatening (1). Epithelial
ovarian cancer (EOC) is the most common type of ovarian cancer,
accounting for 90% of cases (2).
Despite advances in surgery and chemotherapy, the prognosis remains
poor, with a five-year-survival rate of <45% worldwide (3,4). The
extent of disease, which is expressed as the International
Federation of Gynecology and Obstetrics (FIGO) stage, success of
primary surgery and histopathological features of the tumor are
important prognostic markers (5,6).
Based on investigations combining morphological
features and immunohistochemistry, EOC can be broadly subdivided
into high-grade serous carcinoma (HGSC), low-grade serous carcinoma
(LGSC), clear cell carcinoma (CCC), mucinous carcinoma (MC) and
endometrioid carcinoma (EC) (6).
Different subtypes of EOC are associated with variable clinical
manifestations, clinical outcomes, prognoses, sensitivity to
chemotherapy, and associated with different underlying molecular
abnormalities (7).
HGSC is the most common type of ovarian carcinoma,
representing 80–85% of all cases of EOC in the West, and are well
represented among the types of carcinomas, which present at an
advanced FIGO stage (III or IV) (8). CCC comprises ~5% of all ovarian
tumors in North America, whereas they account for a larger
proportion of ovarian tumors in Japan and China (8). They are most often at an early stage
at presentation, and account for >25% of all FIGO stage I and II
EOCs (6,9). Their distinct morphological features
also correspond to unique underlying molecular abnormalities and
genetic profiles (10).
Investigating the molecular and genetic profiles of different types
of EOC may assist in improving current understanding of the
carcinogenesis of EOC and these may potentially be exploited by
future targeted therapies.
MicroRNAs (miRNAs) are 19–25 nucleotide-long,
noncoding RNAs, which regulate gene expression by repressing mRNA
translation and/or directing mRNA cleavage. It has been reported
that miRNAs are aberrantly expressed or mutated in cancer,
suggesting that they may be involved in the initiation and
progression of cancer (11).
miRNAs are important as a novel class of oncogenes or tumor
suppressor genes, depending on the targets they regulate (12). A number of studies have reported
that miRNA expression signatures are associated with specific tumor
subtypes, clinical outcomes, stages and responses to therapy
(11,13). Various miRNA gene expression
analytical approaches, including microarrays and reverse
transcription-quantitative polymerase chain reaction (RT-qPCR),
have identified aberrantly expressed miRNAs in EOC, of which a
number are associated with progression, classification, FIGO stage,
prognosis, chemotherapy resistance (14–16).
However, there are few studies concerning the difference in miRNA
expression profile between HGSC and CCC.
The aim of the present study was to identify miRNAs
that were differentially expressed between subtypes of EOC,
predominantly HGSC and CCC. The results identified several
important miRNAs that were differentially expressed between HGSC
and CCC, including miR-510. The possible clinical significance and
prognostic value of these dysregulated miRNAs were subsequently
investigated. The potential significance of miR-510 in EOC was
further examined in another cohort of normal ovarian tissue
samples, HGSC, LGSC and CCC specimens, using RT-qPCR and in
situ hybridization (ISH). Identification of these miRNAs and
further examination of their function role could lead to the
identification of novel targets and/or biomarkers that could
benefit patients with ovarian cancer.
Patients and methods
Patient samples
Patients who were diagnosed with EOC between 2004
and 2011 at the Obstetrics and Gynecology Hospital of Dalian
(Liaoning, China), according to a pathological report, were
recruited for the present study, which was approved by the
Institutional Review Board of the Ministry of Science and
Technology of China, the Human Resource Management Office (Beijing,
China) and the ethics committee of the Dalian Medical University
(Dalian, China). All participants signed a consent form prior to
the surgical procedure and the investigations. Pathological
specimens (10×10×3 mm3), which were collected from
primary surgery were routinely fixed in formalin (Kangnaixin
Biology Co., Zhongshan, China) and embedded in paraffin (Hongming
Chemical Reagent Co., Jining, China). Each slide was re-evaluated
by an expert pathologist in a blinded-manner, prior to the
experiments being performed. The cases were classified according to
the FIGO staging system (17).
Only specimens containing >70% tumor tissue were used for
subsequent experiments. Clinicopathological data were also
collected, including subtypes, age, FIGO stage and status of
lymphatic metastasis. The histological classification and clinical
staging were performed according to the World Health Organization
classification (5) and FIGO
staging (17), respectively.
The tumor samples comprised primary ovarian cancer
obtained from surgery prior to chemotherapy. The
clinicopathological features are presented in Table I. For miRNA microarray analysis,
formalin-fixed, paraffin-embedded (FFPE) samples of EOC, comprising
20 cases of HGSC and 16 cases of CCC were collected. For
validation, a separate cohort of patients, with complete prognosis
data were selected, The FFPE specimens of HGSC (n=22) and CCC
(n=20) were used in RT-qPCR. RT-qPCR was also used for the samples
included in the microarray. For the investigation of miR-510 in
normal ovarian epithelium and EOC, 10 samples of normal ovarian
epithelium and 10 samples of LGSC tissue were included.
 | Table IClinicopathological information for
patients selected for microarray and RT-qPCR analyses. |
Table I
Clinicopathological information for
patients selected for microarray and RT-qPCR analyses.
| Parameter | OSC
| CCC |
|---|
| HGSC | LGSC |
|---|
| Microarray | 20 | | 16 |
| Age (mean ±
SEM) | 53.6±7.1 | | 47.3±8.3 |
| FIGO stage | | | |
| I | | 16 | |
| II | 1 | | |
| III | 17 | | |
| IV | 2 | | |
| Validation cohort
(RT-qPCR) | 42 | 10 | 36 |
| Age (mean ±
SEM) | 52.8±10.4 | 45.9±8.1 | 46.4±9.1 |
| FIGO stage | | | |
| I | 2 | 8 | 31 |
| II | 3 | 2 | 1 |
| III | 35 | | 4 |
| IV | 2 | | |
| Chemosensitivity
(only available for HGSC) | | | |
| CR | 26 | | |
| IR | 16 | | |
| Status of follow
up | | | |
| Alive | 18 | 10 | 31 |
| Succumbed to
mortality | 24 | 0 | 5 |
RNA extraction
Total RNA was extracted from the FFPE tissue samples
from the patients with ovarian serous carcinoma (OSC) and CCC using
an Ambion mirVana microRNA isolation kit (Ambion Life Technologies,
Austin, TX, USA), according to the manufacturer's instructions.
Briefly, FFPE tissue sections of 100-µm thickness were
deparaffinized with xylene (Liaoning Quan Rui Reagent Co. Ltd.,
Liaoning, China) at 50°C, the specimens were washed in ethanol and
digested with 10% proteinase K (Amresco Inc., Solon, OH, USA) at
55°C for 1–3 h, depending on the tissue properties. RNA was
extracted with acid phenol:chloroform (Ambion Life Technologies),
followed by ethanol precipitation and DNAse (Takara Biotechnology
Co., Ltd., Dalian, China) digestion. The quantity and quality of
the total RNA was verified using a NanoVue spectrophotometer (GE
Healthcare Life Sciences, Amersham, UK) and a Bioanalyzer 2100
(Agilent Technologies, Inc., Santa Clara, CA, USA), according to
the manufacturer's instructions. All samples exhibited adequate RNA
quantity and quality.
miRNA microarray and data analysis
The miRNA microarray was performed at the Shannon
McCormack Advanced Molecular Diagnostics Laboratory Research
Services, Dana Farber Cancer Institute, Harvard Clinic and
Translational Science Center (Boston, MA, USA). A microarray
platform, optimized for the analysis of a panel of 768 human miRNAs
(TaqMan® Array Human MicroRNA Card Set v2.0; Thermo
Fisher Scientific Inc., Waltham, MA, USA) was used to analyze and
compare the patterns of miRNA expression in the 20 cases of HGSC
and 16 cases of CCC. Individual RT-qPCR assays were formatted into
a TaqMan low-density array (Applied Biosystems Life Technologies,
Foster City, CA, USA). The normalized microarray data were managed
and analyzed using Statminer version 3.0 (Integromics™, Granada,
Spain).
RT-qPCR
The miRNA expression levels were determined using
RT-qPCR with commercial primers of the GenePharma miRNA-specific RT
primer and miRNA-specific PCR primer set (forward and reverse;
Shanghai GenePharma Co., Ltd., Shanghai, China). The following
primers were used: miR-483-5p sense, CAGATCAATAAGACGGGAGGAA, and
antisense, TATGCTTGTTCTCGTCTCTGTGTC; miR-510 sense,
CTTCCATACTCAGGAGAGTGGC and antisense, TATCGTTGTACTCCAGACCAAGAC;
miR-129-3p sense, CGCGAATCTTTTTGCGGTCT, and antisense,
CCGCAAATGCTTTTTGGGGT; miR-449a sense, GTGTGATGAGCTGGCAGTGTA, and
antisense, AGCAGTTGCATGTTAGCCGAT. Briefly, specific miRNAs were
generated from 220–300 ng of total RNA in a single-step reaction
using an RT kit (cat. no. DRR037A; Takara Biotechnology Co.),
according to the manufacturer's instructions. PCR amplification was
performed using the specific commercial primers (Shanghai
GenePharma Co., Ltd.) with 1 µl of the RT production/well.
The reactions were performed in a 96-well optical plate at 95°C for
3 min, followed by 40 cycles of 95°C for 12 sec and 62°C for 40
sec, using U6 as a housekeeping gene. The experiments were run in
triplicate for each case, to allow for technical variability. qPCR
was performed on a Stratagern Mx3000P (Agilent Technologies, Inc.).
The data were analyzed using Mx3000P software. The relative
microRNA expression levels were calculated using the
2−ΔΔCq method (18).
ISH of miR-510
ISH was performed on the FFPE sections, according to
previously described methods (19). A commercially available probe for
the miR-510 (Exiqon, Inc., Woburn, MA, USA) was used, and
procedures were performed according to standard protocols. Briefly,
3–5 µm sections of tissues were deparaffinized and
dehydrated, followed by incubation in 20% sodium bisulphate/2X
standard saline citrate (SSC; Thermo Fisher Scientific, Inc.) at
75°C for 20 min. Following washing in 2X SSC, the slides were
treated with proteinase K (30 µg/ml, Amresco Inc.; cat. no.
1227B016) for 5 min, followed by three washes in phosphate-buffered
saline. The sections were incubated with pre-hybridization buffer
[10 ml formamide (Amresco Inc.), 5 ml 20X SSC, 2 ml 50X Denhardt's
solution, 250 µl 20 mg/ml yeast RNA, 1,000 µl 10
mg/ml salmon sperm DNA (Life Technologies, Carlsbad, CA, USA), 0.4
g blocking powder (Roche, Basel, Switzerland) and 1.75 ml
diethylpyrocarbonate-treated water (Amresco Inc.)] at 55°C for 1 h.
Hybridization buffer containing the probes for has-miR-510 was
added to each section and hybridized overnight at 55°C. Following
hybridization and washing with 2X SSC, the sections were incubated
with anti-DIG-Fab-AP (cat. no. 11376621; Roche Diagnostics GmbH,
Mannheim, Germany) for 2 h at room temperature. Following three
washes with NT buffer (Thermo Fisher Scientific, Inc.), the
sections were stained with BCIP (3.5 µl/ml)/NBT (4.5
µl/ml) solution (cat. no. 0885/0329; Amresco, Inc.) in a
humidified dark chamber at room temperature, overnight.
Subsequently, the sections were counterstained with 10% nuclear
fast red (Gaide Chemical reagent Company, Shanghai, China).
Following dehydration in ascending concentrations of ethanol and
xylene, the sections were mounted in mounting medium (Vector
Laboratories, Inc., Burlingame, CA, USA). Positive controls and
no-probe controls were included for each hybridization procedure.
The slides were then observed and the images captured using an
Olympus X71 optic microscope (Olympus Corporation, Tokyo,
Japan).
Statistical analysis
Statistical analyses were performed using the
statistical package SPSS version 19.0 (IBM SPSS, Armonk, NY, USA).
Associations between the expression of miRNA and
clinicopathological variables were assessed using Mann-Whitney or
Kruskal-Wallis analyses. Groups were compared using a Pearson
χ2 test. Kaplan-Meier analysis was used to analyze
survival rates, and a log-rank test was used to compare survival
curves. Multivariate analysis was performed using Cox proportional
hazards regression analysis. All statistical tests were two-sided.
P<0.05 was considered to indicate a statistically significant
difference.
Results
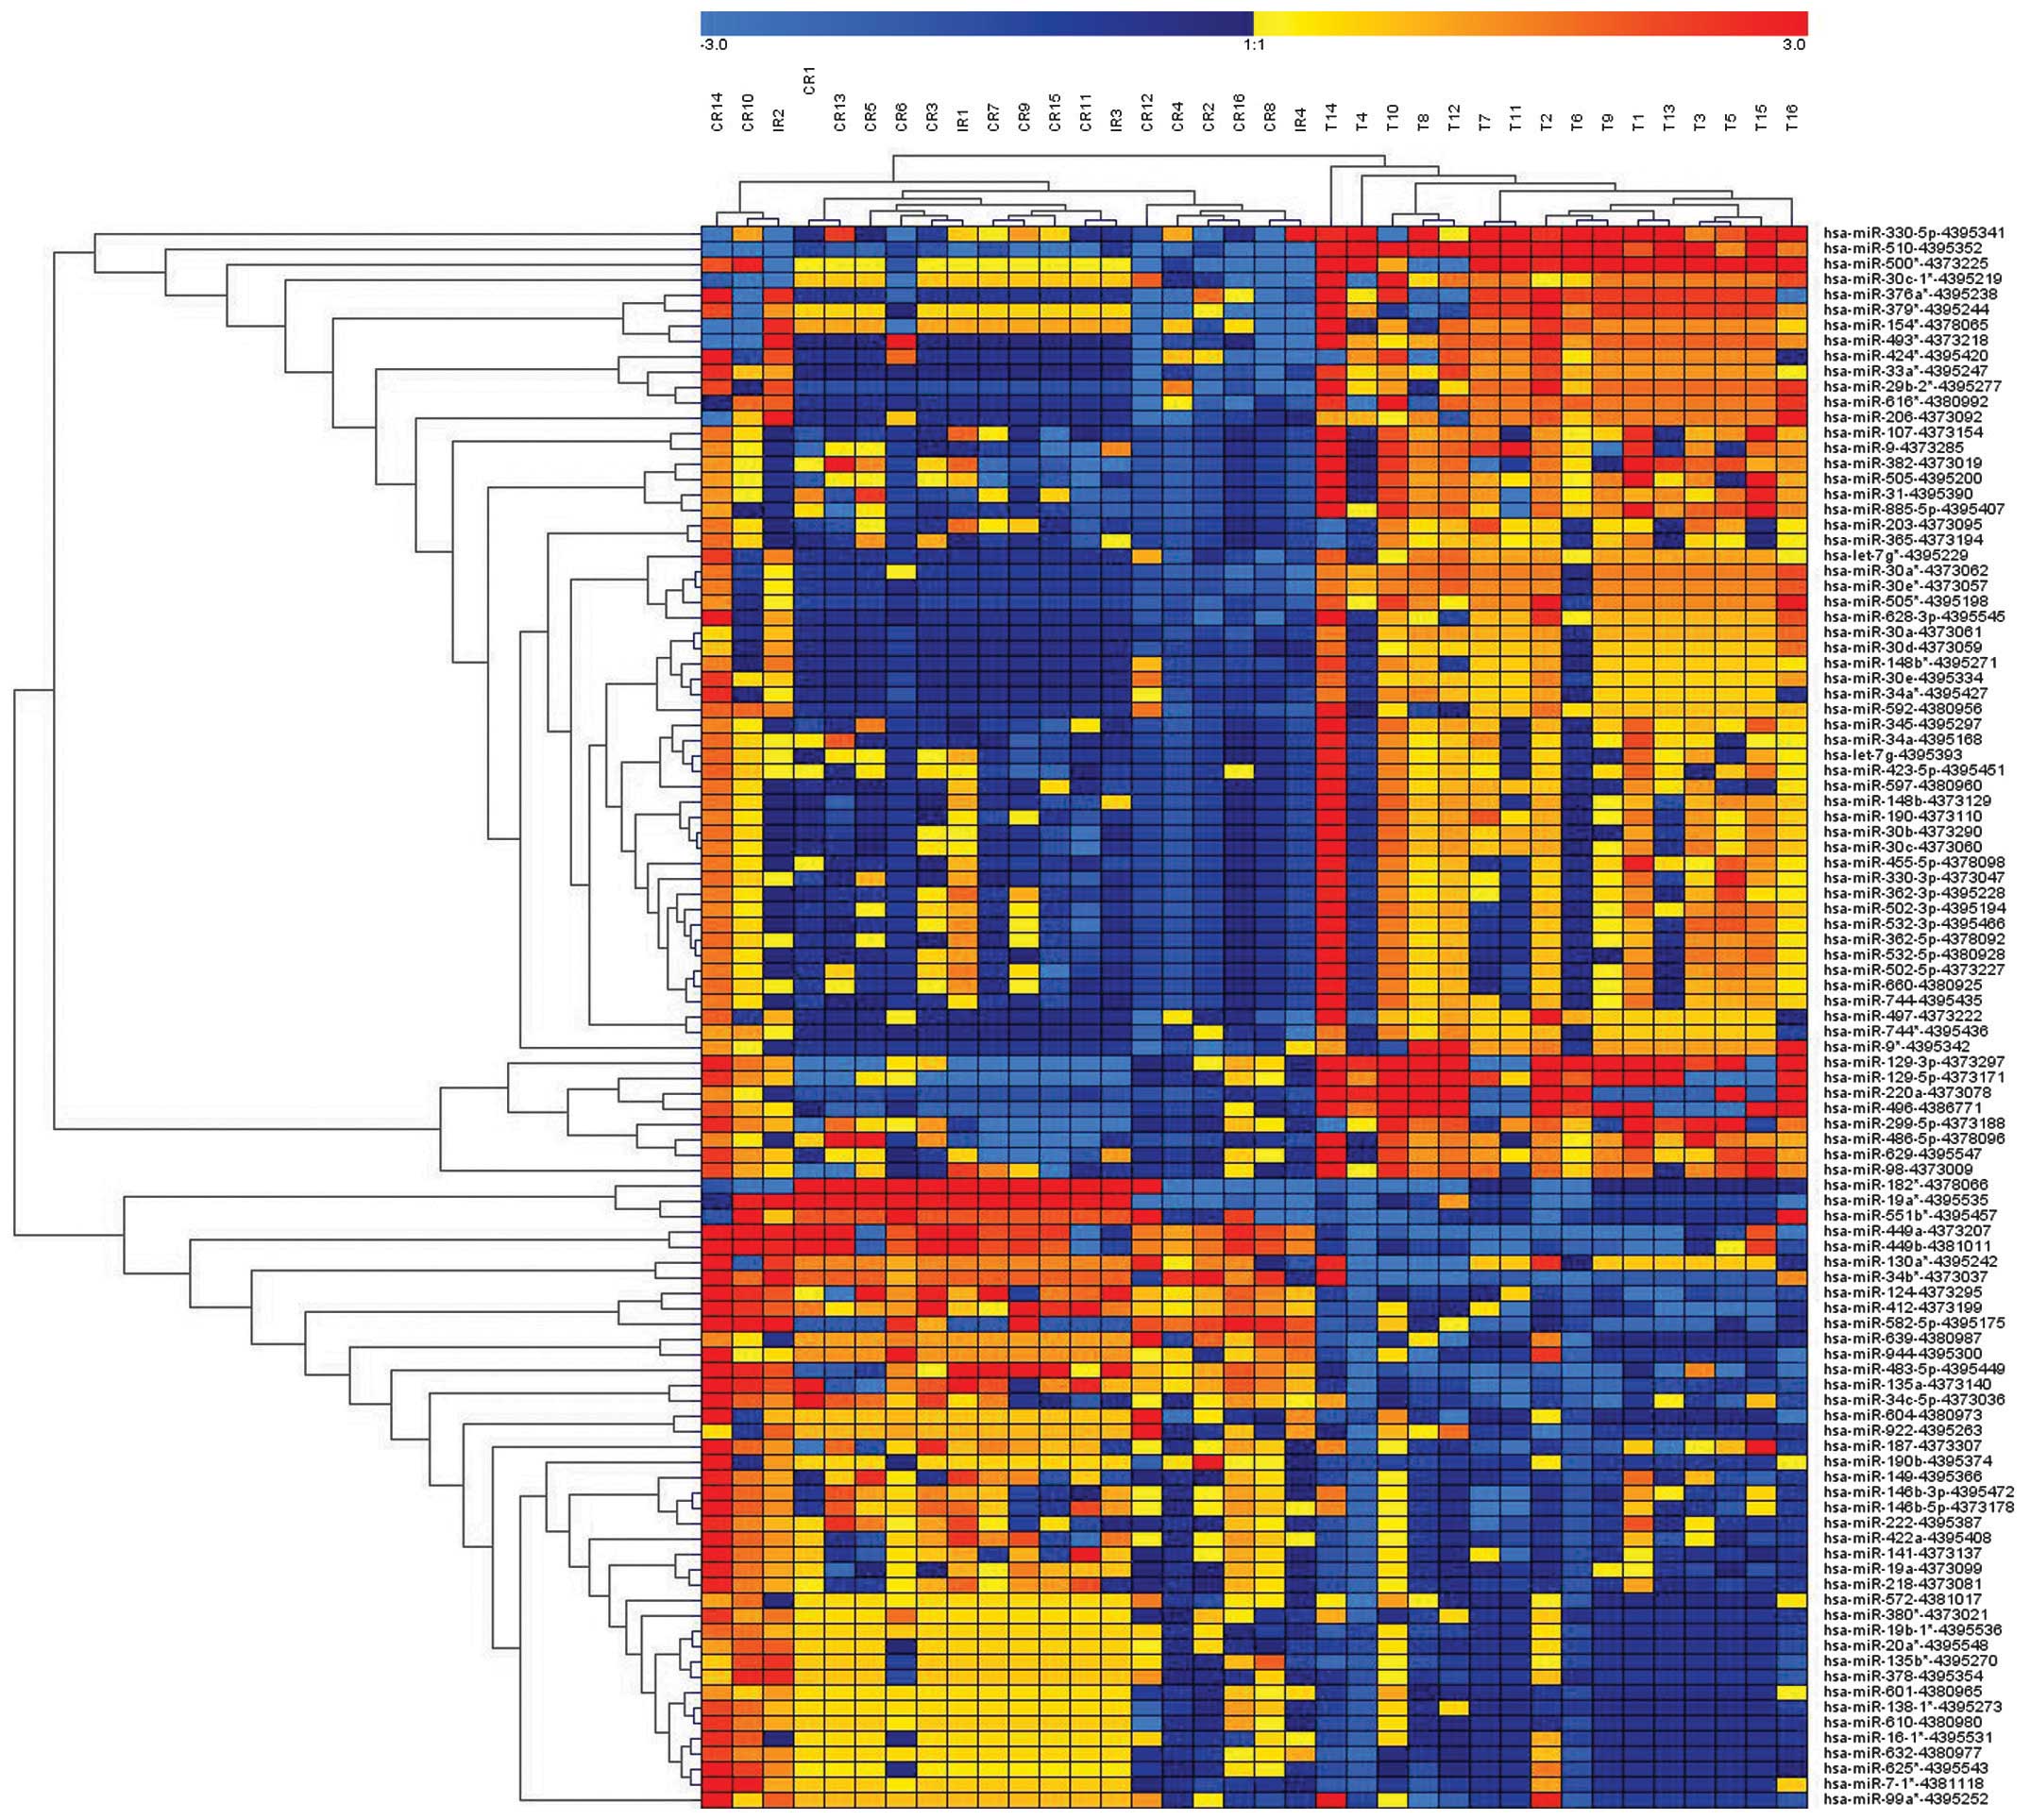
miRNA expression patterns
Of the 768 miRNAs analyzed in the microarray, 102
miRNAs were differentially expressed in HGSC, compared with CCC,
and 83 unique miRNAs retained significance (P<0.015), with at
least a 2-fold difference, following correction for multiple
comparisons. In total, 33 miRNAs were upregulated and 50 were
downregulated in the HGSC samples, compared with the CCC samples
(Fig. 1; Table II). The results of the
unsupervised hierarchical clustering, based on the expression of
the significantly differentially expressed miRNAs are shown in
Fig. 1.
| Table IIList of miRNAs identified to be
differentially expressed in HGSC and CCC samples. |
Table II
List of miRNAs identified to be
differentially expressed in HGSC and CCC samples.
| miR | P-value | FC | H |
|---|
| hsa-miR-510 | 3.56E-05 | 34.14 | CCC |
| hsa-miR-129-3p | 9.27E-04 | 30.50 | CCC |
| hsa-miR-330-5p | 1.91E-04 | 17.08 | CCC |
|
hsa-miR-500* | 1.11E-03 | 15.96 | CCC |
|
hsa-miR-493* | 1.75E-04 | 9.93 | CCC |
| hsa-miR-129-5p | 1.04E-03 | 9.80 | CCC |
| hsa-miR-299-5p | 1.21E-03 | 8.67 | CCC |
|
hsa-miR-29b-2* | 2.81E-07 | 7.94 | CCC |
| hsa-miR-885-5p | 4.31E-06 | 6.92 | CCC |
| hsa-miR-486-5p | 1.54E-03 | 6.64 | CCC |
| hsa-miR-98 | 1.23E-02 | 6.44 | CCC |
| hsa-miR-220a | 1.86E-03 | 6.39 | CCC |
|
hsa-miR-505* | 3.61E-09 | 6.17 | CCC |
|
hsa-miR-30a* | 3.67E-10 | 6.07 | CCC |
| hsa-miR-505 | 5.62E-06 | 6.01 | CCC |
|
hsa-miR-154* | 5.74E-03 | 5.99 | CCC |
|
hsa-miR-379* | 6.01E-03 | 5.79 | CCC |
| hsa-miR-629 | 3.60E-03 | 5.64 | CCC |
| hsa-miR-9 | 2.61E-04 | 5.42 | CCC |
| hsa-miR-496 | 2.75E-03 | 5.39 | CCC |
|
hsa-miR-30e* | 1.24E-10 | 5.19 | CCC |
|
hsa-miR-616* | 6.15E-04 | 5.19 | CCC |
|
hsa-miR-376a* | 1.22E-02 | 4.98 | CCC |
|
hsa-miR-9* | 4.55E-05 | 4.86 | CCC |
|
hsa-miR-30c-1* | 6.26E-03 | 4.79 | CCC |
|
hsa-miR-33a* | 1.43E-03 | 4.61 | CCC |
| hsa-miR-382 | 1.77E-03 | 4.59 | CCC |
| hsa-miR-206 | 1.95E-04 | 4.59 | CCC |
| hsa-miR-107 | 2.17E-03 | 4.33 | CCC |
|
hsa-miR-424* | 4.93E-03 | 4.31 | CCC |
| hsa-miR-31 | 7.59E-03 | 3.13 | CCC |
|
hsa-let-7g* | 1.17E-04 | 3.12 | CCC |
| hsa-miR-30a | 2.21E-09 | 3.00 | CCC |
| hsa-miR-30c | 3.27E-05 | 2.95 | CCC |
| hsa-miR-345 | 3.71E-05 | 2.91 | CCC |
| hsa-miR-190 | 2.02E-05 | 2.91 | CCC |
| hsa-miR-628-3p | 1.21E-03 | 2.84 | CCC |
| hsa-miR-30b | 1.87E-04 | 2.54 | CCC |
| hsa-miR-502-3p | 6.07E-04 | 2.53 | CCC |
| hsa-miR-497 | 3.19E-03 | 2.46 | CCC |
| hsa-miR-744 | 1.46E-04 | 2.42 | CCC |
| hsa-miR-455-5p | 1.15E-03 | 2.30 | CCC |
| hsa-miR-532-5p | 9.70E-04 | 2.27 | CCC |
| hsa-miR-592 | 2.81E-03 | 2.24 | CCC |
| hhsa-miR-203 | 2.16E-03 | 2.25 | CCC |
| hsa-miR-30d | 5.73E-06 | 2.16 | CCC |
| hsa-miR-502-5p | 5.56E-03 | 2.15 | CCC |
| hsa-miR-532-3p | 4.64E-03 | 2.14 | CCC |
| hsa-miR-423-5p | 3.11E-03 | 2.10 | CCC |
|
hsa-miR-34a* | 3.79E-04 | 2.06 | CCC |
|
hsa-miR-19b-1* | 5.07E-04 | 0.49 | HGSC |
|
hsa-miR-20a* | 1.45E-04 | 0.49 | HGSC |
| hsa-miR-141 | 1.06E-02 | 0.47 | HGSC |
|
hsa-miR-7-1* | 6.31E-03 | 0.48 | HGSC |
|
hsa-miR-380* | 1.51E-04 | 0.46 | HGSC |
| hsa-miR-222 | 7.36E-03 | 0.46 | HGSC |
| hsa-miR-218 | 1.18E-03 | 0.44 | HGSC |
| hsa-miR-149 | 6.58E-03 | 0.44 | HGSC |
|
hsa-miR-135b* | 4.38E-04 | 0.41 | HGSC |
| hsa-miR-378 | 5.30E-05 | 0.40 | HGSC |
| hsa-miR-604 | 1.12E-02 | 0.40 | HGSC |
| hsa-miR-422a | 3.66E-03 | 0.40 | HGSC |
|
hsa-miR-146b-3p | 1.91E-03 | 0.39 | HGSC |
| hsa-miR-187 | 1.14E-02 | 0.39 | HGSC |
| hsa-miR-190b | 9.19E-04 | 0.36 | HGSC |
|
hsa-miR-99a* | 5.84E-03 | 0.36 | HGSC |
| hsa-miR-922 | 1.10E-04 | 0.32 | HGSC |
|
hsa-miR-146b-5p | 8.80E-05 | 0.29 | HGSC |
| hsa-miR-582-5p | 5.03E-03 | 0.22 | HGSC |
| hsa-miR-34c-5p | 2.12E-04 | 0.19 | HGSC |
| hsa-miR-639 | 1.68E-03 | 0.17 | HGSC |
|
hsa-miR-130a* | 1.14E-02 | 0.16 | HGSC |
|
hsa-miR-19a* | 1.39E-03 | 0.13 | HGSC |
| hsa-miR-135a | 9.89E-07 | 0.12 | HGSC |
| hsa-miR-944 | 2.69E-04 | 0.12 | HGSC |
| hsa-miR-124 | 2.74E-05 | 0.11 | HGSC |
| hsa-miR-551a | 3.72E-03 | 0.10 | HGSC |
|
hsa-miR-182* | 6.17E-03 | 0.083 | HGSC |
| hsa-miR-412 | 1.70E-06 | 0.069 | HGSC |
| hsa-miR-483-5p | 8.81E-07 | 0.068 | HGSC |
|
hsa-miR-34b* | 1.01E-06 | 0.038 | HGSC |
| hsa-miR-449b | 9.52E-05 | 0.031 | HGSC |
| hsa-miR-449a | 2.27E-07 | 0.028 | HGSC |
Validation of unique miRNAs
To confirm the miRNA expression pattern obtained
from microarray analysis, RT-qPCR was used to quantify the
expression levels of specific miRNAs. In total, four of the 83
miRNAs (miR-510, miR-129-3p, miR-483 and miR-449a) were
differentially expressed in HGSC and CCC, and were selected for
further validation using RT-qPCR. The clinicopathological
characteristics of the patients with OC in the validation cohort
are shown in Table I. These miRNAs
were selected as >5-fold changes in expression levels were
observed in patients with OSC at stage I, compared with stage III
(P<0.005). miR-510, miR-129-3p, miR-483 and miR-449a were among
the most significantly differentially expressed miRNAs between HGSC
and CCC. The RT-qPCR results revealed that miR-510 and miR-129-3p
were significantly downregulated, and miR-483 and miR-449a were
significantly upregulated in CCC, compared with HGSC (P<0.05),
which was consistent with the results of the microarray. Fig. 2 lists the miRNA expression levels
in patients with OSC at different stages, according to the
microarray and RT-qPCR data.
Correlation between the expression of
miRNA, patient clinico- pathological data and survival rates
The clinicopathological features and prognosis of
all the patients with ovarian cancer were obtained from the
hospital records. The follow-up duration was between 1 and 104
months (mean, 49 months). During the follow-up period, 29 of the 78
patients (37.1%) succumbed to mortality. The clinicopathological
features included age (>50 or ≤50 years), subtype (CCC or HGSC),
FIGO stage, lymphatic metastasis (negative or positive) and
chemotherapy sensitivity (complete or incomplete response). Data
regarding sensitivity to chemotherapy were only available for
patients with HGSC.
The RT-qPCR results for miR-510, miR-129-3p, miR-483
and miR-449a were first separated into high and low expression,
defined according to the median value of the miRNA levels in the
tumor samples. Mann-Whitney and Kruskal-Wallis tests were performed
to analyze the expression levels of miR-510, miR-129-3p, miR-483
and miR-449a in different age groups (>50 or ≤50 years), stages
of lymph node metastasis and FIGO stage. All four miRNAs were
significantly associated with the FIGO stage (P<0.01) (Table III). The upregulation of miR-483
was also associated with positive tumor lymphatic metastasis
(P<0.01). The expression of these miRNAs was not associated with
the age of the patient (P>0.05) (Table III).
| Table IIICorrelation between the expression
levels of miR-510, miR-129-3p, miR-449a and miR-483, and
clinicopathological features of ovarian carcinomas. |
Table III
Correlation between the expression
levels of miR-510, miR-129-3p, miR-449a and miR-483, and
clinicopathological features of ovarian carcinomas.
| Clinicopathological
features | n | miR-483
| P | miR-510
| P | miR-129-3p
| P | miR-449a
| P |
|---|
| L | H | L | H | L | H | L | H |
|---|
| Age in years | | | | 0.247 | | | 0.224 | | | 0.882 | | | 0.458 |
| <50 | 41 | 24 | 17 | | 20 | 21 | | 22 | 19 | | 22 | 19 | |
| ≥50 | 37 | 15 | 22 | | 19 | 18 | | 17 | 18 | | 17 | 20 | |
| Subtypes | | | | 0.000 | | | | | | 0.002 | | | 0.000 |
| HGSC | 42 | 8 | 34 | | 33 | 9 | | 31 | 11 | | 8 | 34 | |
| CCC | 36 | 31 | 5 | | 6 | 30 | | 8 | 28 | | 31 | 5 | |
| FIGO stage | | | | 0.001 | | | 0.001 | | | 0.010 | | | 0.001 |
| I | 33 | 28 | 5 | | 6 | 27 | | 8 | 25 | | 28 | 5 | |
| II | 4 | 2 | 2 | | 2 | 2 | | 0 | 4 | | 2 | 2 | |
| III | 36 | 9 | 30 | | 29 | 10 | | 29 | 10 | | 9 | 30 | |
| IV | 2 | 0 | 2 | | 2 | 0 | | 2 | 0 | | 0 | 2 | |
| LN metastasis | | | | 0.048 | | | 0.274 | | | 0.173 | | | 0.084 |
| Absent | 50 | 29 | 21 | | 23 | 27 | | 22 | 28 | | 30 | 20 | |
| Present | 28 | 10 | 18 | | 16 | 12 | | 17 | 11 | | 9 | 19 | |
Clinicopathological features and the expression of
miRNAs, including miR-510, miR-129-3p, miR-483 and miR-449a, were
included in the univariate survival analysis. Univariate analysis
revealed that FIGO stage, subtype of ovarian cancer,
chemosensitivity, lymphatic metastasis status, and expression
levels of miR-510 and miR-129-3p were associated with prognosis
(P<0.05), whereas the age of the patient and the expression
levels of miR-449a and miR-483-5p were not (P>0.05; Table IV). Downregulation in the
expression levels of miR-510 and miR-129-3p were clearly associated
with poor prognosis (Fig. 3).
| Table IVUnivariate analysis of expression and
overall cancer survival in subjects with ovarian serous
carcinoma. |
Table IV
Univariate analysis of expression and
overall cancer survival in subjects with ovarian serous
carcinoma.
| Clinicopathological
parameter | n | Succumbed to
mortality (n) | Survival rate
(mean) | Survival rate (95%
CI)
| P-value |
|---|
| Lower | Upper |
|---|
| Age | | | | | | 0.461 |
| <50 | 41 | 14 | 82.977 | 70.037 | 95.917 | |
| ≥50 | 37 | 15 | 71.944 | 58.239 | 85.649 | |
| Subtype | | | | | | 0.000 |
| HGSC | 42 | 24 | 61.417 | 47.714 | 75.119 | |
| CCC | 36 | 5 | 97.581 | 88.214 | 106.948 | |
| LN metastasis | | | | | | 0.000 |
| − | 50 | 11 | 94.426 | 84.191 | 104.661 | |
| + | 28 | 18 | 49.412 | 35.012 | 63.812 | |
| Chemosensitivity
(only available in HGSC) | | | | | | 0.022 |
| CR | 26 | 12 | 71.410 | 54.913 | 87.907 | |
| IR | 16 | 12 | 37.313 | 20.048 | 54.577 | |
| FIGO stage | | | | | | 0.000 |
| I | 33 | 2 | 103.131 | 95.338 | 110.925 | |
| II | 4 | 2 | 67.500 | 44.585 | 90.415 | |
| III | 39 | 23 | 59.919 | 45.488 | 74.349 | |
| IV | 2 | 2 | 12.500 | 12.000 | 29.160 | |
| miR-510 | | | | | | 0.048 |
|
Low-expression | 41 | 19 | 62.972 | 43.206 | 82.738 | |
| High
expression | 37 | 10 | 91.875 | 75.252 | 108.498 | |
| miR-129-3p | | | | | | |
| Low
expression | 39 | 20 | 61.294 | 40.391 | 82.198 | 0.039 |
| High
expression | 39 | 9 | 90.056 | 72.990 | 107.121 | |
| miR-483 | | | | | | |
| Low
expression | 39 | 10 | 90.722 | 73.877 | 107.567 | 0.083 |
| High
expression | 39 | 19 | 60.471 | 39.541 | 81.400 | |
| miR-449a | | | | | | |
| Low
expression | 39 | 11 | 88.647 | 70.241 | 107.053 | 0.198 |
| High
expression | 39 | 18 | 61.444 | 42.643 | 80.246 | |
Expression levels of miR-510 in the
normal control, HGSC, LGSC and CCC tissue samples
miR-510 was identified among the most significantly
altered miRNAs between the HGSC and CCC tissue samples. Our
previous study (20) also revealed
its prognostic value for OSC. In order to evaluate the expression
of miR-510 in ovarian tumors, the expression of miR-510 was
detected in a cohort of patients with ovarian cancer, including 42
cases of HGSC, 10 cases of LGSC and 36 cases of CCC. In addition,
10 samples of normal ovarian tissue, which comprised ovarian
surface epithelium (OSE), were selected as the control. The results
revealed that the expression levels of miR-510 were significantly
higher in the CCC and LGSC specimens, compared with the OSE and
HGSC specimens. Although the mean value of miR-510 expression in
the HGSC samples was marginally lower than that in the OSE samples,
no significant difference was identified between these two groups
(Fig. 4). No significant
difference was observed in the expression of miR-510 between the
CCC and LGSC samples.
 | Figure 4Expression levels of miR-510 in normal
ovarian tissue, HGSC, LGSC and CCC samples. The transverse bars
indicate the median value of the results of the reverse
transcription-quantitative polymerase chain reaction of miR-510,
error bars indicate 95% confidential intervala. The expression
levels of miR-510 in the CCC and LGSC samples were significantly
higher, compared with the normal ovarian tissue and HGSC samples.
No significant difference was identified between the expression
levels of miR-510 in the CCC and LGSC samples (P=0.198) or the HGSC
and normal ovarian tissue samples (P=0.860). miR, microRNA; EOC,
epithelial ovarian cancer; HGSC, high-grade serous carcinoma; CCC,
clear cell carcinoma; LGSC, low-grade serous carcinoma; OSE,
ovarian surface epithelium. |
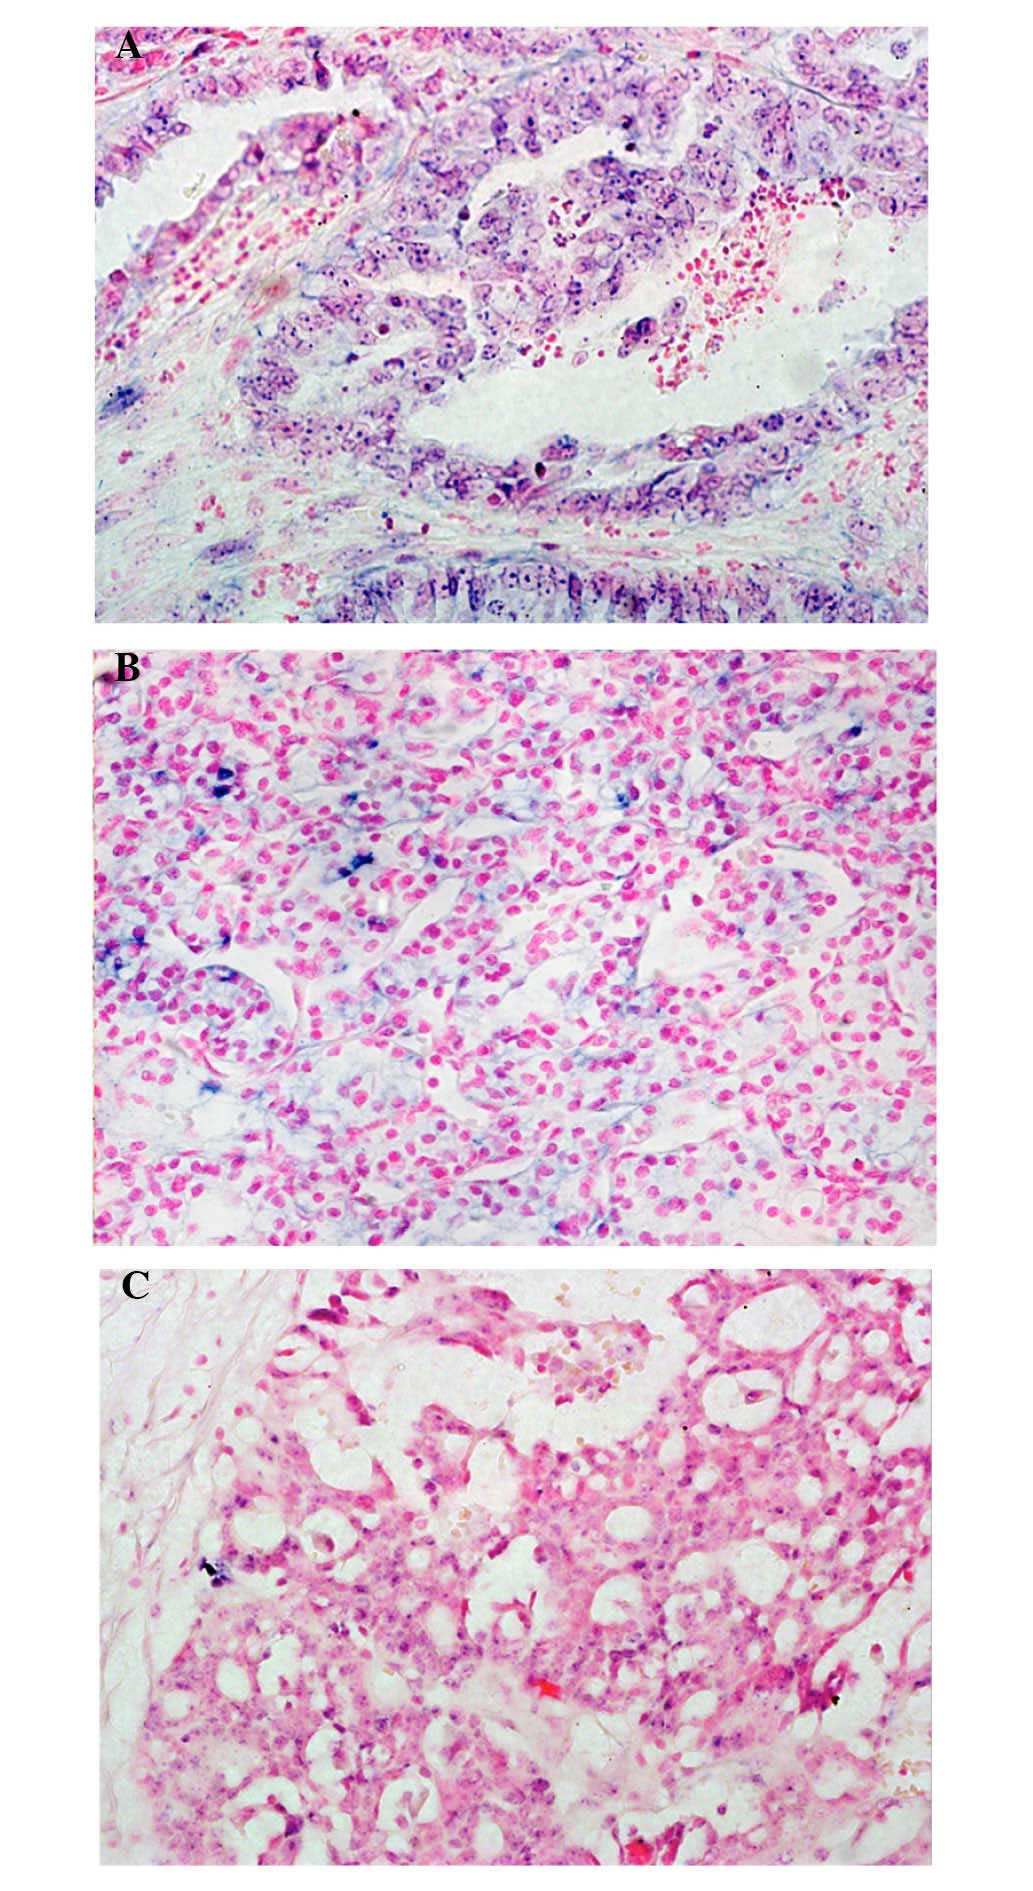
ISH detection of miR-510 in LGSC, HGSC
and CCC
To determine the location of miR-510 in EOC, the
expression levels of miR-510 were qualitatively detected in the
HGSC, LGSC and CCC specimens using ISH (Fig. 5). The results revealed that miR-510
was densely distributed in the malignant cells, particularly in the
cytoplasm and nuclei of the LGSC (Fig
5A) and CCC (Fig. 5B) samples.
The positive signal of miR-510 was poorly expressed in the
malignant cells of the HGSC samples (Fig. 5C), compared with the LGSC and CCC
samples.
Discussion
In the present study, a number of miRNAs were
identified distinguishing HGSC from CCC, and differential miRNA
expression was associated with histological type and stage, as well
as overall survival rates. The expression levels of miR-510 were
further examined in samples of normal ovarian tissue and ovarian
tumor tissue, including HGSC, LGSC and CCC, using RT-qPCR and ISH.
The expression levels of miR-510 wereupregulated in the low-grade
tumor samples (LGSC and CCC) and downregulated in the high-grade
tumor samples (HGSC), compared with the normal ovarian tissue
samples. To the best of our knowledge, there are few previous
reports regarding the differentially expressed miRNAs between HGSC
and CCC, and the present study is the first study to investigate
the expression of miR-510 in HGSC, LGSC and CCC, compared with
EOC.
In the present study, 33 upregulated and 50
downregulated miRNAs were identified in HGSC compared with CCC,
using a microarray. Of the 83 key miRNAs identified in the present
study, four (miR-510, miR-129-3p, miR-483 and miR-449a) were
validated using RT-qPCR, and their expression levels were confirmed
to be consistent with the microarray data. The results indicated
that the differential miRNA pattern in HGSC, compared with CCC, was
credible. These data on the expression of miRNAs in HGSC and CCC
are consistent with what has been reported in previous literature
(21,22). The pattern of miRNA expression
distinguishing HGSC from CCC has not been widely investigated.
Vilming Elgaaen et al found that 28 miRNAs are upregulated
and 50 miRNAs are down-regulated in HGSC (n=12), compared with CCC
(n=9). Their dysregulated miRNA expression profiles shared certain
key miRNAs with the results of the present study (Table V) (21). Heejeong measured eight miRNAs in
ovarian cancer samples using RT-qPCR, and reported that the
expression levels of miR-30a-3p, miR-30c and miR-30e-3p were
significantly higher in CCC samples than in HGSC samples (22). Higher expression levels of
miR-181d, miR-30c, miR-30d and miR-30e-3p were associated
withsignificantly improved disease-free and overall survival rates,
and miR-30a-3p, miR-30c and miR-30e-3p may regulate the ovarian
carcinoma-specific gene, CDH13 (22). Of the dysregulated miRNAs
identified in the present study, certain miRNAs were associated
with a specific subtype of EOC. The upregulation of miR-29b,
miR-30a, miR-486-5p and miR-30e, and the downregulation of miR-20a
were specific to the CCC samples. The upregulation of miR-7,
miR-22, miR-302b, miR-373, miR-34c-5p, miR-449a and miR-146b-5p,
and the downregulation of miR-148b, miR-31 and miR-211 are reported
to be specific to serous carcinoma (21). The miRNAs differentially expressed
in the HGSC and CCC samples may be associated with the different
carcinogenesis pathways, as well as their distinct morphological or
genetic features. Thhese miRNAs were differentially expressed in
different histological types of ovarian carcinoma, which is
pertinent to the fact that different histological types are
biologically and pathogenetically distinct entities.
| Table VOverlapping findings in published
data and the present study of compared differential miRNA profiling
between HGSC and CCC (21). |
Table V
Overlapping findings in published
data and the present study of compared differential miRNA profiling
between HGSC and CCC (21).
| Expression
level | miRNA |
|---|
| High in HGSC |
hsa-miR-135b* |
| hsa-miR-141 |
|
hsa-miR-20a* |
| hsa-miR-378 |
|
hsa-miR-99a* |
| High in CCC |
hsa-miR-154* |
|
hsa-miR-29b-2* |
| hsa-miR-299-5p |
| hsa-miR-362-5p |
|
hsa-miR-376a* |
|
hsa-miR-379* |
|
hsa-miR-424* |
|
hsa-miR-493* |
|
hsa-miR-500* |
| hsa-miR-502-3p |
| has-miR-510 |
| hsa-miR-532-3p |
| hsa-miR-532-5p |
| hsa-miR-885-5p |
The association between the expression levels of
miR-510, miR-129-3p, miR-483 and miR-449a and clinicopathological
features and prognosis, were also investigated, and it was revealed
that all were associated with the FIGO stage. In addition, miR-483
was associated with the lymphatic metastasis status, and lower
expression levels of miR-510 and miR-129-3p were associated with a
poor prognosis. The majority of the HGSC samples were at an
advanced stage, whereas the CCC samples were at stage I or II. The
miRNAs differentially expressed in the HGSC and CCC samples may
also be associated with the progression and FIGO stage of EOC.
miR-510 is one of the miRNAs, which most clearly
distinguished between the CCC and HGSC samples in the prsent study.
Our previous study demonstrated that higher expression levels of
miR-510 in stage I OSC, compared with stage III OSC were associated
with survival rates. This suggested that miR-510 may be important
in EOC. In order to further investigate the role of miR-510 in EOC,
the expression of miR-510 was quantitatively and qualitatively
examined using RT-qPCR and ISH in samples, including normal ovarian
tissue, LGSC, HGSC and CCC. The results revealed that the
expression of levels of miR-510 in CCC and LGSC were significantly
higher than those in HGSC and OSE. Although the mean expression
value of miR-510 in HGSC was lower than that in OSE, no difference
was identified between these two groups. Additionally, no
difference was identified between the expression levels of miR-510
in the CCC and LGSC samples. ISH confirmed that miR-510 was
expressed in the cancer cells. These results suggested an important
and complicated role of miR-510 in EOC.
To the best of our knowledge, few studies have
focused on miR-510, and their results were ambiguous (18,22–24).
miR-510 belongs to the miR-506-514 gene cluster, which includes
seven distinct miRNAs: miR-506,-507,-508,-509,-510,-513 and -514,
and has been previously reported to be conserved in primates
(24,25). This gene cluster is located at
Xq27.3, a chromosomal region associated with Fragile X syndrome,
and female patients with Fragile X syndrome suffer from primary
ovarian insufficiency (24). In
serous ovarian carcinoma, it has been reported that patients with
low expression levels of the chrXq27.3 miRNA cluster experience
shorter progression-free survival rates, and downregulation of
chrXq27.3 miRNA was a possible independent prognostic indicator of
early relapse (26). By analyzing
the miRNA profile in TGCA data, the miRNAs located at Xq27.3 have
been revealed to be members of a highly correlated and co-expressed
miRNA cluster (24). Our previous
study demonstrated that five members of this gene cluster,
including miR-510, miR-513a-3p, miR-509-3p, miR-508-3p and
miR-509-5p, were the most differentially expressed miRNA between
stage I and stage III serous ovarian carcinoma. Low expression
levels of miR-510 and miR-509 was associated with poor prognosis
(20). Bente et al
(21) found that miR-509-3-5p,
miR-509-5p, miR-509-3p and miR-510 were the most significant
differentiators between HGSC and CCC, all of which were
significantly overexpressed in CCC, compared with HGSC. The
expression levels of these miRNAs were higher in CCC and lower in
HGSC, compared with OSE, which was consistent with the present
study, with the exception that the present study did not identify a
significant difference in the expression of miR-510 between HGSC
and OSE (21). These results
suggested that miR-510 has different roles in different subtypes of
ovarian cancer. The upregulation of miR-510 suggested that miR-510
may act as an oncogene in LGSC and CCC. The fact that miR-510 was
downregulated in HGSC, and low expression levels were associated
with early relapse, suggested that miR-510 may act as a tumor
suppressor or be due to the high gene instability of HGSC.
Increasing numbers of studies have demonstrated that
the different subtypes of ovarian carcinoma represent distinct
disease entities, rather than different manifestations of one
disease (7,27). Novel histopathological, molecular
and genetic studies have developed an improved model for ovarian
carcinogenesis, revealing at least two broad categories, type I and
type II. LGSC and CCC are type I tumors, which are considered to
behave in an indolent manner, and appear to evolve in a stepwise
fashion between ovarian epithelial inclusions, benign cystadenomas
and borderline tumors. They are often confined to the ovary at the
point of diagnosis, with a stable genome and without TP53
mutations. HGSC is a type II tumor, which is considered to be more
aggressive. It is often diagnosed at an advanced stage and is
genetically unstable; the majority exhibiting TP53 mutations, and
almost half of the cases exhibit abnormalities in BRCA1/2 (7,28).
HGSC and LGSC are currently known to be the products
of two completely disparate tumorigenic pathways, with only rare
intersection and distinct differences in prognosis and
chemotherapeutic sensitivity (28). This corresponds with the results of
the present study, demonstrating the upregulation of miR-510 in CCC
and LGSC, and the novel histopathological model that CCC and LGSC
belong to type I. Downregulation and/or no change in the level of
miR-510 in HGSC provided further evidence to support the results of
the present study and is consistent with the novel model that HGSC
belongs to the type II category. In addition, miR-510 may be
involved differently in the two broad categories of
carcinogenesis.
The function of miR-510 and its validated target
genes remain to be fully elucidated. Its oncogenic role has been
demonstrated in breast cancer and melanoma (29,30).
In melanoma, the miR-506-514 cluster regulates cell growth,
apoptosis, invasion and soft agar colony formation, and a
sub-cluster of the miR-506-514 phenotype is required for melanocyte
transformation (29). In breast
cancer, the overexpression of miR-510 increases tumor growth in
vivo (30). However, it has
also been reported that miR-510 may be important as a tumor
suppressor. miR-510 is expressed in stage I non-small cell lung
cancer, and is deregulated in cases of recurrence (31). Another study in gastric cancer
samples demonstrated that lymph node metastases exhibits
downregulated expression levels of miR-510, compared with primary
cancer samples (32). It appears
that miR-510 tends to be highly expressed in localized tumors and
may be important in invasion and metastasis.
In conclusion, a unique profile of 83 miRNAs, which
were differentially expressed in HGSC and CCC were determined by
microarray in the present study, and the majority of these were
downregulated at the advanced stage. A total of four miRNAs were
validated using RT-qPCR, and miR-510 and miR-129-3p were confirmed
to be close associated with the prognosis of patients with EOC. The
expression levels of miR-510 in CCC and LGSC were significantly
higher than those in HGSC and OSE. These results suggested that
miR-510 may have different roles in the two broad categories of
carcinogenesis.
Acknowledgments
This study was supported by the National Basic
Research Program of China 973 (program no. 2012CB517600; grant no.
2012CB517603) to Professor Cui Shiying, and was partly supported by
a Science Grant to Miss Xiaotang Yu from the Department of
Education, Liaoning Province (grant no. L2011157). The authors
would like to thank all family members of the participants for
their kind cooperation.
References
|
1
|
Jemal A, Bray F, Center MM, Ferlay J, Ward
E and Forman D: Global cancer statistics. CA Cancer J Clin.
61:69–90. 2011. View Article : Google Scholar : PubMed/NCBI
|
|
2
|
Wang L, Zhu MJ, Ren AM, Wu HF, Han WM, Tan
RY and Tu RQ: A ten-microRNA signature identified from a
genome-wide microRNA expression profiling in human epithelial
ovarian cancer. PLoS One. 9:e964722014. View Article : Google Scholar : PubMed/NCBI
|
|
3
|
Walentowicz P, Sadlecki P, Krintus M,
Sypniewska G, Mankowska-Cyl A, Grabiec M and Walentowicz-Sadlecka
M: Serum anti-müllerian hormone levels in patients with epithelial
ovarian cancer. Int J Endocrinol. 2013(517239)2013. View Article : Google Scholar
|
|
4
|
Siegel R, Ward E, Brawley O and Jemal A:
Cancer statistics, 2011: The impact of eliminating socioeconomic
and racial disparities on premature cancer deaths. CA Cancer J
Clin. 61:212–236. 2011. View Article : Google Scholar : PubMed/NCBI
|
|
5
|
Kim PS, Djazayeri S and Zeineldin R: Novel
nanotechnology approaches to diagnosis and therapy of ovarian
cancer. Gynecol Oncol. 120:393–403. 2011. View Article : Google Scholar
|
|
6
|
Gilks CB and Prat J: Ovarian carcinoma
pathology and genetics: Recent advances. Hum Pathol. 40:1213–1223.
2009. View Article : Google Scholar : PubMed/NCBI
|
|
7
|
Landen CN Jr, Birrer MJ and Sood AK: Early
events in the pathogenesis of epithelial ovarian cancer. J Clin
Oncol. 26:995–1005. 2008. View Article : Google Scholar : PubMed/NCBI
|
|
8
|
Kurman RJ: Origin and molecular
pathogenesis of ovarian high-grade serous carcinoma. Ann Oncol.
24(Suppl 10): x16–x21. 2013. View Article : Google Scholar : PubMed/NCBI
|
|
9
|
Bennett JA, Dong F, Young RH and Oliva E:
Clear cell carcinomas of the ovary: Evaluation of prognostic
parameters based on a clinicopathologic analysis of 100 cases.
Histopathology. 66:808–815. 2015. View Article : Google Scholar
|
|
10
|
Kinose Y, Sawada K, Nakamura K and Kimura
T: The role of microRNAs in ovarian cancer. Biomed Res Int.
2014(249393)2014. View Article : Google Scholar : PubMed/NCBI
|
|
11
|
Oom AL, Humphries BA and Yang C:
MicroRNAs: Novel Players in cancer diagnosis and therapies. Biomed
Res Int. 2014(959461)2014. View Article : Google Scholar : PubMed/NCBI
|
|
12
|
Zhang B, Pan X, Cobb GP and Anderson TA:
MicroRNAs as oncogenes and tumor suppressors. Dev Biol. 302:1–12.
2007. View Article : Google Scholar
|
|
13
|
Ventura A and Jacks T: MicroRNAs and
cancer: Short RNAs go a long way. Cell. 136:586–591. 2009.
View Article : Google Scholar : PubMed/NCBI
|
|
14
|
Zhang L, Volinia S, Bonome T, Calin GA,
Greshock J, Yang N, Liu CG, Giannakakis A, Alexiou P, Hasegawa K,
et al: Genomic and epigenetic alterations deregulate microRNA
expression in human epithelial ovarian cancer. Proc Natl Acad Sci
USA. 105:7004–7009. 2008. View Article : Google Scholar : PubMed/NCBI
|
|
15
|
van Jaarsveld MT, Helleman J, Berns EM and
Wiemer EA: MicroRNAs in ovarian cancer biology and therapy
resistance. Int J Biochem Cell Biol. 42:1282–1290. 2010. View Article : Google Scholar : PubMed/NCBI
|
|
16
|
Eitan R, Kushnir M, Lithwick-Yanai G,
David MB, Hoshen M, Glezerman M, Hod M, Sabah G, Rosenwald S and
Levavi H: Tumor microRNA expression patterns associated with
resistance to platinum based chemotherapy and survival in ovarian
cancer patients. Gynecol Oncol. 114:253–259. 2009. View Article : Google Scholar : PubMed/NCBI
|
|
17
|
Kandukuri SR and Rao J: FIGO 2013 staging
system for ovarian cancer: What is new in comparison to the 1988
staging system? Curr Opin Obstet Gynecol. 27:48–52. 2015.
View Article : Google Scholar
|
|
18
|
Mavridis K, Stravodimos K and Scorilas A:
Downregulation and prognostic performance of microRNA 224
expression in prostate cancer. Clin Chem. 59:261–269. 2013.
View Article : Google Scholar
|
|
19
|
Zhao JY, Liu CQ, Zhao HN, Ding YF, Bi T,
Wang B, Lin XC, Guo G and Cui SY: Synchronous detection of miRNAs,
their targets and downstream proteins in transferred FFPE sections:
Applications in clinical and basic research. Methods. 58:156–163.
2012. View Article : Google Scholar : PubMed/NCBI
|
|
20
|
Yu X, Zhang X, Bi T, Ding Y, Zhao J, Wang
C, Jia T, Han D, Guo G, Wang B, et al: MiRNA expression signature
for potentially predicting the prognosis of ovarian serous
carcinoma. Tumour Biol. 34:3501–3508. 2013. View Article : Google Scholar : PubMed/NCBI
|
|
21
|
Vilming Elgaaen B, Olstad OK, Haug KB,
Brusletto B, Sandvik L, Staff AC, Gautvik KM and Davidson B: Global
miRNA expression analysis of serous and clear cell ovarian
carcinomas identifies differentially expressed miRNAs including
miR-200c-3p as a prognostic marker. BMC Cancer. 14(80)2014.
View Article : Google Scholar : PubMed/NCBI
|
|
22
|
Lee H, Park CS, Deftereos G, Brusletto B,
Sandvik L, Staff AC, Gautvik KM and Davidson B: MicroRNA expression
in ovarian carcinoma and its correlation with clinicopathological
features. World J Surg Oncol. 10(174)2012. View Article : Google Scholar
|
|
23
|
Banno K, Yanokura M, Iida M, Adachi M,
Nakamura K, Nogami Y, Umene K, Masuda K, Kisu I, Nomura H, et al:
Application of microRNA in diagnosis and treatment of ovarian
cancer. Biomed Res Int. 2014(232817)2014. View Article : Google Scholar : PubMed/NCBI
|
|
24
|
Yang D, Sun Y, Hu L, Zheng H, Ji P, Pecot
CV, Zhao Y, Reynolds S, Cheng H, Rupaimoole R, et al: Integrated
analyses identify a master microRNA regulatory network for the
mesenchymal subtype in serous ovarian cancer. Cancer Cell.
23:186–199. 2013. View Article : Google Scholar : PubMed/NCBI
|
|
25
|
Streicher KL, Zhu W, Lehmann KP,
Georgantas RW, Morehouse CA, Brohawn P, Carrasco RA, Xiao Z, Tice
DA, Higgs BW, et al: A novel oncogenic role for the miRNA-506-514
cluster in initiating melanocyte transformation and promoting
melanoma growth. Oncogene. 31:1558–1570. 2012. View Article : Google Scholar
|
|
26
|
Bagnoli M, De Cecco L, Granata A,
Nicoletti R, Marchesi E, Alberti P, Valeri B, Libra M, Barbareschi
M, Raspagliesi F, et al: Identification of a chrXq27.3 microRNA
cluster associated with early relapse in advanced stage ovarian
cancer patients. Oncotarget. 2:1265–1278. 2011. View Article : Google Scholar
|
|
27
|
Lynch HT, Casey MJ, Snyder CL, Bewtra C,
Lynch JF, Butts M and Godwin AK: Hereditary ovarian carcinoma:
Heterogeneity, molecular genetics, pathology, and management. Mol
Oncol. 3:97–137. 2009. View Article : Google Scholar : PubMed/NCBI
|
|
28
|
Koshiyama M, Matsumura N and Konishi I:
Recent concepts of ovarian carcinogenesis: Type I and type II.
Biomed Res Int. 2014(934261)2014. View Article : Google Scholar : PubMed/NCBI
|
|
29
|
Streicher KL, Zhu W, Lehmann KP,
Georgantas RW, Morehouse CA, Brohawn P, Carrasco RA, Xiao Z, Tice
DA, Higgs BW, et al: A novel oncogenic role for the miRNA-506-514
cluster in initiating melanocyte transformation and promoting
melanoma growth. Oncogene. 31:1558–1570. 2012. View Article : Google Scholar
|
|
30
|
Guo QJ, Mills JN, Bandurraga SG, Nogueira
LM, Mason NJ, Camp ER, Larue AC, Turner DP and Findlay VJ:
MicroRNA-510 promotes cell and tumor growth by targeting
peroxiredoxin1 in breast cancer. Breast Cancer Res. 15:R702013.
View Article : Google Scholar : PubMed/NCBI
|
|
31
|
Patnaik SK, Kannisto E, Knudsen S and
Yendamuri S: Evaluation of microRNA expression profiles that may
predict recurrence of localized stage I non-small cell lung cancer
after surgical resection. Cancer Res. 70:36–45. 2010. View Article : Google Scholar
|
|
32
|
Chen W, Tang Z, Sun Y, Zhang Y, Wang X,
Shen Z, Liu F and Qin X: miRNA expression profile in primary
gastric cancers and paired lymph node metastases indicates that
miR-10a plays a role in metastasis from primary gastric cancer to
lymph nodes. Exp Ther Med. 3:351–356. 2012.PubMed/NCBI
|