Introduction
Hepatocellular carcinoma (HCC) is one of the most
common types of malignancy worldwide (1). It is associated with a poor prognosis
in advanced stages. Identifying therapeutic targets for the
treatment of HCC is important. During tumor development,
somatically acquired “passenger” mutations owing to the inherent
genomic instability of cancer cells, gene linkage, and spontaneous
mutagenesis may not confer a selective advantage to the developing
tumor (2). Currently, one of the
challenges in cancer research is identifying key molecular changes
among all acquired “passenger” mutations that promote the formation
and development of the tumor. In recent years, genome sequencing
projects have been completed in a number of animals, including
humans, rats and mice, and genes have been identified that have the
same expression in different species indicating that these genes
could have conservative and important functions. The strategy of
cross-species comparative oncogenomics was developed based on this
understanding. Mattison et al (3) adopted cross-species comparative
genomic hybridization to search for genes that were co-expressed in
HCC tissues collected from humans, mice and rats, in order to
identify novel candidate genes. The authors of the present study
hypothesized that a search for genetic regulators common to humans
and other animals, during HCC formation may aid in identifying key
genes that affect the pathogenesis and progression of HCC. Gene
microarrays have been widely used in HCC research. Analyses on
whole-genome mRNA expression microarrays can aid in predicting
transcripts that affect the prognosis and recurrence of HCC.
However, identifying specific genetic markers that can be used as
treatment targets remains a challenge. Mootha et al
(4) developed GSEA, with which
disease-associated gene pathways can be identified at the genomic
level using case-control data. In GSEA, gene expression
hybridization data in two biological conditions are analyzed to
determine a pattern of gene expression in specific functional gene
sets and whether such a pattern is statistically significant. In
addition, due to differences in experimental platforms, samples,
standardization methods and analytical methods, microarray data
obtained in different laboratories may differ. Meta-analysis can be
a viable solution to this problem, as it can be used to collect and
quantitatively analyze data published on the same subject in an
integrative manner, thus obtaining more accurate or a larger number
of results than can be gained from any individual study (5). In the present study, GSEA and
meta-analysis were combined to analyze whole genome and microarray
data from five HCC data sets.
Materials and methods
Databases
A systematic literature and database search was
performed to identify the HCC-related gene expression profiles of
humans and other animals. Relevant data were downloaded from the
Gene Expression Omnibus (GEO) database (http://www.ncbi.nlm.nih.gov/geo/). The keyword used
for the search was 'hepatocellular carcinoma' and the research type
was set as expression profiling by array. A total of 230 studies
have published gene microarray data. The data sets that met the
following criteria were included in this study: The data set must
contain whole-genome mRNA expression microarray data; data included
a comparison between HCC and normal tissues; both standardized and
raw data sets were examined; and the data set had to include >3
samples. Using the above criteria, only five data sets (6–10)
were included in the present study (Table I). GSEA and meta-analysis were
combined to analyze whole genome and microarray data of these five
HCC data sets. The genes that showed significantly differential
expression were compared with the mRNA microarray results of a
study conducted by our group using the tree shrew HCC model
(11) to identify genes in HCC
tissue that showed specific changes in >2 species (including
humans).
 | Table IBasic information on the five
whole-genome data sets. |
Table I
Basic information on the five
whole-genome data sets.
| Data set | Authors, (ref.) | Microarray
platform | Experimental
design | Number of probes | Species | Sample (n) | Control (n) |
|---|
| GSE19665 | Deng et al
(6) | U133 Plus 2.0 | Paired tissues | 54000 | Homo
sapiens | 10 | 10 |
| GSE9809 | Liao et al
(7) | Mouse430_2 | Unpaired+paired
tissues | 45000 | Mus
musculus | 3 | 7 |
| GSE9012 | Khetchoumian et
al (8) | Mouse430_2 | Unpaired tissues | 45000 | Mus
musculus | 5 | 5 |
| GSE19004 | Viatour et
al (9) | Mouse430_2 | Unpaired
tissues | 45000 | Mus
musculus | 5 | 4 |
| GSE2127 | Sheth et al
(10) | moe430a | Paired tissues | 22000 | Mus
musculus | 9 | 6 |
Sample collection
Human liver tissue samples
All patients have provided written informed consent
to have their tissues stored and used for future research. The
ethics committee of The Affiliated Tumor Hospital of Guangxi
Medical University (Guangxi, China) approved this study. A total of
38 HCC tissue samples and corresponding paraneoplastic tissue
samples (>2 cm away from the edge of the tumor) were obtained
from patients (age, 24–70 years; mean age, 49.5±11.7) who underwent
surgical resection at the Affiliated Tumor Hospital of Guangxi
Medical University between January 2009 and December 2011. The
diagnosis of HCC in each patient was confirmed histopathologically.
Variables including tumor stage, presence of portal vein tumor
thrombosis, number and size of tumors, serum α-fetoprotein, tumor
differentiation and presence of extrahepatic metastases and
recurrence were evaluated in the patients with HCC. The tumor stage
was determined according to the Barcelona-Clinic Liver Cancer
staging classification (12).
Tumor differentiation was graded according to the Edmondson grading
system (12). Prior to surgical
resection, none of the patients with HCC received chemotherapy. In
addition, ten normal liver tissue samples surgically resected from
patients with benign liver lesions were also collected.
Rat and tree shrew liver tissue
samples
Animal experiments were conducted in accordance with
the guidelines for The Care and Use of Laboratory Animals issued by
the Ethics Committee of the Affiliated Tumor Hospital of Guangxi
Medical University. Rat and tree shrew animal models of HCC induced
by aflatoxin B1 (AFB1) have been previously established by our
group (13,14). A total of 42 female Wistar rats
(age, 4 weeks; weight, 180–210 g) were housed individually under
controlled light (12 h light/dark cycle) and temperature
conditions. Food and water were available ad libitum. The
rats were randomly divided into two groups: An AFB1 group
(n=28) and a control group (n=14). The rats in the
AFB1 group were intraperitoneally injected with AFB1 (100–200
µg/kg) 1–3 times/week. Liver biopsies were obtained from all
rats during the 14 th, 28 th, 42 nd and 55 th week, and all rats
were sacrificed on the 64 th week by cervical dislocation. A total
of 15 HCC tissue samples and 15 corresponding paraneoplastic
tissues samples were collected from the rats in the AFB1 group. A
total of 14 normal liver tissue samples were collected from the
rats in the control group. Adult tree shrews (n=27; age, 6
months; weight, 100–160 g) were obtained from the Kunming Institute
of Zoology, Chinese Science Academy (Yunnan, China), and were
allowed to acclimatize for one week to the facilities prior to the
experiment. The tree shrews were housed in individual, suspended,
stainless steel wire cages, under controlled environmental
conditions with a 12 h light/dark photoperiod. They had ad
libitum access to tap water and a natural diet containing rice
powder (20%), corn powder (20%), beef (20%), wheat bran (10%), soy
bean (10%), egg (10%), whole milk powder (5%), and a sugar, salt,
vitamin, mineral mix (5%). They were also fed daily with
reconstituted powdered milk and fruit. The shrews were randomly
divided into an AFB1 group (n=15; 9 males and 6 females) and
a control group (n=12; 6 males and 6 females), and as
previously reported (15), the
animals in the AFB1 group were fed AFB1 (400 mg/kg body weight/day
in a small amount of milk; Sigma-Aldrich, St. Louis, MO, USA) from
the 1 st to the 90 th week of the experiment, whereas the animals
in control group were raised without AFB1 administration. Liver
biopsies from each animal were obtained every three months under
Ketamine Hydrochloride anesthesia (50 mg/kg; Fujian Gutian
Pharmaceutical Co., Ltd., Fujian, China). In the present study, 10
HCC tissue samples and 10 corresponding paraneoplastic tissue
samples were obtained when the animals developed cancer (HCC
appeared at the 105 th week of experimentation) following sacrifice
by cervical dislocation. A total of 10 normal liver tissue samples
were collected from tree shrews in control group. After surgical
resection, all tissue samples were subjected to rapid freezing in
liquid nitrogen and then stored at −80°C. HCC samples were
confirmed histopathologically.
GSEA and meta-analysis
Bioconductor (16)
2.10.1 was used to standardize the data. The Robust Multi-array
Average (RMA) algorithm (17,18)
in the software package, Affy, was used for background correction,
standardization and Log2 conversion of raw data on the Affymetrix
platform. A t-test was performed to evaluate each probe in each
data set. Only genes that were included in the Kyoto Encyclopedia
of Genes and Genomes (KEGG) database (19) were subjected to GSEA. Genes with an
interquartile range (IQR) <0.5 were excluded. If one gene
corresponded to several probes, only the probe with the highest IQR
was used. GSEA was performed using the Category package in
Bioconductor. The gene sets represented by ≥10 genes were subjected
to further analyses, and genes in each pathway were subjected to a
t-test. After 1,000 permutations, the P-value of each pathway was
obtained. The upregulated and downregulated pathways in all five
data sets were compared. The cell cycle pathway was upregulated in
all five data sets. All genes in the cell cycle pathway were
subjected to meta-analysis in each data set. T-tests were conducted
using SAS9.13 software (Cary, NC, USA) to calculate the P-value of
each probe in the cell cycle pathway in each data set and the
χ2 value of each gene was calculated using the following
formula:
In which the degree of freedom is two times that of
the data set K). Genes with P<0.05 were obtained. Analyses on
these gene pathways were performed using the Database for
Annotation, Visualization and Integrated Discover (DAVID;
http://david.abcc.ncifcrf.gov/) in
KEGG.
Reverse transcription-quantitative
polymerase chain reaction (RT-qPCR)
Total RNA was extracted from tissue samples using
TRIzol reagent (Invitrogen; Thermo Fisher Scientific, Waltham, MA,
USA), and first-strand cDNA was synthesized by reverse
transcription from 1 µg RNA using a RevertAid First Strand
cDNA Synthesis kit (Thermo Fisher Scientific, Inc.). RT-qPCR was
performed using a standard protocol from the SYBR®
Premix Ex Taq kit (Takara, Dalian, China) on an Applied Biosystems
7300/7500 Real Time PCR system (Applied Biosystems, Grand Island,
NY, USA). The cycling conditions were as follows: 95°C for 30 sec,
and 40 cycles at 95°C for 5 sec followed by 60°C for 34 sec. The
relative mRNA expression levels of cdc25a to control GAPDH were
analyzed using ABI PRISM 7300 software v1.3.1 (Applied Biosystems)
and calculated with the double standard curves method. The cdc25a
forward and reverse primer sequences were
5′-CCAAAGGAACCATTGAGAAC-3′ and 5′-CAGATGCCATAATTTCTGGAG-3′,
respectively, and the product length was 138 bp. The forward and
reverse primer sequences for the internal control gene, 3-phosphate
dehydrogenase (GAPDH), were 5′-AAGAAGGTGGTGAAGCAGGC-3′ and
5′-ACCACCCTGTTGCTGTAGCC-3′, respectively, and the product length
was 200 bp.
Western blot analysis
Western blot analysis to assess cdc25a and GAPDH
expression was performed as previously described (14). Protein samples (60 µg) were
separated by 10% SDS-PAGE, prior to being transferred onto PVDF
membranes (EMD Millipore, Billerica, MA, USA). The membranes were
subsequently blocked with Tris-buffered saline with Tween 20 (TBST;
Beyotime Institute of Biotechnology, Haimen, China) containing 5%
(w/v) skimmed milk powder for c. 2 h at room temperature and then
incubated at 4°C overnight with the following primary antibodies:
Rabbit polyclonal anti-human Cdc25 (cat. no. ab75743; Abcam,
Cambridge, MA, USA) or mouse monoclonal anti-human glyceraldehyde
3-phosphate dehydrogenase (GAPDH; cat. no. TA-08; Beijing Zhongshan
Golden Bridge Biotech Co., Ltd., Beijing, China) at dilutions of
1:100 or 1:1000, respectively. The membranes were then washed three
times with TBST buffer, and incubated for 1 h at room temperature
with IRDye 680LT goat anti-mouse secondary antibody (cat. no.
0926-68020; LI COR Biosciences, Lincoln, NE, USA) or IRDye 680LT
goat anti-rabbit secondary antibody (cat. no. 926-68021; LI-COR
Biosciences) at 1:7,500 dilution. The membranes were scanned using
an Odyssey infrared imaging system (LI-COR Biosciences).
Quantification of bands was achieved by ratiometric analysis of the
fluorescent intensities of cdc25a and GAPDH using Odyssey
Application Software 3.0 (LI-COR Biosciences).
Statistical analysis
SPSS 13.0 (SPSS, Inc., Chicago, IL, USA) was used
for data analysis. Quantitative data are expressed as the mean ±
standard deviation. Comparison of mean values between multiple
groups was performed using a one-way analysis of variance.
P<0.05 was considered to indicate a statistically significant
difference.
Results
Results of GSEA analysis
GSEA was performed for functional gene enrichment of
the five data sets to search for key upregulated and downregulated
pathways affecting these data sets. In GSE19665, 27 upregulated and
71 downregulated pathways were enriched; in GSE9809, 56 upregulated
and 4 downregulated pathways were enriched; in GSE9012, 66
upregulated and 34 downregulated pathways were enriched; in
GSE19004, 73 upregulated and 51 downregulated pathways were
enriched; and in GSE2127, 69 upregulated and 50 down-regulated
pathways were enriched. There was a large amount of overlap between
pathways in the GSE19665 and GSE19004 data sets. Downregulated
pathways common to all five data sets included the linoleic acid
metabolic pathway and the arachidonic acid metabolic pathway.
Upregulated pathways common to all five data sets included the
amino sugar and nucleotide sugar metabolic pathways, the cell cycle
pathway and the thyroid cancer pathway.
Results of meta-analysis
A total of 220 positive genes were found in the
GSE19665 data set and 213 positive genes were found in the
remaining four data sets. After the P-value of each gene was
obtained, SAS13.0 software was used for meta-analysis. A total of
1,708 genes were found to have P<0.05 and 24 genes were found to
have P<10−4 (Table
II).
| Table IIDistribution of differentially
expressed genes revealed by meta-analyses of five data sets. |
Table II
Distribution of differentially
expressed genes revealed by meta-analyses of five data sets.
| Gene | P-value |
|---|
| ABI3BP | 3.23E-06 |
| CCNB1 | 5.37E-06 |
| NEK2 | 7.66E-06 |
| MKI67 | 1.35E-05 |
| cdc20 | 2.46E-05 |
| angptl6 | 2.47E-05 |
| rrm2 | 2.74E-05 |
| Ttc36 | 3.06E-05 |
| UBE2C | 3.18E-05 |
| mcm2 | 4.07E-05 |
| ASPM | 4.29E-05 |
| NCAPH | 5.23E-05 |
| TUBA1B | 5.23E-05 |
| CCNB2 | 5.45E-05 |
| Hist1h2ad | 5.71E-05 |
| TOP2A | 5.91E-05 |
| FOXM1 | 6.58E-05 |
| BIRC5 | 7.18E-05 |
| STMN1 | 7.74E-05 |
| racgap1 | 7.84E-05 |
| Hist1h2ag | 7.94E-05 |
| Hist1h2ah | 7.94E-05 |
| Hist1h2ai | 7.94E-05 |
| CDCA5 | 9.89E-05 |
The 1,708 genes were subjected to pathway enrichment
using the DAVID KEGG database. A total of 720 of these genes were
found in the KEGG database.
Overlapping results obtained with GSEA
and meta-analysis
The cell cycle pathway had the largest overlap
between the GSEA and meta-analysis. Gene probe numbers in the cell
cycle pathway of the five data sets were obtained using R
programming language. The probe numbers were sent to the website,
http://david.abcc.ncifcrf.gov/conversion.jsp, to
obtain the official names of the genes. There were 99
differentially expressed genes in the cell cycle pathway of data
set GSE19665, 96 in GSE9809, 90 in GSE9012, 106 in GSE19004 and 113
in GSE2127. Meta-analyses demonstrated that 25 genes involved in
the cell cycle pathway were differentially expressed (P<0.05).
The names, χ2 values and P-values of these genes are
shown in Table III.
| Table IIIDistribution of differentially
expressed genes in the cell cycle pathway. |
Table III
Distribution of differentially
expressed genes in the cell cycle pathway.
| Gene | χ2
value | P-value |
|---|
| CCNB2 | 46.94 | 9.67E-07 |
| mcm2 | 36.51 | 6.89E-05 |
| YWHAB | 35.63 | 9.74E-05 |
| CCNA2 | 33.83 | 2.00E-04 |
| CDKN2C | 32.60 | 3.00E-04 |
| Cdk1 | 32.24 | 4.00E-04 |
| MCM6 | 32.07 | 4.00E-04 |
| cdkn2b | 30.15 | 8.00E-04 |
| CCNB1 | 30.15 | 8.00E-04 |
| CDC25A | 29.98 | 9.00E-04 |
| Mad2l1 | 29.43 | 1.10E-03 |
| MCM7 | 28.57 | 1.50E-03 |
| CCNE1 | 28.21 | 1.70E-03 |
| MCM4 | 46.94 | 3.00E-03 |
| cdc20 | 36.51 | 6.50E-03 |
| smc3 | 35.63 | 6.70E-03 |
| pcnA | 33.83 | 7.90E-03 |
| RAD21 | 32.60 | 9.00E-03 |
| CDKN1A | 32.24 | 9.60E-03 |
| CCND1 | 32.07 | 1.08E-02 |
| SMAD3 | 30.15 | 1.16E-02 |
| TGFB1 | 30.15 | 1.27E-02 |
| YWHAZ | 29.98 | 2.06E-02 |
| YWHAG | 29.43 | 2.08E-02 |
| YWHAH | 28.57 | 2.52E-02 |
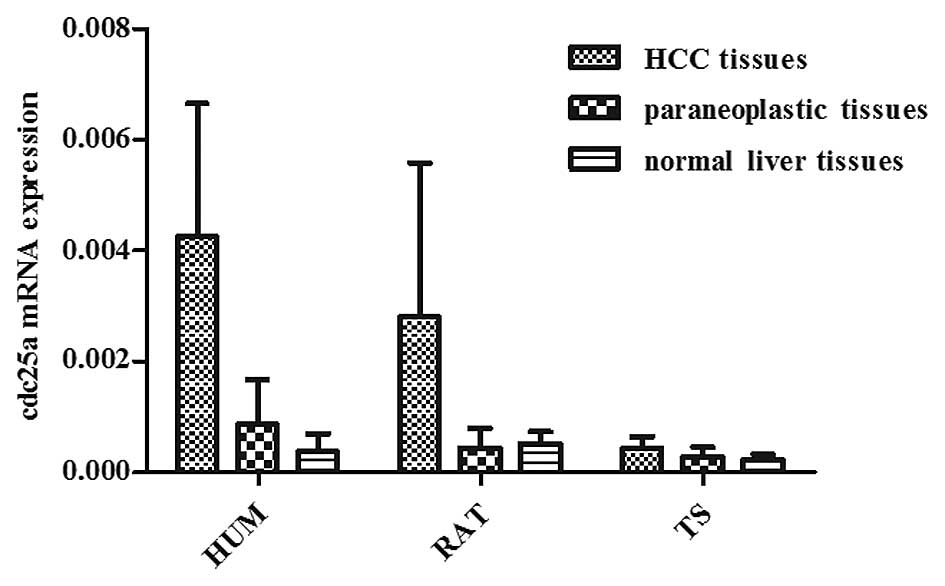
Cdc25a mRNA expression
The results of the present study identified 25
differential expression genes in the cell cycle signaling pathway,
as determined by GSEA and meta-analysis which analyzed five data
sets from human HCC tissue samples. Among the 25 candidate genes,
Cdc25a was also shown to be overexpressed in the HCC tissue samples
of diethylnitrosamine-induced rats and aflatoxin B1-induced tree
shrews (11,20). Therefore, Cdc25a mRNA expression
was further investigated. Results of real-time fluorescent PCR
showed that the cdc25a mRNA expression level in human HCC tissue
(0.00425±0.00241) was significantly higher than in the
corresponding paraneoplastic tissue (0.00086±0.00081) (P<0.05)
and in normal liver tissue (0.00038±0.00032) (P<0.05). There was
no significant difference between the paraneoplastic tissue and
normal liver tissue (P>0.05). The cdc25a mRNA expression level
in rat HCC tissue (0.00281±0.00278) was significantly higher than
that in the corresponding paraneoplastic tissue (0.00044±0.00035)
(P<0.05) and in normal liver tissue (0.00051±0.00022)
(P<0.05); however, there was no significant difference between
the paraneoplastic tissue and normal liver tissue (P>0.05). The
cdc25a mRNA expression level in tree shrew HCC tissue
(0.00043±0.00021) was significantly higher than that in normal
liver tissue (0.00022±0.00010) (P<0.05), however there was no
significant difference between the paraneoplastic tissue
(0.00028±0.00017) and corresponding HCC tissue or normal liver
tissue (P>0.05; Fig. 1).
The 38 HCC patients were grouped on the basis of
whether they had PVTT, extrahepatic metastasis, BCLC stage,
postoperative recurrence, tumor diameter, number of tumors, serum
AFP level and degree of tumor differentiation. The correlation
between cdc25a mRNA expression in the HCC tissues and the above
clinical parameters was examined. As demonstrated in Table IV, the detection rate of cdc25a
mRNA was observed to be significantly correlated with Barcelona
Clinic Liver Cancer (BCLC) stage, portal vein tumor thrombus (PVTT)
and extrahepatic metastasis, but not with postoperative recurrence,
tumor diameter, tumor number, serum α-fetoprotein (AFP) level or
degree of tumor differentiation.
| Table IVCorrelation between the detection
rate of cdc25a mRNA in human HCC tissues and clinical
parameters. |
Table IV
Correlation between the detection
rate of cdc25a mRNA in human HCC tissues and clinical
parameters.
| Clinical
parameter | n | Cdc25a mRNA
expression level | t-value | P-value |
|---|
| BCLC stage
(12) |
| 0, A | 26 |
0.00253±0.00175 | 2.342 | 0.023 |
| B, C | 12 |
0.00537±0.00221 | | |
| PVTT |
| Yes | 10 |
0.00564±0.00259 | 0.505 | 0.030 |
| No | 28 |
0.00376±0.00214 | | |
| Extrahepatic
metastasis |
| Yes | 11 |
0.00571±0.00254 | 0.139 | 0.014 |
| No | 27 |
0.00367±0.00208 | | |
| Recurrence |
| Yes | 20 |
0.00408±0.00250 | 0.071 | 0.632 |
| No | 18 |
0.00446±0.00229 | | |
| Tumor diameter
(cm) |
| ≥5 | 31 |
0.00436±0.00236 | 0.218 | 0.568 |
| <5 | 7 |
0.00378±0.00262 | | |
| Number of
tumors |
| 1 | 24 |
0.00375±0.00203 | 1.886 | 0.083 |
| ≥2 | 14 |
0.00513±0.00274 | | |
| Serum AFP
(µg/l) |
| ≥400 | 13 |
0.00521±0.00249 | 0.215 | 0.075 |
| <400 | 25 |
0.00376±0.00221 | | |
| Tumor
differentiation |
| Highly
differentiated | 21 |
0.00434±0.00217 | 1.602 | 0.825 |
| Poorly
differentiated and undifferentiated | 17 |
0.00416±0.00268 | | |
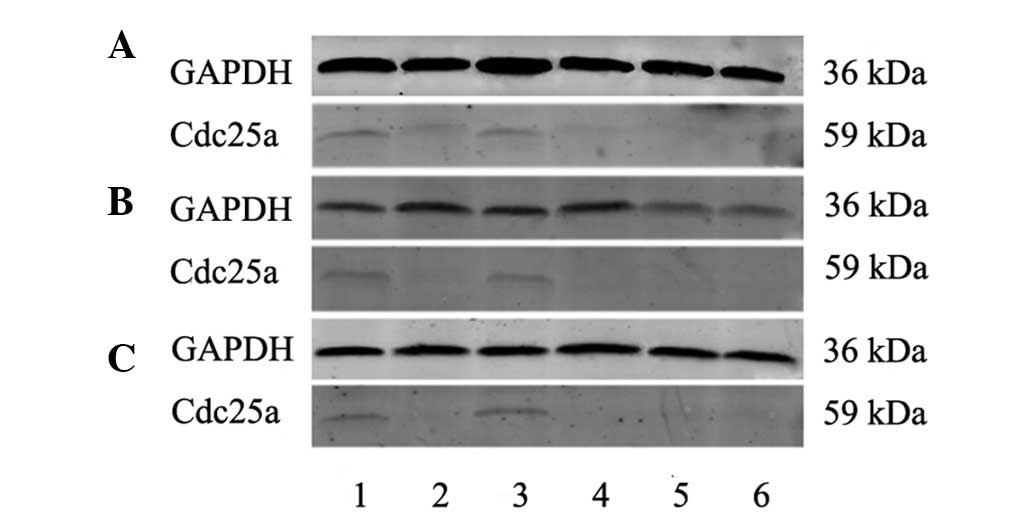
Cdc25a protein expression
Based on the results of fluorescent quantitative
PCR, 38 human HCC and corresponding paraneoplastic tissue samples,
10 normal human liver tissue samples, 15 rat HCC and corresponding
paraneoplastic tissue samples, 10 normal rat liver tissues, 10 tree
shrew HCC and corresponding paraneoplastic tissue samples, and 10
normal tree shrew liver tissue samples were collected for western
blot analysis. Specific cdc25a and GAPDH protein bands were
observed at 36 and 59 kDa of pre-stained proteins, respectively,
although the target protein, cdc25a, was not detected in normal
human liver tissue, or in the normal or paraneoplastic liver
tissues of rats or tree shrews. The mean relative cdc25a expression
level in human HCC tissues (0.339±0.239) was significantly higher
than in the corresponding paraneoplastic tissues (0.0609±0.0498;
P<0.05). In humans, rats and tree shrews, the cdc25a bands were
notably stronger in HCC tissues than in the corresponding
paraneoplastic and normal liver tissues, consistent with the high
cdc25a mRNA expression in HCC tissues (Fig. 2).
Discussion
Analyses on gene microarray data are an important
part of gene microarray research. A lot of useful information may
be missed due to potential problems with the samples when analyzing
the results of a single experiment. In addition, using a t-test to
target a single set of microarray data has certain limitations. The
small sample size may lead to an unreliable variance estimation,
resulting in a high false-positive rate, whereas differences in the
expression levels of different samples may be ignored (21). In GSEA, microarray data of samples
in two different biological states (e.g., normal vs. cancerous) are
analyzed to determine whether a set of genes show similar
expression trends between the two states, thereby identifying genes
or pathways associated with the disease (22).
In the present study, GSEA and meta-analysis were
combined to analyze five data sets, and the two results were
compared in order to identify HCC-related genes and pathways. DEGs
in >2 groups of samples were analyzed using GSEA and the
clustering was performed using differentially expressed genes. R
programming language was used to process the data and for
statistical analysis to obtain pathways that showed changes common
to all five data sets. DEGs were analyzed using the DAVID website
to determine the pathways in which these genes may be involved. The
cell cycle pathway statistically significant in the results
obtained with the GSEA and meta-analysis and was further analyzed
to identify genes with significant differential expression.
Among the 25 differentially expressed genes in the
cell cycle pathway that were identified, cyclin B2, cyclin B1,
cyclin D1, cdc25a and cdk1 are closely associated with HCC
occurrence and development (23–26).
Cyclin-dependent kinases (CDKs) are core proteins in the cell cycle
regulatory network. Changes in the expression activity of CDKs
directly affect the length of the cell cycle, determine the
progression of the cell cycle, and are closely associated with the
growth, differentiation, migration and apoptosis of normal cells,
as well as the occurrence, development and metastasis of tumors
(27). CDKs are important in the
regulation of hepatoma cell proliferation and apoptosis. Cyclin B
and cyclin D are members of the cyclin family and determine which
CDKs phosphorylate which substrates as well as when and where.
Studies have shown that (27)
Cyclin D1 is expressed in normal liver tissue, but its expression
is increased in HCC tissue, and is correlated with the histological
grade of HCC. This suggests that Cyclin D1 is involved in the
progression and development of HCC and may promote cell
proliferation, contributing to tumor formation. Cyclin B1 is in the
same family, is highly expressed in HCC tissue and is key in the
transition process of HCC cells. Cdc25A is a phosphatase with dual
specificity, and can activate CDKs, promoting the progression of
the cell cycle.
Studies have shown that cdc25a is associated with
breast cancer (28), non-small
cell lung cancer (29), colorectal
cancer (30), prostate cancer
(31) and other malignant tumors.
However, there are few studies regarding the correlation between
cdc25a and liver cancer. In a study by Xu et al (26), cdc25a expression was examined in
HCC tissues using RT-PCR, immunohistochemistry and western
blotting, and reported cdc25a expression detection rates of 69
(9/13), 56 (33/59) and 78% (46/59), respectively.
Immunohistochemistry tests showed that high cdc25a protein
expression was positively correlated with poor tumor
differentiation and PVTT. In the present study, fluorescent
quantitative PCR and western blotting showed that cdc25a expression
was high in human HCC tissues at the transcriptional and at the
translational levels. The cdc25a mRNA expression level in human HCC
tissues was found to be positively correlated with PVTT and
extrahepatic metastasis. This suggests that cdc25a is associated
with the progression of HCC, and may serve as an indicator to
evaluate the severity of the disease. The differences between the
results of the present study and those of Xu et al (26) may be due to differences in sample
sources, transcription and translation levels, and experimental
method.
In this study, overexpression of cdc25a was also
found in HCC samples from aflatoxin B1-induced rat and tree shrew
HCC models. Such consistent differential expression in different
species has also been reported in a previous study by our group
(11). The same cross-species
expression patterns suggest that cdc25a is key in the pathogenesis
and progression of HCC. Xu et al (32) explored the possibility of using
cdc25a as an antitumor target by inhibiting its activity in HCC
cell lines. It was reported that antisense oligonucleotides of
cdc25a inhibited 25–50% of cell growth within 48 h, resulting in
arrest at the G0–G1 phase and effectively suppressing the
proliferation of HCC cells. This suggests that cdc25a can serve as
a feasible target for anticancer treatment. In addition, a study by
Liu et al (33) showed that
knockdown of the ROCK2 gene could activate the reduced
ubiquitin-proteasome pathway, thereby promoting cdc25a
ubiquitination, which would ultimately lead to cdc25a degradation
and inhibition of HCC cell growth. Therefore, cdc25a may be a novel
target for anti-HCC treatment.
In conclusion, GSEA and meta-analysis can be
combined to identify key molecules and pathways involved in the
pathogenesis and progression of HCC. The cell cycle pathway and the
cdc25a gene may be the crucial in the pathogenesis and progression
of HCC.
Acknowledgments
The present study was supported by the National
Science Foundation of China (grant no. 30960428).
References
|
1
|
Waly Raphael S, Yangde Z and Yuxiang C:
Hepatocellular carcinoma: Focus on different aspects of management.
ISRN Oncol. 2012:4216732012.PubMed/NCBI
|
|
2
|
Beroukhim R, Mermel CH, Porter D, Wei G,
Raychaudhuri S, Donovan J, Barretina J, Boehm JS, Dobson J,
Urashima M, et al: The landscape of somatic copy-number alteration
across human cancers. Nature. 463:899–905. 2010. View Article : Google Scholar : PubMed/NCBI
|
|
3
|
Mattison J, Kool J, Uren AG, de Ridder J,
Wessels L, Jonkers J, Bignell GR, Butler A, Rust AG, Brosch M, et
al: Novel candidate cancer genes identified by a large-scale
cross-species comparative oncogenomics approach. Cancer Res.
70:883–895. 2010. View Article : Google Scholar : PubMed/NCBI
|
|
4
|
Mootha VK, Lindgren CM, Eriksson KF,
Subramanian A, Sihag S, Lehar J, Puigserver P, Carlsson E,
Ridderstråle M, Laurila E, et al: PGC-1alpha-responsive genes
involved in oxidative phosphorylation are coordinately
downregulated in human diabetes. Nat Genet. 34:267–273. 2003.
View Article : Google Scholar : PubMed/NCBI
|
|
5
|
Greenbaum D, Jansen R and Gerstein M:
Analysis of mRNA expression and protein abundance data: An approach
for the comparison of the enrichment of features in the cellular
population of proteins and transcripts. Bioinformatics. 18:585–596.
2002. View Article : Google Scholar : PubMed/NCBI
|
|
6
|
Deng YB, Nagae G, Midorikawa Y, Yagi K,
Tsutsumi S, Yamamoto S, Hasegawa K, Kokudo N, Aburatani H and
Kaneda A: Identification of genes preferentially methylated in
hepatitis C virus-related hepatocellular carcinoma. Cancer Sci.
101:1501–1510. 2010. View Article : Google Scholar : PubMed/NCBI
|
|
7
|
Liao YJ, Liu SP, Lee CM, Yen CH, Chuang
PC, Chen CY, Tsai TF, Huang SF, Lee YH and Chen YM:
Characterization of a glycine N-methyltransferase gene knockout
mouse model for hepatocellular carcinoma: Implications of the
gender disparity in liver cancer susceptibility. Int J Cancer.
124:816–826. 2009. View Article : Google Scholar
|
|
8
|
Khetchoumian K, Teletin M, Tisserand J,
Mark M, Herquel B, Ignat M, Zucman-Rossi J, Cammas F, Lerouge T,
Thibault C, et al: Loss of Trim24 (Tif1alpha) gene function confers
oncogenic activity to retinoic acid receptor alpha. Nat Genet.
39:1500–1506. 2007. View Article : Google Scholar : PubMed/NCBI
|
|
9
|
Viatour P and Sage J: Mouse HCC model.
http://www.ncbi.nlm.nih.gov/geo/query/acc.cgi?acc=GSE19004.
Accessed Jul 28, 2012.
|
|
10
|
Sheth SS, Bodnar JS, Ghazalpour A,
Thipphavong CK, Tsutsumi S, Tward AD, Demant P, Kodama T, Aburatani
H and Lusis AJ: Hepatocellular carcinoma in Txnip-deficient mice.
Oncogene. 25:3528–3536. 2006. View Article : Google Scholar : PubMed/NCBI
|
|
11
|
Li Y, Wan DF, Su JJ, Cao J, Ou C, Qiu XK,
Ban KC, Yang C, Qin LL, Luo D, et al: Differential expression of
genes during aflatoxin B(1)-induced hepatocarcinogenesis in tree
shrews. World J Gastroenterol. 10:497–504. 2004. View Article : Google Scholar : PubMed/NCBI
|
|
12
|
Sobin LH and Compton CC: TNM seventh
edition: what's new, what's changed: communication from the
International Union Against Cancer and the American Joint Committee
on Cancer. Cancer. 116:5336–5339. 2010. View Article : Google Scholar : PubMed/NCBI
|
|
13
|
Li Y, Qin X, Cui J, Dai Z, Kang X, Yue H,
Zhang Y, Su J, Cao J, Ou C, et al: Proteome analysis of aflatoxin
B1-induced hepatocarcinogenesis in tree shrew (Tupaia belangeri
chinensis) and functional identification of candidate protein
peroxiredoxin II. Proteomics. 8:1490–1501. 2008. View Article : Google Scholar : PubMed/NCBI
|
|
14
|
Hao YR, Yang F, Cao J, Ou C, Zhang JJ,
Yang C, Duan XX, Li Y and Su JJ: Ginkgo biloba extracts (EGb761)
inhibits aflatoxin B1-induced hepatocarcinogenesis in Wistar rats.
Zhong Yao Cai. 32:92–96. 2009.In Chinese. PubMed/NCBI
|
|
15
|
Li Y, Su JJ, Qin LL, Egner PA, Wang J,
Groopman JD, Kensler TW and Roebuck BD: Reduction of aflatoxin B1
adduct biomarkers by oltipraz in the tree shrew (Tupaia belangeri
chinensis). Cancer Lett. 154:79–83. 2000. View Article : Google Scholar : PubMed/NCBI
|
|
16
|
Gentleman RC, Carey VJ, Bates DM, Bolstad
B, Dettling M, Dudoit S, Ellis B, Gautier L, Ge Y, Gentry J, et al:
Bioconductor: Open software development for computational biology
and bioinformatics. Genome Biol. 5:R802004. View Article : Google Scholar : PubMed/NCBI
|
|
17
|
Irizarry RA, Hobbs B, Collin F,
Beazer-Barclay YD, Antonellis KJ, Scherf U and Speed TP:
Exploration, normalization, and summaries of high density
oligonucleotide array probe level data. Biostatistics. 4:249–264.
2003. View Article : Google Scholar : PubMed/NCBI
|
|
18
|
Gautier L, Cope L, Bolstad BM and Irizarry
RA: Affy-analysis of affymetrix GeneChip data at the probe level.
Bioinformatics. 20:307–315. 2004. View Article : Google Scholar : PubMed/NCBI
|
|
19
|
Kanehisa M and Goto S: KEGG: Kyoto
encyclopedia of genes and genomes. Nucleic Acids Res. 28:27–30.
2000. View Article : Google Scholar
|
|
20
|
Liang HJ, Wei W, Kang XN, Guo K, Cao J, Su
JJ, Yang C, Ou C, Li Y and Liu YK: Differentially expressed
proteins in the precancerous stage of rat hepatocarcinogenesis
induced by diethylnitrosamine. Chinese Journal of Hepatology.
17:669–674. 2009.In Chinese.
|
|
21
|
MacDonald JW and Ghosh D: COPA-cancer
outlier profile analysis. Bioinformatics. 22:2950–2951. 2006.
View Article : Google Scholar : PubMed/NCBI
|
|
22
|
Subramanian A, Kuehn H, Gould J, Tamayo P
and Mesirov JP: GSEA-P: A desktop application for gene set
enrichment analysis. Bioinformatics. 23:3251–3253. 2007. View Article : Google Scholar : PubMed/NCBI
|
|
23
|
Takashima S, Saito H, Takahashi N, Imai K,
Kudo S, Atari M, Saito Y, Motoyama S and Minamiya Y: Strong
expression of cyclin B2 mRNA correlates with a poor prognosis in
patients with non-small cell lung cancer. Tumour Biol.
35:4257–4265. 2014. View Article : Google Scholar : PubMed/NCBI
|
|
24
|
Gao SY, Li J, Qu XY, Zhu N and Ji YB:
Downregulation of Cdk1 and cyclinB1 expression contributes to
oridonin-induced cell cycle arrest at G2/M phase and growth
inhibition in SGC-7901 gastric cancer cells. Asian Pac J Cancer
Prev. 15:6437–6441. 2014. View Article : Google Scholar : PubMed/NCBI
|
|
25
|
Li T, Zhao X, Mo Z, Huang W, Yan H, Ling Z
and Ye Y: Formononetin promotes cell cycle arrest via
downregulation of Akt/Cyclin D1/CDK4 in human prostate cancer
cells. Cell Physiol Biochem. 34:1351–1358. 2014. View Article : Google Scholar : PubMed/NCBI
|
|
26
|
Xu X, Yamamoto H, Sakon M, Yasui M, Ngan
CY, Fukunaga H, Morita T, Ogawa M, Nagano H, Nakamori S, et al:
Overexpression of CDC25A phosphatase is associated with hypergrowth
activity and poor prognosis of human hepatocellular carcinomas.
Clin Cancer Res. 9:1764–1772. 2003.PubMed/NCBI
|
|
27
|
Liu L, Schwartz B, Tsubota Y, Raines E,
Kiyokawa H, Yonekawa K, Harlan JM and Schnapp LM: Cyclin-dependent
kinase inhibitors block leukocyte adhesion and migration. J
Immunol. 180:1808–1817. 2008. View Article : Google Scholar : PubMed/NCBI
|
|
28
|
Brunetto E, Ferrara AM, Rampoldi F,
Talarico A, Cin ED, Grassini G, Spagnuolo L, Sassi I, Ferro A,
Cuorvo LV, et al: CDC25A protein stability represents a previously
unrecognized target of HER2 signaling in human breast cancer:
Implication for a potential clinical relevance in trastuzumab
treatment. Neoplasia. 15:579–590. 2013. View Article : Google Scholar : PubMed/NCBI
|
|
29
|
Younis RH, Cao W, Lin R, Xia R, Liu Z,
Edelman MJ, Mei Y, Mao L and Ren H: CDC25A (Q110del): A novel cell
division cycle 25A isoform aberrantly expressed in non-small cell
lung cancer. PLoS One. 7:e464642012. View Article : Google Scholar
|
|
30
|
Huang MY, Wang JY, Chang HJ, Kuo CW, Tok
TS and Lin SR: CDC25A, VAV1, TP73, BRCA1 and ZAP70 gene
overexpression correlates with radiation response in colorectal
cancer. Oncol Rep. 25:1297–1306. 2011.PubMed/NCBI
|
|
31
|
Chiu YT, Han HY, Leung SC, Yuen HF, Chau
CW, Guo Z, Qiu Y, Chan KW, Wang X, Wong YC and Ling MT: CDC25A
functions as a novel Ar corepressor in prostate cancer cells. J Mol
Biol. 385:446–456. 2009. View Article : Google Scholar
|
|
32
|
Xu X, Yamamoto H, Liu G, Ito Y, Ngan CY,
Kondo M, Nagano H, Dono K, Sekimoto M and Monden M: CDC25A
inhibition suppresses the growth and invasion of human
hepatocellular carcinoma cells. Int J Mol Med. 21:145–152.
2008.PubMed/NCBI
|
|
33
|
Liu T, Yu X, Li G, Yuan R, Wang Q, Tang P,
Wu L, Liu X, Peng X and Shao J: Rock2 regulates Cdc25A through
ubiquitin proteasome system in hepatocellular carcinoma cells. Exp
Cell Res. 318:1994–2003. 2012. View Article : Google Scholar : PubMed/NCBI
|